July 2014 Volume 6. Figure 1: Main Staple Food Commodities Informally Traded Across Selected Borders in Eastern Africa Between January and June 2014
|
|
|
- Barbra Mason
- 6 years ago
- Views:
Transcription
 monitors informal crossborder trade of 88 food commodities and livestock in eastern Africa in order to quantify the impact on regional food security.")
, the Famine Early Warning Systems Network (FEWS NET), the Food and Agricultural Organization of the United Nations (FAO), the National Bank of")

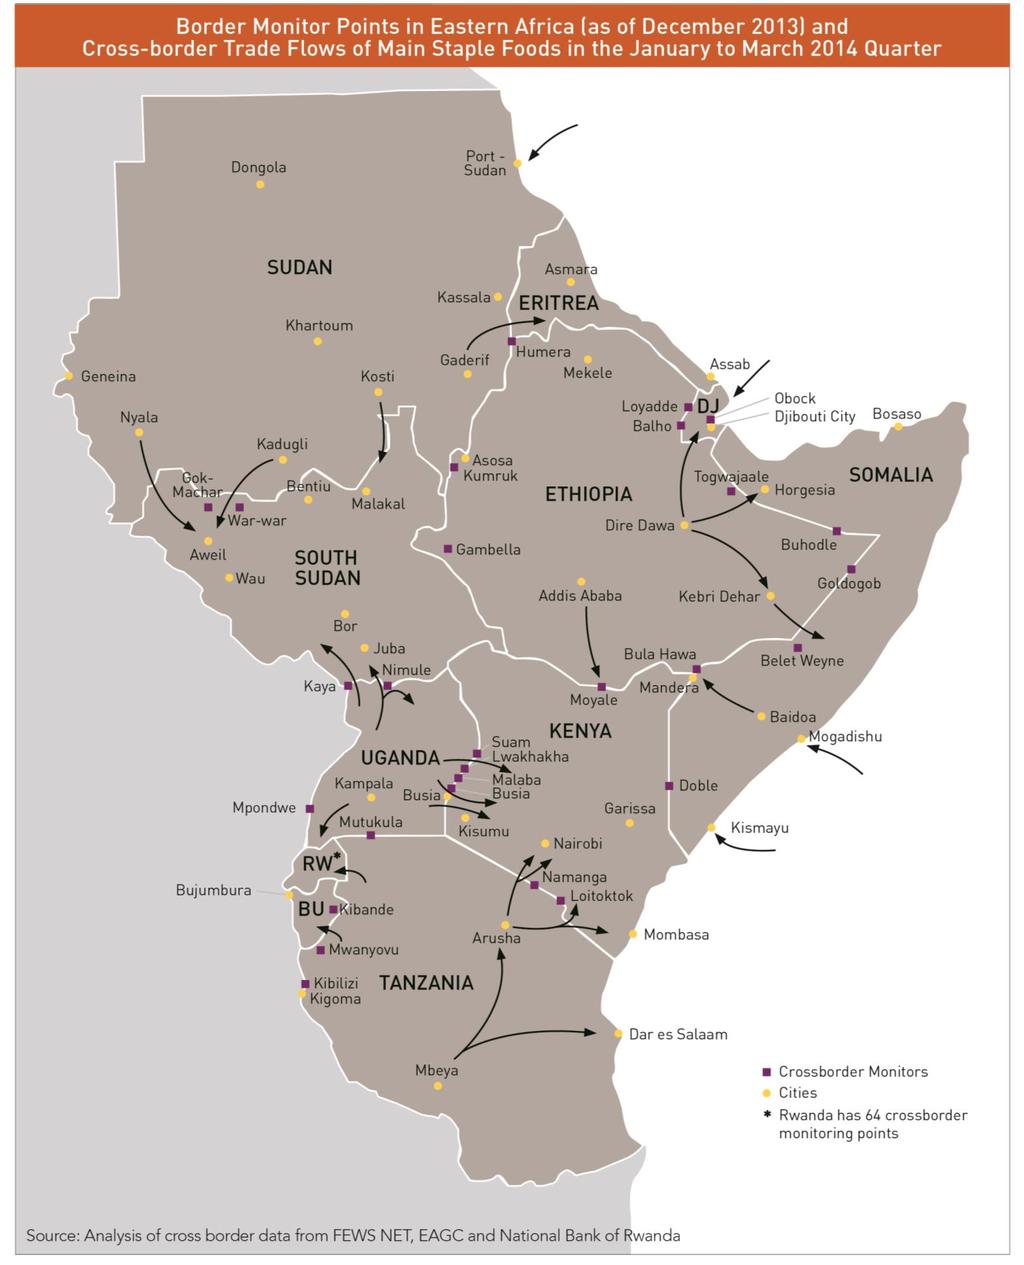
1 July 2014 Volume 6 Figure 1: Main Staple Food Commodities Informally Traded Across Selected Borders in Eastern Africa Between January and June 2014 The Market Analysis Sub-group of the Food Security and Nutrition Working Group (FSNWG) monitors informal crossborder trade of 88 food commodities and livestock in eastern Africa in order to quantify the impact on regional food security. This bulletin summarizes informal trade across selected borders of Tanzania, Burundi, Rwanda, Uganda, Kenya, Somalia, Djibouti, Ethiopia, Sudan, and South Sudan and DRC. Data is provided by the East Africa Grain Council (EAGC), the Famine Early Warning Systems Network (FEWS NET), the Food and Agricultural Organization of the United Nations (FAO), the National Bank of Rwanda (NBR) and the World Food Program (WFP). Informal trade represents commodity flows outside of the formal system, meaning that activity is not typically recorded in government statistics or inspected and taxed through official channels. These flows vary from very small quantities moved by bicycle to large volumes trucked over long distances. This report does not capture all informal crossborder trade in the region, just a representative sample. Source: FEWS NET, EAGC and NBR Maize was the most traded in the region between January and June 2014 (Figure 1). There was also significant cross-border trade of dry beans, wheat, and locally-produced rice. Sorghum trade was uncharacteristically low in the first half of 2014 reflecting belowaverage production in the main source areas of Sudan and resulting diminished inflow into one of the main markets in South Sudan. Staple food imports into South Sudan from the region continue to be affected by low demand due to displacement and diminished purchasing power as a result of the increased local civil conflict since December Maize and bean exports from Uganda and Tanzania to Kenya in the April-to-June 2014 quarter were 56 to 250 and above their respective recent three year average for the same quarter high due to the effects of below-average production in Kenya in Sorghum exports from Ethiopia to south-central Somalia increased seasonably but were further amplified by the effects of belowaverage January to February (Deyr) harvest in Somalia and resulting high prices. Exports to Eritrea increased seasonably. *Additional products may be covered in the annexes. 1

2 Source: FEWS NET, EAGC and NBR Source: FEWS NET, EAGC and NBR EAST AFRICA CROSSBORDER TRADE BULLETIN CURRENT MARKET CONTEXT Maize production in Kenya was below average in the two seasons of 2013 resulting in a deficit of about 200,000 MT in 2014 consumption year. To help fill the import gap (over 150,000 MT), the government of Kenya recently announced plans to import 200,000 MT of maize grain from Tanzania. The maize imports from Tanzania will be delivered in phases with 50,000 MT supplied in July at a cost of Kshs 2,650 per 90kg bag and delivered to Nairobi and Mombasa at a cost of Sh300 per bag. The June maize prices were Kshs 3,100 and 3,740 in the main urban reference markets (Figure 2). Fighting between Government and Opposition forces in South Sudan started on 15th December 2013 in Juba and quickly spread to Jonglei, Unity, and Upper Nile States. These events displaced thousands of people, destroying livelihoods and markets, and disrupting both domestic and regional trade (Figure 3). Several peace agreements were made in Addis Ababa, but serious questions remain about the immediate impacts in conflict- affected States in of the Greater Upper Nile region. While other States in the Greater Bahr El Ghazal and Equatoria remained calm during the civil strife, markets and trade outside of the conflict-affected areas Figure 3: Status of Selected Functioning Markets in South Sudan Figure 2: Maize Prices and Informal Cross border Trade in Selected Markets in Eastern Africa have been adversely affected indirectly through insecurity, disruption of domestic and cross border trade, and influx of internally displaced people. Staple food prices have been very high and volatile in conflictaffected areas, and while staple food prices have been abnormally stable outside of the conflict-affected zones. 2

3 MAIN CROSS BORDER TRADE IN JANUARY TO MARCH 2014 QUARTER Maize trade Informal maize grain exports from Uganda to South Sudan in the April-to-June 2014 quarter declined seasonably by as much as seven percent compared to the previous quarter, in the lead up to the June-to- August harvest. However, exports in the second quarter of 2014 were 88 percent lower than their respective three-year average levels. This reduction in exports was driven largely by the effects of reduced market demand in South Sudan caused by the displacement and diminished purchasing power in South Sudan resulting from the domestic civil conflict. In addition there was anxiety over insecurity that drastically reduced cargo traffic north of Juba to Bor, Rumbek, Bentiu, Wau, and Aweil. This included barges along the White Nile from Bor northwards. Maize exports from Uganda to Kenya reduced seasonably by 74 percent between the first and second quarters of 2014 due to imminent start of the July-to-September harvest in Kenya. Markets also corrected for the massive exports in the first quarter. Nevertheless the volume of maize exported in the second quarter was still 56 percent higher than the respective recent three-year average for the same period. This reflects high Kenyan demand following last season s below-average harvest, and increased supply in Uganda due to reduced exports to South Sudan (see above). To date, around 203,000 MT of maize have been exported to Kenya (MAS). Maize exports from Tanzania to Kenya also increased by 250 percent between the first and second quarters of 2014 and were atypically high when compared to the recent three-year average for the April to June quarter. To date, around 135,000 MT of maize have been exported from Tanzania to Kenya (MAS). This increased exports is attributable to surplus production during the previous May-to-August 2013 harvest in the southern region of Tanzania, expectations of an above-average May-to-August 2014 harvest, and resulting competitive prices. The exports were destined mostly for the southeastern and coastal markets of Kenya that typically source maize from Tanzania during the April-to-June long rains season when domestic supply is tight and prices are high (figure 2). Maize exports from Uganda to Rwanda decreased seasonably by 49 percent in the second quarter of 2014 due to start of the June-to-July harvest in Rwanda. However the decline was exacerbated by increased Rwandan imports from Tanzania, where there was surplus production in the previous May-to- August harvest resulting in increased supplies and competitive prices. Maize exports from Ethiopia to the northern frontier but thin markets in Kenya including Marsabit declined 3 seasonably by 48 percent between the first and the second quarters of 2014 as stocks in the source markets tightened with progression of the April-to-May and June-to-August lean seasons in February-to-June Belg rain areas and western agricultural areas respectively. However, maize exports from Ethiopia to South-Central Somalia increased by 64 percent attracted by increased prices attributed to below average January to February (Deyr) harvest in Somalia. Figure 4: Section of the Grain and Pulse Market in Mwanza, Tanzania Dry bean trade Bean exports from Rwanda to Uganda declined seasonably but uncharacteristically sharply by 39 percent between the first and second quarters of While the decline was seasonal due to ongoing June-to-July harvest in the destination markets of Uganda, the unusual steep fall in exports was brought about by expectations of a 30 to 50 percent below-average bean harvest in Rwanda during the March-to-May (Season B) resulting from rainfall shortages. Bean exports from Uganda to South Sudan declined seasonably by seven percent between the first and the second quarters of 2014 ahead of harvests in bimodal areas of South Sudan. Reduced exports were also exacerbated by the domestic civil strife in South Sudan that disrupted trade flow. Trade flows during the second quarter of 2014 were 91 percent lower than their respective three year average levels. Bean exports from Uganda to Kenya decreased seasonably by 45 percent between the first and second quarters of 2014 due to imminent start of the July-to- September harvest in Kenya. Tight supplies in Uganda following two previous consecutive seasons of belowaverage harvests contributed to this trend. However, bean exports to Kenya in the second quarter were still over 250 percent higher than their respective recent three year average levels because of high demand following last season s below average production in Kenya, and increased availability in Uganda due to reduced exports to South Sudan (see above). Bean exports from Tanzania to Kenya s southwestern and coastal areas increased seasonably by
4 88 percent between the first and second quarters and was heightened by high demand and attractive prices in the destination markets following a below average February-to- March harvest. Bean exports from Ethiopia to Sudan declined seasonably by 53 percent between the first and second quarters of 2014 as supplies tightened with progression of the June-to-September lean season in the source market. However, bean exports in the second quarter of 2014 were 227 percent higher when compared to recent three year average exports for the second quarter due to demand during the July Ramadan period in the destination market. Sorghum Trade Sorghum exports from Ethiopia to Eritrea and South-Central Somalia increased by 32 and 157 percent, respectively between the first and second quarters of 2014, due to increased seasonal demand and relatively higher prices in the destination markets attributed to below average January to February (Deyr) harvest in Somalia. Exports to Djibouti and South Sudan declined seasonably by 89 and 75 Rice trade Rice exports from Tanzania to Kenya, Uganda, Rwanda and Burundi increased seasonably by a modest seven percent between the first and second quarters of 2014 due to increased demand amidst diminishing supply of Tanzania s May-to-August surplus production which had been quite competitive resulting in exports being 10 times higher than the recent three year average exports for the second quarter. Rice exports to South Sudan from Uganda declined seasonably by six percent between the first and second quarters of 2014 due to imminent and start of harvest in the destination market. The decline in exports was also reinforced by low demand as a result of civil strife in South Sudan that resulted in 84 percent decrease when compared to the recent three year average exports for the second quarter. Figure 5: Retail Sorghum Prices and Informal Trade Volumes in Selected Markets in Eastern Africa percent between the first and second quarters of 2014, and were reinforced by increased in kind gifts during the Ramadan period (Djibouti), and domestic civil conflict (South Sudan). Sorghum exports from Uganda and Sudan to South Sudan increased by 148 and 84 percent between the first and second quarters of 2014 as cross-border trade continued to increase following some calmness in the domestic conflict especially in the non-conflict affected areas of South Sudan including Juba and Aweil markets. While exports from Sudan were positive, those from Uganda were still 89 lower than their recent three year average levels due to diminished demand and supply as a result of civil strife (Figure 5). 4

5 CROSS BORDER TRADE OUTLOOK APRIL TO JUNE 2014 QUARTER Sorghum exports from Uganda and Sudan to South Sudan will most likely be mixed due to spatial differences in the level of conflict in South Sudan. While exports from Sudan to northwestern non-conflict markets including Aweil are expected to increase seasonably, the volumes are anticipated to be low due to insecurity on both sides of the border and diminishing stocks in Sudan as result of below-average production in the previous season. Exports to northeastern South Sudan is expected to increase as calmness returns to many parts of Upper Nile and due to the proximity of those areas to surplus--producing eastern States of Sudan. Sorghum exports from Uganda are expected to increase seasonably but on low volumes due to reduced demand in South Sudan, destruction of supply chain, and risk aversion by traders exhibited by tight security stocks levels and increased trans-shipment from Juba to northern markets. Sorghum exports from Ethiopia to Djibouti and Eritrea is expected to increase seasonably with progression the lean seasons in the destination countries. Exports to southern Somalia is expected to decline seasonably as a result of increased supply in the destination market from local harvests from the just concluded April-June (Gu) season. Maize and dry bean trade is expected to seasonably pick up in the third quarter with increased supply in the main producing areas in Uganda and Tanzania. Exports to Kenya and Rwanda are expected to be relatively high due to expected deficit production in Kenya and Rwanda. As a result of the agreement between the governments of Tanzania and Kenya for formal exports of maize from Tanzania s National Food Reserve Agency (NFRA) to traders in Mombasa and Nairobi in Kenya, informal maize exports to Kenya are expected to a sell at a discount price to that of relatively high quality maize from NFRA. The combined volumes of both formal and informal exports to Kenya is expected to be relatively high in the third quarter of 2014.Increased in supplies of maize grain, dry beans and rice from both Uganda and or Tanzania are expected to moderate increases in prices in northeastern and eastern Rwanda; southwestern, southeastern and coastal regions of Kenya. The falling wholesale maize prices in Mbeya will likely squeeze the price differential in the main collection market of Mbeya and prices in adjacent markets of Malawi and Zambia, reducing incentives for and volumes of cross-border exports to Tanzania in the absence of trade inhibiting export bans in these countries. Rice exports from Tanzania are expected to increase seasonably as increased supply enter the market from the May-to-August harvest. In the previous January-to-March quarter, local rice exports from Tanzania to Rwanda, Uganda, and Kenya had declined seasonably (as a result of typical increased grain availability in the destination markets) by 43 percent in the first quarter of 2014 when compared to the previous October-December 2013 quarter. 5
6 6
January 2015 Volume 8
 January 2015 Volume 8 Figure 1: Main Staple Food Commodities Informally Traded Across Selected Borders in Eastern Africa in 2014. The Market Analysis Sub-group of the Food Security and Nutrition Working
January 2018 Volume 20
 January 2018 Volume 20 Figure 1: Main Staple Food Commodities Informally Traded Across Selected Borders in Eastern Africa in the fourth quarter of 2017. Source: FEWSNET and EAGC White maize grain was as
East Africa Crossborder Trade Bulletin April 2011
 East Africa Crossborder Trade Bulletin April 2011 The Market Analysis Sub-group of the Food Security and Nutrition Working Group (FSNWG) monitors cross-border trade of 88 food commodities and livestock
INFORMAL CROSS BORDER FOOD TRADE IN SOUTHERN AFRICA. Food Trade Bulletin
 VOLUME 1 ISSUE 2 INFORMAL CROSS BORDER FOOD TRADE IN SOUTHERN AFRICA Food Trade Bulletin April 2014 to March 2015 Inside This Issue 1 Highlights 2 Overview of trade in the 2014/15 marketing season 3 Trade
EAST AFRICA Price Bulletin November 2017
 KES/9 kg KES/9 kg November 217 The Famine Early Warning Systems Network (FEWS NET) monitors trends in staple food prices in countries vulnerable to food insecurity. For each FEWS NET country and region,
WHITE MAIZE: The markets below represent the major producer and consumer markets in countries where white maize is heavily consumed as the staple.
 KES/9 kg KES/9 kg November 211 The Famine Early Warning Systems Network (FEWS NET) monitors trends in staple food prices in countries vulnerable to food insecurity. For each FEWS NET country and region,
Informal Cross Border Food Trade in Southern Africa
 Monthly Highlights: April marks the start of the new agricultural marketing season for Southern Africa. Close to 1, MT of informal trade in maize, rice and beans was captured in April 7, representing a
Informal Cross Border Food Trade in Southern Africa
 Informal Cross Border Food Trade in Southern Africa Issue 6 November 6 Monthly Highlights: Overall informal trade in maize, rice and beans lower this season than past two seasons. Zambia s informal exports
in Southern Africa Figure 1: Recorded Informal Cross Border Maize Trade in DRC, Malawi, Mozambique, South Africa Tanzania, Zambia & Zimbabwe
 Monthly Highlights: Over 17, MT of informal cross border trade in maize, rice and beans captured in Southern Africa since the beginning of the current marketing season in April. Mozambique is the largest
4,000 3,000 2,000 1,000 2,500 2,000 1,500 1, ,000
 REGIONAL MAIZE SUPPLY AND MARKET OUTLOOK UPDATE Southern Africa December, 215 ABOUT THIS UPDATE This report provides a summary of changes to regional maize availability estimates and markets in Lesotho,
Informal Cross Border Food Trade in Southern Africa
 Monthly Highlights: The 12,3 MT, of informal cross border trade in maize, rice and beans captured in the 2/7 marketing season is below the volumes recorded in each of the past two seasons. Mozambique is
Informal Cross Border Food Trade in Southern Africa
 Monthly Highlights: Informal trade in maize and beans increased in uary compared to ember 27, while that of rice decreased. ly, maize traded from il to uary remained at almost the same level as last season,
Informal Cross Border Food Trade in Southern Africa
 Informal Cross Border Food Trade in Southern Africa Issue 78 August 212 Inside this issue: Summary and Overview Summary of Maize trade flows Summary of rice trade flows Summary of bean trade flows Annex
Informal Cross Border Food Trade in Southern Africa
 ay Informal Cross Border Food Trade in Southern Africa Issue tember 2 Inside this issue: Summary and Overview Summary of Maize trade flows Summary of rice trade flows Summary of bean trade flows Annex
Informal Cross Border Food Trade in Southern Africa
 Monthly Highlights: Observed informal cross border trade in maize, rice and beans continue to decline as demand for imports declines in Malawi and Zambia due to favorable harvests. Maize prices are lower
MONITORING INFORMAL CROSS- BORDER TRADE IN STAPLE FOODS IN SOUTHERN AFRICA
 MONITORING INFORMAL CROSS- BORDER TRADE IN STAPLE FOODS IN SOUTHERN AFRICA A collaborative activity between WFP and FEWS NET Presented at the FAO/University of Pretoria Workshop on Government and Private
Session 6: The 2017 ReNAPRI Outlook on Maize, Wheat, Rice, Soybeans and Sugar
 Session 6: The 217 ReNAPRI Outlook on Maize, Wheat, Rice, Soybeans and Sugar Session Moderator: Prof. Ferdi Meyer Presenters: Brian Chisanga and Tracy Davids ACKNOWLEDGEMENTS This study was made possible
Key Indicators for South Sudan
 Key Indicators for South Sudan National Bureau of Statistics Fast Facts Total Population of South Sudan is 8.26 million Total Area of South Sudan is 644,329 sq. km More than half (51%) of the population
ICPAC. IGAD Climate Prediction and Applications Centre Monthly Bulletin, February 2017
 IGAD CLIMATE PREDICTION AND APPLICATIONS CENTRE ICPAC Bulletin Issue March 2017 Issue Number: ICPAC/02/299 IGAD Climate Prediction and Applications Centre Monthly Bulletin, February 2017 For referencing
Southern African Development Community (SADC) Grain Trade What does the data say?
 Grain Trade What does the data say?") 15 October 2015 Southern African Development Community (SADC) Grain Trade What does the data say? Tinashe Kapuya (Agbiz Head: International Trade and Investment) and Wandile Sihlobo (Economist at Grain
15 October 2015 Southern African Development Community (SADC) Grain Trade What does the data say? Tinashe Kapuya (Agbiz Head: International Trade and Investment) and Wandile Sihlobo (Economist at Grain
Southern Africa Growing Season : Heading for a Record Drought?
 Southern Africa Growing Season 2015-2016: Heading for a Record Drought? HIGHLIGHTS The current growing season (October 2015 April 2016) in Southern Africa is developing under the peak phase of El Nino
EASTERN AFROMONTANE 1,043,191 km 2
 Egypt Saudi Arabia Oman EASTERN AFROMONTANE 1,043,191 km 2 Sudan Asmara Eritrea Yemen Djibouti Addis Ababa South Sudan Ethiopia BIODIVERSITY TARGET 2020 TARGET: 17% protected Democratic Republic of the
STATUS OF THE COMESA SEED HARMONISATION PROGRAMME (COMSHIP) John Mukuka, COMESA Seed Development Expert. June, 2018
 John Mukuka, COMESA Seed Development Expert. June, 2018") STATUS OF THE COMESA SEED HARMONISATION PROGRAMME (COMSHIP) John Mukuka, COMESA Seed Development Expert. June, 2018 COMESA COVERAGE Size: 11.6 Million sq. km Population: 510 million (2018) GDP: $950 billion
STATUS OF THE COMESA SEED HARMONISATION PROGRAMME (COMSHIP) John Mukuka, COMESA Seed Development Expert. June, 2018 COMESA COVERAGE Size: 11.6 Million sq. km Population: 510 million (2018) GDP: $950 billion
JICA s activity in the Northern Economic Corridor. 7 Dec 2015, Nairobi
 JICA s activity in the Northern Economic Corridor 7 Dec 2015, Nairobi Contents 1. Japan s commitment on corridor development 2. On-going support on corridor development 3. JICA s activity on Northern Economic
Ethiopia: Tourism Market Insights 2017
 Ethiopia: Tourism Market Insights 2017 About Ethiopia Ethiopia is Africa s second-most populous country and according to the IMF has overtaken Kenya to become the largest economy in east Africa. Real GDP
MOZAMBIQUE mvam Bulletin #5: December 2016
 Maize meal prices fall in Gaza Key points: Maize grain in Xai-Xai and maize meal in Marara remained expensive in December Prices dropped for rice, maize meal and cooking oil in Xai-Xai, and for maize meal
Chapter 1 Introduction
 Chapter 1 Introduction Nile Basin Water Resources Atlas / 13 14 / Nile Basin Water Resources Atlas Albert Nile just before Murchison Falls Photo: Vivek Bahukhandi The Nile Basin The Nile is the world s
OILS AND FATS IN EAST AFRICA REGION
 OILS AND FATS IN EAST AFRICA REGION ASSESSMENT, TRENDS & OPPORTUNITIES R. Vijayraghavan, CEO East Coast Oils & Fats Limited Tanzania East Africa Africa is the world's second-largest and second-most-populous
PROMOTING INNOVATION AND TRADE IN HORTICULTURE 25-27th NOVEMBER 2015, KIGALI,RWANDA
 PROMOTING INNOVATION AND TRADE IN HORTICULTURE 25-27th NOVEMBER 2015, KIGALI,RWANDA FACTS AND FIGURES Introduction The Common Market for Eastern and Southern Africa was formed in 1994 as it replaced the
1. CLIMATIC AND ENVIRONMENTAL CONDITIONS OVER AFRICA. 1.1 Inter-Tropical Discontinuity (ITD)
") African Centre of Meteorological Application for Development Centre Africain pour les Applications de la Météorologie au Développement DECEMBER 2011 HIGHLIGHT: Cholera, Yellow fever, Avian Influenza, typhoid
African Centre of Meteorological Application for Development Centre Africain pour les Applications de la Météorologie au Développement DECEMBER 2011 HIGHLIGHT: Cholera, Yellow fever, Avian Influenza, typhoid
Regional outlook Sub-Saharan Africa 24/11/2015. Share commodities in good exports. Share commodities in goods imports
 Table 1: Economic structure indicators Number of Inhabitants (m.) Size of the economy (in USD bn.) Size of the economy (% of world GDP) Share commodities in good exports Share commodities in goods imports
Learning from the 2002/03 Crisis in Southern Africa: Lessons for the Current Year
 Learning from the 2002/03 Crisis in Southern Africa: Lessons for the Current Year Pedro Arlindo, David Tschirley, Jan Nijhoff, Billy Mwiinga, Michael T. Weber, and T.S. Jayne Focus Southern Africa is likely
Structure. Introduction
 1 Introduction Structure Demographic Dynamics in Africa Determinants of the Demographic Transition Human Development Payoffs Jobs Payoffs Economic Growth in Africa Policies to Speed up the Demographic
Areas in which anti personnel mines are known or suspected to be implaced
 Algeria: Areas in which Anti personnel mines are known or suspected to be implaced. Mines areas inherited from the colonial period are located on Algeria s eastern with Tunisia and Western border with
MOZAMBIQUE mvam Bulletin #6: January 2017
 mvam Bulletin #6: January 2017 Maize meal and rice prices remain high in Tete province Key points: Maize meal and rice remained very expensive in Tete province in January Maize grain is available in all
MADAGASCAR: POST-FLOOD FOOD SECURITY AND CHOLERA PREVENTION
 MADAGASCAR: POST-FLOOD FOOD SECURITY AND CHOLERA PREVENTION appeal no: 13/98 3 April 1998 THIS APPEAL SEEKS CHF 258,000 IN CASH, KIND AND SERVICES TO ASSIST 20,000 BENEFICIARIES FOR 3 MONTHS Summary Torrential
Chapters 14 and 15 Geography Study Guide
 Chapters 14 and 15 Geography Study Guide Multiple Choice Identify the letter of the choice that best completes the statement or answers the question. 1. Gorillas live within dense rain forests of. a. Rwanda
1 What is the African Economic Outlook Project? 2 African Economic Performance: Multifaceted Growth. 3 Africa and Globalization
 African Economic Outlook 2007 Measuring the Pulse of Africa Nicolas Pinaud, OECD Development Centre 经合组织 发展中心 Standard Chartered & the OECD Development Centre AFRICA AND CHINA: ECONOMIC AND BUSINESS PERSPECTIVES
USDBC MEXICO MONTHLY REPORT MAY 2017 NEW! FIRST 2017 MX BEAN PLANTING 2017 SPRING SUMMER CYCLE PROGRESS REPORT
 USDBC MEXICO MONTHLY REPORT MAY 2017 NEW! FIRST 2017 MX BEAN PLANTING 2017 SPRING SUMMER CYCLE PROGRESS REPORT 2017 Spring-Summer beans Irrigated beans, 5 to 10% of the total depending on the state: All
Data Limitations. Index Choices
 Section 3. Annexes The Index is part of a central database and system for collecting data on regional integration. It will capture additional data for indicators that are not part of the Index but that
TOURISM BUSINESS COUNCIL OF SOUTH AFRICA TRENDS AND INDICATORS REPORT. March 2018
 TOURISM BUSINESS COUNCIL OF SOUTH AFRICA TRENDS AND INDICATORS REPORT March 2018 Compiled by: Ms. Tebogo Umanah General Manager: Policy Analysis and Strategic Projects March 2018 Page 1 CONTENTS INTRODUCTION...
CLIMATE DIAGNOSTIC BULLETIN FOR AFRICA
 CLIMATE DIAGNOSTIC BULLETIN FOR AFRICA N 02 FEBRUARY, 2019 OCEAN-ATMOSPHERE MONITORING & PREDICTION 1 SUMMARY FEBRUARY 2019 The precipitation for the month of February, 2019 was above to well above average
Mauritius Freeport Authority
 Mauritius Freeport Authority COMESA Common Market for Eastern and Southern Africa 2003 (Common Market for Eastern and Southern Africa) COMESA LIST OF 21 COMESA MEMBER COUNTRIES Angola D. R. of Congo Eritrea
Table of CONTENTS. COUNTRY FOCUS: United Republic of Tanzania
 Africa Statistics Flash Selected Socio-Economic Indicators on Africa December 216 Table of CONTENTS COUNTRY FOCUS: United Republic of Tanzania ------------------------------------------------------------
Poverty eradication means doubling the lowest household incomes globally in just 15 years after they have stagnated for the last years
 $ per person per day (2005 PPP) 1.4 Estimated Global Consumption Floor, 1981-2011, and 2030 Target 1.2 1 0.8 0.6 0.4 0.2 Pre- MDGs MDGs SDGs $1.25-a-day basis $1.00-a-day basis Poverty eradication means
Strategic Location DJIBOUTI
 Strategic Location DJIBOUTI Infrastructures & Investments in Ports, Free Zones and Maritime related Business Activities Aboubaker Omar Hadi Chairman of Djibouti Ports and Free Zones Authority 1. Djibouti
Enhancing the Recent Growth of Cross-Border Trade between South Sudan and Uganda
 Public Disclosure Authorized Public Disclosure Authorized Public Disclosure Authorized Public Disclosure Authorized Enhancing the Recent Growth of Cross-Border Trade between South Sudan and Uganda Yutaka
Mode of Transport, Country of Consignment and Customs Procedure Codes (CPC) Implementation in COMESA Member States
 Implementation in COMESA Member States") Mode of Transport, Country of Consignment and Customs Procedure Codes (CPC) Implementation in COMESA Member States Regional Seminar on international Trade Statistics 12 th 16 th May 2014 Addis Ababa -
Mode of Transport, Country of Consignment and Customs Procedure Codes (CPC) Implementation in COMESA Member States Regional Seminar on international Trade Statistics 12 th 16 th May 2014 Addis Ababa -
Accelerating Economic Growth in Africa
 Accelerating Economic Growth in Africa Japan International Cooperation Agency Africa Department Director General Kazunori Oshiyama Strategies for Accelerating Economic Growth Major Corridors and Japan
1.0 Introduction Zambia s Major Trading Partners Zambia s Major Export Markets... 4
 Bank of Zambia CONTENTS 1.0 Introduction... 3 2.0 Zambia s Major Trading Partners... 3 3.0 Zambia s Major Export Markets... 4 4.0 Major Source Countries Of Zambia s Imports... 5 5.0 Direction Of Trade
1.0 Introduction Zambia s Major Trading Partners Zambia s Major Export Markets... 4
 Bank of Zambia CONTENTS 1.0 Introduction... 3 2.0 Zambia s Major Trading Partners... 3 3.0 Zambia s Major Export Markets... 4 4.0 Major Source Countries Of Zambia s Imports... 5 5.0 Direction Of Trade
Regional Investment rules in Eastern and Southern Africa
 Regional Investment rules in Eastern and Southern Africa : COMESA Common Investment Area (CCIA) towards the Tripartite COMESA-EAC-SADC and Pan African investment arrangements London, 14 September 2012
FAMILY PLANNING TRENDS IN SUB SAHARAN AFRICA:
 FAMILY PLANNING TRENDS IN SUB SAHARAN AFRICA: PROGRESS, PROSPECTS AND LESSONS LEARNED Mona Sharan, Saifuddin Ahmed, John May & Agnes Soucat Background : Sub Saharan Africa Highest TFR (5.1) compared to
MOZAMBIQUE mvam Bulletin #8: March 2017
 Maize grain prices have fallen throughout the country Key points: In March, maize grain prices fell almost everywhere in anticipation of the green harvest Maize meal prices in most districts are below
Ten Day Climate Watch Bulletin N 27 Dekad 21 st to 30 th September, 2014
 African Centre of Meteorological Application for Development Centre Africain pour les Applications de la Météorologie au Développement Ten Day Climate Watch Bulletin N 27 Dekad 21 st to 30 th September,
COMSHIP: ENHANCING CROSS BOARDER SEED TRADE
 COMSHIP: ENHANCING CROSS BOARDER SEED TRADE John Mukuka, PhD AFSTA CONGRESS, 2017, DAKAR, SENEGAL THE PROBLEM COMESA 2015 IMPORT OF STAPLE SEED (WITHOUT CASSAVA AND BEANS) Intra-COMESA Imports of Seed
TABLE OF CONTENTS COUNTRY FOCUS: ALGERIA
 Africa Statistics Flash Selected Socio-Economic Indicators on Africa May 218 TABLE OF CONTENTS COUNTRY FOCUS: ALGERIA ---------------------------------------------------------------------------------------------
CONTENTS Executive Summary... iii 1. Introduction Major Destinations for Zambia s Exports Major Source Countries for Zambia s
 Bank of Zambia CONTENTS Executive Summary... iii 1. Introduction... 1 2. Major Destinations for Zambia s Exports... 1 3. Major Source Countries for Zambia s Imports... 4 4. Conclusion... 6 ii Executive
TABLE OF CONTENTS COUNTRY FOCUS: BENIN
 Africa Statistics Flash Selected Socio-Economic Indicators on Africa March 218 TABLE OF CONTENTS COUNTRY FOCUS: BENIN ------------------------------------------------------------------------------------------------
1.0 Introduction Zambia s Major Trading Partners Zambia s Major Export Markets... 4
 Bank of Zambia CONTENTS 1.0 Introduction... 3 2.0 Zambia s Major Trading Partners... 3 3.0 Zambia s Major Export Markets... 4 4.0 Major Source Countries Of Zambia s Imports... 5 5.0 Direction Of Trade
Module 1 Educator s Guide: Representative Discussion Points Investigation 3
 Module 1 Educator s Guide: Representative Discussion Points Investigation 3 Ethiopia and Eritrea Our combined population is 59,578,171 people. We have just emerged from a long period of civil war and famine.
INFRASTRUCTURE DEVELOPMENT IN TANZANIA
 INFRASTRUCTURE DEVELOPMENT IN TANZANIA PROF JOSEPH MSAMBICHAKA MBEYA UNIVERSITY OF SCIENCE AND TECHNOLOGY 50 TH YEARS ERB ANNIVERSARY 5 TH TO 7 TH SEPTEMBER 2018 PRESENTATION LAYOUT 1. DEFINITION OF INFRASTRUCTURE
Population (million) % of Africa
 % of Africa") FAO. Irrigation in in figures: AQUASTAT Survey 2005 TABLE 1 al distribution of cultivable and cultivated areas Cultivable areas Cultivated areas in 2002 In cultivable areas (ha) (ha) (%) Northern 65 320
FAO. Irrigation in in figures: AQUASTAT Survey 2005 TABLE 1 al distribution of cultivable and cultivated areas Cultivable areas Cultivated areas in 2002 In cultivable areas (ha) (ha) (%) Northern 65 320
Table of CONTENTS. COUNTRY FOCUS: Equatorial Guinea
 Africa Statistics Flash Selected Socio-Economic Indicators on Africa August 217 Table of CONTENTS COUNTRY FOCUS: Equatorial Guinea ---------------------------------------------------------------------------
Energy Poverty in Africa
 African Energy Commission (AFREC) Paper on Energy Poverty in Africa By Dr. Gilbert NZOBADILA Consultant Energy Policy- AFREC 1 1- Introduction: African background : The African Energy Commission (AFREC)
Trade Blocs, Development Hotspots and Changing Trade Patterns. Breakbulk Africa, 18 th February 2015
 Trade Blocs, Development Hotspots and Changing Trade Patterns Breakbulk Africa, 18 th February 2015 Background Multiplicity of Trade Blocs in ever convergent economic spaces; Need for harmonisation of
Mozambique Food Security Outlook April to September 2009
 Mozambique Food Security Outlook April to September 2009 InMarch,moderatefoodinsecuritywasfoundin most of southern Tete and parts of Manica, Zambézia,andcoastalNampulaprovinces(Figure 1). Aside from these
A Snapshot of Sanitation and Open Defecation in Africa 2010 Update
 A Snapshot of Sanitation and Open Defecation in 10 Update A regional perspective based on data from the WHO/UNICEF Joint Monitoring Programme for Water Supply and Sanitation UNICEF/NYHQ10-1999/Asselin
The Second Japan-Africa Business Forum TICAD and Business: Feedback from the Yokohama Action Plan to the Nairobi Declaration July 25, 2017
 The Second Japan-Africa Business Forum TICAD and Business: Feedback from the Yokohama Action Plan to the Nairobi Declaration July 25, 207 Takeshi Osuga Ambassador, Assistant Minister, Director-General
Table A.LPG1 : TOTAL LPG CONSUMPTION (Best available Estimates)
") Table A.LPG1 : TOTAL LPG CONSUMPTION (Best available Estimates) 1000 MT 1 Burkina Faso 0.509 0.587 0.615 0.606 0.435 0.429 0.691 1.057 1.385 1.698 2.156 2.432 2.888 2 Cape Verde 4.058 4.268 4.988 5.259
Table A.LPG1 : TOTAL LPG CONSUMPTION (Best available Estimates) 1000 MT 1 Burkina Faso 0.509 0.587 0.615 0.606 0.435 0.429 0.691 1.057 1.385 1.698 2.156 2.432 2.888 2 Cape Verde 4.058 4.268 4.988 5.259
Projected Rural Population % (2030) and Rural Population Growth % pa ( )
 and Rural Population Growth % pa ( )") This presentation This presentation Rural Population Growth, 2013-30 (% pa) 4 3 2 Projected Rural Population % (2030) and Rural Population Growth % pa (2013-30) Majority urban; Rural population increasing
This presentation This presentation Rural Population Growth, 2013-30 (% pa) 4 3 2 Projected Rural Population % (2030) and Rural Population Growth % pa (2013-30) Majority urban; Rural population increasing
Framework for Progressive Destination Competitiveness
 Sub-Saharan Africa Framework for Progressive Destination Competitiveness SSA Countries by Tourism Development Level and World Bank Income Ranking Tourism development level Pre-emerging Low income Central
SS7G1 The student will locate selected features of Africa.
 Standards SS7G1 The student will locate selected features of Africa. a. Locate on a world and regional political-physical map: the Sahara, Sahel, savanna, tropical rain forest, Congo River, Niger River,
KEY TRENDS IN TOURISM IN AFRICA 41ST ANNUAL WORLD TOURISM CONFERENCE, KIGALI, RWANDA CHRISTY TAWII, RESEARCH ANALYST
 KEY TRENDS IN TOURISM IN AFRICA 41ST ANNUAL WORLD TOURISM CONFERENCE, KIGALI, RWANDA CHRISTY TAWII, RESEARCH ANALYST ABOUT EUROMONITOR INTERNATIONAL GLOBAL OVERVIEW AFRICA S PERFORMANCE REVIEW TOURISM
3rd International Forum on sustainable Tourism 20th to 22nd October 2008 Bamako - Mali
 TANZANIA S POLICY ON TOURISM DEVELOPMENT 3rd International Forum on sustainable Tourism 20th to 22nd October 2008 Bamako - Mali Ministry of Natural Resources and Tourism - Tanzania 1 Tanzania basic facts
TOURISM BUSINESS COUNCIL OF SOUTH AFRICA TRENDS AND INDICATORS REPORT. May 2018
 TOURISM BUSINESS COUNCIL OF SOUTH AFRICA TRENDS AND INDICATORS REPORT May 2018 Compiled by: Ms. Tebogo Umanah General Manager: Policy Analysis and Strategic Projects May 2018 Page 1 CONTENTS INTRODUCTION...
Stats Newsletter August 2017
 Stats Newsletter August 07 Introduction This newsletter focuses on international trends and their application to Namibia. It high lights the transition of voice traffic carried via regular voice channels
Welcome to AVI AFRIQUE 2017
 Welcome to AVI AFRIQUE 2017 Single African sky and Functional Airspace Blocks: Improving Air Traffic Management The global ATM operational concept is fundamental framework drive ATM operational requirements,
The political economy of resource discoveries. Prof. Michael L. Ross UCLA Department of Political Science September 21, 2011
 The political economy of resource discoveries Prof. Michael L. Ross UCLA Department of Political Science September 21, 2011 Overview 1. Oil and mineral production is spreading to more low-income countries;
Improving Access to Fertilizers
 Improving Access to Fertilizers by Amit Roy IFDC Presented at the International Workshop on Strengthening and Widening Markets and Overcoming Supply Side Constraints for African Agriculture June 3-5, 2007
Fostering healthcare Investments through PPPs. George Uduku Health Systems November 2017
 Fostering healthcare Investments through PPPs George Uduku November 2017 Healthcare Industry : Infrastructure 1/2 There is a wide gap in healthcare infrastructure and a major shortage of healthcare workers
Millennium Development Goal 1: eradicate extreme poverty and hunger. International poverty line a Share of population below PPP $1.
 3.1 Millennium Development Goal 1: eradicate extreme poverty and hunger International poverty line a Share of population below PPP $1.25 a day Poverty gap ratio at PPP $1.25 a day Share of population below
Africa the potential for growth
 Africa the potential for growth Ian Taylor President & CEO, Vitol March 2015 The oil price a long term view 2010 to date - $94 2000s - $49.6 1980s - $25.8 1990s - $18.3 1970s $10.5 1 Q1-14 Q2-14 Q3-14
Market Brief on Rwanda July 2017
 Market Brief on Rwanda July 2017 Location Facts and Figures Total Population 11.6 million (2016) Area 26,388 km 2 Time Zone UTC+2:00 Capital City Kigali Rwanda is a landlocked Central/East African country
Africa s s Economic Prospect and Challenges
 Africa s s Economic Prospect and Challenges Louis Kasekende Chief Economist, African Development Bank and Sudhir Shetty Sector Director, Poverty Reduction & Economic Management, Africa Region The World
APC TV White Spaces and Africa. Russell Southwood, CEO, Balancing Act
 APC TV White Spaces and Africa Russell Southwood, CEO, Balancing Act www.balancingact-africa.com @BalancingActAfr Overall Impact of the Transition Better use of frequencies currently used for analogue.
Market access for Small-Scale Artisanal Fishers: Bilateral and Regional Developments in COMESA. Mr. Lawrence OTHIENO Trade Expert, COMESA Secretariat
 Market access for Small-Scale Artisanal Fishers: Bilateral and Regional Developments in COMESA Mr. Lawrence OTHIENO Trade Expert, COMESA Secretariat Outline of the Presentation Background of COMESA Market
African Economic Outlook 2018
 African Development Bank Group African Economic Outlook 2018 Download the full report at: https://www.afdb.org/en/knowledge/publications/africaneconomicoutlook/ Africa Business Forum Johannesburg, South
Growing Prosperity through Trade
 Growing Prosperity through Trade Trade & Development Forum Kampala, 28 th February 2018 High Business Costs in 2010 Cost $ Transport Cost Components 14000 Costs for an average Bujumbura bound container
Chapter 13 and 14 Geography Study Guide
 Chapter 13 and 14 Geography Study Guide Multiple Choice Identify the letter of the choice that best completes the statement or answers the question. 1. Which West African country has the largest population
Table of CONTENTS. COUNTRY FOCUS: Tunisia
 Africa Statistics Flash Selected Socio-Economic Indicators on Africa October 217 Table of CONTENTS COUNTRY FOCUS: Tunisia ----------------------------------------------------------------------------------------------
SADC SELECTED ECONOMIC AND SOCIAL INDICATORS, 2016
 SADC SELECTED ECONOMIC AND SOCIAL INDICATORS, 2016 1. INTRODUCTION This report is an attempt to provide data series and a brief trend analysis of the major socio-economic characteristics of SADC region
Bridging the Gap: Benchmarking Utilities in Africa
 Bridging the Gap: Benchmarking Utilities in Africa Rosemary Rop World Water Week Stockholm, Focus Africa: August 23 rd 2011 Water and Sanitation Program Global Status: Water and Sanitation Access Gaps
Ibrahim Index of African Governance SUB-CATEGORY INSIGHTS RULE OF LAW MO IBRAHIM FOUNDATION
 2015 Ibrahim Index of African Governance SUB-CATEGORY INSIGHTS RULE OF LAW MO IBRAHIM FOUNDATION Contents Rule of Law within the IIAG Rule of Law Key Findings Rule of Law Spotlight > Country and group
THE TWENTY FIRST ANNUAL SOUTHERN AFRICA REGIONAL CLIMATE OUTLOOK FORUM MID-SEASON REVIEW AND UPDATE
 STATEMENT FROM THE TWENTY FIRST ANNUAL SOUTHERN AFRICA REGIONAL CLIMATE OUTLOOK FORUM (SARCOF-21) MID-SEASON REVIEW AND UPDATE, SADC HEADQUARTERS, GABORONE, BOTSWANA, 5 8 DECEMBER 2017. SUMMARY The bulk
CONTENTS Executive Summary... iii 1. Introduction Major Destinations for Zambia s Exports Major Source Countries for Zambia s
 Bank of Zambia CONTENTS Executive Summary... iii 1. Introduction... 1 2. Major Destinations for Zambia s Exports... 1 3. Major Source Countries for Zambia s Imports... 3 4. Conclusion... 6 ii Executive
ATM Deficiencies. Algeria AFI/7 Rec.5/21 FIR Algiers Non-implementation. Angola. Benin. Botswana. Burkina Faso. Burundi. Cameroon
 ATM Deficiencies Algeria AFI/7 Rec.5/21 FIR Algiers Non- of ATC in the upper airspace in the South area (prevision of in 2006). A 31/12/09 U Angola APIRG/13 Conclusion 13/43 Luanda FIR Non-provision of
Annual bulletin 2014
 Annual bulletin 2014 1 --------------------------Temperature----------------------- January 2014 In January 2014 it was warmer than normal nearly over the complete region with exception of the northern
COMESA EXPERIENCES ON STI
 COMESA EXPERIENCES ON STI Presentation at the EASTECO First Regional Stakeholder Meeting By Benedict Musengele Senior Research Fellow, COMESA Kigali, Rwanda www.comesa.int 2 Outline Introduction COMESA
ICAO/AFCAC Regional Symposium on Airport & Air Navigation Services Infrastructure Financing Maputo, Mozambique
 ICAO/AFCAC Regional Symposium on Airport & Air Navigation Services Infrastructure Financing Maputo, Mozambique 29 Nov 1 Dec 2010 Session 3: International Cooperation COMESA-EAC- SADC Tripartite Experience