TOURISM PERFORMANCE HIGHLIGHTS QUARTER
|
|
|
- Gertrude Jackson
- 6 years ago
- Views:
Transcription

1 TOURISM PERFORMANCE HIGHLIGHTS QUARTER
2 Foreword As the tourism marketing arm of the South African Government, South African Tourism has developed an integrated marketing strategy that focuses on leisure and business events. Part of our business is to monitor and evaluate the performance of the tourism sector. This consolidated report, prepared by our Strategy, Insights & Analytics Unit, provides a review of the performance of the tourism sector in 2017 against the South African Tourism mandate. This report only provides a summary of tourism s performance, and must be read in conjunction with the detailed tables at the end of the report that inform these insights. This report is based on systems and methodologies that have been applied since In 2002, South African Tourism extended its summer and winter surveys of departing foreign tourists at OR Tambo International Airport to departures taking place throughout the year. In 2003, this was extended to incorporate departures from Cape Town International Airport. The data collection was also expanded to include monthly surveys of the largest segment of foreign arrivals in South Africa, which is land border arrivals. The sample is weighted to allow for tourist arrivals as released by Statistics South Africa. These changes were made to facilitate more robust results, as the sample sizes are larger and are drawn in such a way to ensure they are representative. In 2014, Statistics SA made changes to the release of its Tourism & Migration reports and now no longer reports on transit arrivals. As a result of this change, the weighting methodology has been revised and the results in this report are now not comparable to reports issued prior to The 2017 Quarterly Report represents the fourth edition of a new series of Quarterly Reports. While we have been able to track key metrics consistently over the years through our departure surveys, this report is based on a basket of data consisting of: Statistics South Africa s Tourism & Migration releases for 2017 South African Tourism s monthly departure surveys conducted at OR Tambo and Cape Town international airports, as well as 12 land border posts, during 2017 Euromonitor s IMIS for Travel & Tourism UNWTO World Tourism Barometer, August 2017 South African Tourism s monthly domestic tourism surveys To access this report online, visit the research section on the South Africa Tourism website at For more information, research@southafrica.net. Disclaimer The Strategy, Insights & Analytics Unit of South African Tourism makes every effort to publish reports that are error-free. However, with the large number of complex records that are analysed, we cannot guarantee that all reports are totally free of error. All errors that are detected are immediately corrected and the latest version of the report is always available at The data in this report is based on statistics collected by the Department of Home Affairs at ports of entry to South Africa. It is processed and released by Stats SA and South African Tourism uses these statistics in good faith. Q Quarterly Tourism Report 2
3 Foreword... 2 TOURISM PERFORMANCE QUARTER Key highlights of South Africa s tourism performance in Q Size of the tourism market... 6 Value of the tourism market... 8 Accommodation Geographic spread Appendix 1: Quarterly Tourist Arrivals Table B Appendix 2: Purpose of visit Appendix 3: Length of stay Appendix 4: Age profile Appendix 5: Repeater rate Appendix 6: Bed nights per province Appendix 7: Provincial distribution (Share of arrivals) Appendix 8: Quarterly Spend Tables Appendix 11: Activities undertaken in South Africa Appendix 12: Attractions of landmarks visited by tourist in South Africa Appendix 13: Experiences in South Africa Appendix 14: Satisfaction Rating Appendix 15: Transportation Section Appendix 16: Collection of Tourism Statistics in South Africa South African Tourism s Departure Survey Sample design Data reliability Normalising expenditure data SA Tourism s Domestic Tourism Survey Sample design Normalising expenditure data Data reliability Glossary of terms Q Quarterly Tourism Report 3
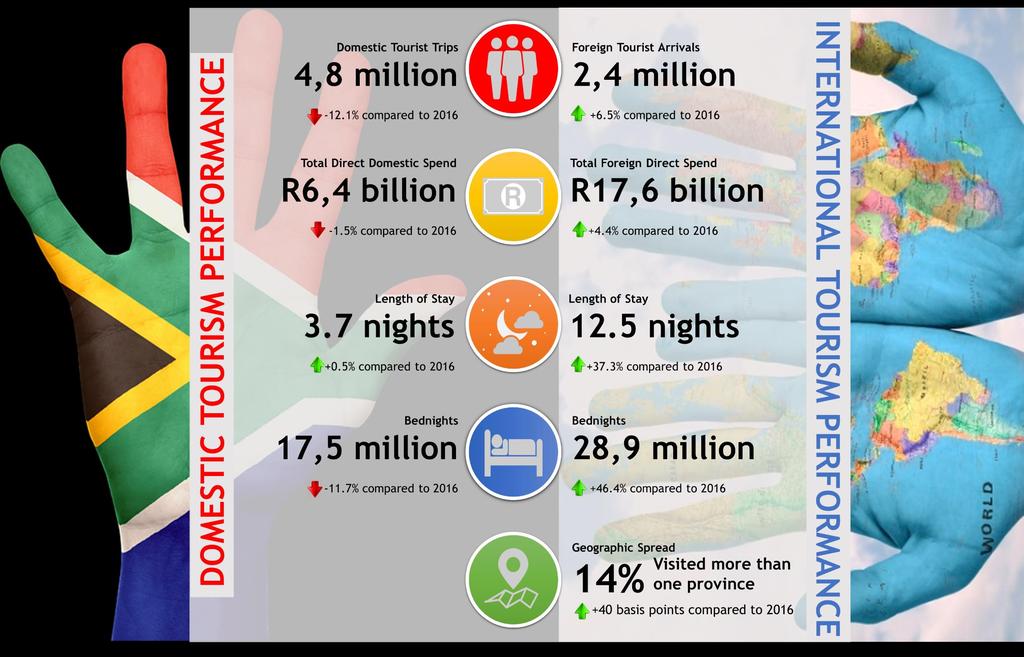
4 TOURISM PERFORMANCE QUARTER 2 Key highlights of South Africa s tourism performance in Q SUMMARY: The second quarter of 2017 saw mixed fortunes for South Africa s tourism sector. Foreign tourist arrivals grew by 6.5% to 2.4 million, compared to the same period last year. However, domestic tourist trips only amounted to 4.8 million a 12.1% slide over the second quarter of 2016, when 5.4 million of these trips were taken. This brings the total number of tourism-related trips (domestic and international) taken in South Africa between April and the end of June 2017 to 7.2 million. Although the combined number of trips declined by 6.7% compared to 2016, their economic contribution (R23.9 billion) was 2.8% higher than the same quarter last year. The biggest challenge facing the South African tourism sector is how to grow domestic tourism on the back of tough economic conditions in the country. The sharp drop in overall domestic tourist trips shows that ordinary South Africans are feeling the pinch. Most South Africans surveyed pointed to affordability as the primary reason for not taking a trip during this time. However, the good news is that domestic leisure holiday trips are up, even though many South Africans are drastically curtailing their customary visits to friends and family. TOURIST VOLUME: Domestic tourism is the backbone of South Africa s tourism economy and makes up two-thirds of the country s overall tourism trips. The trips taken by South Africans for the purpose of visiting friends and relatives (VFR) declined to 2.8 million (from 3.6 million during the same period last year), while business trips almost halved to just over trips (from trips in the second quarter of 2016). On the positive side, the number of domestic holiday trips increased by 16.1%. This suggests that South African Tourism s marketing efforts to build a culture of holiday-taking among South Africans are gaining traction. Domestic airline tickets bought in South Africa grew in this quarter by 6.8%, bringing the total to 4.9 million air travellers. Although air tickets are still predominantly sold through retail (51%) and corporate travel agents (29.7%), online travel agents saw their ticket sales grow by 40%. International tourists made up 33.3% (2.4 million) of the total trips taken in this quarter an increase of 6.5% compared to Air and land markets both contributed to the growth in this quarter. Africa land markets recovered in this quarter from a slump, growing by 5.4% compared to the same period last year. The Easter holidays fell in the second quarter of 2017 (as opposed to in the first quarter last year); this certainly had an impact on travel patterns from South Africa s neighbouring countries. Mozambique and Zimbabwe, which are South Africa s biggest international source markets, are also recovering from the slow start to the year. February s Dineo tropical cyclone affected the travel patterns of Mozambicans. Despite the slight uptick in the number of Zimbabweans travelling to South Africa, the country is suffering from cash shortages, prompting authorities to issue bond notes and impose limits on withdrawals. These regulatory changes have limited the amount of money that travellers can carry when leaving the country, affecting Zimbabweans ability to come to South Africa for shopping purposes. Q Quarterly Tourism Report 4
5 TOURISM VALUE: Tourism (both domestic and international) contributed an estimated R23.9 billion to South Africa s economy during the second quarter of This is 2.8% more than the R23.3 billion recorded in the same period of One might expect that because of the drop in domestic tourism trips, tourism revenue should follow suit as there is a direct correlation between the two. However, tourists who travelled in this quarter spent more per day and stayed longer than usual. International tourists spent R17.6 billion during this quarter, 4.4% higher compared to last year. The 6.5% growth in international tourist volumes saw these travellers spending 37.3% more nights than they did in The combined growth in tourist numbers and their length of stay led to the overall increase in spend, despite the fact that they spent less on each day of their stay. LENGTH OF STAY & BED NIGHTS: The duration of tourists trips is measured in nights, which can be spent either the formal or informal accommodation sectors. Overall bed nights grew in this quarter, to 46.3 million. Each domestic tourist stayed 3.7 nights on average (up slightly), while each international tourist enjoyed the country for an average of 12.5 nights (up significantly). The increase in tourists who visited South Africa and the fact that they stayed longer than they did in the same period last year saw international bed nights skyrocket (46.4% up). Most of the tourists who visited South Africa did not stay in paid-for accommodation during this period, but with family and friends and, increasingly, at churches, in keeping with the Easter weekend. This suggests that there are marketing opportunities for enticing both domestic and international tourists to enjoy affordable accommodation in the formal sector, encouraging them to include a holiday add-on to personal or business trips or to replace some of the nights spent staying with relatives. TOURISM S PROVINCIAL SPREAD: South African Tourism is trying to encourage more people to sample the country s less-visited provinces. This is not only to ensure a more equitable spread of the economic and social benefits of tourism, but also to show that the country has myriad experiences on offer that go beyond the usual or expected. It is for this reason that the provincial spread of tourism is worth tracking, to determine whether travel patterns are changing and tourist behaviour is evolving. Domestic sample size is too small to be statistically significant for this analysis to be performed on a quarterly basis among domestic tourists at the moment, it is possible to track the number of international tourists visiting more than one province. In the second quarter of 2017, 14.1% of foreign tourists visited more than one province, up marginally from the 13.7% recorded during the same period last year. Five of South Africa s nine provinces Limpopo, Mpumalanga, KwaZulu-Natal, the Eastern Cape and the Northern Cape - saw an increase in international visitors, but the rest recorded lower numbers. Q Quarterly Tourism Report 5


6 Size of the tourism market 7.8 Mn In particular, the number of domestic tourists across the country who visit friends and relatives (VFR) fell, with only 2.8 million of these trips taken during the quarter compared to 3.6 million in the same period last year. However, domestic holiday trips were up, from to between April and June Mn 7.2 Mn The size of South Africa s tourism market contracted by 6.7% in the second quarter of 2017, to 7.2 million trips (compared to 7.7 million in the same period of 2016). This was made up of 4.8 million domestic trips and 2.4 million international tourists. Although international arrivals were up, domestic tourism took a knock, with a 12.1% decline from the 5.4 million trips taken between April and June The number of international tourists coming to South Africa grew by 6.5% during this quarter. Much of this can be attributed to the 5.4% growth in arrivals from neighbouring countries, which are South Africa s largest source region for tourism, along with phenomenal growth from Central and South America, and doubledigit increases from Europe, the Middle East and North America. Among the domestic survey respondents, most said they couldn t afford to travel during that time. About a fifth said they had no reason to take a trip and a similar proportion cited time constraints. Others cited unemployment or lack of income as a deterrent. Unfavourable socio-economic conditions were the major reason for the lower tourist numbers among domestic tourists. Despite the fact that the Easter long weekend fell during April, local trips declined overall. There was a marginal contraction in tourists jetting in from Asia, Australasia and African air markets. Q Quarterly Tourism Report 6
7 The bulk of international tourists (1.1 million of the 2.4 million total) came to South Africa to visit friends and family members, rising by 10.8% compared to the same period last year. Holiday tourists also increased by 29%. In part, the growth in international tourists was dampened due to the 15.7% drop in business tourists including business shoppers and delegates travelling to attend meetings, incentives, conventions and exhibitions (MICE). Q Quarterly Tourism Report 7


8 Tourists from neighbouring Southern African markets spent the most on tourism in South Africa during the second quarter of the year. The only region to see a slide in spend was the African air markets, whose spend contracted by 10% from last year. Value of the tourism market During the second quarter of 2017, overall revenue generated from tourism grew by 2.8% to R23.9 billion compared to the R23.3 billion recorded during the same period last year. The growth in international tourist numbers had a direct impact on the amount of income generated from the sector during this time. R19.7 Bn R23.3 Bn R23.9 Bn Travel by domestic tourists contributed R6.4 billion to the economy between April and June This is a 1.5% decrease compared to spend during the same period in This slight contraction in spend was because of the overall drop in the number of domestic trips that were undertaken. On average, each trip by a domestic tourist was slightly longer than previously. But those who did travel locally spent 12.5% more on each day of their trip, despite the tough economic conditions. Europeans spent 7.2% more than last year, while money spent by tourists from the Americas grew by 23.3%. During the second quarter, international tourists spent most of their money (R4.7 billion) on shopping for personal items, but this category fell by 4.1% from last year s figure. 6.5% 37.3% -28.7% Their financial outlay in all other areas (including accommodation, food, leisure and transport) recorded double-digit growth compared to last year. More international tourists visited South Africa during the second quarter of 2017 (6.5% up), and those who did visit stayed for much longer (37.3% up) than was the case in the previous year. These tourists, however, spent less per day (28.7% down) resulting in foreign tourism revenue growing by only 4.4%, to R17.6 billion (from R16.8 billion in the second quarter of 2016). Because of fewer South African residents travelling to visit family members and loved ones over this period, VFR expenditure dipped by 11.8%. Business and holiday travellers made up the largest proportion of domestic and international tourism expenditure R14 billion of the R23.9 billion total. Domestic holiday tourists spent 19.5% more than during the same period last year, and international holidaymakers spent 37.2% more % 0.5% 12.5% The stronger rand undoubtedly had a negative impact on the buying power of foreign tourists visiting South Africa, as the increase in spend in general grew at a slower pace than the increase in tourist volumes and length of stay. Domestic tourists travelling for business spent 37.5% more than they did in On the other hand, the international business tourists spent 16.8% less in South Africa than was the case in the same period last year. Q Quarterly Tourism Report 8
9 International MICE tourists spent slightly more than in the same period last year; domestic sample is too small to be statistically significant and is not shown. Q Quarterly Tourism Report 9


. Overall SFR bed nights grew slightly (by 3%) to 30.1 million.")

10 Accommodation Domestic tourists are taking slightly longer trips than previously an average of 3.7 nights per tourist this quarter, compared to 3.6 trips in The good news is that international tourists are staying longer in the country 12.5 nights on average, compared to 9.1 nights last year. The total number of bed nights in South Africa between April and June 2017 grew by 17.3% from the 39.5 million recorded in the second quarter of 2016, to reach 46.3 million. International tourists led this growth, with these travellers clocking up 46.4% more bed nights than during the same period in Types of accommodation: Most tourists across the spectrum (65%) do not lodge in formal accommodation when they travel to South Africa, but reside with friends and relatives. For research purposes, this category of bed nights is known as SFR (staying with friends and relatives). Overall SFR bed nights grew slightly (by 3%) to 30.1 million. This growth was driven by the massive 35.5% uptick in international SFR nights, but was tempered by a 22.8% slide in domestic SFR nights during the quarter. 2.8Mn 1.7Mn 1.6Mn 0.2Mn Asian and Australasian tourists, and travellers from the Southern African region, drove much of this increase, staying for 43.5% and 44.2% longer than last year respectively. Travellers from Europe and African air markets stayed for 23.1% and 25.9% longer respectively. Tourists from the Americas, however, spent some 13.8 nights at a stretch in South Africa on average, which is slightly less than the same period last year. International visitors from South Africa s neighbouring countries in the region stayed for 11.2 nights on average, much longer than last year, while tourists jetting in from African air markets spent about 17.4 nights, also an improved figure from Mn There was an increase in international tourists booking into formal establishments such as hotels, game lodges and guesthouses (1.7 million more bed nights), but domestic tourists spent fewer bed nights in formal establishments than they had during the same period last year. In total, the bed nights spent in formal accommodation grew by 17.9%, from 8.6 million in the second quarter of 2016 to 10.1 million in this quarter. This growth in formal accommodation was driven by bed nights spent by local and foreign tourists in self-catering establishments, backpackers, game lodges and guesthouses during the second quarter. In this time, bed nights spent in hotels remained stagnant at 2.9 million bed nights overall, while B&Bs saw a decline of 19.7%. 3.7Mn Although the domestic tourists who did travel in South Africa stayed longer during the second quarter compared to the same period last year, the number of bed nights dipped by 11.7%. This was driven by the overall decrease in domestic tourist volumes Mn 39.5 Mn 46.3 Mn Bednights in millions Domestic tourists spent fewer bed nights in hotels, guesthouses, game lodges and B&Bs. However, nights spent in self-catering establishments more than doubled (growing by 112%) over the same quarter last year. With the Easter weekend falling in April, South Africa also saw domestic tourists spending 1.4 million more bed nights in churches (an increase of 114% over last year). Q Quarterly Tourism Report 10
11 Spend on accommodation: Among both domestic and international tourists, 37.2% more was spent on accommodation in South Africa during the second quarter of This translates into a total of R3.6 billion that was injected into this sector during this time. Leading the growth, with a 54.6% hike in spend, were the international tourists, who spent R2.2 billion on lodgings in the second quarter of Domestic tourists spent 16.4% more, racking up a R1.4 billion accommodation bill. European travellers spent 57.6% more on places to stay (R0.8 billion, making it the region that spent the most money on accommodation in South Africa during the three months under review). Tourists from African land markets and the Americas were the leaders of growth in accommodation spend, surging by 71.4% and 84% respectively. Expenditure by travellers from Asia and Australasia grew by 25.4%, while the African air markets remained relatively flat with 0.7% growth over the same period compared to last year. Q Quarterly Tourism Report 11

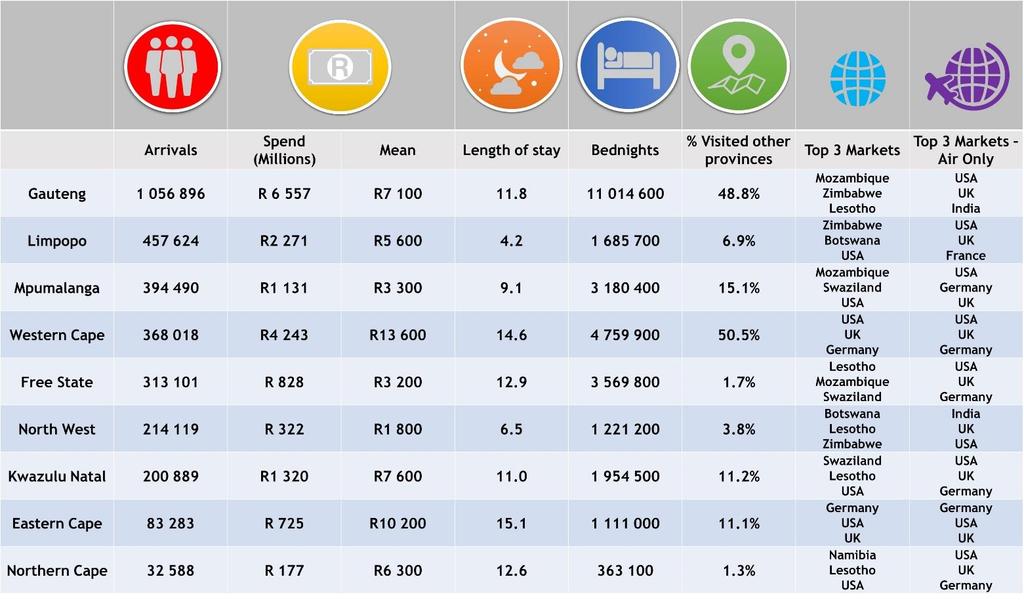
12 Domestic tourism statistics for the second quarter are only presently available for three of the nine provinces Gauteng, Limpopo and KwaZulu-Natal. Limpopo and Gauteng grew their share of domestic trips over last year, but the period saw significant declines from KwaZulu-Natal. Geographic spread In the second quarter of 2017, 14.1% of international tourists visited more than one South African province during their trip. This is up on last year s figure of 13.7%. International tourists spent more across all provinces. In addition, they stayed longer than previously in eight of the nine provinces, with the exception being Limpopo. Five of the nine provinces recorded an increase in international tourists compared to the same period last year. These were Limpopo, Mpumalanga, KwaZulu- Natal, the Eastern Cape and the Northern Cape. Overall, the number of bed nights grew in all the provinces, arising from the fact that tourists stayed longer and there were more tourists visiting each province than during the same period last year. Most of the foreign tourists who came to South Africa in the second quarter visited Gauteng (more than a million arrivals, spending R6.6 billion). The Western Cape attracted tourists (spending R4.2 billion) and Limpopo tourists (spending R2.3 billion). Collectively, these three provinces attracted 60% of international arrivals and made up 74% of tourism revenue for the period. This vastly uneven spread of tourism s economic impact further illustrates the need to encourage tourists to visit more of the country s provinces, and develop more attractive tourism products and attractions in rural and remote areas. Q Quarterly Tourism Report 12
13

, with domestic air travel growing by 6%. Overall, airport movements as recorded by the Airports Company of South Africa rose by 6.8%.")

14 Transportation sector: Tourists spent 1.1% more on transport compared to the second quarter of Domestic tourists did not travel as much, and spent 17.7% less on transport than they had during the same time last year. The amount spent by international tourists on transport grew by 45.9%. Major airports were busy over the second quarter of the year, particularly with 10% more international tourists jetting in. Tourists flying in from the region remained relatively unchanged (0.9%), with domestic air travel growing by 6%. Overall, airport movements as recorded by the Airports Company of South Africa rose by 6.8%. The growth in the amount of money spent by international tourists on transport drove the increase in overall spend on transportation which rose to R3.6 billion, compared to R3.5 billion in the second quarter of Phenomenal growth was recorded in online bookings for air tickets within South Africa (relating to the domestic flights of both foreign and South African tourists). Domestic flights in South Africa There were declines in all the types of transport used by domestic travellers, with the exception of other taxis that saw a 53.4% increase. There were fewer domestic tourists travelling by minibus, and driving private or rental cars. (Source: Forward Keys) Retail travel agents still sell the majority of air tickets to South Africa, both regional and international, and saw 2.8% growth compared to the second quarter of Other travel agents, however, saw an 18% climb in bookings compared to the same period last year. Regional & International flights to South Africa More foreign tourists got where they needed to via other taxi, plane, rental cars, tour buses, train and motorcycle, but fewer travelled on foot, or used private cars and minibus taxis to travel around the country. Furthermore, not as many chose to travel by hotel shuttle, truck or boat than was previously the case. (Source: Forward Keys)

15 Retail sector: Tourists in South Africa tend to spend the largest proportion of their budgets on shopping. However, domestic and foreign tourists collectively spent 6.9% less on buying items than in the second quarter of 2016, down to R5.8 billion. Types of purchases: In general, international tourists were most likely to purchase groceries and clothing during the second quarter of the year. But the picture changes slightly if divided into those from air markets and those from land markets. Air tourists opt for a broader spread of products, while land tourists focus more on buying clothing and groceries. This was most marked among domestic tourists, who spent 16.5% less (dropping by R200 million) during the quarter. International tourists shelled out 4.1% less (dropping to R4.7 billion). More than half of the foreign tourism shopping revenue flowing into South Africa came from neighbouring countries: R2.4 billion stemmed from African land markets, growing by 5.4%. Shopping spend for the quarter saw a decline; however, despite this, the country s major shopping malls and districts were booming. The V&A Waterfront, the Cape Town city centre and Sandton City/Nelson Mandela Square drew the highest proportion of international tourists, and all recorded an increase in tourist foot traffic compared to last year. African tourists coming in from air markets spent less (9.9%) on shopping than previously. There was a tightening of belts from all other major international source markets too notably the Americas, whose tourists spent 21.5% less in South Africa than they had in the second quarter of Q Quarterly Tourism Report 15
. International tourists spend on leisure also grew, up 20.8% compared to 2016.")
16 Leisure sector: Tourists spent 34.1% more on leisure activities during the second quarter of 2017, reaching R2.5 billion from R1.8 billion at the same time last year. The outlay of domestic tourists on leisure activities more than doubled (up by 102%). International tourists spend on leisure also grew, up 20.8% compared to Apart from sampling the local shopping and nightlife, international tourists also immersed themselves in socialising and visiting sites of natural, historical or cultural significance. International tourists love visiting shopping malls, but also enjoy taking in natural attractions, game reserves and urban landmarks. During the second quarter of 2017, Cape Point, Table Mountain and Camps Bay were the three most popular leisure attractions. Food sector: After shopping, tourists spent the most money on food during the second quarter of the year, be it on eating out or buying groceries. Altogether, R3.9 billion in revenue flowed into this sector. This category of spending was 12.1% up compared to the same period last year. International tourists spent the most on food 70% of the overall food spend total. They laid out 15.9% more than they did the previous year at the same time, for a total of R3.9 billion. Domestic tourists spent R1.2 billion on their culinary experiences during the same period. Q Quarterly Tourism Report 16
17 Appendix 1: Quarterly Tourist Arrivals Table B \ COUNTRY OF RESIDENCE APR APR DIFF % MAY MAY DIFF % JUN JUN DIFF % APR TO JUN DIFF % EUROPE: Austria % % % % Belgium % % % % Denmark % % % % Finland % % % % France % % % % Germany % % % % Ireland % % % % Italy % % % % The Netherlands % % % % Norway % % % % Poland % % % % Portugal % % % % Russian Federation % % % % Spain % % % % Sweden % % % % Switzerland % % % % Turkey % % % % UK % % % % Other % % % % EUROPE* % % % % NORTH AMERICA: Canada % % % % USA % % % % NORTH AMERICA % % % % CENTRAL & SOUTH AMERICA: Argentina % % % % Brazil % % % % Chile % % % % Mexico % % % % Venezuela % % % % Other % % % % CENTRAL & SOUTH AMERICA* % % % % AUSTRALASIA: Australia % % % % New Zealand % % % % Other % % % % AUSTRALASIA* % % % % ASIA: China (including Hong Kong) % % % % India % % % % Indonesia % % % % Japan % % % % South Korea % % % % Malaysia % % % % Philippines % % % % Singapore % % % % Taiwan % % % % Thailand % % % % Other % % % % ASIA* % % % % AFRICA LAND: Botswana % % % % Lesotho % % % % Malawi % % % % Mozambique % % % % Namibia % % % % Swaziland % % % % Zambia % % % % Zimbabwe % % % % TOTAL AFRICA LAND % % % % AFRICA AIR: Angola % % % % DRC % % % % Egypt % % % % Ethiopia % % % % Ghana % % % % Kenya % % % % Morocco % % % % Nigeria % % % % Senegal % % % % Tanzania % % % % Uganda % % % % Other % % % % INDIAN OCEAN ISLANDS: Mauritius % % % % Reunion % % N/A % Seychelles % % % % TOTAL INDIAN OCEAN ISLANDS % % % % AFRICA AIR % % % % MIDDLE EAST: Israel % % % % Saudi Arabia % % % % United Arab Emirates % % % % Other % % % % MIDDLE EAST* % % % % Unspecified % % % % GRAND TOTAL % % % % OVERSEAS TOTAL % % % % AFRICA TOTAL % % % % NOTES: OVERSEAS TOTAL IS CALCULATED BY SUBTRACTING TOTAL MAINLAND AFRICA, INDIAN OCEAN ISLANDS AND UNSPECIFIED FROM THE GRAND TOTAL AFRICA AIR TOTAL EXCLUDES INDIAN OCEAN ISLANDS AND MIDDLE EAST RKEY & CYPRUS ARE NOW ANALYSED AS EUROPE AS PER STATSSA & UNWTO)NB: REGIONS PUBLISHED IN PREVIOUS TABLE B REPORTS WILL NOT MATCH THESE FIGURES AS SUCH THIS TABLE IS THE BEGINNING OF A NEW SERIES. SOURCE: STATISTICS SA TABLE B - QUARTER TOURIST ARRIVALS ALIGNED TO STATSSA TOURISM & MIGRATION REPORTS A tourist is an overnight visitor taking a trip to a main destination outside his/her usual environment, for less than a year, for any main purpose (business, leisure or other personal purpose) other than to be employed by a resident entity in the country or place visited. APR TO JUN 2017 COMPARED WITH APR TO JUN 2016 Q Quarterly Tourism Report 17
18 Appendix 2: Purpose of visit PURPOSE OF VISIT (5 CATEGORIES) 2017 Leisure Business Medical Religion Other AFRICA LAND 69.5% 16.9% 1.7% 2.6% 9.3% Botswana 62.4% 18.1% 1.5% 8.4% 9.6% Lesotho 71.1% 8.3% 2.1% 0.6% 17.8% Malawi 35.7% 54.7% 1.3% 4.0% 4.3% Mozambique 86.6% 8.4% 0.9% 0.9% 3.2% Namibia 60.9% 16.4% 4.6% 2.8% 15.5% Swaziland 83.6% 3.1% 0.7% 5.9% 6.7% Zambia 27.3% 60.9% 0.5% 5.0% 6.3% Zimbabwe 60.4% 29.1% 2.1% 1.5% 6.9% AFRICA AIR 49.9% 30.3% 3.0% 3.2% 13.6% Angola 71.2% 12.1% 9.0% 1.4% 6.3% Democratic Republic of Congo 52.3% 20.9% 8.3% 5.8% 12.7% Ethiopia 51.7% 32.7% 2.8% 12.8% Ghana 37.4% 40.7% 7.4% 14.5% Kenya 26.1% 45.7% 1.7% 3.2% 23.3% Nigeria 50.8% 29.1% 1.0% 4.8% 14.3% Tanzania 41.9% 37.2% 2.7% 2.7% 15.5% Turkey 40.0% 40.2% 1.7% 6.9% 11.3% Uganda 44.7% 48.0% 7.3% UAE 73.8% 17.2% 9.0% Other Africa and Middle East 51.6% 30.0% 2.1% 2.0% 14.3% AMERICAS 73.2% 16.8% 0.1% 0.9% 9.0% Argentina 73.2% 19.1% 7.7% Brazil 66.2% 25.2% 0.9% 7.8% Canada 75.0% 15.0% 9.3% Chile 74.8% 21.1% 4.1% USA 74.6% 15.2% 1.0% 9.2% Other Americas 58.9% 27.8% 2.8% 10.5% ASIA & AUSTRALASIA 65.0% 29.0% 0.1% 0.5% 5.5% Australia 84.0% 9.5% 6.0% China including Hong Kong 69.5% 26.1% 4.4% India 45.9% 48.1% 1.0% 4.9% Japan 57.8% 37.1% 5.1% Malaysia 64.1% 19.9% 3.5% 12.5% New Zealand 74.0% 15.5% 10.4% Singapore 87.5% 5.1% 7.4% South Korea 76.0% 22.5% 1.5% Other Asia and Australasia 50.0% 44.7% 5.0% EUROPE 71.2% 20.6% 0.2% 0.5% 7.5% Austria 59.7% 34.4% 5.9% Belgium 63.2% 22.5% 14.3% Denmark 67.6% 21.9% 0.8% 9.6% Finland 57.3% 25.5% 17.2% France 68.2% 23.5% 8.0% Germany 73.7% 18.0% 7.8% Ireland 78.4% 16.8% 4.8% Italy 64.9% 22.6% 4.9% 7.6% Netherlands 73.1% 17.3% 0.9% 8.7% Norway 66.8% 12.8% 1.0% 19.4% Portugal 68.4% 25.3% 6.3% Russian Fed 43.4% 48.3% 8.3% Spain 71.4% 25.9% 2.7% Sweden 64.1% 30.9% 0.5% 4.6% Switzerland 67.1% 24.4% 8.5% UK 76.6% 16.6% 6.2% Other Europe 55.1% 37.3% 7.6% ALL FOREIGN TOURISTS 69.1% 18.2% 1.4% 2.2% 9.1% Notes: Blank cells indicate that the sample is not big enough for a valid statistical interpretation Q Quarterly Tourism Report 18
19 PURPOSE OF VISIT (5 CATEGORIES) 2016 Leisure Business Medical Religion Other AFRICA LAND 66.8% 20.5% 2.3% 2.7% 7.7% Botswana 47.1% 33.0% 2.1% 8.4% 9.3% Lesotho 65.6% 10.0% 4.1% 3.0% 17.3% Malawi 35.8% 56.4% 2.7% 5.0% Mozambique 77.8% 16.7% 1.6% 0.9% 3.0% Namibia 63.5% 19.7% 6.4% 0.9% 9.4% Swaziland 68.8% 22.6% 1.5% 1.7% 5.4% Zambia 37.9% 55.5% 0.6% 2.5% 3.5% Zimbabwe 71.2% 21.7% 1.5% 2.3% 3.2% AFRICA AIR 43.3% 38.9% 3.6% 2.8% 11.3% Angola 50.2% 21.7% 15.5% 2.4% 10.1% Democratic Republic of Congo 43.9% 23.8% 13.3% 4.8% 14.2% Ethiopia 44.0% 48.7% 3.0% 4.4% Ghana 26.3% 53.6% 5.1% 4.9% 10.1% Kenya 27.0% 50.5% 3.6% 18.9% Nigeria 48.4% 34.7% 0.8% 6.1% 10.0% Tanzania 31.0% 40.1% 6.0% 1.5% 21.4% Turkey 30.5% 45.0% 24.4% Uganda 36.1% 60.0% 3.9% UAE 45.4% 54.6% Other Africa and Middle East 49.5% 40.3% 0.9% 1.0% 8.3% AMERICAS 65.5% 22.9% 0.4% 0.7% 10.6% Argentina 48.8% 40.8% 10.4% Brazil 43.3% 38.4% 1.0% 17.4% Canada 70.7% 22.0% 6.6% Chile 51.3% 37.7% 3.7% 7.4% USA 67.2% 20.9% 0.7% 10.8% Other Americas 48.3% 45.8% 0.5% 5.4% ASIA & AUSTRALASIA 61.2% 34.2% 0.1% 0.7% 3.7% Australia 74.3% 19.2% 0.5% 1.4% 4.5% China including Hong Kong 78.1% 21.1% 0.8% India 38.9% 56.4% 4.2% Japan 52.9% 44.2% 2.9% Malaysia 58.2% 25.0% 4.2% 12.5% New Zealand 61.6% 31.7% 6.7% Singapore 52.8% 38.3% 8.9% South Korea 72.2% 23.4% 1.6% 2.9% Other Asia and Australasia 53.1% 40.7% 1.4% 4.9% EUROPE 60.6% 32.3% 0.5% 0.4% 6.3% Austria 47.9% 43.3% 1.8% 7.0% Belgium 51.2% 38.2% 4.4% 5.7% Denmark 61.2% 32.6% 0.9% 5.4% Finland 36.5% 54.8% 8.8% France 56.9% 35.5% 0.8% 6.3% Germany 66.9% 24.9% 8.0% Ireland 72.1% 27.9% Italy 48.6% 48.2% 0.8% 2.4% Netherlands 69.7% 22.3% 8.0% Norway 47.2% 30.1% 1.2% 21.5% Portugal 51.3% 45.4% 3.3% Russian Fed 12.5% 86.2% 1.4% Spain 41.3% 51.3% 1.9% 2.7% 2.8% Sweden 49.0% 42.8% 8.2% Switzerland 71.6% 22.0% 6.1% UK 65.9% 27.0% 6.4% Other Europe 29.9% 65.5% 0.6% 4.1% ALL FOREIGN TOURISTS 65.0% 23.0% 2.0% 2.3% 7.7% Notes: Blank cells indicate that the sample is not big enough for a valid statistical interpretation Q Quarterly Tourism Report 19
20 PURPOSE OF VISIT (5 CATEGORIES) 2015 Leisure Business Medical Religion Other AFRICA LAND 62.4% 23.9% 3.2% 2.6% 7.9% Botswana 56.6% 26.4% 3.7% 4.9% 8.3% Lesotho 61.4% 13.6% 4.5% 3.3% 17.2% Malawi 44.8% 48.4% 3.8% 1.2% 1.9% Mozambique 62.7% 31.3% 2.5% 1.2% 2.3% Namibia 56.6% 24.1% 4.6% 2.1% 12.6% Swaziland 69.6% 12.9% 4.2% 4.1% 9.1% Zambia 34.8% 56.6% 1.1% 2.8% 4.6% Zimbabwe 65.7% 27.0% 1.9% 1.7% 3.7% AFRICA AIR 42.4% 38.1% 3.7% 2.4% 13.4% Angola 55.9% 19.7% 10.8% 0.9% 12.6% Democratic Republic of Congo 44.8% 26.6% 9.6% 1.1% 18.0% Ethiopia 21.9% 58.4% 1.9% 1.9% 15.8% Ghana 28.4% 45.0% 7.4% 19.2% Kenya 16.6% 63.7% 19.7% Nigeria 45.6% 34.1% 3.7% 7.9% 8.7% Tanzania 52.1% 30.4% 1.9% 15.6% Turkey 24.1% 49.4% 4.8% 4.9% 16.8% Uganda 18.6% 78.1% 3.3% UAE 57.3% 37.4% 5.3% Other Africa and Middle East 43.7% 41.0% 1.2% 0.6% 13.5% AMERICAS 68.0% 18.7% 0.4% 1.6% 11.3% Argentina 41.3% 47.6% 11.1% Brazil 59.5% 31.7% 0.6% 8.2% Canada 73.3% 19.0% 1.2% 6.3% Chile 51.8% 43.4% 4.8% USA 68.6% 16.8% 1.8% 12.4% Other Americas 55.9% 37.1% 7.0% ASIA & AUSTRALASIA 56.7% 39.8% 0.2% 0.5% 2.7% Australia 79.4% 18.5% 1.6% China including Hong Kong 51.4% 47.4% 1.2% India 35.3% 60.3% 1.4% 3.1% Japan 52.0% 47.4% 0.6% Malaysia 52.6% 31.2% 6.3% 10.0% New Zealand 71.6% 20.0% 1.1% 7.2% Singapore 72.2% 24.0% 3.7% South Korea 71.8% 17.5% 10.7% Other Asia and Australasia 49.3% 48.0% 2.6% EUROPE 65.8% 27.8% 0.3% 0.3% 5.9% Austria 71.3% 27.4% 1.2% Belgium 66.0% 25.9% 8.0% Denmark 61.7% 31.5% 6.8% Finland 50.5% 41.9% 7.6% France 67.8% 28.0% 0.5% 3.4% Germany 70.1% 24.4% 0.9% 4.5% Ireland 61.9% 32.7% 5.4% Italy 46.8% 45.4% 7.8% Netherlands 75.8% 17.9% 5.8% Norway 73.2% 17.5% 9.3% Portugal 48.1% 39.3% 0.9% 1.3% 10.3% Russian Fed 25.8% 64.2% 5.8% 4.2% Spain 45.1% 46.2% 8.7% Sweden 62.9% 24.0% 1.2% 11.9% Switzerland 71.1% 20.2% 8.4% UK 69.2% 25.0% 5.4% Other Europe 27.0% 59.7% 1.8% 11.5% ALL FOREIGN TOURISTS 62.1% 25.1% 2.7% 2.3% 7.8% Notes: Blank cells indicate that the sample is not big enough for a valid statistical interpretation Q Quarterly Tourism Report 20
21 Appendix 3: Length of stay Q Quarterly Tourism Report 21
22 AVERAGE LENGTH OF STAY AFRICA LAND Botswana Lesotho Malawi Mozambique Namibia Swaziland Zambia Zimbabwe AFRICA AIR Angola Democratic Republic of Congo Ethiopia Ghana Kenya Nigeria Tanzania Turkey Uganda UAE Other Africa and Middle East AMERICAS Argentina Brazil Canada Chile USA Other Americas ASIA & AUSTRALASIA Australia China including Hong Kong India Japan Malaysia New Zealand Singapore South Korea Other Asia and Australasia EUROPE Austria Belgium Denmark Finland France Germany Ireland Italy Netherlands Norway Portugal Russian Fed Spain Sweden Switzerland UK Other Europe ALL FOREIGN TOURISTS Q Quarterly Tourism Report 22
23 Appendix 4: Age profile AGE OF RESPONDENTS years years years years years 65+ years AFRICA LAND 11.7% 36.6% 28.2% 11.9% 4.2% 1.5% Botswana 6.1% 32.7% 31.4% 16.9% 7.0% 2.0% Lesotho 20.1% 34.4% 20.7% 10.7% 4.1% 2.2% Malawi 8.2% 32.2% 40.6% 12.0% 3.5% Mozambique 10.3% 41.1% 29.6% 8.4% 3.8% 0.7% Namibia 6.8% 18.7% 27.4% 21.2% 15.1% 6.8% Swaziland 12.2% 41.3% 22.0% 11.8% 3.9% 1.5% Zambia 6.8% 27.9% 40.7% 18.9% 3.5% Zimbabwe 8.9% 37.7% 33.3% 11.6% 2.7% 0.9% AFRICA AIR 6.8% 31.6% 31.8% 16.6% 7.2% 1.1% Angola 10.3% 35.9% 30.8% 14.7% 5.6% 1.3% Democratic Republic of Congo 1.1% 15.2% 40.9% 24.6% 13.5% Ethiopia 8.3% 35.8% 21.9% 20.2% 1.9% Ghana 3.8% 42.8% 34.1% 9.4% 5.0% Kenya 4.8% 27.4% 32.5% 18.8% 4.2% 2.5% Nigeria 7.7% 28.1% 30.8% 17.1% 6.0% 1.2% Tanzania 2.1% 53.3% 22.4% 8.0% 10.7% Turkey 9.7% 35.0% 33.7% 19.3% 1.2% Uganda 5.9% 31.2% 38.7% 18.4% 3.0% 2.9% UAE 2.3% 39.1% 28.2% 13.7% 8.3% 2.3% Other Africa and Middle East 8.5% 26.8% 33.5% 18.2% 8.6% 1.2% AMERICAS 17.5% 25.1% 17.4% 15.2% 12.5% 8.7% Argentina 3.1% 23.5% 43.0% 22.5% 8.0% Brazil 7.0% 34.3% 31.7% 8.8% 8.2% 1.7% Canada 22.0% 23.7% 12.7% 17.4% 12.6% 7.9% Chile 25.9% 33.8% 14.4% 9.6% 16.3% USA 17.9% 24.6% 16.2% 15.5% 12.7% 9.7% Other Americas 14.9% 19.9% 35.2% 9.4% 19.6% ASIA & AUSTRALASIA 6.7% 32.3% 25.7% 19.0% 8.7% 3.7% Australia 6.4% 24.3% 18.8% 20.3% 16.2% 10.3% China including Hong Kong 7.3% 34.5% 27.6% 21.0% 1.8% India 7.5% 38.7% 27.7% 15.1% 7.7% 1.5% Japan 0.9% 45.3% 30.9% 16.0% 2.2% Malaysia 7.2% 34.7% 24.4% 10.0% 23.8% New Zealand 2.2% 27.8% 25.6% 21.6% 14.4% 6.6% Singapore 16.6% 28.1% 46.6% 6.2% 1.2% South Korea 19.4% 35.6% 15.1% 25.9% 3.9% Other Asia and Australasia 6.5% 28.4% 38.3% 16.9% 2.4% EUROPE 12.1% 28.6% 24.7% 15.1% 9.2% 7.1% Austria 15.6% 36.2% 13.8% 10.8% 7.5% 6.7% Belgium 16.7% 38.1% 20.2% 12.8% 5.1% 6.1% Denmark 15.4% 22.8% 16.8% 22.1% 17.5% 3.8% Finland 28.3% 23.7% 13.6% 28.9% 3.0% France 9.6% 22.7% 32.4% 18.2% 7.5% 5.4% Germany 15.1% 29.2% 20.7% 14.0% 9.2% 7.1% Ireland 11.5% 39.8% 17.6% 9.7% 6.4% 14.1% Italy 5.8% 35.2% 26.2% 18.9% 8.1% 4.2% Netherlands 15.2% 28.6% 17.4% 13.6% 13.1% 9.0% Norway 27.1% 39.2% 16.1% 8.4% 6.5% 1.8% Portugal 4.8% 31.8% 33.3% 8.8% 12.0% 1.3% Russian Fed 10.5% 27.9% 25.8% 17.9% 15.8% 2.1% Spain 3.9% 52.2% 25.7% 12.1% 3.8% 0.8% Sweden 23.4% 24.5% 17.8% 15.4% 12.8% 5.8% Switzerland 17.3% 22.4% 25.3% 18.0% 8.5% 2.7% UK 10.3% 26.3% 25.9% 15.7% 9.8% 9.4% Other Europe 8.3% 31.4% 41.8% 12.3% 3.2% 2.4% ALL FOREIGN TOURISTS 11.6% 34.9% 27.4% 12.8% 5.4% 2.5% Notes: Blank cells indicate that the sample is not big enough for a valid statistical interpretation Q Quarterly Tourism Report 23
24 AGE OF RESPONDENTS years years years years years 65+ years AFRICA LAND 11.0% 35.7% 31.9% 11.9% 3.9% 1.6% Botswana 4.0% 30.1% 41.5% 15.1% 4.2% 1.7% Lesotho 20.9% 32.7% 23.3% 9.3% 4.7% 1.6% Malawi 5.1% 22.9% 53.6% 13.1% 0.9% 2.7% Mozambique 9.0% 41.0% 29.6% 8.7% 3.6% 0.9% Namibia 4.5% 17.8% 22.8% 22.2% 20.1% 6.7% Swaziland 12.2% 47.8% 26.0% 10.9% 2.2% Zambia 1.0% 19.1% 63.5% 13.0% 2.1% Zimbabwe 7.1% 35.8% 37.1% 14.5% 2.8% 2.2% AFRICA AIR 6.1% 29.1% 31.6% 20.4% 5.8% 1.6% Angola 11.1% 31.1% 32.4% 17.4% 4.0% 0.9% Democratic Republic of Congo 5.6% 16.7% 35.0% 25.1% 14.2% 1.7% Ethiopia 1.4% 25.6% 39.4% 18.2% 4.5% Ghana 2.3% 31.2% 30.2% 26.7% 6.0% 1.2% Kenya 4.3% 30.2% 30.1% 22.4% 4.6% 0.8% Nigeria 3.7% 33.7% 29.4% 19.7% 3.5% 0.8% Tanzania 5.5% 32.4% 26.7% 17.1% 7.5% 1.5% Turkey 6.4% 39.8% 26.6% 18.9% 4.8% Uganda 8.2% 14.6% 57.8% 12.3% 1.7% UAE 50.0% 45.4% 4.6% Other Africa and Middle East 7.5% 27.1% 30.0% 22.0% 7.0% 3.2% AMERICAS 14.3% 24.6% 23.5% 17.8% 10.2% 8.6% Argentina 8.6% 34.6% 31.4% 15.8% 7.8% Brazil 12.9% 45.8% 25.7% 11.6% 3.0% 1.0% Canada 15.2% 21.8% 23.5% 20.1% 15.2% 3.3% Chile 10.0% 42.3% 32.5% 7.7% 7.5% USA 14.7% 23.0% 23.0% 17.6% 10.2% 10.3% Other Americas 1.2% 28.8% 31.5% 35.7% 2.0% 0.8% ASIA & AUSTRALASIA 4.7% 31.9% 34.7% 16.8% 6.9% 3.0% Australia 5.4% 24.9% 31.2% 18.1% 12.6% 6.9% China including Hong Kong 1.6% 46.0% 39.0% 7.8% 3.1% 2.0% India 6.3% 28.4% 36.0% 18.8% 5.1% 1.5% Japan 4.0% 19.5% 39.2% 25.2% 6.8% Malaysia 4.1% 24.9% 25.0% 37.7% 8.3% New Zealand 8.5% 34.4% 23.7% 18.9% 11.0% 3.6% Singapore 5.1% 28.8% 30.1% 11.0% 17.6% South Korea 30.4% 35.0% 24.5% 3.1% 5.5% Other Asia and Australasia 6.4% 30.4% 33.8% 21.5% 4.4% 1.7% EUROPE 8.9% 27.8% 29.3% 20.3% 7.6% 4.6% Austria 7.4% 37.4% 30.3% 15.9% 5.2% 3.7% Belgium 6.3% 20.3% 30.1% 33.7% 6.1% 2.2% Denmark 7.7% 21.3% 18.6% 25.2% 14.4% 11.5% Finland 5.5% 36.9% 38.5% 14.5% 2.3% France 9.7% 25.8% 32.2% 22.7% 6.0% 3.2% Germany 11.5% 26.8% 23.6% 20.4% 9.7% 6.4% Ireland 4.9% 35.8% 40.6% 9.7% 3.0% 4.5% Italy 3.3% 30.5% 36.3% 22.3% 5.8% Netherlands 12.6% 30.0% 26.8% 16.3% 9.6% 4.2% Norway 27.7% 25.5% 14.6% 16.1% 11.8% 3.1% Portugal 6.6% 31.2% 38.7% 15.5% 5.6% 2.4% Russian Fed 2.6% 8.8% 22.8% 61.0% 1.6% Spain 2.9% 38.3% 28.3% 26.7% 2.0% 2.0% Sweden 6.6% 22.4% 30.2% 26.2% 9.9% 4.0% Switzerland 7.6% 25.7% 26.8% 27.8% 7.2% 2.9% UK 8.8% 28.2% 28.6% 18.0% 7.3% 5.9% Other Europe 3.8% 23.4% 44.0% 18.8% 9.0% 0.6% ALL FOREIGN TOURISTS 10.5% 34.0% 31.4% 13.5% 4.8% 2.3% Notes: Blank cells indicate that the sample is not big enough for a valid statistical interpretation Q Quarterly Tourism Report 24
25 AGE OF RESPONDENTS years years years years years 65+ years AFRICA LAND 19.4% 40.2% 27.4% 8.8% 2.6% 0.6% Botswana 10.0% 38.0% 32.7% 13.5% 3.4% 1.1% Lesotho 38.6% 37.7% 16.1% 4.9% 1.9% Malawi 11.4% 26.8% 44.8% 13.9% 2.2% Mozambique 14.7% 46.9% 29.2% 6.4% 1.3% Namibia 8.8% 31.4% 24.5% 18.8% 10.1% 3.1% Swaziland 18.2% 50.8% 22.7% 5.5% 1.5% Zambia 5.5% 40.7% 31.3% 16.2% 1.4% 0.6% Zimbabwe 12.3% 36.2% 35.3% 11.5% 3.5% 0.6% AFRICA AIR 8.8% 27.3% 31.9% 15.4% 6.4% 1.8% Angola 8.7% 31.4% 38.7% 10.5% 6.1% 1.3% Democratic Republic of Congo 11.0% 15.9% 23.5% 22.0% 17.7% 2.9% Ethiopia 4.6% 29.8% 38.1% 17.1% 3.1% Ghana 6.1% 20.9% 44.2% 13.8% 6.0% Kenya 6.0% 25.7% 34.1% 14.6% 5.0% Nigeria 4.8% 25.9% 36.2% 16.7% 2.6% 1.8% Tanzania 7.7% 30.7% 34.6% 11.6% 3.2% 2.7% Turkey 5.2% 31.5% 32.9% 14.8% 6.7% 3.5% Uganda 10.3% 34.7% 26.0% 22.3% 6.7% UAE 7.8% 33.6% 8.2% 16.0% 17.2% Other Africa and Middle East 12.3% 27.9% 26.2% 15.7% 7.0% 2.4% AMERICAS 15.2% 25.6% 21.3% 15.4% 11.2% 9.1% Argentina 9.1% 35.6% 39.8% 12.7% 0.9% Brazil 7.7% 51.4% 29.3% 4.6% 4.1% 1.8% Canada 14.6% 22.4% 20.7% 16.6% 14.3% 8.4% Chile 10.8% 52.8% 18.1% 7.9% 7.9% USA 16.9% 21.2% 19.5% 16.8% 12.4% 10.9% Other Americas 9.3% 31.0% 26.4% 20.0% 4.9% 4.1% ASIA & AUSTRALASIA 9.0% 30.4% 27.1% 16.2% 7.7% 5.1% Australia 11.4% 22.0% 22.3% 14.6% 13.2% 13.9% China including Hong Kong 7.5% 28.0% 33.9% 22.0% 4.4% 2.6% India 8.4% 34.1% 28.3% 16.9% 3.7% 2.0% Japan 6.2% 28.9% 33.5% 16.4% 7.1% 2.0% Malaysia 12.5% 44.1% 21.6% 5.3% 16.4% New Zealand 11.4% 22.8% 22.0% 18.6% 13.6% 11.5% Singapore 5.1% 49.2% 10.3% 3.1% 19.9% South Korea 8.8% 28.1% 33.0% 20.0% 4.8% Other Asia and Australasia 8.7% 39.5% 28.5% 12.7% 3.3% EUROPE 15.1% 28.9% 22.2% 17.8% 8.4% 6.4% Austria 16.0% 25.3% 30.5% 15.7% 9.6% 2.9% Belgium 16.4% 31.1% 20.1% 17.7% 5.3% 9.1% Denmark 19.4% 27.7% 16.9% 15.1% 10.1% 10.7% Finland 20.1% 46.2% 5.3% 15.9% 2.4% 10.1% France 13.2% 28.5% 15.7% 21.6% 10.3% 10.1% Germany 18.8% 27.8% 21.2% 19.8% 6.7% 3.8% Ireland 10.0% 26.6% 31.6% 16.7% 6.9% 6.5% Italy 8.8% 25.0% 24.9% 23.6% 8.9% 7.9% Netherlands 18.7% 30.8% 22.7% 13.8% 8.5% 5.1% Norway 27.5% 24.0% 24.1% 12.4% 5.9% 4.1% Portugal 5.1% 22.8% 38.1% 22.5% 7.3% 4.1% Russian Fed 8.6% 25.5% 30.6% 22.8% 9.0% 2.5% Spain 10.8% 36.3% 26.3% 13.3% 8.6% 4.7% Sweden 11.6% 30.4% 21.8% 16.7% 11.9% 6.1% Switzerland 16.4% 26.8% 28.7% 16.9% 7.9% 3.4% UK 14.8% 28.6% 21.4% 16.6% 9.1% 7.4% Other Europe 10.5% 40.1% 26.1% 12.0% 6.7% 4.6% ALL FOREIGN TOURISTS 17.9% 37.4% 26.7% 10.6% 4.0% 1.9% Notes: Blank cells indicate that the sample is not big enough for a valid statistical interpretation Q Quarterly Tourism Report 25
26 Appendix 5: Repeater rate REPEATER CATEGORIES 2017 First time 2-3 times 4-5 times 6-9 times 10 or more times AFRICA LAND 4.0% 11.2% 12.8% 17.8% 54.2% Botswana 3.9% 8.7% 9.1% 14.7% 63.7% Lesotho 3.1% 13.9% 12.2% 11.1% 59.7% Malawi 10.4% 14.1% 13.0% 29.6% 33.0% Mozambique 4.8% 13.9% 19.3% 16.1% 45.8% Namibia 3.3% 18.1% 13.9% 14.9% 49.7% Swaziland 1.3% 5.8% 3.0% 6.0% 83.9% Zambia 10.5% 10.1% 19.2% 24.7% 35.6% Zimbabwe 4.6% 10.4% 14.2% 29.1% 41.6% AFRICA AIR 32.9% 22.5% 14.3% 13.6% 16.6% Angola 26.0% 18.7% 12.1% 17.6% 25.6% Democratic Republic of Congo 16.4% 19.7% 18.2% 15.1% 30.6% Ethiopia 34.7% 27.6% 11.9% 9.9% 15.9% Ghana 33.1% 27.0% 10.0% 13.1% 16.8% Kenya 29.5% 20.8% 17.2% 18.1% 14.4% Nigeria 36.2% 25.2% 13.4% 13.1% 12.1% Tanzania 26.0% 20.0% 16.8% 18.0% 19.1% Turkey 32.2% 19.8% 23.7% 9.6% 14.6% Uganda 63.2% 22.8% 2.5% 6.8% 4.7% UAE 32.0% 9.0% 17.2% 25.0% 16.8% Other Africa and Middle East 36.3% 23.8% 14.6% 11.3% 14.0% AMERICAS 68.8% 14.4% 7.6% 4.7% 4.4% Argentina 82.3% 12.7% 2.3% 0.9% 1.8% Brazil 85.1% 7.9% 1.7% 1.7% 3.5% Canada 63.1% 14.3% 8.7% 5.2% 8.7% Chile 69.4% 10.3% 6.6% 8.2% 5.4% USA 66.5% 15.6% 8.7% 5.3% 4.0% Other Americas 76.7% 11.7% 4.0% 7.6% ASIA & AUSTRALASIA 54.7% 23.0% 10.6% 6.0% 5.7% Australia 52.0% 16.5% 15.1% 7.5% 8.9% China including Hong Kong 53.5% 33.9% 6.0% 3.0% 3.7% India 58.7% 19.6% 10.7% 6.5% 4.5% Japan 57.3% 31.2% 7.5% 0.9% 3.2% Malaysia 50.4% 28.3% 8.8% 12.5% New Zealand 39.2% 16.2% 22.4% 14.2% 8.1% Singapore 67.8% 24.0% 2.1% 3.1% 3.1% South Korea 56.5% 27.4% 6.1% 5.8% 4.2% Other Asia and Australasia 51.6% 25.1% 9.8% 8.3% 5.1% EUROPE 57.8% 19.6% 10.1% 6.5% 6.1% Austria 63.7% 18.6% 7.7% 6.0% 4.0% Belgium 61.8% 20.7% 8.0% 6.0% 3.4% Denmark 71.1% 14.8% 7.7% 4.3% 2.1% Finland 59.1% 20.7% 10.1% 7.7% 2.4% France 65.3% 19.6% 7.3% 4.7% 3.1% Germany 60.7% 18.9% 10.8% 4.8% 4.7% Ireland 48.0% 26.2% 9.9% 9.4% 6.4% Italy 68.8% 19.8% 5.4% 2.3% 3.7% Netherlands 58.9% 17.9% 12.1% 5.2% 5.9% Norway 69.1% 16.0% 7.8% 1.0% 6.0% Portugal 53.0% 16.5% 13.8% 11.8% 4.9% Russian Fed 66.7% 10.6% 10.3% 7.4% 5.1% Spain 65.7% 15.6% 8.1% 7.4% 3.2% Sweden 71.8% 18.9% 4.7% 2.1% 2.6% Switzerland 63.9% 20.7% 5.1% 7.0% 3.3% UK 46.8% 21.3% 12.6% 9.1% 10.1% Other Europe 66.4% 16.9% 6.9% 3.8% 5.9% ALL FOREIGN TOURISTS 18.1% 13.4% 12.1% 14.8% 41.6% Notes: Blank cells indicate that the sample is not big enough for a valid statistical interpretation Q Quarterly Tourism Report 26
27 REPEATER CATEGORIES 2016 First time 2-3 times 4-5 times 6-9 times Q Quarterly Tourism Report or more times AFRICA LAND 2.0% 6.2% 7.5% 11.2% 53.9% Botswana 0.8% 3.0% 95.7% Lesotho 5.1% 7.2% 2.2% 4.2% 3.3% Malawi 4.1% 5.5% 14.2% 17.2% 43.8% Mozambique 2.8% 14.5% 11.1% 12.2% 47.8% Namibia 1.6% 13.6% 20.5% 22.5% 41.7% Swaziland 1.6% 2.8% 4.4% 91.2% Zambia 2.2% 11.8% 13.4% 15.4% 47.6% Zimbabwe 1.7% 3.5% 10.0% 18.9% 45.8% AFRICA AIR 32.5% 29.3% 12.8% 9.2% 16.2% Angola 20.4% 20.3% 17.5% 16.4% 25.5% Democratic Republic of Congo 28.9% 19.1% 6.6% 13.9% 31.6% Ethiopia 30.2% 47.2% 13.7% 4.4% 4.6% Ghana 26.7% 36.8% 13.3% 6.0% 17.2% Kenya 28.9% 29.7% 17.3% 7.4% 16.6% Nigeria 36.4% 33.2% 11.6% 5.1% 13.7% Tanzania 27.5% 26.1% 16.8% 14.5% 15.1% Turkey 35.7% 37.8% 6.6% 8.4% 11.5% Uganda 55.1% 34.3% 8.9% 1.7% UAE 45.4% 29.6% 25.0% Other Africa and Middle East 34.3% 28.6% 11.9% 9.8% 15.4% AMERICAS 67.8% 19.4% 5.7% 3.6% 3.4% Argentina 76.8% 11.4% 5.8% 6.0% Brazil 68.0% 11.4% 9.8% 4.0% 6.8% Canada 67.6% 22.1% 3.4% 2.8% 4.2% Chile 78.6% 15.1% 2.6% 3.7% USA 67.3% 19.9% 5.9% 3.9% 3.0% Other Americas 81.1% 14.7% 2.4% 1.8% ASIA & AUSTRALASIA 50.9% 29.9% 8.5% 6.2% 4.5% Australia 39.1% 23.8% 15.6% 14.2% 7.3% China including Hong Kong 60.5% 34.5% 2.2% 1.4% 1.4% India 53.0% 30.4% 9.9% 3.1% 3.5% Japan 65.9% 24.2% 2.9% 2.1% 5.0% Malaysia 54.2% 16.6% 8.3% 12.6% 8.3% New Zealand 42.7% 20.3% 14.3% 10.7% 12.0% Singapore 48.9% 21.0% 5.1% 12.5% 12.5% South Korea 42.5% 41.6% 4.1% 4.1% 7.6% Other Asia and Australasia 46.3% 40.8% 6.0% 6.1% 0.8% EUROPE 51.5% 28.1% 8.7% 6.1% 5.7% Austria 62.9% 26.4% 5.6% 1.5% 3.7% Belgium 56.8% 32.7% 7.3% 3.2% Denmark 69.1% 17.8% 4.5% 7.4% 1.3% Finland 73.7% 21.7% 4.6% France 58.1% 30.1% 7.1% 2.9% 1.8% Germany 55.3% 28.4% 8.1% 5.0% 3.2% Ireland 50.3% 26.5% 8.8% 8.0% 6.3% Italy 60.7% 27.2% 7.2% 3.0% 1.9% Netherlands 58.7% 22.6% 7.9% 5.2% 5.6% Norway 77.0% 18.6% 1.8% 2.5% Portugal 54.3% 33.0% 4.4% 6.0% 2.3% Russian Fed 45.7% 42.2% 12.2% Spain 57.3% 35.8% 2.0% 2.9% 2.0% Sweden 62.0% 23.6% 4.1% 4.8% 5.6% Switzerland 74.7% 16.1% 4.4% 2.6% 2.2% UK 36.3% 30.1% 12.6% 10.2% 10.9% Other Europe 58.2% 27.2% 6.2% 2.4% 6.0% ALL FOREIGN TOURISTS 16.3% 12.1% 7.8% 9.7% 40.3% Notes: Blank cells indicate that the sample is not big enough for a valid statistical interpretation
28 REPEATER CATEGORIES 2015 First time 2-3 times 4-5 times 6-9 times 10 or more times AFRICA LAND 1.9% 10.7% 11.1% 15.8% 41.6% Botswana 1.4% 3.9% 2.5% 9.0% 83.1% Lesotho 1.3% 3.4% 4.2% 7.0% 19.4% Malawi 10.0% 12.2% 20.4% 14.0% 32.5% Mozambique 1.2% 15.7% 13.2% 17.4% 47.8% Namibia 3.4% 10.2% 20.7% 26.3% 39.3% Swaziland 4.1% 10.2% 23.6% 61.6% Zambia 4.6% 14.4% 12.7% 20.8% 34.6% Zimbabwe 2.8% 17.1% 15.3% 17.2% 30.3% AFRICA AIR 35.0% 23.6% 14.3% 10.6% 16.3% Angola 23.7% 24.1% 13.8% 9.7% 28.2% Democratic Republic of Congo 37.4% 24.2% 15.7% 16.0% 6.8% Ethiopia 29.9% 25.5% 18.3% 10.0% 16.3% Ghana 51.1% 21.0% 9.4% 12.7% 5.8% Kenya 29.3% 29.2% 15.4% 12.6% 12.5% Nigeria 42.1% 23.9% 13.3% 9.7% 11.0% Tanzania 17.2% 12.9% 26.0% 11.6% 32.3% Turkey 33.8% 31.3% 12.0% 8.4% 14.5% Uganda 63.9% 21.0% 2.9% 5.9% 6.3% UAE 43.5% 11.4% 7.6% 15.3% 22.2% Other Africa and Middle East 38.3% 25.5% 12.2% 10.0% 14.0% AMERICAS 63.3% 17.9% 6.3% 6.5% 5.8% Argentina 66.8% 4.6% 11.0% 16.1% 1.5% Brazil 56.5% 22.3% 7.6% 8.3% 5.3% Canada 61.7% 20.1% 6.3% 5.4% 6.2% Chile 74.1% 4.8% 16.3% 4.8% USA 64.0% 17.4% 6.1% 6.5% 5.8% Other Americas 65.8% 18.5% 10.7% 5.0% ASIA & AUSTRALASIA 48.4% 26.1% 10.0% 8.6% 6.8% Australia 35.5% 26.1% 14.5% 14.4% 9.4% China including Hong Kong 57.7% 28.7% 3.7% 4.6% 5.3% India 58.2% 21.3% 8.5% 6.5% 5.5% Japan 59.2% 22.4% 8.0% 2.5% 7.9% Malaysia 60.3% 14.4% 2.8% 19.7% 2.8% New Zealand 31.1% 37.8% 14.5% 11.1% 5.5% Singapore 32.8% 3.7% 39.1% 20.7% 3.7% South Korea 46.6% 36.3% 10.7% 6.4% Other Asia and Australasia 42.0% 35.6% 9.0% 3.2% 10.2% EUROPE 46.7% 22.3% 10.5% 10.5% 9.9% Austria 41.6% 43.5% 3.5% 3.0% 8.3% Belgium 61.8% 13.5% 2.6% 13.2% 9.0% Denmark 66.3% 15.6% 6.4% 4.8% 6.9% Finland 42.7% 34.1% 6.0% 2.3% 14.9% France 51.5% 25.6% 11.1% 7.4% 4.2% Germany 48.8% 25.0% 9.8% 8.9% 7.4% Ireland 41.1% 27.4% 18.2% 6.9% 6.3% Italy 57.4% 19.3% 8.2% 7.8% 7.3% Netherlands 43.5% 24.4% 10.8% 16.1% 5.1% Norway 76.6% 12.4% 3.7% 1.8% 5.5% Portugal 44.9% 29.4% 11.8% 3.5% 10.3% Russian Fed 54.2% 27.9% 7.9% 7.9% 2.1% Spain 61.7% 21.3% 12.2% 0.8% 4.0% Sweden 57.8% 23.2% 10.7% 6.7% 1.5% Switzerland 45.6% 22.2% 15.4% 9.4% 7.4% UK 38.2% 19.8% 11.4% 13.8% 16.6% Other Europe 59.8% 18.9% 8.9% 7.0% 5.4% ALL FOREIGN TOURISTS 12.6% 13.3% 10.8% 14.3% 34.3% Notes: Blank cells indicate that the sample is not big enough for a valid statistical interpretation Q Quarterly Tourism Report 28
29 Appendix 6: Bed nights per province PROVINCIAL DISTRIBUTION - BEDNIGHTS 2017 Gauteng Western Cape Eastern Cape Kwazulu Natal Mpumalanga Limpopo North West Northern Cape Free State AFRICA LAND Botswana Lesotho Malawi Mozambique Namibia Swaziland Zambia Zimbabwe AFRICA AIR Angola Democratic Republic of Congo Ethiopia Ghana Kenya Nigeria Tanzania Turkey Uganda UAE Other Africa and Middle East AMERICAS Argentina Brazil Canada Chile USA Other Americas ASIA & AUSTRALASIA Australia China including Hong Kong India Japan Malaysia New Zealand Singapore South Korea Other Asia and Australasia EUROPE Austria Belgium Denmark Finland France Germany Ireland Italy Netherlands Norway Portugal Russian Fed Spain Sweden Switzerland UK Other Europe ALL FOREIGN TOURISTS Notes: Blank cells indicate that the sample is not big enough for a valid statistical interpretation Q Quarterly Tourism Report 29
30 PROVINCIAL DISTRIBUTION - BEDNIGHTS 2016 Gauteng Western Cape Eastern Cape Kwazulu Natal Mpumalanga Limpopo North West Northern Cape Free State AFRICA LAND Botswana Lesotho Malawi Mozambique Namibia Swaziland Zambia Zimbabwe AFRICA AIR Angola Democratic Republic of Congo Ethiopia Ghana Kenya Nigeria Tanzania Turkey Uganda UAE Other Africa and Middle East AMERICAS Argentina Brazil Canada Chile USA Other Americas ASIA & AUSTRALASIA Australia China including Hong Kong India Japan Malaysia New Zealand Singapore South Korea Other Asia and Australasia EUROPE Austria Belgium Denmark Finland France Germany Ireland Italy Netherlands Norway Portugal Russian Fed Spain Sweden Switzerland UK Other Europe ALL FOREIGN TOURISTS Notes: Blank cells indicate that the sample is not big enough for a valid statistical interpretation Q Quarterly Tourism Report 30
31 PROVINCIAL DISTRIBUTION - BEDNIGHTS 2015 Gauteng Western Cape Eastern Cape Kwazulu Natal Mpumalanga Limpopo North West Northern Cape Free State AFRICA LAND Botswana Lesotho Malawi Mozambique Namibia Swaziland Zambia Zimbabwe AFRICA AIR Angola Democratic Republic of Congo Ethiopia Ghana Kenya Nigeria Tanzania Turkey Uganda UAE Other Africa and Middle East AMERICAS Argentina Brazil Canada Chile USA Other Americas ASIA & AUSTRALASIA Australia China including Hong Kong India Japan Malaysia New Zealand Singapore South Korea Other Asia and Australasia EUROPE Austria Belgium Denmark Finland France Germany Ireland Italy Netherlands Norway Portugal Russian Fed Spain Sweden Switzerland UK Other Europe ALL FOREIGN TOURISTS Notes: Blank cells indicate that the sample is not big enough for a valid statistical interpretation Q Quarterly Tourism Report 31
32 PROVINCIAL DISTRIBUTION - FORMAL BEDNIGHTS 2017 Gauteng Western Cape Eastern Cape Kwazulu Natal Mpumalanga Limpopo North West Northern Cape Free State AFRICA LAND Botswana Lesotho Malawi Mozambique Namibia Swaziland Zambia Zimbabwe AFRICA AIR Angola Democratic Republic of Congo Ethiopia Ghana Kenya Nigeria Tanzania Turkey Uganda UAE Other Africa and Middle East AMERICAS Argentina Brazil Canada Chile USA Other Americas ASIA & AUSTRALASIA Australia China including Hong Kong India Japan Malaysia New Zealand Singapore South Korea Other Asia and Australasia EUROPE Austria Belgium Denmark Finland France Germany Ireland Italy Netherlands Norway Portugal Russian Fed Spain Sweden Switzerland UK Other Europe ALL FOREIGN TOURISTS Notes: Formal Bednights = Hotels, B&Bs, Guesthouses, Self-catering units, Game Lodges and Backpackers Q Quarterly Tourism Report 32
33 PROVINCIAL DISTRIBUTION - FORMAL BEDNIGHTS 2016 Gauteng Western Cape Eastern Cape Kwazulu Natal Mpumalanga Limpopo North West Northern Cape Free State AFRICA LAND Botswana Lesotho Malawi Mozambique Namibia Swaziland Zambia Zimbabwe AFRICA AIR Angola Democratic Republic of Congo Ethiopia Ghana Kenya Nigeria Tanzania Turkey Uganda UAE Other Africa and Middle East AMERICAS Argentina Brazil Canada Chile USA Other Americas ASIA & AUSTRALASIA Australia China including Hong Kong India Japan Malaysia New Zealand Singapore South Korea Other Asia and Australasia EUROPE Austria Belgium Denmark Finland France Germany Ireland Italy Netherlands Norway Portugal Russian Fed Spain Sweden Switzerland UK Other Europe ALL FOREIGN TOURISTS Notes: Formal Bednights = Hotels, B&Bs, Guesthouses, Self-catering units, Game Lodges and Backpackers Q Quarterly Tourism Report 33
34 PROVINCIAL DISTRIBUTION - FORMAL BEDNIGHTS 2015 Gauteng Western Cape Eastern Cape Kwazulu Natal Mpumalanga Limpopo North West Northern Cape Free State AFRICA LAND Botswana Lesotho Malawi Mozambique Namibia Swaziland Zambia Zimbabwe AFRICA AIR Angola Democratic Republic of Congo Ethiopia Ghana Kenya Nigeria Tanzania Turkey Uganda UAE Other Africa and Middle East AMERICAS Argentina Brazil Canada Chile USA Other Americas ASIA & AUSTRALASIA Australia China including Hong Kong India Japan Malaysia New Zealand Singapore South Korea Other Asia and Australasia EUROPE Austria Belgium Denmark Finland France Germany Ireland Italy Netherlands Norway Portugal Russian Fed Spain Sweden Switzerland UK Other Europe ALL FOREIGN TOURISTS Notes: Formal Bednights = Hotels, B&Bs, Guesthouses, Self-catering units, Game Lodges and Backpackers Q Quarterly Tourism Report 34
35 ACCOMMODATION USAGE - ALL FOREIGN VISITORS 2017 Hotels Guest House B&B Self catering Game Lodge Backpacker Camping Train/ship Hospital Q Quarterly Blank cells Tourism indicate Report that the sample is not big enough for a valid statistical interpretation 35 Friends and family Air B&B Couch Surfing Other AFRICA LAND Botswana Lesotho Malawi Mozambique Namibia Swaziland Zambia Zimbabwe AFRICA AIR Angola Democratic Republic of Congo Ethiopia Ghana Kenya Nigeria Tanzania Turkey Uganda UAE Other Africa and Middle East AMERICAS Argentina Brazil Canada Chile USA Other Americas ASIA & AUSTRALASIA Australia China including Hong Kong India Japan Malaysia New Zealand Singapore South Korea Other Asia and Australasia EUROPE Austria Belgium Denmark Finland France Germany Ireland Italy Netherlands Norway Portugal Russian Fed Spain Sweden Switzerland UK Other Europe ALL FOREIGN TOURISTS Notes:
36 ACCOMMODATION USAGE - ALL FOREIGN VISITORS 2016 Hotels Guest House B&B Self catering Game Lodge Backpacker Camping Train/ship Hospital Q Quarterly Tourism Report 36 Friends and family Air B&B Couch Surfing Other AFRICA LAND Botswana Lesotho Malawi Mozambique Namibia Swaziland Zambia Zimbabwe AFRICA AIR Angola Democratic Republic of Congo Ethiopia Ghana Kenya Nigeria Tanzania Turkey Uganda UAE Other Africa and Middle East AMERICAS Argentina Brazil Canada Chile USA Other Americas ASIA & AUSTRALASIA Australia China including Hong Kong India Japan Malaysia New Zealand Singapore South Korea Other Asia and Australasia EUROPE Austria Belgium Denmark Finland France Germany Ireland Italy Netherlands Norway Portugal Russian Fed Spain Sweden Switzerland UK Other Europe ALL FOREIGN TOURISTS Notes: Blank cells indicate that the sample is not big enough for a valid statistical interpretation
37 ACCOMMODATION USAGE - ALL FOREIGN VISITORS 2015 Hotels Guest House B&B Self catering Game Lodge Backpacker Camping Train/ship Hospital Q Quarterly Blank cells Tourism indicate Report that the sample is not big enough for a valid statistical interpretation 37 Friends and family Air B&B Couch Surfing Other AFRICA LAND Botswana Lesotho Malawi Mozambique Namibia Swaziland Zambia Zimbabwe AFRICA AIR Angola Democratic Republic of Congo Ethiopia Ghana Kenya Nigeria Tanzania Turkey Uganda UAE Other Africa and Middle East AMERICAS Argentina Brazil Canada Chile USA Other Americas ASIA & AUSTRALASIA Australia China including Hong Kong India Japan Malaysia New Zealand Singapore South Korea Other Asia and Australasia EUROPE Austria Belgium Denmark Finland France Germany Ireland Italy Netherlands Norway Portugal Russian Fed Spain Sweden Switzerland UK Other Europe ALL FOREIGN TOURISTS Notes:
38 PROVINCIAL DISTRIBUTION - AVERAGE LENGTH OF STAY 2017 Gauteng Western Cape Eastern Cape Kwazulu Natal Mpumalanga Limpopo North West Northern Cape Free State AFRICA LAND Botswana Lesotho Malawi Mozambique Namibia Swaziland Zambia Zimbabwe AFRICA AIR Angola Democratic Republic of Congo Ethiopia Ghana Kenya Nigeria Tanzania Turkey Uganda UAE Other Africa and Middle East AMERICAS Argentina Brazil Canada Chile USA Other Americas ASIA & AUSTRALASIA Australia China including Hong Kong India Japan Malaysia New Zealand Singapore South Korea Other Asia and Australasia EUROPE Austria Belgium Denmark Finland France Germany Ireland Italy Netherlands Norway Portugal Russian Fed Spain Sweden Switzerland UK Other Europe ALL FOREIGN TOURISTS Notes: Q Quarterly Tourism Report 38
39 PROVINCIAL DISTRIBUTION - AVERAGE LENGTH OF STAY 2016 Gauteng Western Cape Eastern Cape Kwazulu Natal Mpumalanga Limpopo North West Northern Cape Free State AFRICA LAND Botswana Lesotho Malawi Mozambique Namibia Swaziland Zambia Zimbabwe AFRICA AIR Angola Democratic Republic of Congo Ethiopia Ghana Kenya Nigeria Tanzania Turkey Uganda UAE Other Africa and Middle East AMERICAS Argentina Brazil Canada Chile USA Other Americas ASIA & AUSTRALASIA Australia China including Hong Kong India Japan Malaysia New Zealand Singapore South Korea Other Asia and Australasia EUROPE Austria Belgium Denmark Finland France Germany Ireland Italy Netherlands Norway Portugal Russian Fed Spain Sweden Switzerland UK Other Europe ALL FOREIGN TOURISTS Notes: Q Quarterly Tourism Report 39
40 Q Quarterly Tourism Report 40
41 PROVINCIAL DISTRIBUTION - AVERAGE LENGTH OF STAY 2015 Gauteng Western Cape Eastern Cape Kwazulu Natal Mpumalanga Limpopo North West Northern Cape Free State AFRICA LAND Botswana Lesotho Malawi Mozambique Namibia Swaziland Zambia Zimbabwe AFRICA AIR Angola Democratic Republic of Congo Ethiopia Ghana Kenya Nigeria Tanzania Turkey Uganda UAE Other Africa and Middle East AMERICAS Argentina Brazil Canada Chile USA Other Americas ASIA & AUSTRALASIA Australia China including Hong Kong India Japan Malaysia New Zealand Singapore South Korea Other Asia and Australasia EUROPE Austria Belgium Denmark Finland France Germany Ireland Italy Netherlands Norway Portugal Russian Fed Spain Sweden Switzerland UK Other Europe ALL FOREIGN TOURISTS Notes: Q Quarterly Tourism Report 41
42 Q Quarterly Tourism Report TOTAL BEDNIGHTS PAID BEDNIGHTS FORMAL SECTOR BEDNIGHTS Notes: ACCOMMODATION SECTION: OVERALL Paid Bednights = Hotels, guesthouses, bed and breakfasts, self-catering, game lodge, backpackers, camping, train and hospital. Formal Bednights = Hotels, guesthouses, bed and breakfasts, self-catering, game lodge & backpackers. ACCOMMODATION SECTION: ESTABLISHMENTS Hotels Guesthouse Bed and breakfast Self-catering Game lodge Backpackers Camping Train or ship Hospital Visiting friends and family Air B&B Couch Surfing Other AVERAGE LENGTH OF STAY BY ACCOMMODATION TYPE Hotels Guesthouse Bed and breakfast Self-catering Game lodge Backpackers Camping Train or ship Hospital Visiting friends and family Other
43 ACCOMMODATION TYPE BY PROVINCE: BEDNIGHTS 2017 Gauteng Western Cape Eastern Cape Kwazulu Natal Limpopo Mpumalanga North West Northern Cape Free State Hotels Guesthouse Bed and breakfast Self-catering Game lodge Backpackers Camping Train or ship Hospital Visiting friends and family Air B&B Couch Surfing Other ACCOMMODATION TYPE BY PROVINCE: BEDNIGHTS 2016 Gauteng Western Cape Eastern Cape Kwazulu Natal Limpopo Mpumalanga North West Northern Cape Free State Hotels Guesthouse Bed and breakfast Self-catering Game lodge Backpackers Camping Train or ship Hospital Visiting friends and family Other ACCOMMODATION TYPE BY PROVINCE: BEDNIGHTS 2015 Gauteng Western Cape Eastern Cape Kwazulu Natal Limpopo Mpumalanga North West Northern Cape Free State Hotels Guesthouse Bed and breakfast Self-catering Game lodge Backpackers Camping Train or ship Hospital Visiting friends and family Other Q Quarterly Tourism Report 43
44 Appendix 7: Provincial distribution (Share of arrivals) PROVINCIAL DISTRIBUTION - SHARE OF ARRIVALS* 2017 Gauteng Western Cape Eastern Cape Kwazulu Natal Mpumalanga Limpopo North West Northern Cape Free State AFRICA LAND Botswana Lesotho Malawi Mozambique Namibia Swaziland Zambia Zimbabwe AFRICA AIR Angola Democratic Republic of Congo Ethiopia Ghana Kenya Nigeria Tanzania Turkey Uganda UAE Other Africa and Middle East AMERICAS Argentina Brazil Canada Chile USA Other Americas ASIA & AUSTRALASIA Australia China including Hong Kong India Japan Malaysia New Zealand Singapore South Korea Other Asia and Australasia EUROPE Austria Belgium Denmark Finland France Germany Ireland Italy Netherlands Norway Portugal Russian Fed Spain Sweden Switzerland UK Other Europe ALL FOREIGN TOURISTS Notes: Blank cells indicate that no arrivals for that province from that country Q Quarterly Tourism Report 44
45 PROVINCIAL DISTRIBUTION - SHARE OF ARRIVALS* 2016 Gauteng Western Cape Eastern Cape Kwazulu Natal Mpumalanga Limpopo North West Northern Cape Free State AFRICA LAND Botswana Lesotho Malawi Mozambique Namibia Swaziland Zambia Zimbabwe AFRICA AIR Angola Democratic Republic of Congo Ethiopia Ghana Kenya Nigeria Tanzania Turkey Uganda UAE Other Africa and Middle East AMERICAS Argentina Brazil Canada Chile USA Other Americas ASIA & AUSTRALASIA Australia China including Hong Kong India Japan Malaysia New Zealand Singapore South Korea Other Asia and Australasia EUROPE Austria Belgium Denmark Finland France Germany Ireland Italy Netherlands Norway Portugal Russian Fed Spain Sweden Switzerland UK Other Europe ALL FOREIGN TOURISTS Notes: Blank cells indicate that no arrivals for that province from that country Q Quarterly Tourism Report 45
46 PROVINCIAL DISTRIBUTION - SHARE OF ARRIVALS* 2015 Gauteng Western Cape Eastern Cape Kwazulu Natal Mpumalanga Limpopo North West Northern Cape Free State AFRICA LAND Botswana Lesotho Malawi Mozambique Namibia Swaziland Zambia Zimbabwe AFRICA AIR Angola Democratic Republic of Congo Ethiopia Ghana Kenya Nigeria Tanzania Turkey Uganda UAE Other Africa and Middle East AMERICAS Argentina Brazil Canada Chile USA Other Americas ASIA & AUSTRALASIA Australia China including Hong Kong India Japan Malaysia New Zealand Singapore South Korea Other Asia and Australasia EUROPE Austria Belgium Denmark Finland France Germany Ireland Italy Netherlands Norway Portugal Russian Fed Spain Sweden Switzerland UK Other Europe ALL FOREIGN TOURISTS Notes: Blank cells indicate that no arrivals for that province from that country Q Quarterly Tourism Report 46
47 PROVINCIAL SPREAD: PROPORTION OF TOURISTS WHO VISIT MORE THAN ONE PROVINCE AFRICA LAND 9.1% 9.5% 8.9% Botswana 24.3% 29.0% 28.5% Lesotho 6.5% 2.2% 3.2% Malawi 9.0% 8.4% 9.3% Mozambique 13.3% 26.5% 19.1% Namibia 11.0% 4.8% 16.7% Swaziland 2.6% 1.0% 1.6% Zambia 18.3% 2.2% 7.2% Zimbabwe 5.6% 4.2% 2.8% AFRICA AIR 12.6% 9.7% 12.9% Angola 1.7% 5.9% 4.5% Democratic Republic of Congo 12.0% 15.4% 18.4% Ethiopia 1.9% 7.7% 11.9% Ghana 10.1% 7.2% 12.5% Kenya 15.1% 7.4% 15.5% Nigeria 9.9% 5.7% 10.4% Tanzania 12.1% 12.8% 6.6% Turkey 12.1% 6.7% 18.0% Uganda 18.0% 12.9% 15.3% UAE 26.8% 29.6% 34.0% Other Africa and Middle East 20.1% 12.6% 16.0% AMERICAS 39.5% 42.2% 40.6% Argentina 23.7% 39.6% 54.0% Brazil 40.9% 42.7% 58.3% Canada 40.4% 39.0% 43.3% Chile 69.3% 33.8% 48.4% USA 39.3% 42.5% 36.9% Other Americas 39.1% 50.4% 45.0% ASIA & AUSTRALASIA 36.0% 29.5% 31.0% Australia 46.9% 31.3% 38.1% China including Hong Kong 29.9% 41.1% 18.2% India 38.8% 24.7% 36.0% Japan 29.4% 24.8% 22.7% Malaysia 1.8% 20.7% 30.7% New Zealand 47.3% 32.5% 24.2% Singapore 19.1% 30.3% 51.2% South Korea 32.7% 21.6% 31.3% Other Asia and Australasia 16.8% 12.3% 20.0% EUROPE 34.5% 27.1% 32.4% Austria 43.5% 29.3% 30.3% Belgium 40.4% 26.3% 43.4% Denmark 21.7% 25.7% 29.9% Finland 10.6% 24.7% 34.6% France 41.1% 30.9% 33.6% Germany 43.1% 34.6% 39.5% Ireland 45.8% 28.7% 29.4% Italy 32.2% 24.8% 19.0% Netherlands 38.6% 39.8% 35.2% Norway 37.3% 27.0% 26.0% Portugal 33.1% 33.3% 23.7% Russian Fed 22.1% 18.3% 26.2% Spain 34.9% 20.3% 36.1% Sweden 27.8% 25.2% 27.6% Switzerland 40.7% 33.2% 43.2% UK 27.0% 19.7% 28.5% Other Europe 31.1% 16.8% 25.6% ALL FOREIGN TOURISTS 14.2% 13.7% 14.1% Notes: Blank cells indicate that the sample is not big enough for a valid statistical interpretation Q Quarterly Tourism Report 47
48 Appendix 8: Quarterly Spend Tables ESTIMATED TFDS (including Capital Expenditure) in SA Q TFDS (including Capital) R R R Change 5.65% 1.40% ESTIMATED TFDS (excluding Capital Expenditure) in SA Q TFDS (excluding Capital) R R R Change 10.63% 4.43% ESTIMATED TFDS (excluding Capital Expenditure) by CATEGORY IN BILLIONS Q % Change Accommodation R 2.2 R 1.4 R % Transport R 1.2 R 1.0 R % Food and Drink R 2.2 R 2.4 R % Leisure R 1.3 R 1.5 R % Medical R 0.3 R 0.4 R % Shopping R 3.7 R 4.9 R % Resell R 2.8 R 3.5 R % Other R 1.0 R 1.4 R % TFDS (excluding Capital Expenditure) IN BILLIONS by REGION Q % Change Africa Land R 7.1 R 8.1 R % Africa Air R 1.4 R 1.3 R % Americas R 2.1 R 2.1 R % Asia & Australasia R 1.4 R 1.5 R % Europe R 3.4 R 3.9 R % AVERAGE TFDS (excluding Capital Expenditure) by REGION Q % Change Africa Land R R R % Africa Air R R R % Americas R R R % Asia & Australasia R R R % Europe R R R % ESTIMATED TFDS (excluding Capital Expenditure) by CATEGORY IN BILLIONS: AFRICA LAND Q % Change Accommodation R 0.6 R 0.3 R % Transport R 0.5 R 0.4 R % Food and Drink R 0.6 R 0.6 R % Leisure R 0.3 R 0.4 R % Medical R 0.2 R 0.1 R % Shopping R 1.5 R 2.3 R % Resell R 2.7 R 3.2 R % Other R 0.5 R 0.7 R % Q Quarterly Tourism Report 48
49 ESTIMATED TFDS (excluding Capital Expenditure) by CATEGORY IN BILLIONS: AIR MARKETS Q % Change Accommodation R 1.6 R 1.1 R % Transport R 0.8 R 0.6 R % Food and Drink R 1.6 R 1.8 R % Leisure R 1.0 R 1.2 R % Medical R 0.1 R 0.3 R % Shopping R 2.1 R 2.6 R % Resell R 0.1 R 0.3 R % Other R 0.5 R 0.7 R % ESTIMATED TFDS (excluding Capital Expenditure) IN BILLIONS by PROVINCES Q % Change Gauteng R 6.6 R 8.1 R % Western Cape R 3.2 R 3.5 R % Eastern Cape R 0.5 R 0.5 R % Kwa Zulu Natal R 1.1 R 1.2 R % Mpumalanga R 1.1 R 1.1 R % Limpopo R 1.4 R 1.6 R % North West R 0.8 R 0.4 R % Northern Cape R 0.2 R 0.1 R % Free State R 0.3 R 0.3 R % MAJOR CURRENCY AVERAGE EXCHANGE RATE Q % Change Pound R R R % Euro R R R % USD R R R % Australia R 9.39 R R % Canada R 9.82 R R % Brazil R 3.93 R 4.27 R % China R 1.97 R 2.30 R % Botswana R 1.20 R 1.35 R % India R 0.19 R 0.22 R % Mozambique R 0.33 R 0.27 R % Kenya R 0.12 R 0.15 R % Japan R 0.10 R 0.14 R % Angola R 0.11 R 0.09 R % Nigeria R 0.06 R 0.07 R % DRC R 0.01 R 0.02 R % Q Quarterly Tourism Report 49
50 Appendix 11: Activities undertaken in South Africa Shopping Nightlife Eating out Entertainment Social Visiting natural attractions ACTIVITIES UNDERTAKEN WHILE IN SOUTH AFRICA 2017 Cultural, historical and heritage Wildlife Beach Church Business Adventure Education training study Theme parks Trading Medical AFRICA LAND 65.3% 42.7% 33.1% 5.5% 35.7% 2.5% 5.6% 1.0% 3.1% 10.1% 3.3% 0.6% 3.7% 1.4% 3.1% 2.8% Botswana 38.0% 43.4% 30.5% 5.0% 19.8% 1.6% 0.5% 0.2% 4.8% 13.4% 3.9% 1.0% 2.5% 0.7% 1.6% 1.3% Lesotho 51.6% 25.5% 17.9% 2.7% 32.7% 0.9% 0.6% 0.2% 1.0% 20.6% 1.8% 0.8% 8.5% 0.4% 0.0% 5.2% Malawi 83.5% 54.8% 42.0% 9.3% 17.7% 1.1% 1.5% 0.7% 3.6% 8.5% 8.8% 0.2% 3.6% 3.9% 5.2% 0.3% Mozambique 84.9% 61.4% 48.3% 9.8% 71.1% 5.4% 23.7% 1.1% 0.6% 6.2% 2.6% 0.6% 1.2% 3.2% 6.0% 2.1% Namibia 27.4% 33.9% 21.7% 4.9% 45.3% 7.6% 5.7% 2.9% 12.0% 3.2% 12.9% 3.0% 5.9% 2.5% 0.3% 3.1% Swaziland 61.4% 34.1% 26.6% 3.9% 42.8% 1.0% 0.5% 0.7% 7.3% 8.2% 1.8% 0.0% 2.2% 0.8% 0.0% 2.0% Zambia 76.7% 36.8% 28.4% 5.6% 12.0% 2.5% 6.7% 0.9% 7.7% 9.0% 14.8% 0.2% 3.9% 1.4% 10.5% 0.9% Zimbabwe 77.8% 50.0% 41.4% 5.8% 20.0% 2.4% 2.3% 1.9% 2.7% 4.1% 2.9% 0.5% 1.7% 1.3% 5.4% 2.4% AFRICA AIR 85.5% 89.6% 68.1% 12.0% 47.6% 22.5% 18.8% 12.4% 14.3% 9.3% 30.5% 5.4% 13.0% 7.4% 1.0% 4.9% Angola 87.7% 100.0% 89.5% 17.5% 54.2% 19.8% 15.7% 13.5% 14.0% 5.2% 10.7% 7.9% 7.7% 3.8% 2.6% 13.0% Democratic Republic of Congo 93.2% 88.6% 77.0% 10.8% 79.9% 9.5% 10.5% 2.6% 9.4% 21.8% 23.6% 1.9% 10.4% 1.8% 0.0% 9.1% Ethiopia 91.2% 62.8% 49.2% 9.4% 49.4% 18.5% 26.5% 10.8% 11.9% 9.1% 33.8% 4.3% 12.8% 7.7% 0.0% 3.1% Ghana 83.6% 61.9% 56.6% 2.0% 36.7% 15.8% 24.9% 5.1% 10.1% 12.1% 40.7% 3.7% 14.1% 7.4% 1.0% 0.0% Kenya 83.0% 73.7% 53.0% 9.5% 35.9% 21.3% 20.6% 7.8% 15.2% 8.5% 44.7% 5.8% 24.0% 10.3% 0.0% 3.2% Nigeria 85.1% 77.6% 55.8% 10.8% 46.5% 19.7% 15.9% 4.5% 11.6% 12.3% 29.5% 1.9% 13.3% 7.0% 1.3% 1.8% Tanzania 89.1% 78.3% 57.7% 10.9% 50.6% 12.1% 18.9% 3.6% 9.1% 6.6% 37.7% 1.8% 15.5% 8.4% 1.8% 2.7% Turkey 86.1% 55.2% 47.1% 3.5% 45.0% 13.0% 24.8% 6.3% 9.6% 14.8% 43.3% 0.0% 16.3% 6.9% 0.0% 4.8% Uganda 77.1% 100.0% 87.2% 4.8% 31.2% 37.7% 30.6% 31.0% 22.1% 0.0% 50.3% 8.5% 4.7% 13.5% 0.0% 2.5% UAE 65.6% 100.0% 92.2% 17.2% 57.8% 57.0% 16.0% 9.0% 33.6% 0.0% 17.2% 33.6% 9.0% 0.0% 0.0% 0.0% Other Africa and Middle East 84.3% 98.0% 72.9% 14.9% 44.8% 30.3% 19.1% 20.7% 17.6% 7.8% 29.7% 7.4% 12.6% 8.6% 0.8% 4.5% AMERICAS 70.2% 100.0% 77.8% 10.7% 36.8% 56.6% 47.3% 59.2% 33.1% 4.0% 16.9% 22.9% 8.5% 14.1% 1.6% 1.5% Argentina 84.0% 82.3% 74.5% 2.3% 20.6% 57.7% 55.0% 58.2% 37.7% 0.0% 17.3% 16.8% 0.9% 22.2% 0.0% 0.0% Brazil 82.1% 100.0% 83.1% 12.7% 32.2% 66.7% 61.0% 68.7% 39.8% 2.6% 26.4% 22.3% 4.8% 18.5% 0.0% 1.1% Canada 77.1% 100.0% 88.1% 12.1% 42.8% 64.5% 49.4% 61.5% 42.0% 3.7% 16.9% 26.2% 7.7% 17.4% 0.5% 2.8% Chile 80.6% 100.0% 88.5% 6.6% 32.7% 52.0% 62.0% 62.0% 28.5% 2.5% 23.5% 33.1% 2.5% 26.5% 0.0% 0.0% USA 66.4% 98.9% 75.5% 10.4% 37.3% 54.0% 44.5% 57.8% 30.8% 4.5% 14.8% 23.1% 9.6% 12.5% 2.0% 1.4% Other Americas 83.4% 100.0% 80.0% 11.2% 35.8% 55.1% 46.0% 48.2% 33.8% 0.3% 28.9% 11.6% 7.7% 15.6% 0.9% 0.7% ASIA & AUSTRALASIA 78.5% 100.0% 78.0% 12.8% 34.4% 40.7% 29.2% 35.4% 23.6% 3.6% 28.6% 15.2% 5.1% 11.3% 0.6% 1.0% Australia 72.1% 100.0% 78.8% 11.9% 44.9% 49.4% 40.6% 50.0% 29.2% 1.9% 10.4% 18.8% 4.7% 8.1% 0.7% 1.0% China including Hong Kong 83.7% 100.0% 90.0% 9.1% 14.8% 27.0% 14.7% 16.4% 10.6% 1.6% 26.5% 6.9% 4.2% 9.0% 0.3% 1.6% India 79.1% 95.0% 72.4% 14.4% 32.1% 40.5% 27.0% 33.1% 25.5% 3.4% 45.6% 18.3% 3.3% 14.2% 0.3% 0.7% Japan 79.7% 89.5% 78.9% 3.3% 12.4% 39.4% 19.6% 23.8% 19.2% 1.0% 37.0% 10.1% 4.1% 13.1% 0.0% 0.0% Malaysia 91.0% 100.0% 73.3% 12.5% 50.0% 62.9% 53.7% 59.2% 35.8% 3.5% 19.7% 21.3% 12.5% 7.2% 0.0% 0.0% New Zealand 74.6% 100.0% 84.6% 16.1% 55.1% 44.6% 32.9% 52.4% 31.6% 3.7% 16.6% 14.5% 7.2% 12.2% 1.1% 1.1% Singapore 80.1% 92.6% 79.1% 10.4% 52.9% 59.2% 29.9% 45.9% 35.4% 5.1% 4.1% 26.2% 0.0% 12.5% 0.0% 0.0% South Korea 83.9% 94.9% 85.2% 6.8% 14.9% 42.8% 16.1% 12.8% 18.1% 1.7% 22.5% 7.0% 1.5% 29.4% 1.7% 2.9% Other Asia and Australasia 79.0% 99.7% 64.8% 24.7% 49.6% 29.3% 34.0% 36.2% 21.1% 13.8% 44.6% 11.4% 14.8% 8.3% 1.8% 1.6% EUROPE 74.5% 100.0% 85.5% 13.5% 39.2% 55.8% 42.9% 57.4% 41.2% 2.7% 22.0% 27.2% 7.2% 15.0% 1.4% 1.6% Austria 78.8% 100.0% 87.0% 10.7% 39.2% 53.0% 40.3% 56.7% 43.3% 5.0% 36.4% 34.4% 9.6% 21.4% 0.0% 1.0% Belgium 75.4% 100.0% 86.9% 17.7% 41.0% 60.7% 48.9% 62.7% 42.1% 4.8% 24.7% 36.1% 12.0% 15.3% 3.0% 1.7% Denmark 71.8% 100.0% 79.6% 12.4% 32.4% 57.5% 43.2% 71.6% 34.3% 0.8% 22.6% 30.3% 7.7% 11.6% 3.0% 1.6% Finland 79.3% 100.0% 94.7% 12.6% 46.2% 61.7% 47.7% 59.1% 47.1% 2.9% 25.5% 43.3% 15.4% 20.7% 2.9% 7.7% France 69.7% 100.0% 82.7% 12.0% 27.7% 59.3% 42.6% 63.5% 38.4% 1.3% 25.4% 25.4% 7.0% 18.2% 0.8% 1.3% Germany 75.6% 100.0% 87.5% 13.4% 39.1% 60.4% 48.3% 63.9% 49.1% 2.9% 19.2% 30.6% 8.3% 17.7% 1.4% 1.7% Ireland 81.9% 100.0% 90.3% 18.5% 42.4% 58.5% 42.2% 44.7% 41.1% 2.9% 18.1% 27.8% 3.0% 12.5% 0.6% 0.0% Italy 44.7% 82.3% 63.2% 12.2% 29.2% 47.7% 30.5% 55.0% 35.3% 4.0% 25.3% 20.5% 7.3% 11.8% 1.3% 0.0% Netherlands 76.1% 100.0% 90.0% 14.8% 42.6% 59.9% 44.2% 62.6% 43.3% 2.9% 18.0% 33.1% 9.0% 14.4% 2.1% 3.1% Norway 82.5% 100.0% 86.9% 14.8% 33.4% 57.3% 46.5% 56.7% 43.1% 6.2% 14.8% 34.9% 14.2% 12.3% 0.8% 1.9% Portugal 71.9% 100.0% 80.3% 12.0% 39.7% 35.4% 32.9% 52.2% 37.1% 1.2% 28.3% 21.3% 3.6% 7.8% 1.2% 0.7% Russian Fed 73.5% 100.0% 91.8% 7.6% 28.4% 39.5% 32.6% 42.6% 33.3% 1.2% 43.2% 11.0% 4.2% 16.8% 0.0% 0.0% Spain 73.3% 100.0% 82.7% 14.0% 28.1% 55.5% 52.4% 57.8% 41.3% 1.8% 29.5% 26.0% 1.7% 9.5% 2.1% 0.0% Sweden 79.5% 100.0% 85.8% 9.7% 33.1% 57.5% 43.0% 62.8% 42.6% 2.1% 32.4% 25.6% 6.2% 20.5% 1.1% 1.5% Switzerland 78.9% 100.0% 91.2% 13.0% 41.3% 62.2% 43.4% 58.3% 44.6% 3.1% 25.8% 30.4% 7.0% 23.1% 1.1% 2.1% UK 77.1% 100.0% 86.5% 13.7% 46.5% 52.8% 40.2% 50.4% 38.9% 2.7% 17.8% 24.4% 6.0% 12.2% 1.4% 1.7% Other Europe 80.2% 100.0% 85.5% 14.8% 31.5% 48.1% 45.9% 53.2% 32.6% 2.7% 37.0% 21.8% 11.2% 17.3% 0.5% 1.9% ALL FOREIGN TOURISTS 67.7% 57.5% 44.0% 7.1% 36.4% 13.2% 13.1% 11.9% 9.9% 8.7% 7.9% 5.4% 4.6% 4.1% 2.7% 2.6% Notes: Blank cells indicate that the sample is not big enough for a valid statistical interpretation. Eating out, Entertainment and Church added in 2016 questionnaire to provide more detail. Q Quarterly Tourism Report 50
51 Shopping Nightlife Eating out Entertainment Social Visiting natural attractions ACTIVITIES UNDERTAKEN WHILE IN SOUTH AFRICA 2016 Cultural, historical and heritage Wildlife Beach Church Business Adventure Education training study Theme parks Trading Medical AFRICA LAND 65.3% 42.7% 33.1% 5.5% 35.7% 2.5% 5.6% 1.0% 3.1% 10.1% 3.3% 0.6% 3.7% 1.4% 3.1% 2.8% Botswana 38.0% 43.4% 30.5% 5.0% 19.8% 1.6% 0.5% 0.2% 4.8% 13.4% 3.9% 1.0% 2.5% 0.7% 1.6% 1.3% Lesotho 51.6% 25.5% 17.9% 2.7% 32.7% 0.9% 0.6% 0.2% 1.0% 20.6% 1.8% 0.8% 8.5% 0.4% 0.0% 5.2% Malawi 83.5% 54.8% 42.0% 9.3% 17.7% 1.1% 1.5% 0.7% 3.6% 8.5% 8.8% 0.2% 3.6% 3.9% 5.2% 0.3% Mozambique 84.9% 61.4% 48.3% 9.8% 71.1% 5.4% 23.7% 1.1% 0.6% 6.2% 2.6% 0.6% 1.2% 3.2% 6.0% 2.1% Namibia 27.4% 33.9% 21.7% 4.9% 45.3% 7.6% 5.7% 2.9% 12.0% 3.2% 12.9% 3.0% 5.9% 2.5% 0.3% 3.1% Swaziland 61.4% 34.1% 26.6% 3.9% 42.8% 1.0% 0.5% 0.7% 7.3% 8.2% 1.8% 0.0% 2.2% 0.8% 0.0% 2.0% Zambia 76.7% 36.8% 28.4% 5.6% 12.0% 2.5% 6.7% 0.9% 7.7% 9.0% 14.8% 0.2% 3.9% 1.4% 10.5% 0.9% Zimbabwe 77.8% 50.0% 41.4% 5.8% 20.0% 2.4% 2.3% 1.9% 2.7% 4.1% 2.9% 0.5% 1.7% 1.3% 5.4% 2.4% AFRICA AIR 85.5% 89.6% 68.1% 12.0% 47.6% 22.5% 18.8% 12.4% 14.3% 9.3% 30.5% 5.4% 13.0% 7.4% 1.0% 4.9% Angola 87.7% 100.0% 89.5% 17.5% 54.2% 19.8% 15.7% 13.5% 14.0% 5.2% 10.7% 7.9% 7.7% 3.8% 2.6% 13.0% Democratic Republic of Congo 93.2% 88.6% 77.0% 10.8% 79.9% 9.5% 10.5% 2.6% 9.4% 21.8% 23.6% 1.9% 10.4% 1.8% 0.0% 9.1% Ethiopia 91.2% 62.8% 49.2% 9.4% 49.4% 18.5% 26.5% 10.8% 11.9% 9.1% 33.8% 4.3% 12.8% 7.7% 0.0% 3.1% Ghana 83.6% 61.9% 56.6% 2.0% 36.7% 15.8% 24.9% 5.1% 10.1% 12.1% 40.7% 3.7% 14.1% 7.4% 1.0% 0.0% Kenya 83.0% 73.7% 53.0% 9.5% 35.9% 21.3% 20.6% 7.8% 15.2% 8.5% 44.7% 5.8% 24.0% 10.3% 0.0% 3.2% Nigeria 85.1% 77.6% 55.8% 10.8% 46.5% 19.7% 15.9% 4.5% 11.6% 12.3% 29.5% 1.9% 13.3% 7.0% 1.3% 1.8% Tanzania 89.1% 78.3% 57.7% 10.9% 50.6% 12.1% 18.9% 3.6% 9.1% 6.6% 37.7% 1.8% 15.5% 8.4% 1.8% 2.7% Turkey 86.1% 55.2% 47.1% 3.5% 45.0% 13.0% 24.8% 6.3% 9.6% 14.8% 43.3% 0.0% 16.3% 6.9% 0.0% 4.8% Uganda 77.1% 100.0% 87.2% 4.8% 31.2% 37.7% 30.6% 31.0% 22.1% 0.0% 50.3% 8.5% 4.7% 13.5% 0.0% 2.5% UAE 65.6% 100.0% 92.2% 17.2% 57.8% 57.0% 16.0% 9.0% 33.6% 0.0% 17.2% 33.6% 9.0% 0.0% 0.0% 0.0% Other Africa and Middle East 84.3% 98.0% 72.9% 14.9% 44.8% 30.3% 19.1% 20.7% 17.6% 7.8% 29.7% 7.4% 12.6% 8.6% 0.8% 4.5% AMERICAS 70.2% 100.0% 77.8% 10.7% 36.8% 56.6% 47.3% 59.2% 33.1% 4.0% 16.9% 22.9% 8.5% 14.1% 1.6% 1.5% Argentina 84.0% 82.3% 74.5% 2.3% 20.6% 57.7% 55.0% 58.2% 37.7% 0.0% 17.3% 16.8% 0.9% 22.2% 0.0% 0.0% Brazil 82.1% 100.0% 83.1% 12.7% 32.2% 66.7% 61.0% 68.7% 39.8% 2.6% 26.4% 22.3% 4.8% 18.5% 0.0% 1.1% Canada 77.1% 100.0% 88.1% 12.1% 42.8% 64.5% 49.4% 61.5% 42.0% 3.7% 16.9% 26.2% 7.7% 17.4% 0.5% 2.8% Chile 80.6% 100.0% 88.5% 6.6% 32.7% 52.0% 62.0% 62.0% 28.5% 2.5% 23.5% 33.1% 2.5% 26.5% 0.0% 0.0% USA 66.4% 98.9% 75.5% 10.4% 37.3% 54.0% 44.5% 57.8% 30.8% 4.5% 14.8% 23.1% 9.6% 12.5% 2.0% 1.4% Other Americas 83.4% 100.0% 80.0% 11.2% 35.8% 55.1% 46.0% 48.2% 33.8% 0.3% 28.9% 11.6% 7.7% 15.6% 0.9% 0.7% ASIA & AUSTRALASIA 78.5% 100.0% 78.0% 12.8% 34.4% 40.7% 29.2% 35.4% 23.6% 3.6% 28.6% 15.2% 5.1% 11.3% 0.6% 1.0% Australia 72.1% 100.0% 78.8% 11.9% 44.9% 49.4% 40.6% 50.0% 29.2% 1.9% 10.4% 18.8% 4.7% 8.1% 0.7% 1.0% China including Hong Kong 83.7% 100.0% 90.0% 9.1% 14.8% 27.0% 14.7% 16.4% 10.6% 1.6% 26.5% 6.9% 4.2% 9.0% 0.3% 1.6% India 79.1% 95.0% 72.4% 14.4% 32.1% 40.5% 27.0% 33.1% 25.5% 3.4% 45.6% 18.3% 3.3% 14.2% 0.3% 0.7% Japan 79.7% 89.5% 78.9% 3.3% 12.4% 39.4% 19.6% 23.8% 19.2% 1.0% 37.0% 10.1% 4.1% 13.1% 0.0% 0.0% Malaysia 91.0% 100.0% 73.3% 12.5% 50.0% 62.9% 53.7% 59.2% 35.8% 3.5% 19.7% 21.3% 12.5% 7.2% 0.0% 0.0% New Zealand 74.6% 100.0% 84.6% 16.1% 55.1% 44.6% 32.9% 52.4% 31.6% 3.7% 16.6% 14.5% 7.2% 12.2% 1.1% 1.1% Singapore 80.1% 92.6% 79.1% 10.4% 52.9% 59.2% 29.9% 45.9% 35.4% 5.1% 4.1% 26.2% 0.0% 12.5% 0.0% 0.0% South Korea 83.9% 94.9% 85.2% 6.8% 14.9% 42.8% 16.1% 12.8% 18.1% 1.7% 22.5% 7.0% 1.5% 29.4% 1.7% 2.9% Other Asia and Australasia 79.0% 99.7% 64.8% 24.7% 49.6% 29.3% 34.0% 36.2% 21.1% 13.8% 44.6% 11.4% 14.8% 8.3% 1.8% 1.6% EUROPE 74.5% 100.0% 85.5% 13.5% 39.2% 55.8% 42.9% 57.4% 41.2% 2.7% 22.0% 27.2% 7.2% 15.0% 1.4% 1.6% Austria 78.8% 100.0% 87.0% 10.7% 39.2% 53.0% 40.3% 56.7% 43.3% 5.0% 36.4% 34.4% 9.6% 21.4% 0.0% 1.0% Belgium 75.4% 100.0% 86.9% 17.7% 41.0% 60.7% 48.9% 62.7% 42.1% 4.8% 24.7% 36.1% 12.0% 15.3% 3.0% 1.7% Denmark 71.8% 100.0% 79.6% 12.4% 32.4% 57.5% 43.2% 71.6% 34.3% 0.8% 22.6% 30.3% 7.7% 11.6% 3.0% 1.6% Finland 79.3% 100.0% 94.7% 12.6% 46.2% 61.7% 47.7% 59.1% 47.1% 2.9% 25.5% 43.3% 15.4% 20.7% 2.9% 7.7% France 69.7% 100.0% 82.7% 12.0% 27.7% 59.3% 42.6% 63.5% 38.4% 1.3% 25.4% 25.4% 7.0% 18.2% 0.8% 1.3% Germany 75.6% 100.0% 87.5% 13.4% 39.1% 60.4% 48.3% 63.9% 49.1% 2.9% 19.2% 30.6% 8.3% 17.7% 1.4% 1.7% Ireland 81.9% 100.0% 90.3% 18.5% 42.4% 58.5% 42.2% 44.7% 41.1% 2.9% 18.1% 27.8% 3.0% 12.5% 0.6% 0.0% Italy 44.7% 82.3% 63.2% 12.2% 29.2% 47.7% 30.5% 55.0% 35.3% 4.0% 25.3% 20.5% 7.3% 11.8% 1.3% 0.0% Netherlands 76.1% 100.0% 90.0% 14.8% 42.6% 59.9% 44.2% 62.6% 43.3% 2.9% 18.0% 33.1% 9.0% 14.4% 2.1% 3.1% Norway 82.5% 100.0% 86.9% 14.8% 33.4% 57.3% 46.5% 56.7% 43.1% 6.2% 14.8% 34.9% 14.2% 12.3% 0.8% 1.9% Portugal 71.9% 100.0% 80.3% 12.0% 39.7% 35.4% 32.9% 52.2% 37.1% 1.2% 28.3% 21.3% 3.6% 7.8% 1.2% 0.7% Russian Fed 73.5% 100.0% 91.8% 7.6% 28.4% 39.5% 32.6% 42.6% 33.3% 1.2% 43.2% 11.0% 4.2% 16.8% 0.0% 0.0% Spain 73.3% 100.0% 82.7% 14.0% 28.1% 55.5% 52.4% 57.8% 41.3% 1.8% 29.5% 26.0% 1.7% 9.5% 2.1% 0.0% Sweden 79.5% 100.0% 85.8% 9.7% 33.1% 57.5% 43.0% 62.8% 42.6% 2.1% 32.4% 25.6% 6.2% 20.5% 1.1% 1.5% Switzerland 78.9% 100.0% 91.2% 13.0% 41.3% 62.2% 43.4% 58.3% 44.6% 3.1% 25.8% 30.4% 7.0% 23.1% 1.1% 2.1% UK 77.1% 100.0% 86.5% 13.7% 46.5% 52.8% 40.2% 50.4% 38.9% 2.7% 17.8% 24.4% 6.0% 12.2% 1.4% 1.7% Other Europe 80.2% 100.0% 85.5% 14.8% 31.5% 48.1% 45.9% 53.2% 32.6% 2.7% 37.0% 21.8% 11.2% 17.3% 0.5% 1.9% ALL FOREIGN TOURISTS 67.7% 57.5% 44.0% 7.1% 36.4% 13.2% 13.1% 11.9% 9.9% 8.7% 7.9% 5.4% 4.6% 4.1% 2.7% 2.6% Notes: Blank cells indicate that the sample is not big enough for a valid statistical interpretation. Eating out, Entertainment and Church added in 2016 questionnaire to provide more detail. Q Quarterly Tourism Report 51
52 Shopping Nightlife Eating out Entertainment Social ACTIVITIES UNDERTAKEN WHILE IN SOUTH AFRICA 2015 Visiting natural attractions Cultural, historical and heritage Wildlife Beach Church Business Adventure Education training study Theme parks Trading Medical AFRICA LAND 44.5% 10.9% 52.3% 2.1% 2.6% 1.3% 3.4% 9.3% 1.2% 4.3% 0.7% 4.5% 3.8% Botswana 48.0% 17.7% 56.9% 1.7% 3.8% 4.0% 2.1% 17.2% 1.6% 2.1% 0.1% 5.7% 4.5% Lesotho 29.1% 14.8% 70.4% 1.2% 1.1% 0.0% 1.4% 5.8% 1.4% 7.7% 0.9% 1.4% 6.7% Malawi 51.6% 7.8% 35.7% 4.8% 5.4% 0.4% 6.0% 12.7% 0.9% 2.8% 0.2% 8.7% 2.1% Mozambique 40.0% 10.8% 54.7% 1.7% 3.4% 1.3% 0.5% 7.5% 0.5% 1.7% 0.6% 9.2% 2.3% Namibia 35.8% 28.0% 52.1% 11.4% 5.7% 4.1% 21.7% 13.8% 4.8% 10.2% 3.4% 0.5% 4.0% Swaziland 13.2% 6.1% 61.4% 2.5% 2.2% 3.7% 6.7% 7.7% 2.5% 6.8% 1.1% 1.7% 3.9% Zambia 64.1% 20.1% 28.6% 2.9% 9.6% 1.6% 10.2% 23.8% 1.7% 6.1% 0.8% 9.4% 1.5% Zimbabwe 68.2% 5.4% 35.9% 1.7% 1.7% 0.3% 3.0% 9.5% 0.5% 2.3% 0.4% 4.2% 2.7% AFRICA AIR 74.7% 52.8% 40.5% 15.5% 13.1% 9.4% 13.1% 37.8% 5.1% 14.5% 4.4% 1.5% 5.7% Angola 86.1% 50.0% 45.7% 12.3% 10.3% 3.6% 6.6% 20.8% 2.1% 12.8% 5.2% 1.4% 13.5% Democratic Republic of Congo 71.3% 56.3% 68.3% 9.7% 12.6% 6.8% 12.0% 25.7% 3.4% 18.6% 3.5% 2.3% 14.1% Ethiopia 68.1% 38.3% 31.9% 6.5% 2.1% 2.1% 0.0% 59.9% 6.5% 23.3% 0.0% 0.0% 2.1% Ghana 83.4% 53.9% 38.0% 3.8% 6.9% 6.9% 12.0% 45.6% 1.3% 20.1% 5.1% 0.0% 2.5% Kenya 60.1% 45.6% 24.5% 8.0% 10.1% 6.0% 18.3% 64.5% 4.7% 22.5% 2.0% 1.0% 1.6% Nigeria 78.0% 44.5% 44.0% 8.8% 13.6% 4.2% 7.1% 32.5% 1.5% 12.1% 5.0% 0.9% 5.1% Tanzania 71.6% 49.8% 53.5% 5.8% 5.9% 1.8% 23.5% 33.8% 0.5% 17.2% 1.8% 8.2% 2.7% Turkey 72.3% 46.9% 27.8% 10.8% 14.4% 0.0% 14.5% 48.2% 2.4% 20.4% 9.7% 0.0% 7.3% Uganda 64.8% 77.7% 6.1% 31.4% 6.0% 18.6% 10.3% 80.7% 9.9% 3.4% 0.0% 0.0% 0.0% UAE 54.0% 56.4% 38.9% 36.5% 4.7% 22.3% 26.2% 33.3% 13.5% 5.5% 2.4% 0.0% 0.0% Other Africa and Middle East 73.5% 60.9% 34.6% 29.6% 20.2% 21.1% 17.3% 38.9% 11.7% 12.8% 5.9% 0.0% 3.1% AMERICAS 61.9% 51.9% 29.2% 56.1% 42.0% 52.4% 27.8% 20.7% 23.9% 12.2% 7.6% 1.1% 1.7% Argentina 77.9% 91.4% 32.1% 39.1% 25.7% 28.8% 32.3% 52.5% 3.3% 3.3% 1.6% 0.0% 0.0% Brazil 73.1% 64.3% 25.8% 51.9% 38.6% 53.2% 25.7% 34.6% 19.3% 9.9% 11.7% 0.6% 1.2% Canada 62.2% 51.1% 28.8% 58.8% 37.6% 56.2% 30.8% 18.3% 32.2% 9.5% 10.8% 0.0% 0.3% Chile 100.0% 78.9% 47.0% 69.3% 43.4% 48.2% 25.9% 43.4% 38.6% 4.8% 0.0% 0.0% 0.0% USA 60.4% 50.2% 29.5% 56.3% 43.1% 52.2% 27.2% 19.1% 23.5% 13.0% 7.0% 1.3% 1.9% Other Americas 68.0% 61.6% 27.9% 50.0% 42.5% 49.0% 39.3% 33.7% 14.9% 7.2% 1.0% 0.1% 1.6% ASIA & AUSTRALASIA 72.5% 62.3% 34.6% 44.2% 27.8% 38.1% 24.4% 39.2% 14.7% 3.5% 7.2% 0.3% 1.1% Australia 68.1% 55.3% 50.4% 48.7% 33.3% 46.9% 29.0% 18.3% 16.2% 1.8% 9.9% 0.2% 1.0% China including Hong Kong 69.4% 66.1% 23.5% 43.1% 26.2% 31.3% 17.2% 47.9% 3.8% 1.7% 5.4% 0.0% 0.2% India 75.3% 67.5% 20.6% 37.1% 26.2% 40.6% 18.8% 60.1% 14.3% 5.6% 7.7% 0.0% 0.3% Japan 76.1% 68.6% 14.2% 59.4% 15.6% 30.9% 26.7% 44.3% 32.2% 0.9% 2.9% 0.0% 0.3% Malaysia 60.0% 64.0% 31.0% 39.7% 9.0% 19.9% 19.7% 24.9% 12.5% 3.7% 8.1% 0.0% 6.3% New Zealand 82.8% 61.7% 58.9% 50.0% 43.3% 40.5% 26.2% 22.8% 31.7% 1.7% 3.9% 4.5% 0.6% Singapore 93.8% 46.8% 64.7% 47.2% 24.0% 25.3% 67.6% 24.0% 21.9% 0.0% 10.3% 0.0% 0.0% South Korea 82.9% 67.7% 54.7% 65.4% 45.4% 47.3% 35.2% 17.5% 34.7% 27.9% 10.7% 0.0% 17.2% Other Asia and Australasia 72.2% 56.7% 39.7% 34.4% 16.5% 24.0% 29.4% 43.8% 7.5% 1.6% 3.9% 0.5% 0.1% EUROPE 65.1% 63.8% 34.1% 51.8% 31.8% 45.3% 33.0% 27.6% 21.3% 5.7% 7.1% 0.5% 0.8% Austria 71.8% 71.7% 37.6% 53.7% 48.0% 53.1% 41.9% 20.8% 28.8% 7.8% 9.3% 0.0% 4.1% Belgium 72.5% 77.8% 28.1% 64.3% 45.0% 60.3% 45.7% 25.8% 28.2% 7.9% 16.2% 0.0% 0.7% Denmark 58.3% 56.6% 21.0% 50.4% 32.0% 52.8% 24.6% 32.5% 18.0% 2.4% 6.4% 0.8% 1.6% Finland 86.5% 69.7% 33.5% 57.4% 30.1% 62.6% 51.5% 24.9% 39.3% 14.8% 8.4% 2.8% 2.8% France 58.2% 54.2% 21.5% 48.7% 33.3% 51.6% 30.0% 28.6% 18.8% 3.9% 6.5% 0.4% 0.5% Germany 64.2% 64.2% 29.3% 60.9% 40.4% 59.0% 39.9% 23.6% 27.7% 5.6% 10.1% 0.2% 0.4% Ireland 68.8% 79.8% 34.9% 57.1% 32.9% 45.9% 34.4% 34.4% 11.7% 2.9% 2.8% 0.5% 0.5% Italy 66.2% 61.9% 26.2% 51.1% 27.5% 44.4% 20.7% 41.0% 17.5% 5.8% 4.4% 0.3% 0.9% Netherlands 64.9% 64.1% 38.5% 61.0% 34.2% 47.8% 43.1% 17.6% 24.6% 6.0% 7.1% 0.8% 0.7% Norway 65.7% 63.9% 27.4% 67.8% 39.5% 55.6% 25.3% 20.6% 41.4% 8.5% 6.5% 0.9% 1.9% Portugal 80.2% 77.8% 43.6% 53.6% 36.8% 42.4% 22.8% 35.3% 14.2% 10.0% 2.1% 7.6% 1.3% Russian Fed 60.9% 66.3% 25.8% 26.3% 16.3% 24.2% 17.9% 60.0% 12.1% 7.9% 2.1% 0.0% 0.0% Spain 63.0% 66.2% 22.1% 54.6% 33.5% 43.7% 28.2% 42.9% 31.2% 8.9% 9.0% 0.0% 0.0% Sweden 69.0% 73.6% 28.5% 56.3% 38.8% 47.1% 35.6% 26.6% 29.8% 11.6% 14.1% 0.0% 0.3% Switzerland 69.7% 64.7% 34.1% 56.8% 34.6% 45.2% 40.8% 18.7% 29.9% 9.2% 9.9% 0.0% 2.0% UK 65.3% 62.3% 43.3% 44.9% 25.4% 34.8% 29.6% 26.6% 17.2% 4.5% 5.4% 0.1% 0.8% Other Europe 60.7% 67.0% 19.0% 34.8% 15.0% 33.8% 23.1% 58.1% 10.4% 8.7% 4.4% 0.0% 0.7% ALL FOREIGN TOURISTS 50.0% 22.7% 47.8% 12.8% 9.4% 10.8% 9.2% 14.3% 5.4% 5.2% 2.2% 3.6% 3.3% Notes: Blank cells indicate that the sample is not big enough for a valid statistical interpretation. Eating out, Entertainment and Church added in 2016 questionnaire to provide more detail. Q Quarterly Tourism Report 52
53 ACTIVITIES BY PROVINCE 2017 Gauteng Western Cape Eastern Cape Kwazulu Natal Limpopo Mpumalanga North West Northern Cape Free State Shopping 42.8% 15.3% 3.9% 8.6% 17.4% 18.7% 6.0% 0.8% 8.3% Nightlife 36.4% 39.5% 8.9% 11.2% 13.1% 5.3% 9.6% 2.1% 12.9% Eating out 45.8% 25.7% 5.9% 9.3% 16.4% 14.9% 7.4% 1.0% 5.3% Entertainment 47.2% 27.3% 7.8% 10.0% 13.8% 8.7% 8.9% 1.5% 5.4% Social 41.2% 17.3% 4.0% 12.4% 23.1% 5.3% 6.9% 0.8% 12.8% Visiting natural attractions 34.1% 72.4% 15.4% 13.4% 22.6% 8.4% 5.5% 1.4% 1.8% Cultural, historical and heritage 44.1% 53.2% 12.7% 10.8% 28.2% 5.7% 4.1% 1.1% 1.9% Wildlife 37.0% 63.6% 16.9% 14.2% 29.6% 12.6% 5.3% 1.6% 2.2% Beach 23.3% 72.0% 19.2% 32.3% 16.3% 3.6% 4.1% 1.0% 1.5% Church 46.1% 5.2% 1.9% 4.6% 9.1% 9.3% 12.0% 1.1% 22.7% Business 66.7% 22.7% 3.6% 9.8% 3.6% 4.0% 4.0% 2.2% 4.1% Adventure 29.3% 78.4% 20.0% 15.3% 21.8% 7.1% 6.2% 1.4% 2.2% Education training study 42.0% 23.5% 7.0% 11.6% 4.6% 4.8% 5.2% 1.1% 22.8% Theme parks 46.3% 59.2% 15.2% 18.0% 22.8% 5.5% 5.0% 0.5% 1.8% Trading 43.5% 9.0% 1.7% 2.9% 10.5% 38.1% 6.2% 0.2% 0.5% Medical 45.2% 12.9% 2.5% 3.0% 14.3% 10.8% 7.4% 0.4% 15.4% Notes: ACTIVITIES BY PROVINCE 2016 Gauteng Western Cape Eastern Cape Kwazulu Natal Limpopo Mpumalanga North West Northern Cape Free State Shopping 46.7% 16.2% 3.0% 7.1% 11.5% 19.9% 7.7% 0.7% 6.0% Nightlife 39.9% 30.1% 6.5% 6.4% 20.5% 2.0% 14.2% 0.7% 15.8% Eating out 52.3% 26.9% 5.3% 7.2% 11.8% 12.1% 11.9% 0.9% 4.7% Entertainment 54.6% 25.1% 6.1% 8.7% 18.8% 3.2% 17.3% 1.2% 9.4% Social 43.2% 12.4% 3.4% 10.0% 16.9% 3.8% 10.3% 0.9% 20.5% Visiting natural attractions 35.4% 74.8% 12.1% 13.4% 23.6% 6.8% 6.2% 1.5% 2.4% Cultural, historical and heritage 43.5% 63.0% 13.7% 16.3% 26.6% 5.4% 6.6% 1.6% 3.6% Wildlife 40.5% 62.0% 16.5% 15.8% 34.7% 11.4% 7.9% 2.3% 2.5% Beach 23.4% 70.1% 19.4% 33.2% 16.6% 3.3% 4.2% 1.2% 1.7% Church 14.4% 8.6% 2.5% 4.1% 12.7% 22.8% 12.0% 2.3% 29.3% Business 63.5% 24.7% 2.4% 5.6% 5.0% 2.8% 5.8% 1.0% 3.2% Adventure 31.0% 76.5% 20.4% 16.8% 23.2% 7.4% 6.7% 1.2% 5.6% Education training study 46.4% 24.8% 6.1% 7.1% 8.4% 5.0% 6.8% 1.8% 18.2% Theme parks 44.9% 73.7% 11.6% 16.3% 19.1% 4.2% 4.5% 1.4% 1.9% Trading 66.5% 2.3% 1.3% 4.7% 20.5% 19.6% 10.0% 0.8% 1.2% Medical 30.7% 9.8% 0.7% 1.4% 11.8% 11.2% 5.4% 0.8% 34.5% Notes: Q Quarterly Tourism Report 53
54 ACTIVITIES BY PROVINCE 2015 Gauteng Western Cape Eastern Cape Kwazulu Natal Limpopo Mpumalanga North West Northern Cape Free State Shopping 46.9% 19.7% 4.0% 7.2% 10.9% 20.6% 8.8% 1.4% 6.0% Nightlife 49.5% 41.3% 7.4% 11.3% 12.2% 3.4% 7.9% 1.7% 8.9% Eating out Entertainment Social 38.5% 10.8% 2.3% 8.2% 17.0% 6.1% 13.4% 2.1% 18.8% Visiting natural attractions 35.7% 69.9% 13.6% 19.2% 25.4% 6.2% 5.8% 2.6% 2.5% Cultural, historical and heritage 51.9% 59.8% 13.4% 21.4% 27.3% 5.7% 5.9% 1.4% 3.2% Wildlife 43.5% 58.1% 16.4% 23.8% 33.7% 9.1% 9.3% 2.5% 2.5% Beach 29.1% 67.1% 16.1% 36.7% 14.3% 2.3% 4.2% 3.0% 3.4% Church Business 63.5% 20.9% 2.6% 9.4% 8.1% 4.2% 7.4% 2.1% 5.1% Adventure 34.8% 70.3% 19.1% 19.6% 22.0% 5.8% 6.4% 3.5% 6.3% Education training study 44.3% 22.2% 6.7% 16.6% 10.1% 5.2% 3.5% 1.5% 16.1% Theme parks 46.1% 59.8% 17.3% 23.1% 23.3% 7.8% 7.1% 1.4% 3.9% Trading 67.9% 3.7% 1.0% 6.2% 21.4% 19.4% 9.0% 1.0% 3.5% Medical 40.3% 6.9% 1.0% 6.4% 16.0% 4.4% 8.9% 0.0% 28.6% Notes: Q Quarterly Tourism Report 54
55 Appendix 12: Attractions of landmarks visited by tourist in South Africa Top 10 Attractions: Eastern Cape Addo Elephant Park Storms River Warmer Park Bloukrans Bridge Bungy (Highest Bungee) Board Walk shopping Mall Greenacres Mall Wild Fly Fishing - Sommerset East Tree Top Canopy Tour / Tstitsikamma Forest Nelson Mandela Museum (Mthatha) Steve Biko Monument and Museum and Grave Site - (King William's Town, Ginsberg & East London) Top 10 Attractions: Free State Golden Gate National Park Waterfront Mimosa Mall University of Free State Cheetah Experience Clarens Ash River Outfall Sterkfontein dam Nature Reserve Free State stadium/vodacom Park Gariep Dam Basotho cultural village Top 10 Attractions: Gauteng Sandton City / Mandela Square Apartheid Museum Mandela house (Soweto) Eastgate Mall Tour of Soweto Union Buildings Rhino and Lion Nature Reserve Constitution Hill Church Square Maboneng Precinct (e.g. Pop Art Theatre, Cinema, Gallery etc) Top 10 Attractions: Kwazulu Natal Gateway Mall Durban North Beach Durban South Beach ushaka Marine World Durban north coast (Umhlanga, Umdloti, Ballito, Zimbali, Salt Rock, Shaka's Rock) Florida Road (Durban) Drakensberg Mountains La Lucia Pavilion Mall Elephant Coast (e.g. isimangaliso Wetland Park World Heritage Site, Hluhluwe-iMfolozi, Tembe, Ndumu, Phinda) Q Quarterly Tourism Report 55
56 Top 10 Attractions: Limpopo Q Quarterly Tourism Report Kruger National Park via Orpen, Phalaborwa, Punda Maria Maphugubwe National Park Bela Bela Conservatory Mapungubwe Cultural Landscape Southpansberg Mountains Nandoni Dam Ga (modjadji) / Motjaji The Chuene Resort Thohoyandou varsity Zion Christian Church Moria Top 10 Attractions: Mpumalanga Kruger Park via Skukuza, Numbi, Malelane,Crocodile Bride Blyde River Canyon God's Window Panorama Bourke's Luck Potholes Hazyview Mall Hazyview (Cable slide, Hot air ballooning, Abseiling, Elephant Sanctuary, Game drives etc.) Pilgrim's Rest Sabie White river Sabi Sands Game Reserve Top 10 Attractions: Northern Cape Kimberley Big Hole Augrabies Falls Mokala National Park Kimberley Museum Diamond Mall San Cultural Villages (e.g. Khomani San Village etc) Namaqualand Flowers Kgalagadi Transfrontier Park Sutherland and Carnarvon - Stargazing (Salt and SKA) Orange River Top 10 Attractions: North West Sun City / Lost City Pilansberg National Park Madikwe Game reserve Haartebespoort dam Hartbeespoort dam & Snake Park Potchefstroom University Waterfall Mall (Rustenburg) Mafikeng Mall Brits Mall Ukutula Game Lodge Top 10 Attractions: Western Cape V&A Waterfront Cape Town Central City Cape Point Table Mountain Cableway Camp's Bay The Winelands Kirstenbosch Botanical Gardens Table Mountain (not cableway) The Garden Route Clifton Beach
57 Appendix 13: Experiences in South Africa TOP MOST POSITIVE EXPERIENCES WHILE IN SOUTH AFRICA Visiting family friends 30.6% 39.2% 31.4% Hospitality and friendly people 22.1% 30.7% 29.1% Good serivce 16.7% 29.3% 26.2% The scenery in SA is beatiful 19.2% 29.8% 24.6% Value for money 15.6% 27.4% 19.6% Good infrastructure 9.9% 19.8% 13.6% The diverse experience 8.9% 15.9% 13.4% The wildlife game parks safari 8.1% 7.4% 9.7% Business opportunities 10.2% 12.1% 5.4% The culture & heritage 4.9% 5.1% 4.8% Beaches 3.8% 4.0% 4.2% Restaurants food wine 0.0% 0.8% 1.3% Shopping 0.0% 0.5% 0.9% Adventure (Scuba diving gliding surfing etc) 0.0% 0.0% 0.8% Entertainment 0.0% 0.0% 0.8% Attractions 0.0% 0.8% 0.7% Religious sites 0.0% 0.1% 0.6% I had no outstanding experience 19.9% 17.8% 17.6% TOP MOST NEGATIVE EXPERIENCES WHILE IN SOUTH AFRICA I had no bad experience 74.6% 82.9% 80.7% Poor food facilities 6.5% 12.5% 11.5% Safety and security 7.9% 3.5% 5.5% Personal safety 10.0% 8.6% 4.9% Poverty beggars 3.9% 2.7% 2.2% Theft robbery crime 0.0% 0.0% 1.6% Personal experience 0.0% 0.0% 1.5% Unfriendly people 0.8% 0.5% 1.3% Poor airport service 0.5% 0.7% 0.8% Poor infrastructure 0.0% 0.0% 0.6% Expensive 1.2% 0.9% 0.6% Poor transport facilities 1.9% 0.2% 0.6% Poor signage road signs 0.7% 1.1% 0.5% Racism 0.0% 0.2% 0.5% Q Quarterly Tourism Report 57
58 Hospitable / Friendly People Domestic Flights Appendix 14: Satisfaction Rating Natural Attractions Public Transportation SATISFACTION RATING OF SOUTH AFRICA Accommodation 2017 Availability of Information Service Levels Safety and Security General Infrastructure Value for money Customs and Immigration AFRICA LAND Botswana Lesotho Malawi Mozambique Namibia Swaziland Zambia Zimbabwe AFRICA AIR Angola Democratic Republic of Congo Ethiopia Ghana Kenya Nigeria Tanzania Turkey Uganda UAE Other Africa and Middle East AMERICAS Argentina Brazil Canada Chile USA Other Americas ASIA & AUSTRALASIA Australia China including Hong Kong India Japan Malaysia New Zealand Singapore South Korea Other Asia and Australasia EUROPE Austria Belgium Denmark Finland France Germany Ireland Italy Netherlands Norway Portugal Russian Fed Spain Sweden Switzerland UK Other Europe ALL FOREIGN TOURISTS Notes: Mean calclated on respondents who provide a rating i.e. Not Applicable responses excluded. Overall satisfaction Q Quarterly Tourism Report 58
59 Hospitable / Friendly People Domestic Flights Natural Attractions Public Transportation SATISFACTION RATING OF SOUTH AFRICA Accommodation 2016 Availability of Information Service Levels Safety and Security General Infrastructure Value for money Customs and Immigration AFRICA LAND Botswana Lesotho Malawi Mozambique Namibia Swaziland Zambia Zimbabwe AFRICA AIR Angola Democratic Republic of Congo Ethiopia Ghana Kenya Nigeria Tanzania Turkey Uganda UAE Other Africa and Middle East AMERICAS Argentina Brazil Canada Chile USA Other Americas ASIA & AUSTRALASIA Australia China including Hong Kong India Japan Malaysia New Zealand Singapore South Korea Other Asia and Australasia EUROPE Austria Belgium Denmark Finland France Germany Ireland Italy Netherlands Norway Portugal Russian Fed Spain Sweden Switzerland UK Other Europe ALL FOREIGN TOURISTS Notes: Mean calclated on respondents who provide a rating i.e. Not Applicable responses excluded. Overall satisfaction Q Quarterly Tourism Report 59
60 Hospitable / Friendly People Domestic Flights Natural Attractions Public Transportation SATISFACTION RATING OF SOUTH AFRICA Accommodation 2015 Availability of Information Service Levels Safety and Security General Infrastructure Value for money Customs and Immigration AFRICA LAND Botswana Lesotho Malawi Mozambique Namibia Swaziland Zambia Zimbabwe AFRICA AIR Angola Democratic Republic of Congo Ethiopia Ghana Kenya Nigeria Tanzania Turkey Uganda UAE Other Africa and Middle East AMERICAS Argentina Brazil Canada Chile USA Other Americas ASIA & AUSTRALASIA Australia China including Hong Kong India Japan Malaysia New Zealand Singapore South Korea Other Asia and Australasia EUROPE Austria Belgium Denmark Finland France Germany Ireland Italy Netherlands Norway Portugal Russian Fed Spain Sweden Switzerland UK Other Europe ALL FOREIGN TOURISTS Notes: Mean calclated on respondents who provide a rating i.e. Not Applicable responses excluded. Overall satisfaction Q Quarterly Tourism Report 60
61 Appendix 15: Transportation Section TRANSPORTATION SECTION: OVERALL Minibus taxi 36.1% 38.6% 36.7% Private car or van 35.0% 38.1% 32.8% Other Taxi 12.8% 10.0% 17.1% On foot or bicycle 15.5% 20.5% 12.3% Aeroplane 8.4% 9.0% 10.0% Rental car 6.9% 5.2% 7.2% Tour bus 3.5% 3.2% 3.6% Commercial bus 4.4% 5.8% 3.0% Private hotel shuttle 2.9% 3.1% 2.6% Truck or lorry 3.3% 4.1% 2.0% Train 2.0% 1.5% 1.5% Ship/Boat 0.7% 1.3% 0.5% Motorcylce 0.4% 0.1% 0.1% TRANSPORTATION SECTION: LAND MARKETS Minibus taxi 45.3% 49.3% 47.2% Private car or van 33.1% 35.7% 28.6% Other Taxi 11.2% 8.3% 19.5% On foot or bicycle 18.7% 25.6% 13.8% Aeroplane 1.1% 0.7% 1.3% Rental car 1.5% 0.8% 1.0% Tour bus 1.1% 0.3% 0.5% Commercial bus 4.4% 6.3% 3.0% Private hotel shuttle 0.9% 0.5% 0.7% Truck or lorry 4.0% 5.1% 2.6% Train 1.1% 0.9% 0.9% Ship/Boat 0.1% 0.0% 0.0% Motorcylce 0.4% 0.1% 0.1% Q Quarterly Tourism Report 61
62 TRANSPORTATION SECTION: AIR MARKETS Minibus taxi 4.5% 2.4% 2.1% Private car or van 41.6% 46.0% 46.5% Other Taxi 18.6% 15.6% 9.3% On foot or bicycle 4.3% 3.4% 7.4% Aeroplane 33.8% 37.2% 38.6% Rental car 25.4% 20.3% 27.7% Tour bus 11.8% 13.2% 14.1% Commercial bus 4.6% 3.8% 3.2% Private hotel shuttle 10.0% 12.0% 8.7% Truck or lorry 1.0% 0.5% 0.3% Train 5.1% 3.3% 3.5% Ship/Boat 3.0% 5.4% 2.2% Motorcylce 0.2% 0.1% 0.1% Q Quarterly Tourism Report 62
63 Appendix 16: Collection of Tourism Statistics in South Africa 1. South African Tourism s Departure Survey South African Tourism conducts surveys of departing foreign tourists to gain an understanding of the travel behaviour, perceptions, buying processes, travel patterns and the amount spent on their trip in South Africa. These surveys are designed primarily to provide information on which we base our marketing decisions and track the performance of the industry. These surveys are the only measure of tourism demand in South Africa. Since 2002, South African Tourism has commissioned a monthly survey of departing foreign visitors 18 years and older exiting through OR Tambo International Airport, Cape Town International Airport and the following 12 land border posts. Kopfontein (Botswana) Pioneer Gate (Botswana) Groblers Brug (Botswana) Ramathlabama (Botswana) Lebombo (Mozambique) Ficksburg (Lesotho) Maseru (Lesotho) Oshoek (Swaziland) Golela (Swaziland) Beit Bridge (Zimbabwe) Nakop (Namibia) Vioolsdrif (Namibia) All interviews are conducted using tablet-aided personal interviews in a face-to-face method. The surveys are conducted in the following 17 languages: English, German, French, Italian, Spanish, Portuguese, Dutch, Japanese, Mandarin, Siswati, Sesotho, Setswana, chishona, isindebele, Afrikaans, isixhosa and isizulu. The Departure Survey samples respondents aged 18 years and older each month using Tablet Aided Personal Interviewing (TAPI) in the departure lounges of the two major international airports and within the controlled area on the South African side of the land border posts. The results of the survey are weighted to the foreign tourist arrivals data for the reference period as released by Statistics SA in its monthly release (P0351). The variables mode of arrival and country of residence are using in the weighting framework. Q Quarterly Tourism Report 63
64 1.1. Sample design A random stratified probability sample is drawn proportional to the actual tourist arrivals using the same month of the previous year. Sampling units are the two major airports and 10 land borders mentioned above. Stratified Probability Sampling Reasons: Eliminates bias Results can be inferred to the foreign tourist population Stratified Random Sampling Strata Systematic Random Sampling 1 in 5 Reasons for the Sampling Methods Stratified Sampling Systematic Sampling 1 in 5 Representative sample at each airport and each market. Manage Randomness Determining a random start Eliminates obvious bias Eliminates interviewer bias K < 5 would introduce bias K > 5 will cause difficulty in reaching the target K = Interval The total sample size at the airports is 3,800 per month, while the land survey consists of 1,000 per month. Airport Intervention Land Border Intervention Airport Sample Apr-Jun 2017 Country Land Border Sample Apr-Jun 2017 O. R. Tambo International 2980 Botswana Kopfontein 80 Cape Town International Airport 820 Pioneer Gate 40 Total Air Sample 3800 Ramathlabama 40 Groblers brug 60 Lesotho Ficksburg 80 Maseru 85 Malawi Beit Bridge 20 Mozambique Lebombo 220 Namibia Nakop 15 Vioolsdrift 35 Swaziland Golela 45 Oshoek 90 Zambia Beit Bridge 20 Zimbabwe Beit Bridge 170 Total Land Sample All Borders 1000 Q Quarterly Tourism Report 64
65 1.2. Data reliability The table below provides the confidence intervals at 95% confidence for the length of stay and spend estimates reported. This simply means that there is a 95% chance that the data reported falls between the ranges below. TFDS (excluding capital expenditure) Mean Lower bound Upper bound Land markets R R R Air markets R R R Total R R R Length of stay Mean Lower bound Upper bound Land markets Air markets Total Normalising expenditure data SA Tourism now normalizes the spend data by eliminating 3-standard deviations from the logarithmic mean. y = log 10 (x) 1. Compute log of spend variable using the formula above 2. Calculate the mean of the result obtained in (1) above. 3. Determine the cut-off criteria using the following formula: 4. Transform the log values back to spend values using the following formula: 5. Exclude all variables that fall outside the cut-off values. Q Quarterly Tourism Report 65


66 2. SA Tourism s Domestic Tourism Survey In 2007, South African Tourism commissioned a monthly domestic survey designed to measure headline indicators and ensure a proper representation of existing travel trends and the characteristics of travellers in the national population. The following key indicators are measured: Volume: the incidence of domestic travel and how many trips are taken Value: how much is spent annually by domestic tourists Number of bed nights: The number of nights spent in various establishments Provincial distribution: How the volume, value and bed nights are distributed between the nine provinces Seasonality: When do people travel? All interviews are conducted using paper-based personal interviews in a face-to-face method. The Domestic Survey samples respondents aged 18 years and older each month. Each interview consists of two modules: Random questionnaire: measures the headline indicators and perceptions of various ad campaigns run by South African Tourism Trip module: collects detailed information on each trip undertaken by respondent in the past month. Separate trip module completed for each trip undertaken 2.1. Sample design The sample of (face-to-face) interviews per month (325 enumerator areas) is designed as a multi-stage, stratified and clustered probability sample, representative of the national population of SA residents aged 18 years and older. Only province and dominant population group are used as explicit stratification variables. The Northern Cape and the Asian population is over sampled to ensure representivity, while the rural population is undersampled on the assumption of homogeneity of this population. A sampling frame is created as follows: The sample is drawn as a rolling monthly sample in such a way that every consecutive period of three months can be used as period for reporting (after benchmarked to the 18+ population of SA). Q Quarterly Tourism Report 66


67 Sampling stages Stage 1 Explicitly stratified by province, race, geo-type Implicitly stratified by main place (magisterial district) and sub place (suburb) Stage 2 PPS sampling used to draw sample of EAs - probability proportional to the size of the cluster i.e. number of persons 18 years and older Stage 3 EPSEM to draw four households per EA - walk and skip pattern Record hit rates, contacts, refusals, unsuitable respondents Stage 4 Kish Grid used to select a household member aged 18 years and older to be interviewed in the selected household The results of the survey are weighted back to the population is three stages: First stage: EAs are selected with probability proportional to size (pps) from sampling frame Develop EA Weight W 1 PSU 18 PSU nea., POP18 n EA is the allocated number of EAs over the 12 months in the stratum, PSU 18 the number of persons aged 18 years and older in the selected EA, and Pop 18 is the number of persons aged 18 years and older in the selected stratum. Second stage: Households are selected systematically in each EA Develop Household weight 1 n HH W HH WPSU, PSU HH n HH is the number of selected households in the selected PSU, PSU HH is the number of household available in the PSU. Third stage in sample design: draw one person 18 years+ randomly from the selected household. Develop respondent weight: is the number of persons aged 18 years and older in the selected household Q Quarterly Tourism Report 67


68 The final sample record weight generally consists of three components: design weight, reciprocal value of response rate, adjusted weighting factor to compensate for non-coverage/skewness 2.2. Normalising expenditure data The expenditure data is analysed on a monthly basis to measure effect on travel patterns and the absolute values of the key variables. A methodology using above two standard deviations is applied when necessary to normalise the data Data reliability With such a low incidence, this report could not reflect data for all the provinces. Only the provinces and purpose of travel data with a sample (unweighted n) count of above 20 were reflected on the report. Key Metrics Q Q Q % growth ('17 vs '16) Total Trips 5.8 million 5.4 million 4.8 million -12% 4,034 3,598 2,770-23% VFR Trips by Purpose 70% 66% 56% Number ('000) % HOLIDAY Share (%) 9% 11% 15% BUSINESS % 10% 13% 7% Total Domestic Direct Spend R4.5 billion R6.4 billion R6.4 billion -1% R2.4 R3.5 R3.1-12% VFR TDDS by Purpose 53% 55% 45% Rands (billion) R0.8 R1.6 R1.9 19% HOLIDAY Share (%) 17% 25% 28% BUSINESS Average Spend R0.9 R770 / Trip R1.1 R1,180 / Trip R1.5 R1,330 / Trip 37% 12% 21% R210 / Day 17% R320 / Day 22% R360 / Day 12% Total Bednights 21.1 million 19.8 million 17.5 million -12% Average Nights 3.7 nights 3.6 nights 3.7 nights 1% Provincial Share of Trips Lim: 21% Lim: 29% Lim: 33% GP: 17% GP: 15% GP: 15% KZN: 16% KZN: 15% KZN: 11% EC: 13% EC: 14% WC: 10% Q Quarterly Tourism Report 68
TOURISM PERFORMANCE HIGHLIGHTS QUARTER
 TOURISM PERFORMANCE HIGHLIGHTS QUARTER 1 2017 Foreword As the tourism marketing arm of the South African Government, South African Tourism has developed an integrated marketing strategy that focuses on
TOURISM PERFORMANCE HIGHLIGHTS 2016
 TOURISM PERFORMANCE HIGHLIGHTS 2016 Foreword As the tourism marketing arm of the South African Government, South African Tourism has developed an integrated marketing strategy that focuses on leisure and
Western Cape Destination Performance Report: April-June 2016
 Number of arrivals (millions) Western Cape Destination Performance Report: April-June 2016 Global Tourism Performance According to the United Nations World Tourism Organisation, international tourist arrivals
SOUTHERN AFRICA TRAVEL AND TOURISM BAROMETER REPORT 2015
 SOUTHERN AFRICA TRAVEL AND TOURISM BAROMETER REPORT 2015 1 Contents 1. TOURISM TRENDS: GLOBAL AND SOUTHERN AFRICA S MARKET SHARE IN AFRICA... 4 1.1. TOURIST ARRIVALS... 4 1.1.1. Global Tourist Arrivals
1.0 Introduction Zambia s Major Trading Partners Zambia s Major Export Markets... 4
 Bank of Zambia CONTENTS 1.0 Introduction... 3 2.0 Zambia s Major Trading Partners... 3 3.0 Zambia s Major Export Markets... 4 4.0 Major Source Countries Of Zambia s Imports... 5 5.0 Direction Of Trade
Tourism in South Africa A statistical overview
 Tourism in South Africa A statistical overview Purpose of presentation Purpose of the presentation is to present different tourism statistics produced by Stats SA People like to travel we are a country
1.0 Introduction Zambia s Major Trading Partners Zambia s Major Export Markets... 4
 Bank of Zambia CONTENTS 1.0 Introduction... 3 2.0 Zambia s Major Trading Partners... 3 3.0 Zambia s Major Export Markets... 4 4.0 Major Source Countries Of Zambia s Imports... 5 5.0 Direction Of Trade
Intra-African Air Services Liberalization
 Intra-African Air Services Liberalization James Wiltshire Senior Economist, www.iata.org/economics To represent, lead and serve the airline industry Aviation connects African businesses to world markets
1.0 Introduction Zambia s Major Trading Partners Zambia s Major Export Markets... 4
 Bank of Zambia CONTENTS 1.0 Introduction... 3 2.0 Zambia s Major Trading Partners... 3 3.0 Zambia s Major Export Markets... 4 4.0 Major Source Countries Of Zambia s Imports... 5 5.0 Direction Of Trade
AFRICA. Cape Town, April Experience the World
 AFRICA Cape Town, 10 12 April 2019 Experience the World at WTM Africa 2019 Why WTM Africa? In the Host City of Cape Town Takes place in April every year - the optimal time in the Travel Industry s buying
Tourism Statistics. Quarter Contact Statistician: Oabona Machete Tel: (267)
") Tourism Statistics Quarter 1 2016 Contact Statistician: Oabona Machete Email: omachete@statsbots.org.bw Tel: (267) 367 1484 Tourism Statistics Quater 1 2016 1 Published by; Statistics Botswana, Private
Tourism Statistics Quarter 1 2016 Contact Statistician: Oabona Machete Email: omachete@statsbots.org.bw Tel: (267) 367 1484 Tourism Statistics Quater 1 2016 1 Published by; Statistics Botswana, Private
TOURISM BUSINESS COUNCIL OF SOUTH AFRICA TRENDS AND INDICATORS REPORT. March 2018
 TOURISM BUSINESS COUNCIL OF SOUTH AFRICA TRENDS AND INDICATORS REPORT March 2018 Compiled by: Ms. Tebogo Umanah General Manager: Policy Analysis and Strategic Projects March 2018 Page 1 CONTENTS INTRODUCTION...
% change vs. Dec ALL VISITS (000) 2,410 12% 7,550 5% 31,148 1% Spend ( million) 1,490 15% 4,370-1% 18,710 4%
 2,410 12% 7,550 5% 31,148 1% Spend ( million) 1,490 15% 4,370-1% 18,710 4%") HEADLINES FULL YEAR 2012 (PROVISIONAL) 1 Overall visits 31.148 million visits making 2012 the best year for inbound tourism since 2008 but not a record. 1% increase in visits on 2011 (30.798 visits) slightly
HEADLINES FULL YEAR 2012 (PROVISIONAL) 1 Overall visits 31.148 million visits making 2012 the best year for inbound tourism since 2008 but not a record. 1% increase in visits on 2011 (30.798 visits) slightly
FINLAND. Table 1. FDI flows in the host economy, by geographical origin. (Millions of US dollars)
") Table 1. FDI flows in the host economy, by geographical origin World 3 732 8 046 3 319 2 823 4 750 7 652 12 451-1 144 718 7 359 2 550 4 158 Developed economies 3 638 8 003 2 382 2 863 4 934 7 258 12 450-855
Table 1. FDI flows in the host economy, by geographical origin World 3 732 8 046 3 319 2 823 4 750 7 652 12 451-1 144 718 7 359 2 550 4 158 Developed economies 3 638 8 003 2 382 2 863 4 934 7 258 12 450-855
CONTENTS Executive Summary... iii 1. Introduction Major Destinations for Zambia s Exports Major Source Countries for Zambia s
 Bank of Zambia CONTENTS Executive Summary... iii 1. Introduction... 1 2. Major Destinations for Zambia s Exports... 1 3. Major Source Countries for Zambia s Imports... 3 4. Conclusion... 6 ii Executive
CONTENTS Executive Summary... iii 1. Introduction Major Destinations for Zambia s Exports Major Source Countries for Zambia s
 Bank of Zambia CONTENTS Executive Summary... iii 1. Introduction... 1 2. Major Destinations for Zambia s Exports... 1 3. Major Source Countries for Zambia s Imports... 4 4. Conclusion... 6 ii Executive
Africa attractiveness program 2017 Country profiles. 2 June 2017
 Africa attractiveness program 07 Country profiles June 07 The key economies attract the largest share of FDI Countries ranked by FDI projects 0 - (project numbers below are data) South Africa Nigeria Morocco
INTERNATIONAL TRAVEL AND TOURISM
 INTERNATIONAL TRAVEL AND TOURISM JANUARY TO SEPTEMBER 2017 1. INTRODUCTION This issue of the Economic and Social Indicators presents data on International Travel and Tourism for the first nine months of
The W20. The 20 wealthiest countries in the world. Publication Date: October 2015 NEW WORLD WEALTH
 The W20 The 20 wealthiest countries in the world Publication Date: October 2015 W20 wealth rankings The following tables ranks the top 20 countries in the world by total individual wealth held. Total individual
Copyrights Statistics Botswana 2016
 STATISTICS BOTSWANA TOURISM STATISTICS ANNUAL REPORT 2014 Copyrights Statistics Botswana 2016 Statistics Botswana. Private Bag 0024 Botswana Tel: (267) 367 1300. Fax: (267) 395 2201.Email: info@statsbots.org.bw
SLOVAKIA. Table 1. FDI flows in the host economy, by geographical origin. (Millions of US dollars)
") Table 1. FDI flows in the host economy, by geographical origin World 1 271 4 095 1 060 1 058 714 4 693 3 267 4 692-6 1 769 3 491 2 825 Developed economies 1 204 4 050 1 036 1 113 485 4 265 1 001 5 084-881
Table 1. FDI flows in the host economy, by geographical origin World 1 271 4 095 1 060 1 058 714 4 693 3 267 4 692-6 1 769 3 491 2 825 Developed economies 1 204 4 050 1 036 1 113 485 4 265 1 001 5 084-881
AFRICA. Cape Town, April Connect with the World
 AFRICA Cape Town, 10-12 April 2019 Connect with the World at WTM Africa 2019 Why WTM Africa? In the Host City of Cape The only Travel Trade Show of its kind on the African Continent Takes place in April
Western Cape Tourism Trends
 Western Cape Tourism Trends (January to March) 2014 1. Overview of key tourism trends Global According to the UNWTO World Tourism Barometer, international arrivals continued on a similar growth trend in
TOURISM BUSINESS COUNCIL OF SOUTH AFRICA TRENDS AND INDICATORS REPORT. May 2018
 TOURISM BUSINESS COUNCIL OF SOUTH AFRICA TRENDS AND INDICATORS REPORT May 2018 Compiled by: Ms. Tebogo Umanah General Manager: Policy Analysis and Strategic Projects May 2018 Page 1 CONTENTS INTRODUCTION...
INTERNATIONAL TRAVEL AND TOURISM
 INTERNATIONAL TRAVEL AND TOURISM YEAR 2014 1. INTRODUCTION This issue of the Economic and Social Indicators presents data on International Travel and Tourism for the year 2014. A brief on the compilation
INTERNATIONAL TRAVEL AND TOURISM
 INTERNATIONAL TRAVEL AND TOURISM YEAR 2017 1. INTRODUCTION This issue of the Economic and Social Indicators presents data on International Travel and Tourism for the year 2017. A brief on the compilation
CONTENTS Executive Summary... iii 1. Introduction Major Destinations for Zambia s Exports Major Source Countries for Zambia s
 Bank of Zambia CONTENTS Executive Summary... iii 1. Introduction... 1 2. Major Destinations for Zambia s Exports... 1 3. Major Source Countries for Zambia s Imports... 4 4. Conclusion... 6 ii Executive
MONTHLY NATURAL GAS SURVEY. November 2009
 MONTHLY NATURAL GAS SURVEY November 2009 INTERNATIONAL ENERGY AGENCY INTERNATIONAL ENERGY AGENCY Next Release: 12 March 2010 MONTHLY NATURAL GAS SURVEY - 1 CONTENTS TABLE 1 Natural Gas Balances in OECD
Understanding Business Visits
 Understanding Business Visits Foresight issue 153 VisitBritain Research 1 Contents Introduction Summary and Highlights Business Visits in Context UK Business visits and spend Averages Duration of stay
REPUBLIC OF KOREA. Table 1. FDI flows in the host economy, by geographical origin. (Millions of US dollars)
") Table 1. FDI flows in the host economy, by geographical origin World 4 130 3 395 4 383 8 980 7 050 4 950 2 629 8 409 7 501 8 117 10 247 11 117 Developed economies 3 123 2 385 2 949 7 185 5 743 3 423-275
Table 1. FDI flows in the host economy, by geographical origin World 4 130 3 395 4 383 8 980 7 050 4 950 2 629 8 409 7 501 8 117 10 247 11 117 Developed economies 3 123 2 385 2 949 7 185 5 743 3 423-275
Sprint Real Solutions VPN SDS International Rates from the U.S. Mainland, Hawaii, Puerto Rico, and the U.S. Virgin Islands 1*
 1* The international rates below apply to calls from the U.S. Mainland, Hawaii, Puerto Rico, and the U.S. Virgin Islands where available. The rates, which are shown below in full minute increments, are
21st ACI AFRICA REGION ANNUAL ASSEMBLY CONFERENCE AND EXHIBITION
 21st ACI AFRICA REGION ANNUAL ASSEMBLY CONFERENCE AND EXHIBITION LIVINGSTONE, ZAMBIA 28 AUGUST 2012 Angela Gittens Director General ACI World 1 Airports Council International ACI AFRICA ACI World 577 members
WORLD PRESS FREEDOM INDEX 2012
 WORLD PRESS FREEDOM INDEX 2012 1 Finland -10,00 = - Norway -10,00 = 3 Estonia -9,00 - Netherlands -9,00 5 Austria -8,00 6 Iceland -7,00 - Luxembourg -7,00 8 Switzerland -6,20 9 Cape Verde -6,00 10 Canada
TOURISM STATISTICS ANNUAL REPORT 2012
 TOURISM STATISTICS ANNUAL REPORT 2012 Published by Statistics Botswana, Private Bag 0024, Gaborone Tel: (267) 3934968 Fax: (267) 3952201/3935628 Email: info@statsbots.org.bw Website: www.cso.gov.bw February
KINGDOM OF CAMBODIA NATION RELIGION KING 3
 KINGDOM OF CAMBODIA NATION RELIGION KING 3 TOURISM STATISTICS REPORT October 2015 MINISTRY OF TOURISM Statistics and Tourism Information Department No. A3, Street 169, Sangkat Veal Vong, Khan 7 Makara,
III. TRADE IN COMMERCIAL SERVICES BY CATEGORY
 .. TRADE IN COMMERCIAL SERVICES BY CATEGORY Transportation services China records impressive growth of world transportation services reached $750 billion in 2007, an increase of 19 per cent, following
QRC RICE INSPECTION CELL KARACHI,LAHORE,QUETTA & TCP COUNTRY WISE POSITION OF EXPORT OF BASMATI RICE JULY, 2014 TO JUNE, 2015
 QRC RICE INSPECTION CELL KARACHI,LAHORE,QUETTA & TCP COUNTRY WISE POSITION OF EXPORT OF BASMATI RICE JULY, 2014 TO JUNE, 2015 NAME OF SUPER BASMATI PARBOILED RICE BASMATI RICE BROWN RICE FOB PER COUNTRY
KINGDOM OF CAMBODIA NATION RELIGION KING 3
 KINGDOM OF CAMBODIA NATION RELIGION KING 3 TOURISM STATISTICS REPORT September 2014 MINISTRY OF TOURISM Statistics and Tourism Information Department No. A3, Street 169, Sangkat Veal Vong, Khan 7 Makara,
KINGDOM OF CAMBODIA NATION RELIGION KING 3
 KINGDOM OF CAMBODIA NATION RELIGION KING 3 TOURISM STATISTICS REPORT March 2014 MINISTRY OF TOURISM Statistics and Tourism Information Department No. A3, Street 169, Sangkat Veal Vong, Khan 7 Makara, Phnom
Latest Tourism Trends. Humphrey Walwyn Head of VisitEngland Research
 Latest Tourism Trends Humphrey Walwyn Head of VisitEngland Research 1 Inbound Tourism 2 2003 2004 2005 2006 2007 2008 2009 2010 2011 2012 2013 2014 2015 2016 2017 UK inbound long term trend Spend per visit
5.3. Cannabis: Wholesale and Street Prices and Purity Levels
 5. Prices: Cannabis 5.3. Cannabis: Wholesale and Street Prices and Purity Levels HERBAL CANNABIS Africa East Africa Ghana 51.0 39.2-62.7 1999 Kenya 0.2 0.1-0.3-2002 119.8-1996 Madagascar 1.3 1.1-1.4 100.0
THE DEPARTMENT OF ECONOMIC DEVELOPMENT, ENVIRONMENTAL AFFAIRS AND TOURISM EASTERN CAPE ANNUAL TOURISM BAROMETER 2015
 THE DEPARTMENT OF ECONOMIC DEVELOPMENT, ENVIRONMENTAL AFFAIRS AND TOURISM ANNUAL TOURISM BAROMETER 2015 INNOVATION FOR SUSTAINABLE DEVELOPMENT WWW.DEDEA.GOV.ZA ANNUAL TOURISM BAROMETER 2015 s HIGHLIGHTS
THE AFRICAN DEVELOPMENT BANK GROUP. At the centre of Africa s transformation
 THE AFRICAN DEVELOPMENT BANK GROUP At the centre of Africa s transformation African Development Bank Group At the centre of Africa s transformation The African Development Bank Group is a multilateral
KINGDOM OF CAMBODIA NATION RELIGION KING 3
 KINGDOM OF CAMBODIA NATION RELIGION KING 3 TOURISM STATISTICS REPORT June 2014 MINISTRY OF TOURISM Statistics and Tourism Information Department No. A3, Street 169, Sangkat Veal Vong, Khan 7 Makara, Phnom
Central Bank of Different Countries
 Country name Afghanistan Albania Algeria Argentina Armenia Aruba Australia Austria Azerbaijan Bahamas Bahrain Bangladesh Barbados Belarus Belgium Belize Benin Bermuda Bhutan Bolivia Bosnia Botswana Brazil
THE AFRICAN DEVELOPMENT BANK GROUP. At the centre of Africa s transformation
 THE AFRICAN DEVELOPMENT BANK GROUP At the centre of Africa s transformation African Development Bank Group The African Development Bank Group is a multilateral development finance institution. It was established
Tourism Snapshot A focus on the markets that the CTC and its partners are active in
 Tourism Snapshot A focus on the markets that the CTC and its partners are active in Newfoundland and Labrador www.canada.travel/corporate October 2011 Volume 7, Issue 10 Key highlights In October 2011,
Sprint Real Solutions Switched Data Service International Rates from the U.S. Mainland, Hawaii, Puerto Rico, and the U.S.
 1* The international rates below apply to calls from the U.S. Mainland, Hawaii, Puerto Rico, and the U.S. Virgin Islands. The usage rates below reflex the discount found in Section 6.4 of Schedule No.
United Kingdom: Tourism Market Insights 2017
 United Kingdom: Tourism Market Insights 2017 Overview This tourism report provides an outlook on key market insights on a global, national and provincial scale for the United Kingdom (UK). In addition,
Outlook for air travel markets
 Outlook for air travel markets June 2016 Brian Pearce Chief Economist International Air Transport Association Extended period of strong air travel market growth 30% 25% 20% 15% 10% 5% 0% -5% -10% -15%
Sprint Real Solutions Switched Data Service International Rates from the U.S. Mainland, Hawaii, Puerto Rico, and the U.S.
 1* The international rates below apply to calls from the U.S. Mainland, Hawaii, Puerto Rico, and the U.S. Virgin Islands. The usage rates below reflex the discount found in Section 6.4 of Schedule No.
WESTERN CAPE TOURISM BAROMETER: Your Provincial Tourism Intelligence Source
 WESTERN CAPE TOURISM BAROMETER: Your Provincial Tourism Intelligence Source Volume 3, Issue 1 October-December 2008 Produced by Cape Town Routes Unlimited INTRODUCTION This barometer is a synopsis of the
Presentation to Select Committee on the Budget Vote. May 2008
 Presentation to Select Committee on the Budget Vote May 2008 Source: Arrivals for users 1998 to 2007 Arrivals to South Africa exceeded 9 million in 2007 Total foreign arrivals to SA - 1998 to 2007 Arrivals
South African Tourism
 South African Tourism 2012/13 Annual Report Presentation Portfolio Committee on Tourism Presentation by: Thulani Nzima CEO: South African Tourism 08 October 2013 Objectives of the Presentation Objectives
Tourism Snapshot A focus on the markets that the CTC and its partners are active in
 Tourism Snapshot A focus on the markets that the CTC and its partners are active in www.canada.travel/corporate February 2011 Volume 7, Issue 2 Key highlights In the first two months of 2011 overnight
Regional Spread of Inbound Tourism. VisitBritain Research, August 2018
 Regional Spread of Inbound Tourism VisitBritain Research, August 218 1 Contents Introduction Summary Key metrics by UK area Analysis by UK area Summary of growth by UK area Scotland Wales North East North
IMD World Talent Report Factor 1 : Investment and Development
 THAILAND 2012 2013 2014 2015 2016 Overall Investment & Development Appeal Rank 2016 37 42 24 Readiness 49 of 61 Factor 1 : Investment and Development Total Public Expenditure on Education Percentage of
2012 Coach & Charter Seminar. 21 February 2012 Presented by Amanda Coghlan Strategic Insights Analyst
 2012 Coach & Charter Seminar 21 February 2012 Presented by Amanda Coghlan Strategic Insights Analyst Destination NSW Lead Government agency for the NSW tourism and events sectors Established as a statutory
Sprint Real Solutions Switched Data Service International Rates from the U.S. Mainland, Hawaii, Puerto Rico, and the U.S.
 1* The international rates below apply to calls from the U.S. Mainland, Hawaii, Puerto Rico, and the U.S. Virgin Islands. The usage rates below reflex the discount found in Section 6.4 of Schedule No.
Tourism snapshot Canadian Tourism Commission
 Canadian Tourism Commission Commission canadienne du tourisme Tourism snapshot www.canada.travel A focus on the markets that the CTC and its partners are active in Volume 5, Issue 04 Key highlights Following
Membership & Voting Strength - 1 October September 2020
 ship & Voting Strength - 1 October 2016-30 September 2020 Assessment Period - 1 October 2012-30 September 2016 Junior Team Championships Junior - Championships Junior - Championships Junior - Africa 1
Tourism Snapshot. A focus on the markets in which the CTC and its partners are active. October 2012 Volume 8, Issue 10.
 Tourism Snapshot Niagara Helicopters Tour A focus on the markets in which the CTC and its partners are active www.canada.travel/corporate October 2012 Volume 8, Issue 10 Total arrivals from CTC s international
Sprint Real Solutions Option A SDS International Outbound Rates from the U.S. Mainland, Hawaii, Puerto Rico, and the U.S.
 1* The international rates below apply to calls from the U.S. Mainland, Hawaii, Puerto Rico, and the U.S. Virgin Islands. For additional termination poinst for some countries, see International Termination
A PROFILE OF THE SOUTH AFRICAN HERBS AND SPICES MARKET VALUE CHAIN 2017
 A PROFILE OF THE SOUTH AFRICAN HERBS AND SPICES MARKET VALUE CHAIN 217 Directorate Marketing Tel: 12 319 8455 Private Bag X 15 Fax: 12 319 8131 Arcadia E-mail:MogalaM@daff.gov.za 7 www.daff.gov.za 1 TABLE
QRC RICE INSPECTION CELL
 QRC RICE INSPECTION CELL KARACHI,LAHORE,QUETTA & TCP COUNTRY WISE POSITION OF EXPORT OF BASMATI RICE JULY, 2014 TO MARCH, 2015 NAME OF SUPER BASMATI PARBOILED RICE BASMATI RICE BROWN RICE FOB PER COUNTRY
Country Profile: Kenya 2017
 Country Profile: Kenya 217 1. Global Tourism Performance of Kenya Domestic tourism is the major driving force of the Kenyan tourism sector. The total number of domestic trips rose from 18.1 million in
Understanding the Tourism Puzzle!
 Understanding the Tourism Puzzle! Tshwane Tourism Association Tourism Showcase Gillian Saunders Head of Advisory Services : Grant Thornton January 2018 2012 Grant Thornton South Africa. All rights reserved.
III. TRADE IN COMMERCIAL SERVICES BY CATEGORY
 .. TRADE IN COMMERCIAL SERVICES BY CATEGORY Transportation services China records impressive growth Exports of world transportation services reached $750 billion in 2007, an increase of 19 per cent, following
CROATIA. Table 1. FDI flows in the host economy, by geographical origin. (Millions of US dollars)
") Table 1. FDI flows in the host economy, by geographical origin World 1 307 1 153 2 107 1 210 1 844 3 228 4 928 5 941 3 566 515 1 511 1 370 Developed economies 1 207 1 113 1 719 1 190 1 885 3 093 4 775
Table 1. FDI flows in the host economy, by geographical origin World 1 307 1 153 2 107 1 210 1 844 3 228 4 928 5 941 3 566 515 1 511 1 370 Developed economies 1 207 1 113 1 719 1 190 1 885 3 093 4 775
Accounting Basis by Country
 Accounting Basis by Country Egypt Africa Northern Africa Morocco Africa Northern Africa Sudan Africa Northern Africa Western Sahara Africa Northern Africa Angola Africa Sub-Saharan Africa Benin Africa
COUNTRY & TERRITORY PROFILES A Summary of Oil Spill Response Arrangements & Resources Worldwide
 3. COUNTRY & TERRITORY PROFILES (including date of update) A Albania August 2010 Antigua January 2009 Algeria May 2011 Argentina December 2015 Angola May 2009 Aruba April 2008 Anguilla November 2005 Australia
An overview of Tallinn tourism trends
 An overview of Tallinn tourism trends August 2015 The data is collected from Statistics Estonia, Tallinn Airport and Port of Tallinn. In August 2015, 179,338 stayed overnight in Tallinn s accommodation
Financing Sustainable Transport in LLDCs in Africa High Level Meeting October Santa Cruz, Bolivia
 Gylfi Palsson, Lead Transport Specialist and Acting Manager for the LAC Region, World Bank Financing Sustainable Transport in LLDCs in Africa High Level Meeting 13-14 October 2016 - Santa Cruz, Bolivia
International Tourism Snapshot
 Australia on a high International visitors to Australia Australia welcomed 7.8m international visitors in the year ending June International visitor expenditure in Australia 2017, more than any previous
FACTS & FIGURES ISE 2016
 FACTS & FIGURES ISE 2016 The first four-day Integrated Systems Europe exhibition was an unqualified success. In drawing over 65,000 registered attendees to interact with over 1,100 exhibitors it officially
THE GROWTH OF THE HOSPITALITY INDUSTRY IN DUBAI
 THE GROWTH OF THE HOSPITALITY INDUSTRY IN DUBAI THE DEFINITION OF TOURISM Tourism is travel for recreational, leisure or business purposes. The World Tourism Organization defines tourists as people "traveling
ROMANIA. Table 1. FDI flows in the host economy, by geographical origin. (Millions of US dollars)
") Table 1. FDI flows in the host economy, by geographical origin World.... 2 196 6 435 6 485 11 333 9 928 13 910 4 843 2 939 2 522 2 746 Developed economies.... 1 521 5 361 6 309 11 445 9 136 13 422 4 812
Table 1. FDI flows in the host economy, by geographical origin World.... 2 196 6 435 6 485 11 333 9 928 13 910 4 843 2 939 2 522 2 746 Developed economies.... 1 521 5 361 6 309 11 445 9 136 13 422 4 812
Effective for all tickets issued where American validation is used. IATA-approved locations classified by American as full service.
 Commissions Base Commission Rates Agencies Located in 50 U.S, Puerto Rico, U.S. Virgin Islands and Canada Agencies Located Outside the 50 U.S., Puerto Rico, U.S. Virgin Islands and Canada Offshore/Trans-border
Global robot installations: high double digit growth rates
 ' of units Global robot installations: high double digit growth rates 5 45 4 35 3 25 2 15 1 5 113 6 Estimated annual worldwide supply of industrial robots 28-216 and 217-22* +15% on average per year 121
Tourism Snapshot. A focus on the markets in which the CTC and its partners are active. January 2013 Volume 9, Issue 1.
 Tourism Snapshot Nathan Phillips Square Skating Rink at City Hall Francisco Pardo A focus on the markets in which the CTC and its partners are active www.canada.travel/corporate January 2013 Volume 9,
Financial Reporting Standards Adoption by Country
 Financial Reporting Standards Adoption by Country Egypt Africa Northern Africa Morocco Africa Northern Africa Sudan Africa Northern Africa Western Sahara Africa Northern Africa Angola Africa Sub-Saharan
IATA ECONOMIC BRIEFING MARCH 2011
 IATA ECONOMIC BRIEFING MARCH 2011 WHAT DRIVES THE SIZE OF PREMIUM AIR TRAVEL MARKETS? WHY PREMIUM AIR TRAVEL IS AN IMPORTANT TRAVEL MARKET SEGMENT The premium (first and business class) travel segment
Summer Work Travel Season Program Dates by Country
 The program dates are windows of opportunity for program participation. Within this timeframe, students are still subject to their university's official academic break schedule. Even though the window
Tourism Snapshot A focus on the markets in which the CTC and its partners are active
 Tourism Snapshot A focus on the markets in which the CTC and its partners are active www.canada.travel/corporate January 214 Volume 1, Issue 1 Key highlights Total arrivals from CTC s international markets
Global Travel Trends 2005
 Preliminary World Travel Monitor Results from IPK international for the ITB Berlin Message, 03/10/06 Global Travel Trends 2005 Based on the new data from the 2005 World Travel Monitor, and as it does every
Summer Work Travel 2019 Season Program Dates by Country For External Use - Updated 11/13/2018
 The program dates are windows of opportunity for program participation. Within this timeframe, students are still subject to their university's official academic break schedule. Even though the window
Base Commission To all destinations 0%
 Commissions Offshore/Transborder Ticketing American Airlines does not pay base commission for tickets issued by travel agents on itineraries originating within the territory of the United States, including
International Tourism Snapshot
 International visitors to Australia International visits continue to grow Australia hosted a record number of international visitors in the year ending International visitor expenditure in Australia September
Latest Hotels.com research reveals Chinese travellers want more of everything more time travelling, more locations and more exotic experiences
 Life in the FIRST lane Chinese travellers swap old habits for new first time experiences July 25, 2017 Latest Hotels.com research reveals Chinese travellers want more of everything more time travelling,
Tourism Snapshot. A focus on the markets in which the CTC and its partners are active. February 2015 Volume 11, Issue 2.
 Tourism Snapshot Tourism Whistler/Mike Crane A focus on the markets in which the CTC and its partners are active www.canada.travel/corporate February Volume 11, Issue 2 Key highlights The strong beginning
International Tourism Snapshot
 International visitors to Australia Total holiday 4,447,000 5.0% 18.9-0.7% NZ 490,000-1.4% 7.5-9.4% Asia 2,292,000 8.6% 15.5-5.3% North America 496,000 4.6% 15.2-7.1% Europe 554,000 0.2% 38.5 8.3% UK 400,000
FACT Sheet. Continental competition winners. AFC Asian Zone Asian Cup
 Continental competition winners AFC Asian Zone Asian Cup 15.09.1956 Hong Kong 1 st KOREA REPUBLIC 2 nd Israel 4 6 21.10.1960 Korea Republic 1 st KOREA REPUBLIC 2 nd Israel 4 6 09.06.1964 Israel 1 st ISRAEL
Tourism Snapshot. June 2015 Volume 11, Issue 6. A focus on the markets in which Destination Canada (DC) and its partners are active.
 and its partners are active.") Tourism Snapshot Tourism PEI / Paul Baglole A focus on the markets in which Destination Canada (DC) and its partners are active. www.destinationcanada.com June Volume 11, Issue 6 Key highlights Over the
Tourism Snapshot Tourism PEI / Paul Baglole A focus on the markets in which Destination Canada (DC) and its partners are active. www.destinationcanada.com June Volume 11, Issue 6 Key highlights Over the
Pistachio Industry Inventory Shipment Report Pounds Crop Year
 Pistachio Industry Inventory Shipment Report Pounds March 2017 Year to Date Summary - Pounds 2016-2017 Crop Year Open Inshell AO Closed Shell Shelling Stock Total 8/31/16 Carryover 46,956,408 41,224,713
Inbound Tourism Prague, 2014 Overall Assessment
 Inbound Tourism Prague, 2014 Overall Assessment Facts and Figures: Total visitors: 6,096,015 foreign: 5,315,054 (87.2%) domestic: 780,961 (12.8%) Total visitor growth in Prague: 3.3% foreign growth: 5.3%
Trade Blocs, Development Hotspots and Changing Trade Patterns. Breakbulk Africa, 18 th February 2015
 Trade Blocs, Development Hotspots and Changing Trade Patterns Breakbulk Africa, 18 th February 2015 Background Multiplicity of Trade Blocs in ever convergent economic spaces; Need for harmonisation of
International ISBN Agency - Range Message Printed: Apr 5, Last Change: Apr 4, 2018
 978 International ISBN Agency 0-5 600-649 7-7 80-94 950-989 9900-9989 9999 979 International ISBN Agency 10-12 978-0 English language 00-19 200-227 2280-2289 229-638 6390-6398 6399000-6399999 640-647 6480000-6489999
Prague Tourism Developments in Q1 2018
 Prague Tourism Developments in Q1 2018 Facts and Figures: Total visitors: 1,499,044 foreign: 1,239,848 (82.7%) domestic: 259,196 (17.3%) Total visitor growth in Prague: 121,224 visitors (8.8%) foreign
Tourism Snapshot. A focus on the markets that the CTC and its partners are active in. July 2011 Volume 7, Issue 7.
 Tourism Snapshot Echo Valley Ranch and Spa, British Columbia A focus on the markets that the CTC and its partners are active in www.canada.travel/corporate July 2011 Volume 7, Issue 7 Key highlights In
1.4: Premium Air Travel: An Important Market Segment
 CHAPTER 1.4 Premium Air Travel: An Important Market Segment SELIM ACH BRIAN PEARCE International Air Transport Association (IATA) The premium (first and business class) travel segment is an important market,