1999 Missouri State Parks Visitor Surveys
|
|
|
- Caitlin Roberts
- 5 years ago
- Views:
Transcription
1 Missouri Department of Natural Resources Division of State Parks Missouri State Parks Visitor Surveys Project Completion Report Submitted to Missouri Department of Natural Resources Division of State Parks Prepared by Dawn K. Fredrickson C. Randal Vessell Ph.D. Department of Parks, Recreation, & Tourism School of Natural Resources University of Missouri-Columbia May 2000
2 Acknowledgements Conducting and successfully completing a study of this magnitude and complexity could not have been accomplished without the cooperation of many individuals. Over 2,000 visitors to Missouri State Parks participated in the 1999 Missouri State Parks Visitor Survey. In many cases these individuals graciously extended their stay at particular recreation sites so that they could complete the questionnaire. It is clear from their input that these visitors care very much for the recreation resources in the Missouri State Park System. Their efforts will provide invaluable input into the planning process and providing for more effective and responsive management of these resources. Many other individuals provided assistance during the 1999 Missouri State Parks Visitor Survey, without whom the study would not have been a success. The following expressions of gratitude are in acknowledgement of their contributions. Special acknowledgement goes to the staff of the ten parks included in the study, for their willingness to accommodate the survey crew during the study period and also for their assistance during sampling. Many thanks also go to the research assistants, volunteers, and park staff who assisted in the data collection. They are: Lisa Asthmus, Shane Aumiller, James Borowiak, Denise Dowling, Karel Edgar, Tucker Fredrickson, Mary Howard, Kathleen Rosa, Carl Schumacher, Tina Shamel, Debra Stevenson, and Dennis Stevenson. A special thank you also goes to the students at the University of Missouri who assisted in computer data entry of the questionnaires: Amy Mahon, Laura Marsch, and Chris Thoele. Department of Parks, Recreation and Tourism - University of Missouri ii
3 Table of Contents Acknowledgements... ii Table of Contents... iii List of Tables...v List of Figures... vi Introduction...1 Need for Recreation Research...1 Study Purpose...1 Study Areas...2 Babler Memorial State Park...2 Big Lake State Park...2 Finger Lakes State Park...2 Lake of the Ozarks State Park...2 Long Branch State Park...3 Pershing State Park...3 Table Rock State Park...3 Trail of Tears State Park...3 Harry S Truman State Park...4 Wakonda State Park...4 Scope of Study...4 Methodology...5 Sampling Procedures...5 Questionnaire...5 Selection of Subjects...5 Data Collection...6 Data Analysis...6 Results and Discussion...8 Surveys Collected & Response Rates...8 Profile of visitors...8 Use Patterns...13 Trip Characteristics...13 Visit Characteristics...13 Park Classifications...14 Recreation Activity Participation...15 Satisfaction Measures...15 Overall Satisfaction...15 Satisfaction with Park Features...16 Performance Rating...17 Importance-Performance Measures...19 Crowding...20 Safety Concerns of Visitors...22 Support of Reservation System...22 Support of Carry in/carry Out Trash System...23 Research Recommendations...25 References...26 Department of Parks, Recreation and Tourism - University of Missouri iii
4 Appendix A Missouri State Park Visitor Surveys...28 Appendix B. Survey Protocol...49 Appendix C. Prize Entry Form...51 Appendix D. Observation Survey...53 Department of Parks, Recreation and Tourism - University of Missouri iv
5 List of Tables Table 1. Surveys Collected by State Park...8 Table 2. Surveys Collected by Time Slot...9 Table 3. Socio-demographic Characteristics of Visitors...12 Table 4. Satisfaction of Features for Each Park...16 Table 5. Performance Scores of Specific Park Attributes...17 Table 6. Mean Performance and Importance Scores for Park Attributes...19 Department of Parks, Recreation and Tourism - University of Missouri v
6 List of Figures Figure 1. Ethnic Origin of 1999 Missouri State Park Visitors...9 Figure 2. Residence of Visitors by Zip Code...10 Figure 3. Percentage of 1999 Missouri State Park Visitor Residence in MSAs...11 Figure 4. Local, Day-Use Parks...14 Figure 5. Regional, Destination Parks...14 Figure 6. Long-Distance, Destination Parks...14 Figure 7. Participation in Recreational Activities...15 Figure 8. Satisfaction with Park Features (By Park)...17 Figure 9. Performance Ratings of All Visitors (By Park)...18 Figure 10. Importance-Performance Matrix of Park Attributes...20 Figure 11. Mean Crowded Scores of Each Park...21 Figure 12. Overall Satisfaction is Lower for Those Who Felt Crowded...21 Figure 13. Levels of Satisfaction and Perceptions of Crowding by Safety Concern...22 Figure 14. Percentage of Safety Attributes Chosen by Visitors...22 Figure 15. Comparison of Support for Reservation System Between Parks...23 Figure 16. Comparison of Support for Reservation System Between Groups...24 Figure 17. Comparison of Support for Carry In/Carry Out Trash Removal System Between Parks...24 Figure 18. Comparison of Support for Carry In/Carry Out Trash Removal System Between Groups...25 Department of Parks, Recreation and Tourism - University of Missouri vi
7 Introduction NEED FOR RECREATION RESEARCH In 1939, 15 years after Missouri obtained its first state park, 70,000 visitors were recorded visiting Missouri s state parks (Masek, 1974). Today, the increase in demand for outdoor recreation experiences has given rise to over 16 million visitors who, each year, visit the 80 parks and historic sites in Missouri s state park system (Holst & Simms, 1996). Along with this increase in demand for outdoor recreation experiences are other highly significant changes in outdoor recreation. Some of these changes include a change in the nature of vacations with a trend toward shorter, more frequent excursions; an increasing diversity of participation patterns across groups; an increase in more passive activities appropriate for an aging population; an increased concern for the health of the environment; and a realization of the positive contributions the physical environment has on the quality of one s life (Driver, Dustin, Baltic, Elsner, & Peterson, 1996; Tarrant, Bright, Smith, & Cordell, 1999). Societal factors responsible for these changes in the way Americans recreate in the outdoors include an aging population; a perceived decline in leisure time and a faster pace of life; geographically uneven population growth; increasing immigration; changes in family structures, particularly an increase in single-parent families; increasing levels of education; a growth in minority populations; and an increasing focus on quality lifestyle management (Driver et al., 1996; Tarrant et al, 1999). These factors and their subsequent changes in outdoor recreation participation have important implications for recreation resource managers, who are now faced with recreation resource concerns that are people issues and not resource issues alone (McLellan & Siehl, 1988). This growing social complexity combined with the changes it has created in outdoor recreation participation have given rise to the need for research exploring why and how people recreate in the outdoors as well as how these individuals evaluate the various aspects of their outdoor recreation experiences. STUDY PURPOSE Visitor satisfaction tends to be a primary goal of natural resource recreation managers (Peine, Jones, English, & Wallace, 1999) and has been defined as the principal measure of quality in outdoor recreation (Manning, 1986). Visitor satisfaction, however, can be difficult to define because individual visitors are unique. Each visitor may have different characteristics, cultural values, preferences, attitudes, and experiences that influence their perceptions of quality and satisfaction (Manning, 1986). Because of these differences in visitors, a general overall satisfaction question alone could not adequately evaluate the quality of visitors experiences when they visit Missouri s state parks and historic sites. For this reason, it is necessary to gather additional information about visitor satisfaction through questions regarding: a) visitors Department of Parks, Recreation and Tourism - University of Missouri 1
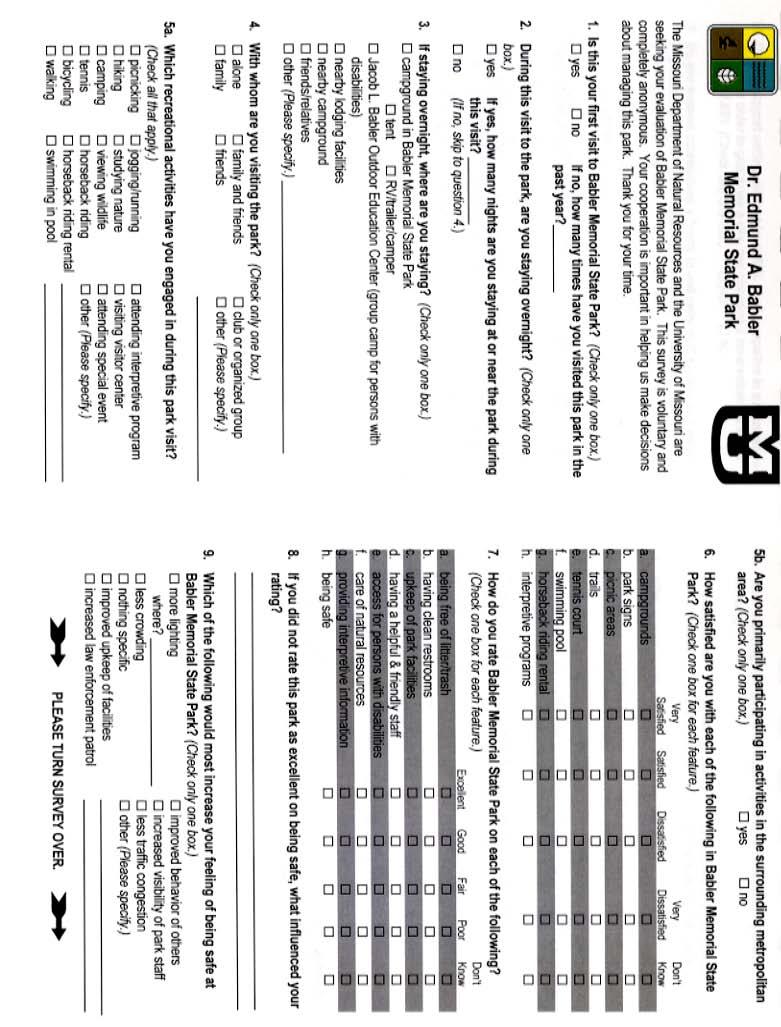
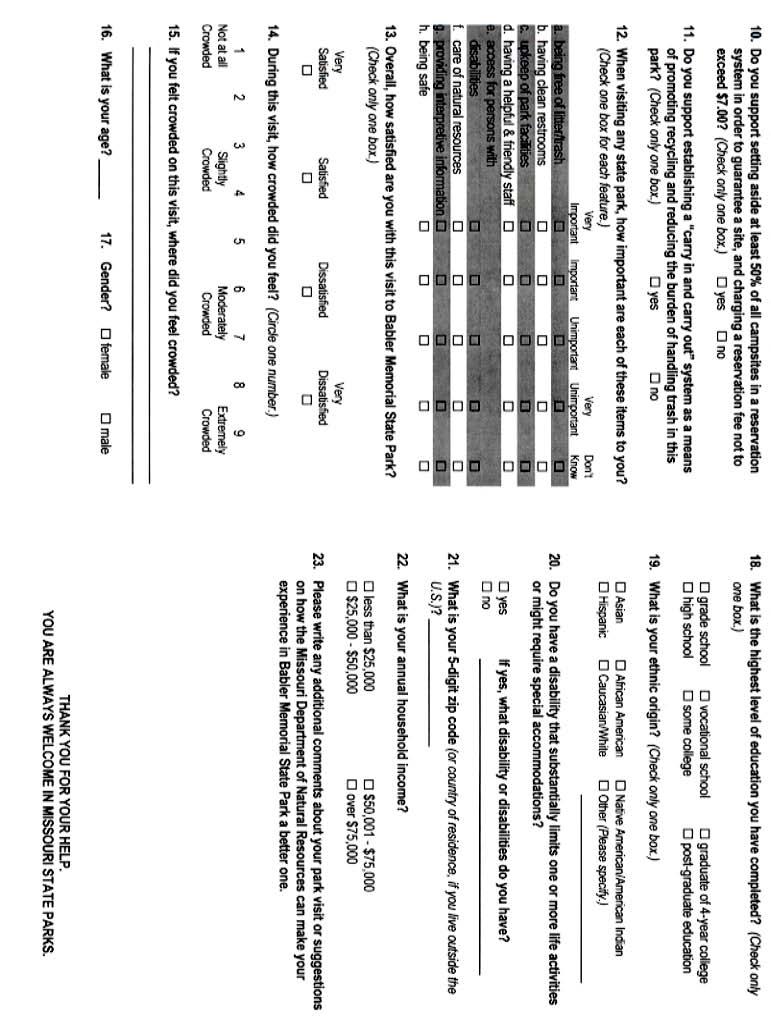
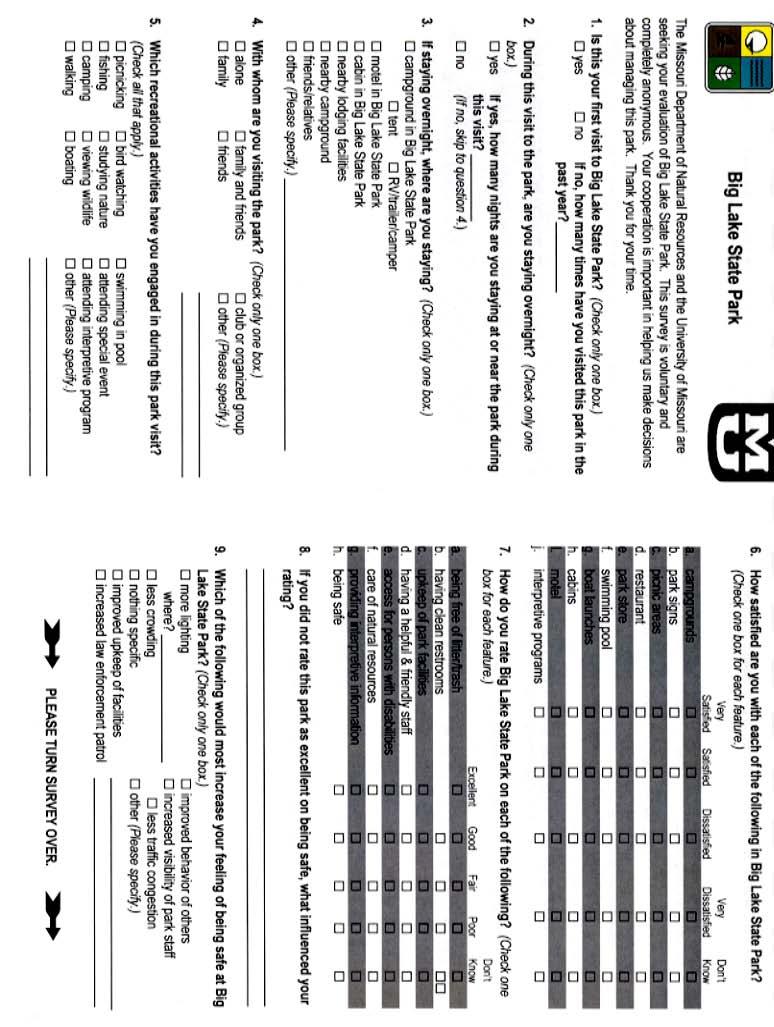
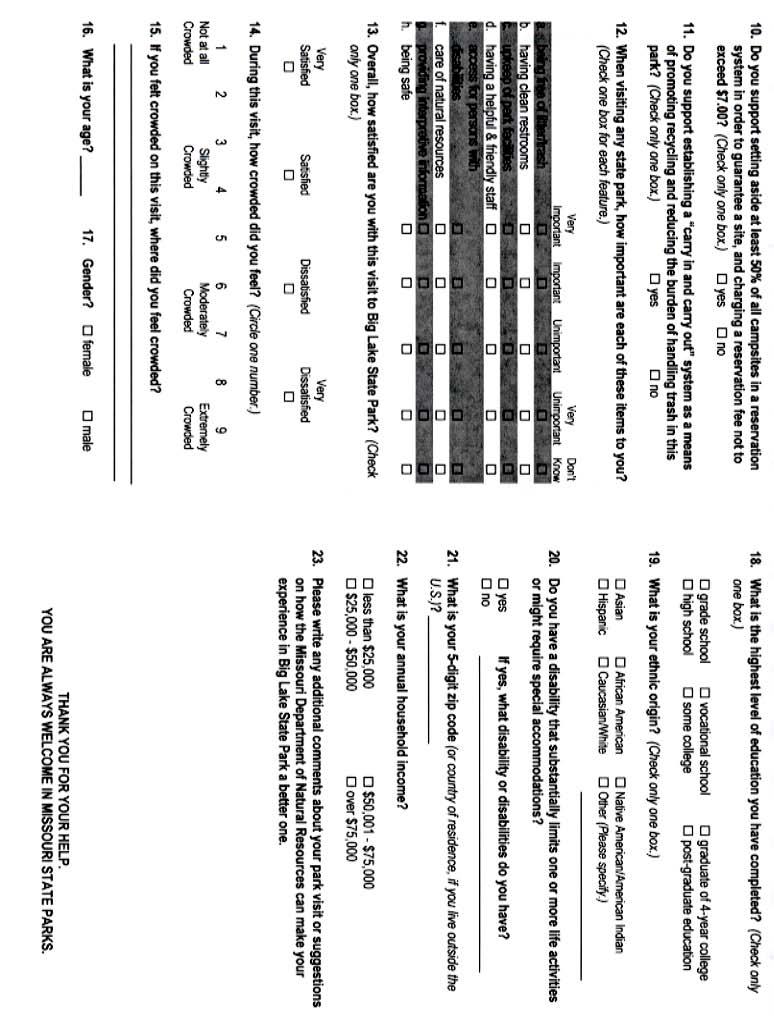
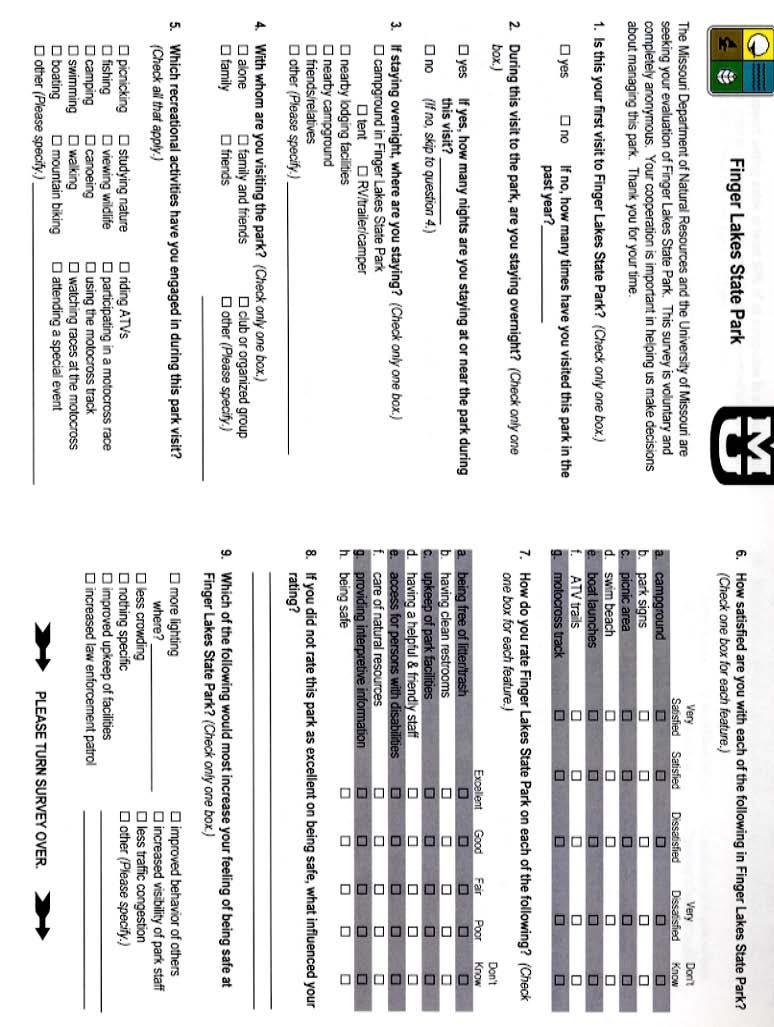
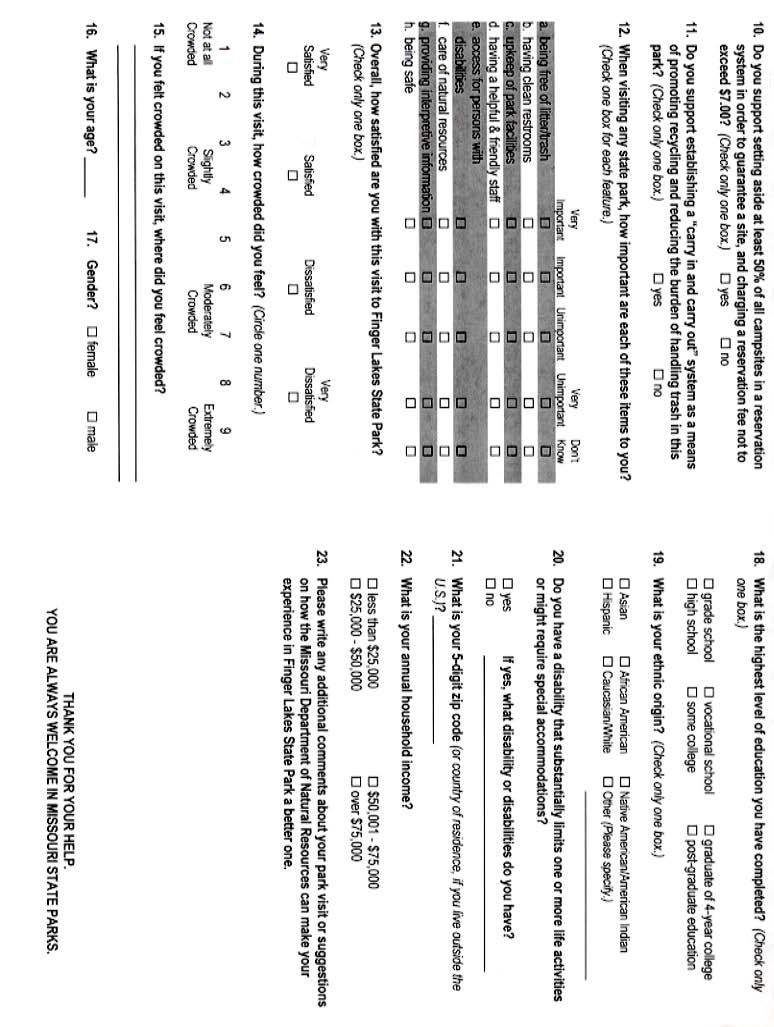
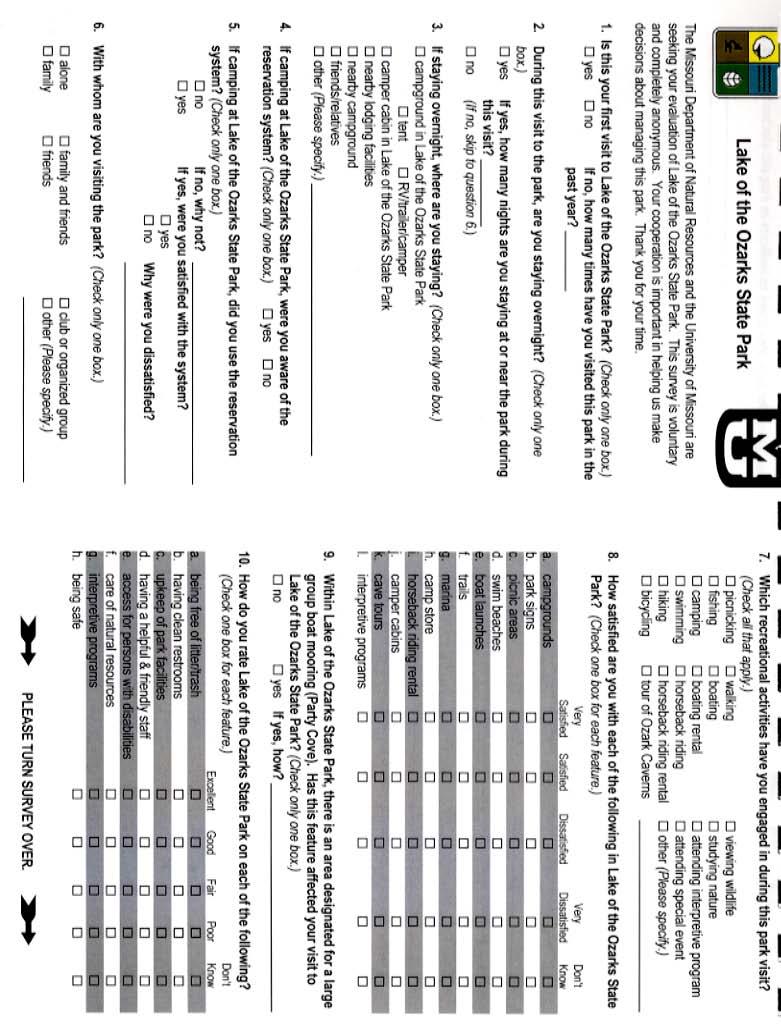
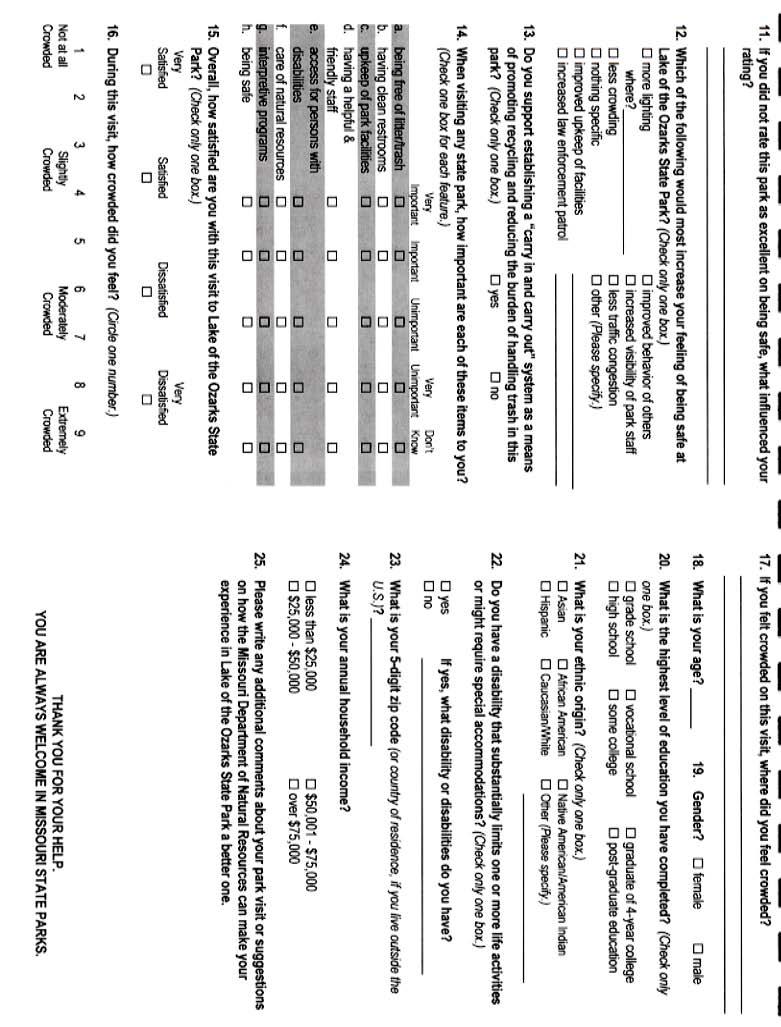
8 socio-demographic characteristics; b) visitors satisfaction with programs, services and facilities; c) visitors perceptions of safety; and d) visitors perceptions of crowding. Thus, the purpose of this study is to gain information, through these and other questions, about the use patterns, sociodemographic characteristics, and satisfaction with park programs, facilities, and services of visitors to ten of Missouri s state parks. This report compares the results of the visitor surveys conducted at Babler Memorial State Park, Big Lake State Park, Finger Lakes State Park, Lake of the Ozarks State Park, Long Branch State Park, Pershing State Park, Table Rock State Park, Trail of Tears State Park, Harry S Truman State Park, and Wakonda State Park. STUDY AREAS Babler Memorial State Park Located in St. Louis County, Babler Memorial State Park (BMSP) provides an oasis of greenspace in a growing suburban area of the St. Louis metropolitan region. Nearly 2,500 acres of a heavily wooded landscape with a campground and a riding stable, Babler also provides amenities more typical of urban parks: a swimming pool, picnic areas, a tennis court, and biking and hiking trails. Babler is also unique in its providing a camp for campers with special needs, the Jacob L. Babler Outdoor Education Center. Big Lake State Park Located in Holt County in the extreme northwest corner of Missouri, Big Lake State Park (BLSP) lies along side the oxbow Big Lake, providing a wonderful recreational opportunity for fishermen. In the path of a major migratory flyway and near Squaw Creek National Wildlife Refuge, Big Lake is also a paradise for birdwatchers. The park also provides many other amenities for recreationists, including a campground, picnic areas and playground, a swimming pool, rental cabins, a motel, and a restaurant and park store. Finger Lakes State Park Once an area strip-mined for coal, Finger Lakes State Park (FLSP) provides a successful example of the reclamation of lands for recreation. Ten miles north of Columbia in Boone County, Finger Lakes offers many outdoor recreational opportunities including fishing, canoeing, boating, and swimming in the several finger lakes. As with most state parks, a campground and picnic areas are also to be found in the park, but Finger Lakes most unique recreational opportunity is not one associated with the majority of Missouri s state parks. The park s once ravaged landscape has become one of the most popular places in which to ride all-terrain-vehicles (ATVs) and off-road-vehicles (ORVs). To accommodate this popularity, the park has many miles of trails specifically designated for ATV and ORV use, as well as a motocross track for races. Lake of the Ozarks State Park Located in the middle of perhaps one of the most intensively developed and most commercial of Missouri s tourism landscapes, Lake of the Ozarks State Park (LOSP) remains true to its natural setting and provides an alternative to the visitor seeking to escape the surrounding tourist attractions. The largest park in the state park system with over 17,000 Department of Parks, Recreation and Tourism - University of Missouri 2
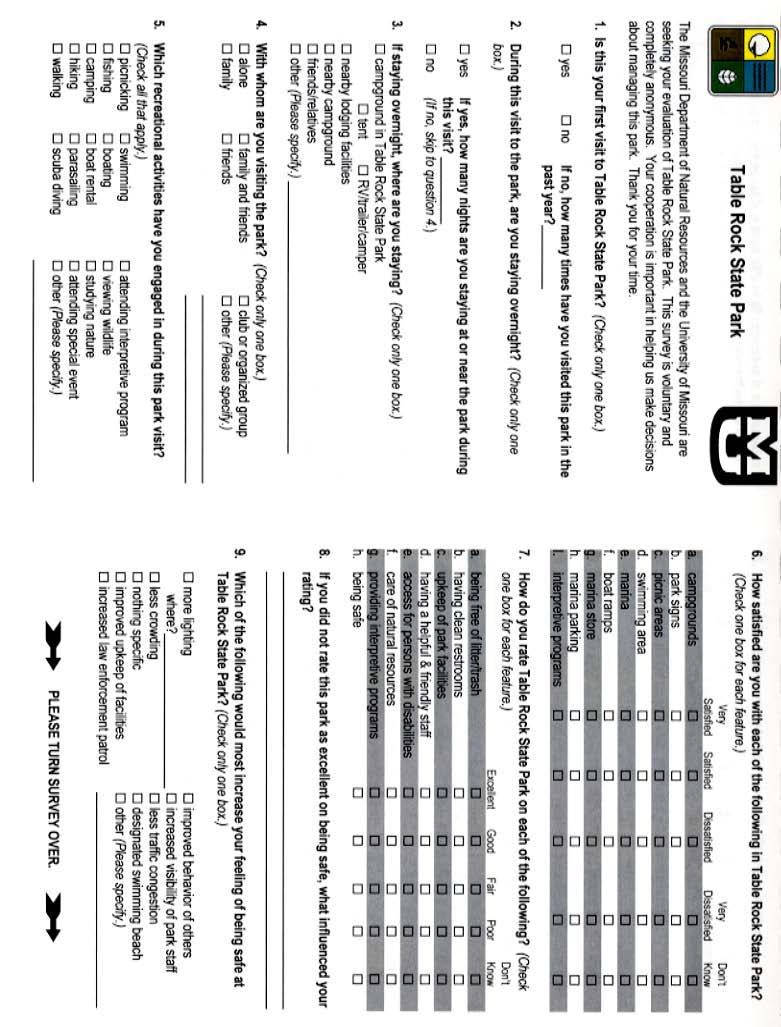
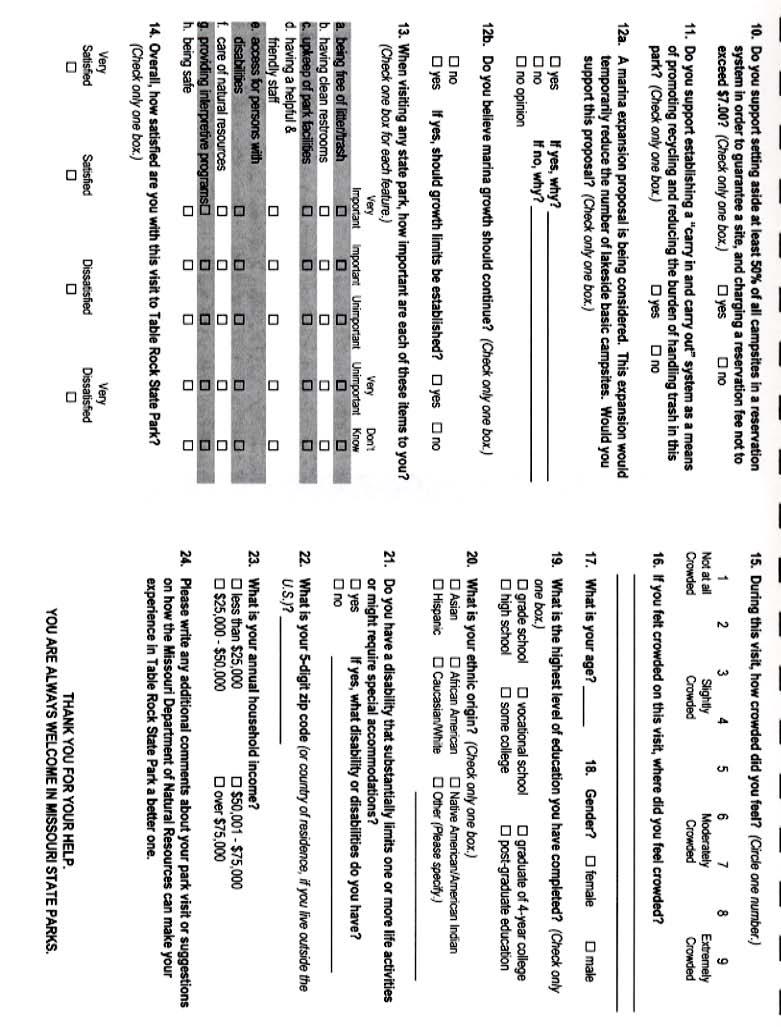
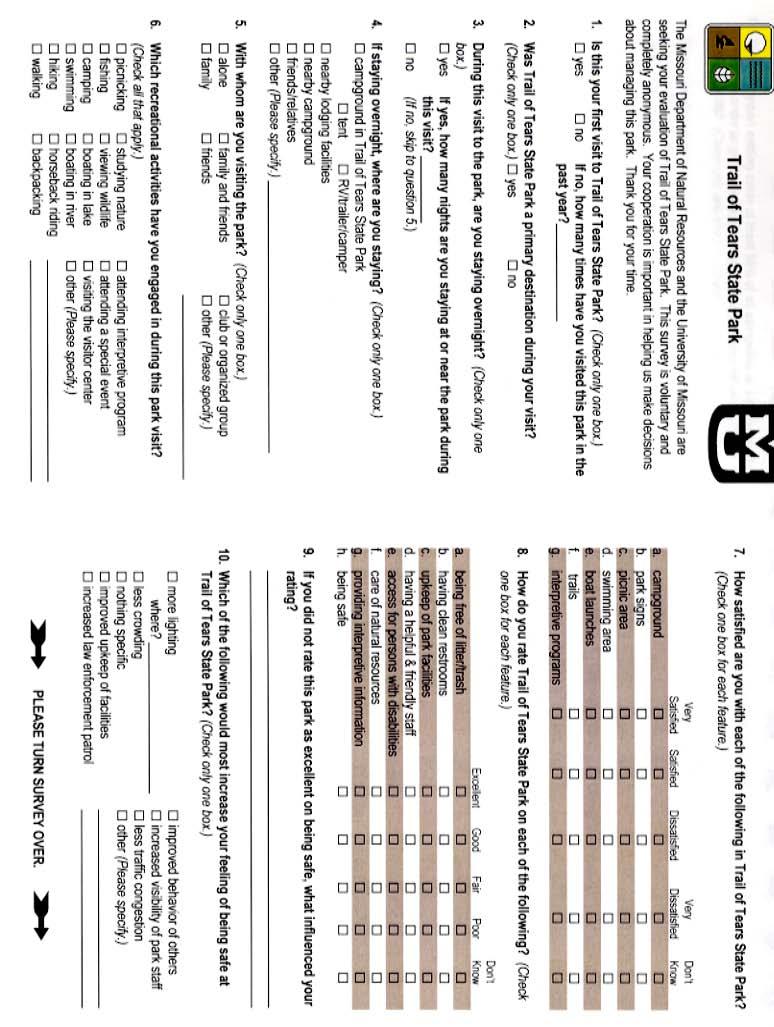
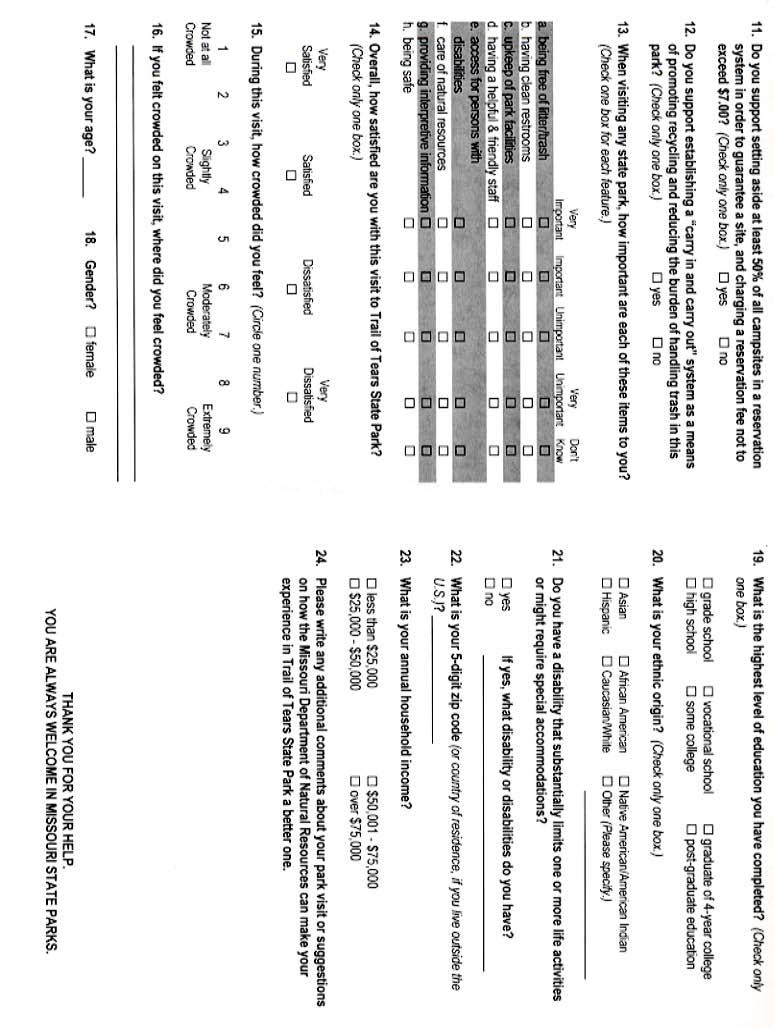
9 acres surrounding Lake of the Ozarks, LOSP offers many recreational facilities: picnic areas, swimming beaches, campgrounds, camp store, marina, boat launches, horseback riding stables, hiking and riding trails, and camper cabins. Nearby Ozark Caverns offers guided tours of the cave, a visitor center, and a self-guided nature trail through Coakley Hollow Natural Area. Long Branch State Park Set amongst woodland and restored prairie, Long Branch State Park borders the 2,450-acre Long Branch Lake well known for its great fishing opportunities. Besides fishing, Long Branch also offers access for boating, a swim beach, camping, picnicking, and an exercise trail along the lake. At one time, a marina was also located on the lake in the park, but has since been closed. Park managers concerned with providing enjoyable recreational experiences to visitors are interested in determining how important a marina is to Long Branch s visitors. For this reason, a question regarding the importance of the marina was included on the questionnaire for the 1999 Long Branch State Park Visitor Survey. Pershing State Park Pershing State Park (PSP), located in Linn County near Laclede, is perhaps one of the most unique parks in the Missouri state park system. Locust Creek runs through Pershing State Park and contributes to its uniqueness by being one of the few remaining unchannelized larger streams in Missouri. Also located in the park are wetlands consisting of swamps, marshes, and a wet prairie. Pershing offers camping, picnicking, swimming, and fishing as well as an archery range and a 1.5 mile interpretive boardwalk accessing the wetland area. Table Rock State Park Just north of the Arkansas border, Table Rock State Park (TRSP) is located on Table Rock Lake. The park s proximity to Branson, Missouri makes it a popular spot for visitors both from Missouri and from other states. Because of this popularity, TRSP offers many unique amenities, among them a full-service marina with a dive shop, boat rentals, and parasailing equipment. Use of the marina has increased to such an extent that a proposal for marina expansion is currently being considered. This proposal was brought to the attention of TRSP visitors, who were asked to voice their opinion of the proposal during the 1999 Table Rock State Park Visitor Survey. Trail of Tears State Park Located along the Mississippi River in Cape Girardeau County, Trail of Tears State Park (TTSP) contains many beautiful hardwood species typical of the Ozarks but also contains a type of forest more characteristic of the forests found in the Appalachian Mountains. This forest diversity, along with its location along the Mississippi River, makes Trail of Tears a prime recreational area with its campground, boating and fishing accesses to the river and Lake Boutin, swimming beach, picnic areas, trails, and overlooks. The park also offers a visitor center with exhibits interpreting the rich natural and cultural history of the park, particularly exhibits displaying the history of the infamous Trail of Tears march by the Cherokee Indians. Department of Parks, Recreation and Tourism - University of Missouri 3
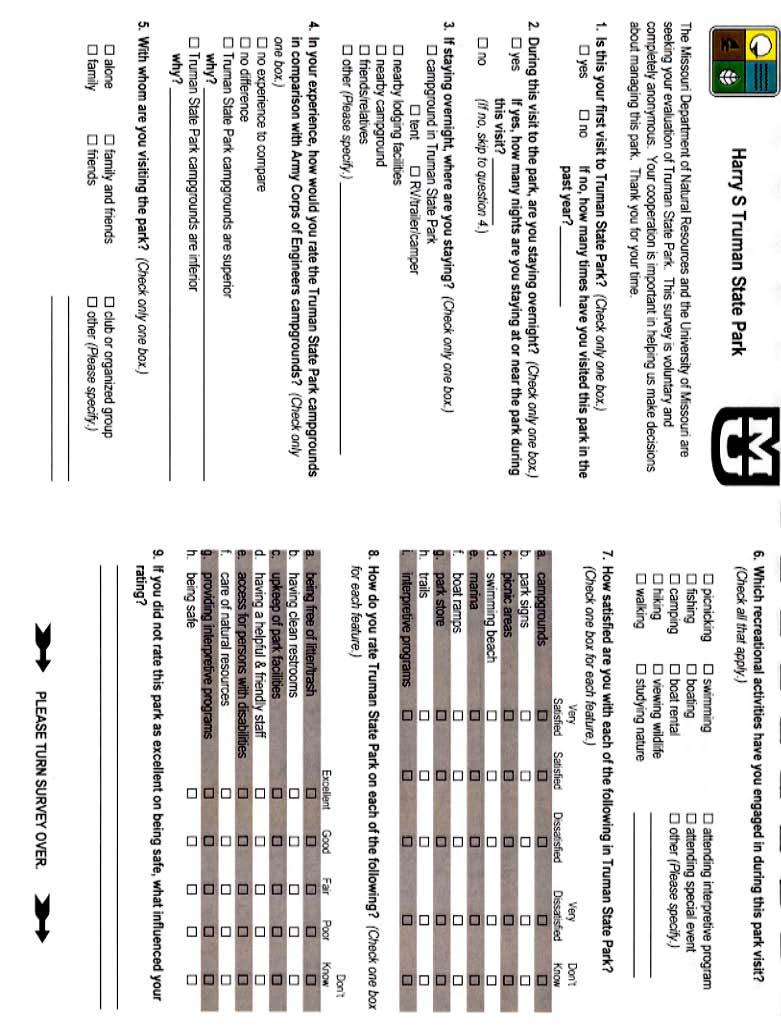
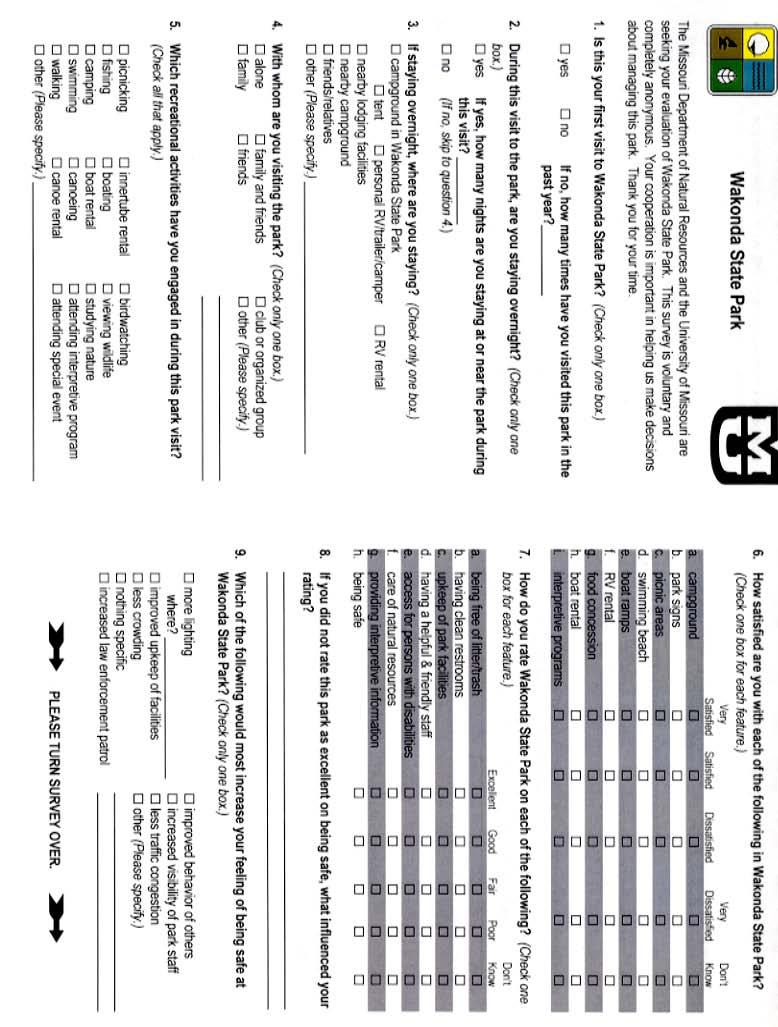
10 Harry S Truman State Park Home to several unique prairie grasses and flowers, the landscape at Harry S Truman State Park (TSP) also provides open woodland and savanna. Combining these diverse landscape types with the vast Truman Lake has created an exceptional recreational area where visitors can camp, picnic, swim, boat, fish, watch wildlife, and enjoy the beautiful natural surroundings. A campground, swimming beaches, boat ramps, picnic areas, and a full-service marina are all offered in the park. Wakonda State Park Located in northeast Lewis County, Wakonda State Park (WSP) lies along side the Mississippi River just west of the Illinois border. The park offers many different recreational opportunities, with its several lakes, sand prairies, and large sandy beach. Recreationists are able to fish, bird watch, boat, camp, picnic, swim, and participate in a variety of beach sports. Wakonda also offers some unique amenities not typical of most other state parks, including boat and canoe rentals, a food concession, and RV rentals. SCOPE OF STUDY The population of the visitor study at the ten state parks consisted of all visitors who were 18 years of age or older (adults), and who visited these areas from June to October The results of this study only reflect visitors during the study period. Department of Parks, Recreation and Tourism - University of Missouri 4
11 Methodology The following is a brief description of the methodology used during the 1999 Missouri State Parks Visitor Survey. For a more complete explanation of the methodology used at each state park, please refer to their individual reports (Fredrickson & Vessell, 1999a, 1999b, 2000a, 2000b, 2000c, 2000d, 2000e, 2000f, 2000g, 2000h). SAMPLING PROCEDURES A 95% confidence interval was chosen for each park. Margins of error ranged from plus or minus 5% to plus or minus 9% based on the sample sizes from each park survey. The study period for the 1999 Missouri State Parks Visitor Survey was from June 1 to October 31, A random sample of adult visitors (18 years of age and older) who visited the ten state parks during the study period were the respondents for this study. Three time slots were chosen for surveying: Time Slot 1 = 8 a.m. 12 p.m., Time Slot 2 = 12 p.m. 4 p.m., and Time Slot 3 = 4 p.m. 8 p.m. A time slot was randomly chosen for each of the ten parks and assigned to the first of the scheduled survey dates for those parks. Thereafter, time slots were assigned in ranking order based on the first time slot. This method was chosen to allow each of the three time slots to be surveyed approximately the same number of times during the study period. This method was also chosen to allow visitors leaving the parks at various times of the day an equal opportunity for being sampled. QUESTIONNAIRE The questionnaires used in this study were based on the questionnaire developed by Fink (1997) for the Meramec State Park Visitor Survey. Copies of the questionnaires for this study are provided in Appendix A. SELECTION OF SUBJECTS The surveys of visitors during the 1999 Missouri State Parks Visitor Survey were administered on-site, to eliminate the non-response bias of a mail-back survey. Where possible, exit surveys were conducted of visitors leaving the various parks. At these parks, a systematic sampling of all adults in every nth vehicle (pre-determined by past years visitation data) was conducted as the vehicles exited. Exit surveys were conducted at the following state parks: Babler, Big Lake, Finger Lakes, Long Branch, Table Rock, Trail of Tears, and Wakonda. Because an exit survey was not always feasible at every park due to dangerous traffic, lack of areas for pulling over vehicles, multiple exits, etc., on-site surveys of identified recreation areas within these parks were conducted. Onsite, roving surveys were conducted at Lake of the Ozarks State Park, Pershing State Park, and Truman State Park. Exit surveys, however, provide the most robust sampling strategy to precisely define the visitor population (Peine, et al., 1999). It is recommended, therefore, that exit surveys be conducted at other state parks and historic sites if at all possible. Department of Parks, Recreation and Tourism - University of Missouri 5
12 DATA COLLECTION The surveyors wore state park T-shirts or state park identification and were either stationed at the entrances into the various parks or recreation areas or walked roving routes between the recreation areas at the parks. During the selected time slot, the surveyors asked every visitor who was 18 years of age and older and in the exiting vehicles or at the various recreation areas to voluntarily complete the questionnaire, unless he or she had previously filled one out. To increase participation rates, respondents were given the opportunity to enter their name and address into a drawing for a prize package and were assured that their responses to the survey questions were anonymous and would not be attached to their prize entry form. Willing participants were then given a pencil and a clipboard with the questionnaire and prize entry form attached. Once respondents were finished, the surveyors collected the completed forms, clipboards, and pencils. Survey protocol is given in Appendix B and a copy of the prize entry form is provided in Appendix C. Observation surveys were also conducted to obtain additional information about: date, day, time slot, and weather conditions of the survey day; the number of adults and children in each group of survey participants; and the number of individuals asked to fill out the questionnaire, whether they were respondents, non-respondents, or had already participated in the survey. This number was used to calculate response rate, by dividing the number of useable surveys collected by the number of adult visitors asked to complete a questionnaire. A copy of the observation survey form is provided in Appendix D. DATA ANALYSIS The data obtained for the 1999 Missouri State Parks Visitor Survey was analyzed with the Statistical Packages for the Social Sciences (SPSS) (SPSS, 1996). Frequency distributions and percentages of responses to the survey questions were determined. The number of surveys completed by weekday versus weekend, by time slot, and by park was also determined. Comparisons using independent sample t-tests for each group were also made to determine any statistically significant differences (p<.05) in the following selected groups satisfaction with park features, ratings of park attributes, overall satisfaction, and perceptions of crowding. The selected groups include: 1. First time visitors versus repeat visitors. 2. Overnight visitors versus dayusers. Day-users include both day-users and the overnight visitors who did not stay overnight in the ten parks. Overnight visitors include those visitors who stayed overnight in the parks, whether they were camping or staying in other facilities within the parks. 3. Weekend visitors versus weekday visitors. Weekend visitors were surveyed on Saturday and Sunday, weekday visitors were surveyed Monday through Friday. Other comparisons were made using independent sample t-tests to determine Department of Parks, Recreation and Tourism - University of Missouri 6
13 in any statistically significant differences in visitors who rated the parks as excellent on being safe versus visitors who rated the parks good, fair, or poor on being safe, for the following categories: 1. First time versus repeat visitors. 2. Overnight visitors versus dayusers. 3. Weekend versus weekday visitors. Differences between visitors who rated the parks as excellent on being safe versus those who did not were also compared on the following questions: differences in socio-demographic characteristics, differences in perceptions of crowding, measures of satisfaction with park features, measures of performance of park attributes, and overall satisfaction. Chi-square tests were conducted comparing responses between select groups regarding support for a reservation system and support for a carry in and carry out trash system. The selected groups include: 1. First time versus repeat visitors. 2. Overnight visitors versus dayusers. 3. Weekend versus weekday visitors. An additional independent sample t-test compared overall satisfaction between visitors who felt some degree of crowding and visitors who were not at all crowded. Department of Parks, Recreation and Tourism - University of Missouri 7
14 Results and Discussion This section describes the results of the 1999 Missouri State Parks Visitor Survey. For a more in-depth examination of the results from the ten state park surveys, see the individual reports of each survey (Fredrickson & Vessell, 1999a, 1999b, 2000a, 2000b, 2000c, 2000d, 2000e, 2000f, 2000g, 2000h). This section also provides relevant management implications and future research suggestions. SURVEYS COLLECTED & RESPONSE RATES A total of 2,054 surveys were collected during the 1999 Missouri State Parks Visitor Survey. Table 1 shows the number of surveys collected at each state park. The overall response rate was 66.6%. Overall response rates ranged from 46% to 97%. Of the 2,054 surveys collected, 1,350 (65.8%) were collected on the weekends (Saturday and Sunday), and 703 (34.2%) were collected on the weekdays (Monday through Friday). Table 2 shows the frequency and percentage of surveys collected during each of the three time slots. PROFILE OF VISITORS Table 3 lists the socio-demographic characteristics of the visitors to the ten state parks. When grouped into four categories, 27.6% of the adult visitors to the ten parks were between the ages of 18-34, 45.6% were between the ages of 35-54, 14.2% were between the ages of 55-64, and 12.6% were 65 years of age or older. The average age of all adult visitors to the ten parks was 44.7, with visitors to Finger Lakes State Park having the lowest average age (36.5) and visitors to Big Lake State Park having the highest average age (53.4). This difference in age may be due in part to the recreational resources at Finger Lakes State Park attracting younger visitors and the recreational resources at Big Lake State Park attracting older visitors and retirees. Table 1. Surveys Collected by State Park Park Frequency Percent Babler % Big Lake % Finger Lakes % Lake of the Ozarks % Long Branch % Pershing % Table Rock % Trail of Tears % Truman % Wakonda % Total 2, % Department of Parks, Recreation and Tourism - University of Missouri 8
15 Visitors were more male than female, with males comprising 55.4% of all visitors and females comprising 44.6% of all visitors. Over one-third (36.1%) of all visitors indicated having completed vocational school (7.6%) or some college (28.5%) as the highest level of education completed. Another third (34.6%) indicated having completed grade school (2.7%) or high school (31.9%). Less than one-third (29.2%) of visitors indicated having completed a four-year college degree (15.4%) or post-graduate education (13.8%). Visitors to Babler State Park had the highest level of education, with over half (55.5%) of the visitors to Babler reporting having completed a four-year degree or post-graduate education. Visitors to Wakonda State Park had the lowest level of education, with almost half (48%) reporting grade school or high school as the highest level of education completed. Most visitors (40.2%) reported having an annual income of between $25,000 and $50,000. Twenty-three percent (22.6%) of visitors reported an annual income of between $50,000 and $75,000. About 19% (18.9%) of visitors reported an annual income of less than $25,000, and 18.3% reported an income of over $75,000. Babler State Park visitors reported having higher annual incomes when compared to the other parks. Two-thirds (64.1%) of Babler State Park visitors indicated having a household income of over $50,000. Babler s location within the St. Louis metropolitan area and the high percentage of its visitors with fouryear degrees or post-graduate education Table 2. Surveys Collected by Time Slot Time Slot Frequency Percent 1. 8 a.m.-12 p.m % p.m.-4 p.m % 3. 4 p.m.-8 p.m % Total 2, % combine to account for the higher level of household incomes of Babler visitors. The vast majority (93.0%) of visitors to the parks was Caucasian in ethnic background, whereas 3.2% reported to be Native American, 1.5% were African American, 1.0% were Hispanic, and less than 1% (.8%) were Asian. Figure 1 depicts the ethnic origin of visitors during the 1999 Missouri State Parks Visitor Survey. Six percent (6%) of all visitors indicated having some type of disability that substantially limited one or more life activities or that required special accommodations. Big Lake State Park had the highest percentage (10.3%) of Figure 1. Ethnic Origin of 1999 Missouri State Park Visitors Hispanic 1.0% Native Asian American 0.8% 3.2% Caucasian 93.5% African American 1.5% Department of Parks, Recreation and Tourism - University of Missouri 9

16 Figure 2. Residence of Visitors by Zip Code. Babler Big Lake Finger Lakes Lake of the Ozarks Long Branch Pershing Table Rock Trail of Tears Truman Wakonda visitors who reported some type of disability. This higher percentage may be related to the older age of visitors to Big Lake. The majority (74.9%) of visitors to the ten state parks was from Missouri, with 9.1% of the visitors from Illinois, 2.8% from Iowa, 2.4% from Kansas, and 2.2% from Nebraska. Figure 2 shows the residence of visitors by zip code. Over half (52%) of Wakonda s visitors were from out of state, almost half (46%) of Table Rock s visitors were from out of state, and over one-third (38%) of Big Lake s visitors were from out of state. Truman and Lake of the Ozarks also had one-third (36% and 33% respectively) of their visitors from other states. DSP has expressed an interest in classifying visitors by their residence in Metropolitan Statistical Areas (MSA). The first attempt to classify state park visitors by their MSA was made with the 1999 Missouri State Parks Visitor data. While knowledge of visitor residence is potentially valuable, the profile of cumulative state park visitation is more relevant. It is recommended that visitor data from the 1997, 1998, and future visitor survey data also be profiled for MSA residence. Department of Parks, Recreation and Tourism - University of Missouri 10
17 Missouri has an overall population of approximately 5,468,000 residents, over two-thirds (68%) of whom live within a MSA (U.S. Census Bureau, 1999). St. Louis and Kansas City MSA residents account for almost 60% (59%) of Missouri residents (this includes Missouri residents only, and not the Kansas residents who live within the Kansas City MSA and the Illinois residents who live within the St. Louis MSA). Over one-third (35.8%) of Missouri residents alone live within the St. Louis MSA, and 23% live within the Kansas City MSA (Missouri State Census Data Center [MSCDC], 1998). While about half (49.4%) of the 1999 Missouri State Park visitors were from non-metropolitan areas, 30.8% were from the St. Louis Metropolitan Statistical Area, 9.5% were from the Columbia MSA, and 6.9% were from the Kansas City MSA. One percent (1.3%) of the visitors were from the St. Joseph MSA, and 1.3% were from the Springfield MSA. Less than 1% (0.6%) of the visitors were from the Joplin MSA. Thirteen percent (13.4%) of the Illinois visitors were from the St. Louis MSA, and over half (54.3%) of the Kansas visitors were from the Kansas City MSA. Figure 3 shows the percentage of visitor residence in MSAs. The high percentage of 1999 visitors from the St. Louis MSA may be accounted for by the visitors from Babler State Park (located within the St. Louis MSA). Of the 1999 parks surveyed, Babler State Park visitors accounted for 72.3% and Lake of the Ozarks visitors accounted for 12% of visitors from the St. Louis MSA. Visitors from Truman State Park accounted for 44.7%, Table Rock visitors accounted for 13%, and Big Lake visitors accounted for 11.4% of the visitors from the Kansas City MSA. Figure 3. Percentage of 1999 Missouri State Park Visitor Residence in MSAs 50% 45% 40% 35% 30% 25% 20% 15% 10% 5% 0% 49.4% 30.8% 9.5% 6.9% 1.3% 1.3% 0.6% Non-metropolitan area St. Louis Columbia Kansas City St. Joseph Springfield Joplin Department of Parks, Recreation and Tourism - University of Missouri 11
18 Table 3. Socio-demographic Characteristics of the 1999 Missouri State Parks Adult Visitor by Park Mean Age Gender Education Annual Income Ethnic Origin 14.7% high school or less 29.8% voc. school/some college 55.5% 4-yr. degree/post-graduate Babler % male 47.8% female Big Lake % female 48.7% male Finger Lakes % male 31.6% female Lake of the Ozarks % male 40.2% female Long Branch % male 46.4% female Pershing % female 43.7% male Table Rock % male 39.7% female Trail of Tears % male 41.8% female Truman % male 47.6% female Wakonda % male 47.2% female 42.0% high school or less 43.0% voc. school/some college 15.0% 4-yr. degree/post-graduate 33.0% high school or less 40.3% voc. school/some college 26.7% 4-yr. degree/post-graduate 29.9% high school or less 43.7% voc. school/some college 26.4% 4-yr. degree/post-graduate 47.4% high school or less 31.7% voc. school/some college 21.0% 4-yr. degree/post-graduate 43.7% high school or less 32.8% voc. school/some college 23.5% 4-yr. degree/post-graduate 28.3% high school or less 41.4% voc. school/some college 30.3% 4-yr. degree/post-graduate 38.5% high school or less 35.6% voc. school/some college 25.9% 4-yr. degree/post-graduate 44.3% high school or less 38.4% voc. school/some college 17.3% 4-yr. degree/post-graduate 48.0% high school or less 35.3% voc. school/some college 16.7% 4-yr. degree/post-graduate 8.7% <$25, % $25-50, % $50-75, % >$75, % <$25, % $25-50, % $50-75, % >$75, % <$25, % $25-50, % $50-75, % >$75, % <$25, % $25-50, % $50-75, % >$75, % <$25, % $25-50, % $50-75, % >$75, % <$25, % $25-50, % $50-75, % >$75, % <$25, % $25-50, % $50-75, % >$75, % <$25, % $25-50, % $50-75, % >$75, % <$25, % $25-50, % $50-75, % >$75, % <$25, % $25-50, % $50-75, % >$75, % Caucasian 2.6% Hispanic 1.8% African American 1.3% Native American* 1.0% Asian 91.5% Caucasian 6.8% Native American* 0.9% African American 88.8% Caucasian 5.9% Native American* 3.2% African American 1.1% Asian 1.1% Hispanic 95.9% Caucasian 2.1% Asian 1.0% Native American* 0.5% Hispanic 89.5% Caucasian 7.3% Native American* 1.5% African American 1.1% Asian 0.7% Hispanic 95.2% Caucasian 2.4% Native American* 1.6% African American 0.8% Hispanic 95.0% Caucasian 1.5% African American 1.5% Native American* 1.0% Asian 0.5% Hispanic 91.2% Caucasian 3.6% Native American* 2.9% African American 0.7% Hispanic 97.0% Caucasian 3.0% Native American* 97.0% Caucasian 1.0% African American 1.0% Native American* 0.5% Hispanic Disabled Visitors Residence 3.9% 89.4% MO 2.3% IL 10.3% 61.1% MO 20.4% NE 8.0% IA 7.1% KS 5.8% 88.8% MO 2.8% IL 2.8% TX 6.8% 66.8% MO 12.4% IL 6.7% IA 8.2% 87.9% MO 5.3% IL 2.7% IA 5.6% 83.5% MO 8.3% IL 2.5% NE 4.6% 53.5% MO 8.0% AR 7.5% IL 4.8% OK 3.7% 75.2% MO 7.0% IL 3.1% FL 8.3% 64.0% MO 16.0% KS 5.6% NE 5.1% 48.0% MO 43.0% IL 4.5% IA * The percentage of visitors reporting to be of Native American descent does not reflect the actual population of Native Americans in Missouri and, except in the case of Trail of Tears State Park, may be due in part to the confusion of visitors regarding the phrase Native American/American Indian on the questionnaire. Visitors also may not understand the phrase Caucasian/White. It is recommended that the question be reworded to read White and American Indian.
19 USE PATTERNS Trip Characteristics The majority (76.1%) of visitors to the ten state parks traveled less than a day s drive to visit the parks (a day s drive is defined as 150 miles or less, not exceeding 300 miles round trip). Of those traveling less than a day s drive, 71.9% lived within 50 miles of the parks they were visiting. In fact, over half (54%) of the visitors traveling less than a day s drive lived within 25 miles of the parks they were visiting. The average number of miles visitors traveled was miles; however, the median number of miles visitors traveled was 39, indicating that half of the visitors traveled less than 39 miles and half traveled more than 39 miles. Visit Characteristics Three-fourths (76%) of visitors were repeat visitors. Long Branch State Park had the highest percentage of repeat visitors (85%) and Lake of the Ozarks had the lowest percentage of repeat visitors (62%). The average number of times visitors reported visiting the various parks within the past year was 14.3 times, with a low of 3.5 times (Lake of the Ozarks State Park) and a high of 38.5 times (Long Branch State Park). These differences are due to the fact that Lake of the Ozarks State Park may be viewed by visitors primarily as a destination park for vacationing, whereas Long Branch State Park visitors may visit the park on a daily or weekly basis, particularly to use the exercise trail. The majority (78.9%) of visitors to the ten state parks visited with family and/or friends, and average group size was about 1.9 adults and 2.0 children per group. Across the parks, almost two-thirds (63.1%) of the visitors were day-users while 36.9% of visitors stayed overnight during their visits. Of those visitors staying overnight, 89.1% of overnight visitors stayed in the campgrounds or other facilities within the parks. Average overnight stays were 3.2 nights, but ranged from Table Rock overnight visitors staying an average of 4.1 nights to Wakonda overnight visitors staying an average of 2.5 nights. An interesting use pattern of visitors to the ten parks is that the majority (65.6%) of campers staying in the campgrounds in the parks reported staying in RVs compared to 34.4% of visitors staying in tents. Research has shown that RV campers tend to be older, between years of age (Fruchter & Schau, 1997). Not surprisingly, RV campers from the 1999 Missouri State Parks Visitor Survey were significantly (p<.001) older than tent campers, with an average age of 51.9 compared to 35.9 for tent campers. This age difference, as well as the higher percentage of campers who camp in RVs, suggest certain management implications for future management of state park campgrounds. This is especially true when considering that Baby Boomers (people years of age one-third of the visitors from the 1999 Missouri State Parks Visitor Survey fall within this age category) already comprise 40% of the RV market (Fruchter & Schau, 1997). And as they age, Baby Boomers are expected to contribute significantly to the anticipated 40% growth in the RV market within the Department of Parks, Recreation and Tourism - University of Missouri 13
20 next ten years (Fruchter & Schau, 1997). As Missouri s population ages, managers can expect to see an increase in the number of RV campers in their state park campgrounds. Figure 4. Local, Day-Use Parks Park Classifications Based on visitor use patterns and zip code distribution, the ten state parks included in the 1999 Missouri State Parks Visitor Survey can be classified into three distinct types of parks. For instance, six of the ten parks were parks whose visitors were primarily day-users who traveled 50 miles or less to visit these parks (Figure 4). Babler, Finger Lakes, Long Branch, Pershing, Trail of Tears, and Wakonda are all included in this category. Most of these parks, with the exception of Pershing, are located near larger towns or cities whose residents may view the parks as virtually local parks and not destination parks. A second classification of parks includes those parks whose visitors were primarily overnight visitors, the majority of whom traveled less than a day s drive to visit the parks (Figure 5). Parks within this category include Big Lake and Truman. And finally, a third type of parks include those parks whose visitors were primarily overnight visitors but who more frequently traveled greater than 150 miles to reach their destinations (Figure 6). Parks included in this category are both Lake of the Ozarks and Table Rock, parks whose vicinities to other recreational opportunities and attractions bring visitors from farther away, thus increasing the number of those visitors staying overnight. Babler Long Branch Trail of Tears Finger Lakes Pershing Wakonda Figure 5. Regional, Destination Parks Big Lake Truman Figure 6. Long-Distance, Destination Parks Lake of the Ozarks Table Rock Department of Parks, Recreation and Tourism - University of Missouri 14
21 Recreation Activity Participation Although recreation activities differed across the ten state parks, several activities were common to many of the parks. For example, 43.1% of all visitors surveyed indicated that they walked during their visits, 35.7% said they camped, and 35.1% said they picnicked. Thirty percent (30.5%) of visitors reported viewing wildlife during their visits, 28.1% went swimming, and 25.8% participated in fishing. Other activities in which visitors participated were hiking (18.3%), boating (15.7%), studying nature (15.3%), attending a special event (4.4%), and attending an interpretive program (3%). Figure 7 shows the percentage of participation in the six highest recreational activities. Figure 7. Participation in Recreational Activities 45% 40% 35% 30% 25% 20% 15% 10% 5% 0% Walking Camping Picnicking Viewing wildlife Swimming Fishing Of note is the small number of visitors who reported attending an interpretive program. When asked how satisfied they were with the interpretive programs or interpretive information provided at the parks, a majority (67.7%) of visitors didn t know how to rate how satisfied they were. A high percentage (42.3%) of visitors also didn t how to rate the performance of parks providing interpretive programs or interpretive information. These results combined with the low number of visitors attending interpretive programs suggest that visitors are not aware of the interpretive programs and thus do not attend them, or do not associate the word interpretive with the information received at the parks. Visitors may also be confused as to the meaning of the word interpretive. Visitors often interpret the phrase interpretive programs/information to mean programs and services offered to visitors who speak foreign languages, and some visitors also simply do not know the meaning of the word interpretive (Beck & Cable, 1998). It is recommended that the wording on the questionnaire be changed to clarify the meaning of interpretive programs/ information. SATISFACTION MEASURES Overall Satisfaction When asked about their overall satisfaction with their visit, 1% of visitors reported being dissatisfied or very dissatisfied with their visit, whereas 30.7% of visitors were satisfied and 68.3% were very satisfied. Visitors mean score for overall satisfaction was 3.67, based on a 4.0 scale with 4 being very satisfied and 1 being very dissatisfied. The mean scores for overall satisfaction between the ten parks ranged from 3.83 to Overall, there was no significant difference in satisfaction between first time and repeat visitors, with mean overall satisfaction scores of 3.70 and Nor was there a significant Department of Parks, Recreation and Tourism - University of Missouri 15
22 difference in overall satisfaction between weekend (3.66) and weekday (3.70) visitors. Although there was a significant difference (p<.05) in overall satisfaction between overnight visitors and day-users, there was no practical difference in their overall satisfaction scores (3.70 and 3.65 respectively). Management should be commended that almost 99% of visitors reported being satisfied or very satisfied with their visits. Williams (1989) states that visitor satisfaction with previous visits is a key component of repeat visitation. The high percentage of repeat visitation (76%) combined with their positive comments provide evidence that Missouri State Park visitors are indeed satisfied with their park experiences. Satisfaction with Park Features Visitors to each of the state parks were asked to express their satisfaction with various park features. Although these features differed at each of the parks, several features were common to most of the areas: campgrounds, picnic areas, park signs, trails, swimming areas, boat ramps, and interpretive programs/ information. Table 4 lists the mean satisfaction scores of these features for each park. Figure 8 represents the satisfaction scores for each park. Overall, campgrounds were given the highest satisfaction score (3.58) and swimming areas were given the lowest (3.38). There were no significant differences between weekend and weekday visitors and their satisfaction ratings of the various park features. There was a significant difference (p<.05), however, between first time and repeat visitors. First time visitors were significantly more satisfied (3.48) than repeat visitors (3.36) regarding the swimming areas at the ten state parks. There were also significant differences between overnight visitors and dayusers. Overnight visitors were significantly (p<.001) more satisfied with the campgrounds than day-users, with satisfaction scores of 3.63 and 3.53 respectively. Overnight visitors were Table 4. Satisfaction of Features for Each Park Campgrounds Picnic Areas Signs Trails Swimming Areas Boat Ramps Interpretive Prog./Info. Babler * 3.45 Big Lake * Finger Lakes ** 3.29 Lake of the Ozarks ** Long Branch ** 3.47 Pershing ** 3.53 Table Rock ** Trail of Tears ** Truman ** Wakonda ** Overall * Denotes swimming pool. ** Denotes swimming beach or other swimming area. Department of Parks, Recreation and Tourism - University of Missouri 16
23 Figure 8. Satisfaction With Park Features (By Park) Campgrounds Picnic Areas Signs Trails Swimming Areas Boat Ramps Interp. Prog./Info. Babler Big Lake Finger Lakes Lake of the Ozarks Long Branch Pershing Table Rock Trail of Tears Truman Wakonda also significantly (p<.01) more satisfied with the picnic areas than day-users (3.60 and 3.52 respectively). And finally, overnight visitors were significantly (p<.05) more satisfied with the swimming areas (3.45) than dayusers (3.35). PERFORMANCE RATING Visitors to the ten parks were asked to rate the performance of each regarding certain attributes: being free of litter and trash, having clean restrooms, upkeep of facilities, having helpful and friendly staff, accessibility for disabled visitors, Big Lake Table 5. Performance Scores of Specific Park Attributes Finger Lakes Lake of the Ozarks Long Branch Table Rock Trail of Tears Truman Wakonda Overall Babler Pershing Free of litter/ trash Clean restrooms Upkeep of facilities Helpful/ friendly staff Disabled access Care of natural resources Interpretive programs/ information Being safe Department of Parks, Recreation and Tourism - University of Missouri 17
24 caring for the natural resources, providing interpretive programs or interpretive information, and being safe. Table 5 lists the mean performance scores of the attributes for each park, and Figure 9 illustrates these scores by park. Overall, being free of litter and trash was given the highest performance rating while having clean restrooms was given the lowest rating. There were significant differences between first time and repeat visitors and their performance ratings of the eight park attributes. First time visitors gave significantly higher (p<.01) performance ratings to the parks being free of litter and trash (3.70) than repeat visitors (3.61), as well as significantly higher (p<.05) ratings to the parks having helpful and friendly staff (3.65 and 3.60 respectively). There were also significant differences in performance ratings between overnight visitors and day-users. Overnight visitors gave significantly higher (p<.05) performance ratings regarding the parks being free of litter and trash (3.66) than day-users (3.61), as well as significantly higher (p<.05) performance ratings regarding the parks having clean restrooms (3.40 and 3.32 respectively). Overnight visitors also gave significantly higher (p<.01) performance ratings regarding the parks having helpful and friendly staff (3.65), disabled accessibility (3.60), care of natural resources (3.58), and being safe (3.65) than day-users (helpful and friendly staff = 3.56, disabled access = 3.50, care of natural resources = 3.51, and being safe = 3.55). A significant difference was also found between weekend and weekday visitors. Weekend visitors a had significantly higher (p<.05) performance rating regarding the care of natural resources (3.56) at the ten state parks when compared to the performance rating of weekday visitors (3.50). Figure 9. Performance Ratings of All Visitors (By Park) Litter/trash Clean restrooms Upkeep Helpful/friendly staff Disabled access Care of natural resources Interp. Prog./Info. Being safe Babler Big Lake Finger Lakes Lake of the Ozarks Long Branch Pershing Table Rock Trail of Tears Truman Wakonda Department of Parks, Recreation and Tourism - University of Missouri 18
25 IMPORTANCE-PERFORMANCE MEASURES The Importance-Performance (I-P) Analysis was used to analyze the performance and importance ratings given by visitors to the eight park attributes. Mean scores were calculated for the responses of the two questions regarding visitors ratings of the performance and importance of the parks being free of litter and trash, having clean restrooms, upkeep of park facilities, having helpful and friendly staff, providing disabled access, care of the natural resources, providing interpretive programs or information, and being safe. Table 6 lists the scores of these attributes, which were based on a 4.0 scale of 4 being excellent and 1 being poor, and 4 being very important and 1 being very unimportant. Figure 10 shows the Importance- Performance (I-P) Matrix. The mean scores were plotted on the I-P Matrix to illustrate the relative performance and importance ratings of the attributes by park visitors. The I-P Matrix is divided into four quadrants to provide a guide to aid in possible management decisions. For example, the upper right quadrant is labeled high importance, high performance and indicates the attributes in which visitors feel the parks are doing a good job. The upper left quadrant indicates the characteristics on which management may need to focus attention, because these are attributes that are important to visitors but were given lower performance ratings. The lower left and right quadrants are less of a concern for managers because they exhibit attributes that are not as important to visitors. Overall, the ten parks were given high importance and performance ratings for being free of litter and trash and being safe. Disabled visitors also gave high importance and performance ratings to the parks providing disabled accessibility. Visitors gave the parks higher importance but marginal performance ratings regarding the care of the natural resources, and gave higher importance but lower performance ratings regarding clean restrooms and upkeep of park facilities. Table 6. Mean Performance and Importance Scores for Park Attributes Attribute Mean Performance Score* Mean Importance Score* A. Being free of litter/trash B. Having clean restrooms C. Upkeep of park facilities D. Having helpful & friendly staff E 1. Access for persons with disabilities E 2. Access for persons with disabilities F. Care of natural resources G 1. Providing interpretive programs/information G 2. Providing interpretive programs/information H. Being safe E 1 = All visitors G 1 = All visitors E 2 = Disabled visitors only G 2 = Visitors attending interpretive programs * 1 = poor performance or low importance rating, 4 = excellent performance or high importance rating Department of Parks, Recreation and Tourism - University of Missouri 19
26 Figure 10. Importance-Performance Matrix of Park Attributes High Importance Low Performance High Importance High Performance Importance Clean restrooms Interpretive programs/info (visitors attending programs) Low Importance Low Performance Care of natural resources Upkeep of facilities Interpretive programs/info (all visitors) Performance Being safe Disabled access (all visitors) Free of litter & trash Helpful & friendly staff Disabled access (disabled visitors) Low Importance High Performance Restroom cleanliness and facility upkeep are often given lower ratings by visitors to state parks (Fredrickson & Moisey, 1999), and could be a result of the large number of visitors to Missouri state parks each year. Overnight visitors, however, gave significantly higher performance ratings than day-users regarding the parks having clean restrooms, suggesting that restrooms in the day-use areas may require different management considerations (e.g., flush toilets in favor of pit toilets). The marginal performance rating given by visitors regarding care of the natural resources could be a result of visitors perceptions of resource degradation in relation to their perceptions of crowding. Studies have shown that perceptions of crowding and adverse resource impacts influence evaluations of quality in recreation experiences (Peine et al., 1999). Visitors who gave care of natural resources an excellent rating were significantly (p<.001) less crowded (with a mean crowded score of 1.9) than visitors who gave a good (2.5), fair (2.7), or poor (3.1) rating to care of natural resources. CROWDING Visitors to each of the ten state parks were asked how crowded they felt during their visit. The following ninepoint scale was used to determine visitors perceptions of crowding: Not at all Slightly Moderately Extremely Crowded Crowded Crowded Crowded Visitors overall mean response to this question was 2.2. Scores ranged from 1.4 (Pershing State Park) to 4.1 (Table Rock State Park). Figure 11 shows the mean crowded score for each park. Department of Parks, Recreation and Tourism - University of Missouri 20
27 Figure 11. Mean Crowded Scores of Each Park Pershing Truman Big Lake Trail of Tears Wakonda Babler Long Branch Finger Lakes Lake of the Ozarks Table Rock Overall While crowding was not a concern at all ten of the state parks, overall it was an issue identified by many visitors as 40.7% reported feeling some degree of crowding. Crowding is a perceptual construct not always explained by the number or density of other visitors. Expectations of visitor numbers, the behavior of other visitors, and visitors perceptions of resource degradation all play a significant role in crowding perceptions (Armistead & Ramthun, 1995; Peine et al., 1999). There were no significant differences in perceptions of crowding between first time visitors and repeat visitors. Overnight visitors, however, were significantly (p<.001) more crowded (2.4) than day-users (2.0). Weekend visitors were also significantly (p<.001) more crowded (2.3) than weekday visitors (1.8). Particularly because visitors perceptions of crowding can influence their overall satisfaction (Armistead & Ramthun, 1995), comparisons were made to determine if there were significant differences in overall satisfaction between visitors who felt some degree of crowding and those visitors who were not at all crowded (Figure 12). Visitors who felt crowded had a significantly lower (p<.001) overall satisfaction rating (3.54) than visitors who were not crowded (3.76). As perceptions of crowding are inversely related to overall satisfaction, park and site managers should address the issue of crowding. One option is to review comments from the individual parks relating to crowding and consider options that would reduce crowding perceptions. Further study could also determine if crowding perceptions at the parks are due to the number of people or perhaps the behavior of the visitors in the parks. Figure 12. Overall Satisfaction is Lower for Those Who Felt Crowded Overall Satisfaction Not Crow ded Felt Crow ded Department of Parks, Recreation and Tourism - University of Missouri 21
28 SAFETY CONCERNS OF VISITORS Almost two-thirds (64.4%) of visitors across the ten state parks rated park safety excellent. Park managers should be commended for providing an atmosphere in which visitors feel safe. Although safety was given a high rating overall, however, managers should not dismiss safety concerns of visitors. Onethird (35.6%) of visitors did not give the parks they visited an excellent rating regarding safety. This is especially important as visitors with safety concerns had significantly lower overall satisfaction ratings, lower satisfaction ratings of park features, and lower performance ratings than visitors who felt safety to be excellent. Visitors who did not rate the parks as excellent on being safe were also significantly more crowded than those visitors who did give excellent safety ratings. Figure 13 shows the differences in overall satisfaction and perceptions of crowding between visitors who felt safety was Figure 13. Levels of Satisfaction and Perceptions of Crowding by Safety Concern excellent and visitors who had safety concerns. Visitors were also given a list of nine attributes and were asked to indicate which of the nine would most increase their feeling of safety at the ten state parks. Although instructed to select only one attribute, many visitors selected more than one; consequently, 1,775 responses were given by 1,467 respondents. Figure 14 shows the percentage of responses given by visitors. Although most (36.2%) felt that nothing specific would increase their feeling of safety, 13.5% felt that more lighting in the parks and 12.4% felt that increased visibility of park staff were two attributes that would most increase their feeling of safety. Figure 14. Percentage of Safety Attributes Chosen by Visitors Increased park staff visibility 12.4% Improved behavior of others 8.7% Increased law enforcement patrol 10.3% Less traffic congestion 3.4% More lighting 13.5% Other 4.8% Improved upkeep 4.7% Nothing specific 36.2% Less crow ding 6.0% Overall satisfaction Felt safety was excellent Crowding Had safety concerns SUPPORT OF RESERVATION SYSTEM Visitors to the state parks (excluding Lake of the Ozarks and Truman, where a reservation system is already in place) were asked to indicate their support for a reservation system. This reservation system would set aside at least 50% of Department of Parks, Recreation and Tourism - University of Missouri 22
29 all campsites in a reservation system, and would charge a reservation fee not to exceed $7.00. About two-thirds (64.4%) of the visitors reported that they would support such a reservation system. There were differences, however, between the percentages of visitors at each park that would or would not support a reservation system. Babler visitors, for instance, were overwhelmingly in support (72.9%) of a reservation system, whereas only 56.4% of Pershing s visitors who were in support of it. Figure 15 shows the support of each park. Figure 15. Comparison of Support for Reservation System Between Parks 100% 90% 80% 70% 60% 50% 40% 30% 20% 10% 0% Babler Trail of Tears Long Branch Finger Lakes Table Rock Wakonda Big Lake Pershing No Yes There were no significant differences between first time and repeat visitors and the percentage of each in support of or opposed to a reservation system. Both were more likely (63.5% and 64.7% respectively) to support a reservation system. And although there was a significant difference (p<.05) between the percentage of weekend and weekday visitors in support of or opposed to the reservation system, no practical difference existed. Both were more likely to support (66.5% and 60.6% respectively) such a system. There was, however, a significant difference (p<.001) between overnight visitors and day-users. Overnight visitors were slightly more likely to oppose (52.8%) the reservation system than support it (47.2%). Day-users were much more likely to support (72.6%) the reservation system than oppose (27.4%) it. An additional comparison of weekend and weekday campers indicated that weekend campers were slightly more likely to support (53.1%) the reservation system, while weekday campers were more likely to oppose (62.8%) it. And finally, RV campers (those campers who might be expected to use the reservation system more) were more likely to oppose (62.5%) such a system, while tent campers were slightly more likely to support (56.6%) it. Figure 16 shows a comparison of support for the reservation system between user groups. Consideration should be given as to whether implementation of a park-wide reservation system is necessary, particularly as a majority of visitors were not campers and those visitors who were campers were not as likely to support the idea of a reservation system. SUPPORT OF CARRY IN/CARRY OUT TRASH SYSTEM Visitors to the ten state parks were also asked to indicate whether they supported establishing a carry in and carry out trash removal system, thereby promoting recycling and reducing the burden of handling trash in the parks. The majority (56.7%) of visitors reported that Department of Parks, Recreation and Tourism - University of Missouri 23
30 Figure 16. Comparison of Support for Reservation System Between Groups 100% 90% 80% 70% 60% 50% 40% No Yes 30% 20% 10% 0% First time visitors Repeat visitors Overnight visitors Day-users Weekend visitors Weekday visitors Weekend campers Weekday campers RV campers Tent campers they would support a carry in/carry out trash removal system. There were differences, however, between parks and the percentages of visitors that would or would not support this type of trash removal system. Figure 17 shows the differences in support between each park. There were also differences between user groups and the percentage of each that would or would not support a carry in and carry out trash removal system. For instance, overnight visitors were significantly (p<.001) more likely to oppose this type of system, while dayusers were two-thirds (68.6%) more likely to support it. Picnickers (a user group that might be most affected by this type of trash removal system) were only slightly more likely to support (53.3%) a carry in and carry out trash system than oppose (46.7%) it. Figure 18 shows the differences in support between user groups. Figure 17. Comparison of Support for Carry In/Carry Out Trash Removal System Between Parks 100% 90% 80% 70% 60% 50% 40% 30% 20% 10% 0% Trail of Tears Finger Lakes Long Branch Babler Wakonda Pershing Big Lake Lake of the Ozarks Table Rock No Yes Department of Parks, Recreation and Tourism - University of Missouri 24
31 Figure 18. Comparison of Support for Carry In/Carry Out Trash Removal System Between Groups and ANOVA between selected groups and the Importance-Performance Analysis.) 100% 90% 80% 70% 60% 50% 40% No Yes Additional relevant information may be determined from further sub-analysis of existing data. Therefore, it is recommended additional sub-analysis be conducted to provide even greater insight to management at each of the ten parks. 30% 20% 10% 0% First time visitors Repeat visitors Overnight visitors Day-users Weekend visitors Weekday visitors Picnickers Additional visitor surveys at the ten state parks should also be conducted on a regular basis (e.g., every three, four, or five years). Future studies can identify changes and trends in sociodemographic characteristics, use patterns, and visitors satisfaction. User studies at these parks might also be conducted during other seasons of the year for comparison between seasonal visitors. RESEARCH RECOMMENDATIONS The results of the present study serve as baseline visitor information for Babler State Park, Big Lake State Park, Finger Lakes State Park, Lake of the Ozarks State Park, Long Branch State Park, Pershing State Park, Table Rock State Park, Trail of Tears State Park, Truman State Park, and Wakonda State Park. The frequency and percentage calculations of survey responses from each of the ten state parks provide useful information concerning sociodemographic characteristics, use patterns, and satisfaction of Missouri State Park visitors. In addition, the sub-analysis of data is important in identifying implications for management at each of these parks. (The sub-analysis conducted for each survey included comparisons using t-tests, Chi-square, The methodology used in this study serves as a standard survey procedure that the DSP can use in the future. Other Missouri State Parks and Historic Sites should be surveyed similarly to provide valid results for comparisons of visitor information between parks and sites, or to measure change over time in other parks and sites. Department of Parks, Recreation and Tourism - University of Missouri 25
32 References Armistead, J., & Ramthun, R. (1995). Influences on perceived crowding and satisfaction on the Blue Ridge Parkway. In Proceedings of the 1995 Northeastern Recreation Research Symposium (Forest Service General Technical Report NE- 128, pp ). Saratoga Springs, NY: Department of Agriculture, Forest Service, Northeastern Forest Experiment Station. Beck, L., & Cable, T. T. (1998). Interpretation for the 21 st Century: Fifteen guiding principles for interpreting nature and culture. Champaign, IL: Sagamore Publishing. Driver, B. L., Dustin, D., Baltic, T., Eisner, G., & Peterson, G. (1996). Nature and the human spirit: Overview. In B. L. Diver, D. Dustin, T. Baltic, G. Elsner, & G. Peterson (Eds.), Nature and the human spirit: Toward an expanded land management ethic (pp. 3-8). State College, PA: Venture Publishing, Inc. Fink, D. A. (1997). Meramec State Park user survey. Unpublished master s research project, University of Missouri, Columbia. Fredrickson, D. K., & Moisey, R. N. (1999) Missouri state parks visitor survey. Report submitted to the Missouri Department of Natural Resources. Fredrickson, D. K., & Vessell, C. R. (1999a) Table Rock State Park visitor survey. Report submitted to the Missouri Department of Natural Resources. Fredrickson, D. K., & Vessell, C. R. (1999b) Lake of the Ozarks State Park visitor survey. Report submitted to the Missouri Department of Natural Resources. Fredrickson, D. K., & Vessell, C. R. (2000a) Dr. Edmund A. Babler State Park visitor survey. Report submitted to the Missouri Department of Natural Resources. Fredrickson, D. K., & Vessell, C. R. (2000b) Big Lake State Park visitor survey. Report submitted to the Missouri Department of Natural Resources. Fredrickson, D. K., & Vessell, C. R. (2000c) Finger Lakes State Park visitor survey. Report submitted to the Missouri Department of Natural Resources. Fredrickson, D. K., & Vessell, C. R. (2000d) Wakonda State Park visitor survey. Report submitted to the Missouri Department of Natural Resources. Fredrickson, D. K., & Vessell, C. R. (2000e) Long Branch State Park visitor survey. Report submitted to the Missouri Department of Natural Resources. Fredrickson, D. K., & Vessell, C. R. (2000f) Pershing State Park visitor survey. Report submitted to the Missouri Department of Natural Resources. Department of Parks, Recreation and Tourism - University of Missouri 26
33 Fredrickson, D. K., & Vessell, C. R. (2000g) Trail of Tears State Park visitor survey. Report submitted to the Missouri Department of Natural Resources. Fredrickson, D. K., & Vessell, C. R. (2000h) Harry S Truman State Park visitor survey. Report submitted to the Missouri Department of Natural Resources. Fruchter, J., & Schau, M. (1997). At our leisure. New York, NY: EPM Communications, Inc. Holst, S., & Simms, L. (1996). Park & soils: A decade of success for camps and crops. Missouri Resources, 13(2), Manning, R. E. (1986). Studies in outdoor recreation. Corvallis, OR: Oregon State University Press. Masek, M. L. R. (1974). A park user fee survey for the Missouri state parks. Unpublished master s thesis, University of Missouri, Columbia. management (pp ). Champaign, IL: Sagamore Publishing. Tarrant, M. A., Bright, A. D., Smith, E., & Cordell, H. K. (1999). Motivations, attributes, preferences, and satisfactions among outdoor recreationists. In H. K. Cordell (Ed.), Outdoor recreation in American life: A national assessment of demand and supply trends (pp ). Champaign, IL: Sagamore Publishing. U. S. Census Bureau (1999). United States and Missouri census data [Online]. Available: Williams, D. R. (1989). Great expectations and the limits to satisfaction: a review of recreation and consumer satisfaction research. Outdoor Recreation Benchmark 1988: Proceedings of the National Outdoor Recreation Forum, Tampa, Florida, McLellan, G., & Siehl, G. (1988). Trends in leisure and recreation: How we got where we are. Trends, 25 (4), 4-7. Missouri State Census Data Center (MSCDC) (1998). Missouri census data [Online]. Available: Peine, J. D., Jones, R. E., English, M. R., & Wallace, S. E. (1999). Contributions of sociology to ecosystem management. In H. K. Cordell & J. C. Bergstrom (Eds.), Integrating social sciences with ecosystem management: Human dimensions in assessment, policy, and Department of Parks, Recreation and Tourism - University of Missouri 27
34 Appendix A Missouri State Park Visitor Surveys Department of Parks, Recreation and Tourism - University of Missouri 28
35
36
37
38
39
40
41
42
43
44
45
46
47
48
49
50
51
52
53
1999 Wakonda State Park Visitor Survey
 Missouri Department of Natural Resources Division of State Parks 800-334-6946 1999 Wakonda State Park Visitor Survey Project Completion Report Submitted to Missouri Department of Natural Resources Division
1998 Pomme de Terre State Park Visitor Survey
 Missouri Department of Natural Resources Division of State Parks 800-334-6946 1998 Pomme de Terre State Park Visitor Survey Project Completion Report Submitted to Missouri Department of Natural Resources
2000 Roaring River State Park Visitor Survey
 Missouri Department of Natural Resources Division of State Parks 800-334-6946 2000 Roaring River State Park Visitor Survey Project Completion Report Submitted to Missouri Department of Natural Resources
2000 Mark Twain Birthplace State Historic Site Visitor Survey
 Missouri Department of Natural Resources Division of State Parks 800-334-6946 2000 Mark Twain Birthplace State Historic Site Visitor Survey Project Completion Report Submitted to Missouri Department of
State Park Visitor Survey
 State Park Visitor Survey Methods, Findings and Conclusions State s Department of Recreation, Park and Tourism Management surveyed state park visitor and trip characteristics, and collected evaluations
Recreationists on the Gifford Pinchot National Forest: A Survey of User Characteristics, Behaviors, and Attitudes
 Recreationists on the Gifford Pinchot National Forest: A Survey of User Characteristics, Behaviors, and Attitudes by Alan R. Graefe The Pennsylvania State University Robert C. Burns University of Florida
JATA Market Research Study Passenger Survey Results
 JATA Market Research Study Passenger Survey Results Prepared for the Jackson Area Transportation Authority (JATA) April, 2015 3131 South Dixie Hwy. Suite 545 Dayton, OH 45439 937.299.5007 www.rlsandassoc.com
1998 Katy Trail State Park Visitor Survey
 Missouri Department of Natural Resources Division of State Parks 800-334-6946 1998 Katy Trail State Park Visitor Survey Project Completion Report Submitted to Missouri Department of Natural Resources Division
1998 Missouri State Parks Visitor Survey
 Missouri Department of Natural Resources Division of State Parks 800-334-6946 1998 Missouri State Parks Visitor Survey Project Completion Report Submitted to Missouri Department of Natural Resources Division
Cedar Rapids Area Convention and Visitors Bureau Visitor Study
 Cedar Rapids Area Convention and Visitors Bureau Visitor Study 2003-2004 University of Northern Iowa Sustainable Tourism & The Environment Program www.uni.edu/step Project Directors: Sam Lankford, Ph.D.
1987 SUMMER USE SURVEY OF MINNESOTA STATE PARK VISITORS
 This document is made available electronically by the Minnesota Legislative Reference Library as part of an ongoing digital archiving project. http://www.leg.state.mn.us/lrl/lrl.asp (Funding for document
Trail Use in the N.C. Museum of Art Park:
 Trail Use in the N.C. Museum of Art Park: New Connections, New Visitors Jacqueline MacDonald Gibson, PhD Daniel Rodriguez, PhD Taylor Dennerlein, MSEE, MCRP, EIT Jill Mead, MPH Evan Comen University of
Irish Fair of Minnesota: 2017 Attendee Profile
 TOURISM CENTER Irish Fair of Minnesota: 2017 Attendee Profile Authored by Xinyi Qian, Ph.D. Irish Fair of Minnesota: 2017 Attendee Profile November 13, 2017 Authored by Xinyi (Lisa) Qian, Ph.D., University
Cooper-Hewitt, National Design Museum Visitors Summer 2008 Summary of Findings
 Introduction Cooper-Hewitt, National Design Museum Visitors Summer 2008 Summary of Findings Office of Policy & Analysis Smithsonian Institution July 2008 In June 2008, the Office of Policy and Analysis
2013 IRVING HOTEL GUEST SURVEY Final Project Report
 2013 IRVING HOTEL GUEST SURVEY Final Project Report Research prepared for the Irving Convention & Visitors Bureau by Destination Analysts, Inc. Table of Contents SECTION 1 Introduction 2 SECTION 2 Executive
Tourism Impacts and Second Home Development in Coastal Counties: A Sustainable Approach
 Tourism Impacts and Second Home Development in Coastal Counties: A Sustainable Approach Brunswick, Currituck and Pender Counties, North Carolina (Funded by North Carolina Sea Grant) Center for Sustainable
A TYPOLOGY OF CULTURAL HERITAGE ATTRACTION VISITORS
 University of Massachusetts Amherst ScholarWorks@UMass Amherst Tourism Travel and Research Association: Advancing Tourism Research Globally 2007 ttra International Conference A TYPOLOGY OF CULTURAL HERITAGE
Economic And Social Values of Vermont State Parks 2002
 Economic And Social Values of Vermont State Parks 2002 Executive Summary Prepared for Vermont State Parks Department of Forest and Parks and Recreation Prepared by: Alphonse H. Gilbert Robert E. Manning
2015 IRVING HOTEL GUEST SURVEY Final Project Report
 2015 IRVING HOTEL GUEST SURVEY Final Project Report Research prepared for the Irving Convention & Visitors Bureau by Destination Analysts, Inc. Table of Contents S E C T I O N 1 Introduction 2 S E C T
RESEARCH AND PLANNING FORT STEELE HERITAGE TOWN VISITOR STUDY 2007 RESULTS. May 2008
 RESEARCH AND PLANNING FORT STEELE HERITAGE TOWN VISITOR STUDY 2007 RESULTS May 2008 Research and Planning Tourism British Columbia 300-1803 Douglas St. Box 9830 Stn. Prov. Gov t. Victoria, BC V8W 9W5 Web:
IATOS 2003 Outdoor Enthusiast Survey CTC Market Research March, 2003
 IATOS 2003 Outdoor Enthusiast Survey CTC Market Research March, 2003 The IATOS Expo (International Adventure Travel and Outdoor Sports Show, Chicago, February 2003) provided the CTC s Outdoor Product Development
Visitor Profile - Central Island Region
 TOURISM LABOUR MARKET RESEARCH PROJECT 2003 The Project The Tourism Labour Market Research Project, was designed to study the tourism labour market throughout the Vancouver Island region. The Visitor Survey
Tourism Impacts and Second Home Development in Pender County: A Sustainable Approach
 Tourism Impacts and Second Home Development in Pender County: A Sustainable Approach (Funded by North Carolina Sea Grant) Center for Sustainable Tourism Division of Research and Graduate Studies East Carolina
2000 Missouri State Park Visitor Attendance Count
 Missouri Department of Natural Resources Division of State Parks 800-334-6946 2000 Missouri State Park Visitor Attendance Count Project Completion Report Submitted to Missouri Department of Natural Resources
2006 RENO-SPARKS VISITOR PROFILE STUDY
 2006 RENO-SPARKS VISITOR PROFILE STUDY PREPARED FOR RENO-SPARKS CONVENTION & VISITOR AUTHORITY Study Conducted and Reported by 475 Hill Street, Suite 2 Reno, Nevada 89501 (775) 323-7677 www.infosearchintl.com
Florida State Park Visitors Park Visiting Party Size
 Party size is roughly the same across all regions. State Park Visitors Park Visiting Party Size Total Central Northeast Northwest Southeast Southwest (n=3972) (n=798) (n=792) (n=782) (n=796) (n=804) Avg.
Estimating Tourism Expenditures for the Burlington Waterfront Path and the Island Line Trail
 A report by the University of Vermont Transportation Research Center Estimating Tourism Expenditures for the Burlington Waterfront Path and the Island Line Trail Report # 10-003 February 2010 Estimating
2013 Business & Legislative Session Visitor Satisfaction Survey Results
 2013 Business & Legislative Session Visitor Satisfaction Survey Results Completed by Juneau Economic Development Council in partnership with The Alaska Committee August 2013 JEDC research efforts are supported
Outdoor Adventures Department of Recreational Sports Spring 2017
 Outdoor Adventures Department of Recreational Sports Spring 2017 Background The Department of Recreational Sports maintains a more than 400,000 square foot facility visited by thousands of students, faculty,
Division of Governmental Studies and Services. Final Report. Washington State Outdoor Recreation Survey Report
 D 1 Appendix D: Survey Analysis Division of Governmental Studies and Services Final Report November 29, 2017 Washington State Outdoor Recreation Survey Report Report Authors: Christina Sanders, Acting
ANALYSIS OF VISITOR PREFERENCES OF THE HATFIELD-MCCOY TRAILS
 1 ANALYSIS OF VISITOR PREFERENCES OF THE HATFIELD-MCCOY TRAILS Wendy Pace Concord University Recreation and Tourism Management Athens, WV 24712 pacew02@mycu.concor.edu Dr. Roy Ramthun Concord University
The Economic Impact of Expenditures By Travelers On Minnesota s Northeast Region and The Profile of Travelers. June 2005 May 2006
 The Economic Impact of Expenditures By Travelers On Minnesota s Northeast Region and The Profile of Travelers Prepared for: Explore Minnesota Tourism State of Minnesota and Minnesota Arrowhead Association
2017 Minnesota State Parks Visitor Survey
 2017 Minnesota State Parks Visitor Survey November 2017 Report Prepared by: St Paul, MN 651-644-6006 theresearchedge.com 1 ACKNOWLEDGMENTS A number of Minnesota Department of Natural Resources staff contributed
State of the Shared Vacation Ownership Industry. ARDA International Foundation (AIF)
") State of the Shared Vacation Ownership Industry ARDA International Foundation (AIF) This paper includes a high-level overview of the timeshare industry with a core focus on financial growth, owner demographics
State of the Shared Vacation Ownership Industry ARDA International Foundation (AIF) This paper includes a high-level overview of the timeshare industry with a core focus on financial growth, owner demographics
2015 British Columbia Parks. Visitor Survey. Juan De Fuca Park. China Beach
 2015 British Columbia Parks Visitor Survey Juan De Fuca Park China Beach 1 Contents Introduction 3 Methodology 3 Limitations 3 How this report is organized 3 Part 1 - Visitor Satisfaction 4 Part 2 - Visitor
Visitors Experiences and Preferences at Lost Lake in Clatsop State Forest, Oregon
 Visitors Experiences and Preferences at Lost Lake in Clatsop State Forest, Oregon Final Report Mark D. Needham, Ph.D. Assistant Professor Recreation Resource Management Program Department of Forest Resources
2010 Nova Scotia Visitor Exit Survey Regional Report
 2010 Nova Scotia Visitor Exit Survey Regional Report A Look at Visitors Who Included Cape Breton in their Trip to Nova Scotia Reproduction in whole or in part is not permitted without the express permission
Federal Outdoor Recreation Trends Effects on Economic Opportunities
 United States Department of Agriculture Federal Outdoor Recreation Trends Effects on Economic Opportunities The Forest Service National Center for Natural Resources Economic Research is assisting the Federal
Agritourism in Missouri: A Profile of Farms by Visitor Numbers
 Agritourism in Missouri: A Profile of Farms by Visitor Numbers Presented to: Sarah Gehring Missouri Department of Agriculture Prepared by: Carla Barbieri, Ph.D. Christine Tew, MS candidate April 2010 University
2005 efriends Survey Results. How often have you visited a Missouri state park and/or historic site in the past 12 months?
 Missouri Department of Natural Resources Division of State Parks 800-334-6946 2005 efriends Survey Results How often have you visited a Missouri state park and/or historic site in the past 12 months? Valid
Juneau Household Waterfront Opinion Survey
 Juneau Household Waterfront Opinion Survey Prepared for: City and Borough of Juneau Prepared by: April 13, 2004 TABLE OF CONTENTS Executive Summary...1 Introduction and Methodology...6 Survey Results...7
1987 SUMMER USE SURVEY OF MINNESOTA STATE PARK VISITORS
 This document is made available electronically by the Minnesota Legislative Reference Library as part of an ongoing digital archiving project. http://www.leg.state.mn.us/lrl/lrl.asp (Funding for document
2007 Minnesota State Parks Research Report
 This document is made available electronically by the Minnesota Legislative Reference Library as part of an ongoing digital archiving project. http://www.leg.state.mn.us/lrl/lrl.asp 2007 Minnesota State
Eastern Lake Ontario Beach User Survey 2003/2004.
 Eastern Lake Ontario Beach User Survey 2003/2004. Introduction The eastern shore of Lake Ontario is a Biodiversity Investment Area that features a 17-mile long barrier beach of Great Lakes dunes and a
The methodology and sample surveys have been developed through a partnership of: DCNR and the Secretary's Greenways Program Advisory Committee
 Trail User Survey Workbook How to conduct a survey and win support for your trail Sample Surveys and Methods 2005 Rails-to-Trails Conservancy Northeast Regional Field Office 2133 Market St, #222 Camp Hill,
2007 Minnesota State Parks Research Report
 2007 Minnesota State Parks Research Report Focus Group Study, Minnesota State Park Visitor Survey, and Household Survey of Minnesota Nature-based and State Park Recreation Minnesota Department of Natural
T H E VILLAGE OF P h i l m o n t, N Y
 T H E VILLAGE OF P h i l m o n t, N Y Summit Reservoir Area Plan November 17, 2014 Executive Steering Committee Meeting 2 Agenda 1:00 1. Welcome 2. Housekeeping & updates i. Committee contact list review
RESULTS FROM WYOMING SNOWMOBILE SURVEY: EXECUTIVE SUMMARY
 RESULTS FROM 2000-2001 WYOMING SNOWMOBILE SURVEY: EXECUTIVE SUMMARY Prepared for the Wyoming Department of State Parks and Historic Sites, Wyoming State Trails Program. Prepared By: Chelsey McManus, Roger
2007 Minnesota State Parks Research Summary Report
 2007 Minnesota State Parks Research Summary Report 2007 Minnesota State Parks Research Summary Report The Minnesota State Parks research projects were a cooperative effort of the, Division of Parks and
CAMPER CHARACTERISTICS DIFFER AT PUBLIC AND COMMERCIAL CAMPGROUNDS IN NEW ENGLAND
 CAMPER CHARACTERISTICS DIFFER AT PUBLIC AND COMMERCIAL CAMPGROUNDS IN NEW ENGLAND Ahact. Early findings from a 5-year panel survey of New England campers' changing leisure habits are reported. A significant
Maryland State Parks Diversity and Inclusion Efforts: Staff Perspectives and Media Reporting
 Maryland State Parks Diversity and Inclusion Efforts: Staff Perspectives and Media Reporting Natalia Buta, Ph.D. Associate Professor, Frostburg State University University System of Maryland Objectives
JUNEAU BUSINESS VISITOR SATISFACTION SURVEY RESULTS
 2018 JUNEAU BUSINESS VISITOR SATISFACTION SURVEY RESULTS Completed by the Juneau Economic Development Council in partnership with the Alaska Committee. JEDC research efforts are supported by core funding
2012 In-Market Research Report. Kootenay Rockies
 2012 In-Market Research Report Kootenay Rockies Executive Summary This report summarizes key highlights for the Kootenay Rockies (KR) region taken from the British Columbia In-Market study conducted in
Word Count: 3,565 Number of Tables: 4 Number of Figures: 6 Number of Photographs: 0. Word Limit: 7,500 Tables/Figures Word Count = 2,250
 Katherine F. Turnbull, Ken Buckeye, Nick Thompson 1 Corresponding Author Katherine F. Turnbull Executive Associate Director Texas Transportation Institute Texas A&M University System 3135 TAMU College
Prepared for: TOMM Committee Kangaroo Island CB Contact: Ben Nitschke, Account Manager Phone: (08)
") Prepared for: TOMM Committee Kangaroo Island CB Contact: Ben Nitschke, Account Manager Phone: (08) 8373 3822 Email: ben.nitschke@colmarbrunton.com Issue Date: 24 August, 2017 Project number: TOMM0003 www.colmarbrunton.com
Prepared for: TOMM Committee Kangaroo Island CB Contact: Ben Nitschke, Account Manager Phone: (08) 8373 3822 Email: ben.nitschke@colmarbrunton.com Issue Date: 24 August, 2017 Project number: TOMM0003 www.colmarbrunton.com
Tourism Industry Council Tasmania Community Survey 2018 Research Report. May 2018
 Tourism Industry Council Tasmania Community Survey 2018 Research Report May 2018 This report has been prepared by Enterprise Marketing and Research Services 60 Main Road, Moonah TAS 7009 All enquiries
Analysis of Mode Switching Behavior of PUP Main Campus Students to Pasig River Ferry Service
 Analysis of Mode Switching Behavior of PUP Main Campus Students to Pasig River Ferry Service Vilma CLEMENTE John Ivan GUEVARRA Ryan Maynard MAZO Department of Civil Engineering Polytechnic University of
WAVE II JUNE travelhorizons TM WAVE II 2014 PREPARED AND PUBLISHED BY: MMGY Global
 WAVE II June 14 travelhorizons TM WAVE II 14 PREPARED AND PUBLISHED BY: WAVE II JUNE 14 MMGY Global 423 South Keller Road, Suite 1 Orlando, FL 3281, 7-875-1111 MMGYGlobal.com 14 MMGY Global. All rights
Lord Howe Island Visitor Survey 2017
 INTRODUCTION Lord Howe Island Visitor Survey 2017 Lord Howe Island is one of Australia s premier holiday destinations, part of a World Heritage-listed island group that is known for its outstanding natural
Pinnacles National Park Camper Study
 U.S. Department of the Interior National Park Service Social Science Program Visitor Services Project Pinnacles National Park Camper Study 2 Pinnacles National Park Camper Study MB Approval: 1024-0224
6/28/11 TELEPHONE (n=400, RDD) AND ON-LINE (n=6,294) SURVEY RESULTS
 AND ON-LINE (n=6,294) SURVEY RESULTS") 6/28/11 TELEPHONE (n=0, RDD) AND ON-LINE (n=6,294) SURVEY RESULTS Update Surveys An Institute for Consensus Building www.sri-consulting.org MASTER PLAN UPDATE 6/28/11 Quantifying the responses from the
6/28/11 TELEPHONE (n=0, RDD) AND ON-LINE (n=6,294) SURVEY RESULTS Update Surveys An Institute for Consensus Building www.sri-consulting.org MASTER PLAN UPDATE 6/28/11 Quantifying the responses from the
Planning Future Directions. For BC Parks: BC Residents' Views
 Planning Future Directions For BC Parks: BC Residents' Views Summary Report Ministry of Water, Land and Air Protection Province of British Columbia April, 2002 National Library of Canada Cataloguing in
Recreation Opportunity Analysis Authors: Mae Davenport, Ingrid Schneider, & Andrew Oftedal
 Authors: Mae Davenport, Ingrid Schneider, & Andrew Oftedal // 2010 Supply of Outdoor Recreation Resources // Recreation Location Quotient Analysis recreation opportunity analysis // 59 2010 Supply of Outdoor
Outdoor Recreation In America 1998
 Outdoor Recreation In America 1998 Prepared For: The Recreation Roundtable 1225 New York Avenue, NW Washington, DC 20005 (202) 682-9530 June 1998 Table of Contents INTRODUCTION SUMMARY SECTION I: THE RECREATION
2009 Muskoka Airport Economic Impact Study
 2009 Muskoka Airport Economic Impact Study November 4, 2009 Prepared by The District of Muskoka Planning and Economic Development Department BACKGROUND The Muskoka Airport is situated at the north end
Non-Motorized Outdoor Recreation in British Columbia in 2012: Participation and Economic Contributions
 Non-Motorized Outdoor Recreation in British Columbia in 2012: Participation and Economic Stephen Kux Wolfgang Haider School of Resource and Environmental Management Simon Fraser University Burnaby, British
Title VI Service Equity Analysis
 Pierce Transit Title VI Service Equity Analysis Pursuant to FTA Circular 4702.1B NE Tacoma Service May 2016 Pierce Transit Transit Development Dept. PIERCE TRANSIT TITLE VI SERVICE EQUITY ANALYSIS TABLE
By Prapimporn Rathakette, Research Assistant
 OCTOBER 2000 RESERVATIONS NORTHWEST SURVEY: METHODOLOGY AND RESULTS OREGON PARKS AND RECREATION DEPARTMENT OREGON SURVEY RESEARCH LABORATORY 5245 UNIVERSITY OF OREGON EUGENE, OR 97403-5245 TELEPHONE: 541-346-0824
Minnesota River Valley Area Survey Summary Report
 Minnesota River Valley Area Survey Summary Report Report prepared by: Minnesota Department of Natural Resources Office of Management and Budget Services May 2002 ACKNOWLEDGMENTS A number of organizations
Study on Hotel Management Graduates Perceptions and Preferences of Jobs in Hotel Industry in Chennai City
 Study on Hotel Management Graduates Perceptions and Preferences of Jobs in Hotel Industry in Chennai City T.S. Natarajan, Research scholar, Department of Management studies, SCSVMV University, India. E-mail:
2004 SOUTH DAKOTA MOTEL AND CAMPGROUND OCCUPANCY REPORT and INTERNATIONAL VISITOR SURVEY
 2004 SOUTH DAKOTA MOTEL AND CAMPGROUND OCCUPANCY REPORT and INTERNATIONAL VISITOR SURVEY Prepared By: Center for Tourism Research Black Hills State University Spearfish, South Dakota Commissioned by: South
CHAPTER FOUR: PERCEIVED CONDITION AND COMFORT
 CHAPTER FOUR: PERCEIVED CONDITION AND COMFORT In order to see how Riverside Park could become a greater asset to the community, it is necessary to investigate and understand the community s perception
List of Tables... ii. List of Figures... iii. Executive Summary... iv. Chapter 1 Introduction, Purpose & Survey Method Proposed Missing Master-
 i List of Tables... ii List of Figures... iii Executive Summary... iv Chapter 1 Introduction, Purpose & Survey Method... 1 Chapter 2 Demographic Characteristics and Visitation Patterns of Respondents...
2009/10 NWT Park User Satisfaction Survey Report
 2009/10 NWT Park User Satisfaction Survey Report Industry, Tourism and Investment Government of the Northwest Territories Table of Contents Survey Methodology. 3 Survey Sample...3 Satisfaction with Services
Appendix 15.2: Pasha Dere Beach Usage Survey
 Appendix 15.2: Pasha Dere Beach Usage Survey URS-EIA-REP-22375 Table of Contents 15.2 Pasha Dere Beach Usage Survey... 1 15.2.1 Introduction... 1 15.2.2 Beach Surveys... 1 15.2.2.1 Survey Dates, Times
FINAL RESEARCH REPORT (AED Order P-068)
") Volcán Masaya National Park Visitor Profile, Nicaragua FINAL RESEARCH REPORT (AED Order 222429-7P-068) Submitted to: GreenCom Project Academy for Educational Development 1255 23 rd Street, NW Washington,
Volcán Masaya National Park Visitor Profile, Nicaragua FINAL RESEARCH REPORT (AED Order 222429-7P-068) Submitted to: GreenCom Project Academy for Educational Development 1255 23 rd Street, NW Washington,
Chapter 1: The Population of NHS Greater Glasgow and Clyde
 Population Estimate (thousands) Chapter 1: The Population of NHS Greater Glasgow and Clyde Population Trends and Projections National Records of Scotland estimated (NRS SAPE) 1 the 2013 NHS Greater Glasgow
part one: comparing puerto ricans
 part one: comparing puerto ricans snapshot: puerto ricans across major us metro areas This section uses data from the 2010 American Community Survey one-year estimates to examine the socioeconomic characteristics
Silver Lake Park An Environmental Jewel for the Citizens of Prince William County
 Silver Lake Park An Environmental Jewel for the Citizens of Prince William County The Prince William Park Authority Mission Statement states: The Prince William County Park Authority will create quality
The Cultural and Heritage Traveler 2013 Edition
 University of Massachusetts Amherst ScholarWorks@UMass Amherst Tourism Travel and Research Association: Advancing Tourism Research Globally 2013 Marketing Outlook Forum - Outlook for 2014 The Cultural
Appendix D ( Rock Climbing Survey) Scroll Down
 Scroll Down") Appendix D (E-mail Rock Climbing Survey) Scroll Down 51 2006 Coopers Rock Recreation Study West Virginia University Dear Recreationist: The Department of Recreation, Parks, and Tourism Resources at West
Appendix D (E-mail Rock Climbing Survey) Scroll Down 51 2006 Coopers Rock Recreation Study West Virginia University Dear Recreationist: The Department of Recreation, Parks, and Tourism Resources at West
The second annual survey of the general population conducted by Cairn Consulting Group Sponsored by Kampgrounds of America
 The second annual survey of the general population conducted by Cairn Consulting Group Sponsored by Kampgrounds of America Key Findings...2 State of Camping in the U.S. and Canada: Summary of Survey Results...5
2014 NOVEMBER ECONOMIC IMPACTS AND VISITOR PROFILE. Prepared By:
 2014 NOVEMBER ECONOMIC IMPACTS AND VISITOR PROFILE Prepared By: Sisters Folk Festival Economic Impacts and Visitor Profile September 5-7, 2014 November 2014 Prepared for Sisters Folk Festival, Inc. Sisters,
Special Report on Camping 2010
 Special Report on Camping 2010 A look at American participation in car, backyard and RV camping. A Partnership Project of: Camping Camping is part of the very fabric of American society accommodating just
Community Rail Partnership Action Plan The Bishop Line Survey of Rail Users and Non-Users August 2011 Report of Findings
 Community Rail Partnership Action Plan The Bishop Line Survey of Rail Users and Non-Users August 2011 Report of Findings Analysis and report NWA Social Research 1 Contents Page No. A. Summary of Main Findings...
San Francisco Municipal Transportation Agency (SFMTA) Travel Decision Survey 2012
 Travel Decision Survey 2012") Note: The weighting used in this report is not consistent with Travel Decision Surveys (TDS) 2013 and 2014, and findings from this report should not be compared with findings from TDS 2013 and TDS 2014.
Note: The weighting used in this report is not consistent with Travel Decision Surveys (TDS) 2013 and 2014, and findings from this report should not be compared with findings from TDS 2013 and TDS 2014.
The Economic Benefits of Agritourism in Missouri Farms
 The Economic Benefits of Agritourism in Missouri Farms Presented to: Missouri Department of Agriculture Prepared by: Carla Barbieri, Ph.D. Christine Tew, M.S. September 2010 University of Missouri Department
The Economic Impact of Tourism in Missouri. Fiscal Year 2016 Summary December 2016
 The Economic Impact of Tourism in Missouri Fiscal Year 2016 Summary December 2016 Introduction and definitions This study measures the economic impact of tourism in Missouri in FY2016. Visitors included
Do Scenic Amenities Foster Economic Growth in Rural Areas?
 Do Scenic Amenities Foster Economic Growth in Rural Areas? By Jason Henderson and Kendall McDaniel Rural areas in the Tenth District are experiencing a period of renewed economic growth in the 199s. After
1999 Reservations Northwest Users Survey Methodology and Results November 1999
 1999 Reservations Northwest Users Survey Methodology and Results November 1999 Oregon Survey Research Laboratory University of Oregon Eugene OR 97403-5245 541-346-0822 Fax: 541-346-5026 Internet: OSRL@OREGON.UOREGON.EDU
Department of Agricultural and Resource Economics, Fort Collins, CO
 July 2007 EDR 07-16 Department of Agricultural and Resource Economics, Fort Collins, CO 80523-1172 http://dare.colostate.edu/pubs CO LORADO S AGRITOURISTS: WHO ARE THE ADVENTURERS, THE SEEKERS AND THE
Big Cypress National Preserve Visitor Study
 Social Science Program National Park Service U.S. Department of the Interior Visitor Services Project Big Cypress National Preserve Visitor Study 2 Big Cypress National Preserve Visitor Study OMB Approval
Travel Decision Survey Summary Report. San Francisco Municipal Transportation Agency (SFMTA)
") Note: The weighting used in this report is not consistent with Travel Decision Surveys (TDS) 2013 and 2014, and findings from this report should not be compared with findings from TDS 2013 and TDS 2014.
Note: The weighting used in this report is not consistent with Travel Decision Surveys (TDS) 2013 and 2014, and findings from this report should not be compared with findings from TDS 2013 and TDS 2014.
TABLE OF CONTENTS. TOURIST EXPENDITURE 31 Average Spend per Person per Night ( ) 31 Tourist Expenditure per Annum ( ) 32
 31 Tourist Expenditure per Annum ( ) 32") FALKLAND ISLANDS International Tourism Statistics Report 2013 2 3 4 TABLE OF CONTENTS PAGE INTRODUCTION 6 KEY FACTS AND FIGURES 7 INBOUND TOURISM (OVERNIGHT VISITORS) 8 TOURIST ARRIVALS 8 Tourist Arrivals
FALKLAND ISLANDS International Tourism Statistics Report 2013 2 3 4 TABLE OF CONTENTS PAGE INTRODUCTION 6 KEY FACTS AND FIGURES 7 INBOUND TOURISM (OVERNIGHT VISITORS) 8 TOURIST ARRIVALS 8 Tourist Arrivals
2010 Nova Scotia Visitor Exit Survey Regional Report
 2010 Nova Scotia Visitor Exit Survey Regional Report A Look at Visitors Who Included Yarmouth and Acadian Shores in their Trip to Nova Scotia Reproduction in whole or in part is not permitted without the
2009 North Carolina Visitor Profile
 2009 Visitor Profile A publication of the Division of Tourism, Film & Sports Development August 2010 Division of Tourism, Film and Sports Development 2009 Visitor Profile 2009 Visitor Profile The Division
PROFILE OF THE PUERTO RICAN POPULATION IN UNITED STATES AND PUERTO RICO: 2008
 PROFILE OF THE PUERTO RICAN POPULATION IN UNITED STATES AND PUERTO RICO: 2008 Sonia G. Collazo, Camille L. Ryan, Kurt J. Bauman U.S. Census Bureau Housing and Household Economic Statistics Division This
Airport Profile. St. Pete Clearwater International BY THE NUMBERS 818, ,754 $ Enplanements. Passengers. Average Fare. U.S.
 Airport Profile St. Pete Clearwater International St. Pete-Clearwater International Airport (PIE) is located in Pinellas County, Florida about nine miles north of downwn St. Petersburg, seven miles southeast
Crater Lake National Park. Visitor Study Summer 2001
 National Park Service U.S. Department of the Interior The Visitor Services Project Crater Lake National Park Visitor Study Summer 2001 Margaret Littlejohn Visitor Services Project Report 129 April 2002
ASSESSMENT OF SERVICE QUALITY PERCEIVED BY PASSENGERS AT BANDARANAIKE INTERNATIONAL AIRPORT, KATUNAYAKE. Isuru S. Wendakoon (138328E)
") 16 IVOKj/qt /?0!S ASSESSMENT OF SERVICE QUALITY PERCEIVED BY PASSENGERS AT BANDARANAIKE INTERNATIONAL AIRPORT, KATUNAYAKE. WWIVERSiTY C- r. Isuru S. Wendakoon (138328E) Degree of Master of Science Department
16 IVOKj/qt /?0!S ASSESSMENT OF SERVICE QUALITY PERCEIVED BY PASSENGERS AT BANDARANAIKE INTERNATIONAL AIRPORT, KATUNAYAKE. WWIVERSiTY C- r. Isuru S. Wendakoon (138328E) Degree of Master of Science Department