Annual Results. Year ended 30 April June 2014
|
|
|
- Eugene Jenkins
- 6 years ago
- Views:
Transcription


1 1 Annual Results Year ended 30 April June 2014
2 Cautionary statement 2 This document is solely for use in connection with a briefing on the group headed by Stagecoach Group plc ( the Group ). This document contains forward-looking statements that are subject to risk factors associated with, amongst other things, the economic and business circumstances occurring from time to time in the countries, sectors and markets in which the Group operates. It is believed that the expectations reflected in these statements are reasonable but they may be affected by a wide range of variables which could cause actual results to differ materially from those currently anticipated. No assurances can be given that the forwardlooking statements in this presentation will be realised. The forward-looking statements reflect the knowledge and information available at the date of preparation. This document is not a full record of the presentation because it does not include comments made verbally by Stagecoach Group management or by others. Figures from previous years have been restated as appropriate to reflect the application of new accounting rules in respect of pensions.
3 3 ROSS PATERSON FINANCE DIRECTOR
4 Continued good financial performance and investment 4 Adjusted EPS up 5.7% to 26.0p Full year dividend per share up 10.5% to 9.5p Organic volume and revenue growth in UK regional bus business Over 80% increase in North America operating profit 9m invested in pursuing new rail franchise opportunities 118.9m net capital expenditure investment
5 UK Bus (regional operations) Delivering further organic growth 5 Year to 30 April 2014 Year to 30 April 2013 Change Revenue ( m) 1, % Like-for-like revenue ( m) % Operating profit ( m) % Operating margin (%) 14.6% 14.8% (20)bp Estimated like-for-like passenger journeys* (m) % 8.2m rise in operating profit, excluding Olympics contracts in 2012 Continued organic growth c.4% commercial revenue growth Increased share of tender market revenue up 7% Wage awards over last six months averaging c.2.5% * Excludes inter-city coach services operated as a sub-contractor
 Great Britain local bus excluding London Bus industry share of all road")


6 UK Bus (regional operations) Growth and outperformance through the recession and beyond 6 Change in passenger journeys six years from 2006/7 to 2012/13* Stagecoach UK Bus (regional operations) Great Britain local bus excluding London Bus industry share of all road passenger kilometres** 2006/7 5.6% 93.0% 1.4% 2011/12 6.0% 92.6% 1.4% Change +0.4% -0.4% - * Sources: Stagecoach UK Bus compounded like-for-like passenger volumes for years to 30 April; Great Britain - derived from Transport Statistics Great Britain, table BUS0103, for years to 31 March; includes effect of new concessionary schemes but also government cuts to tendered services ** Source: Great Britain derived from Transport Statistics Great Britain, table TSGB0101, for years to 31 March. Bus and coach shown together and includes London
 New Wigan Dayrider ticket at 2.")
7 UK Bus (regional operations) Taking a long-term perspective for a sustainable business 7 Wigan bus operations Acquired March 2012 Stagecoach route costing implemented Weekly ticket reduced 50% from 18 to 9 (now 11) New Wigan Dayrider ticket at vehicles replaced with better models Passenger volume growth estimated at 28% over two years Profit down but growing and on a significantly larger customer base
8 UK Bus (London) Winning new profitable business 8 Year to 30 April 2014 Year to 30 April 2013 Change Revenue and like-for-like revenue ( m) % Operating profit ( m) % Operating margin (%) 9.8% 8.2% 160bp Success in winning profitable new business reflected in return to revenue growth New business wins underpin prospects for 2014/15 18 bids submitted since 1 May 2013: 100% retention rate on 3 incumbent services 29% win rate from bids for new services (2 out of 7) Awaiting outcome on 8 others Drivers wage agreements concluded through to April 2015 c.2.4% Focus remains on tight control of costs and growth through new contract wins
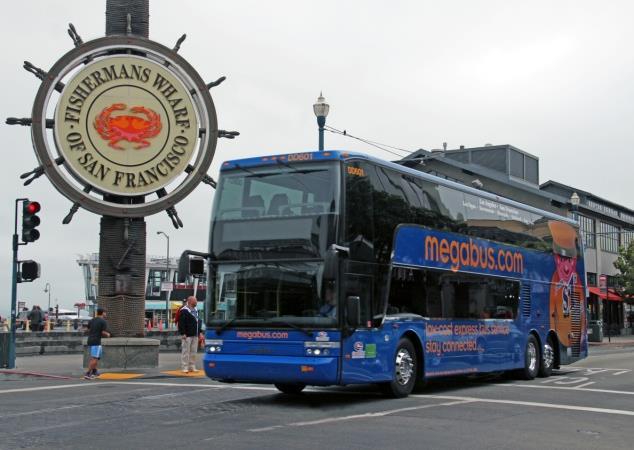
9 North America Substantial profit growth 9 Year to 30 April 2014 Year to 30 April 2013 Change Revenue (US$m) % Like-for-like revenue (US$m) % Operating profit (US$m) % Operating margin (%) 5.5% 3.3% 220bp Significant increase in operating profit, principally from megabus.com Strong performance whilst absorbing the adverse effects of severe weather 16.4% growth in megabus.com revenue Progressing further expansion of megabus.com
10 UK Rail Pursuing new opportunities 10 Year to 30 April 2014 Year to 30 April 2013 Change Revenue and like-for-like revenue ( m) 1, , % Operating profit ( m) (16.7)% Operating margin (%) 2.7% 3.4% (70)bp Estimated passenger miles South West* (m) 3, , % Estimated passenger miles East Midlands (m) 1, ,380.5 (0.8)% Solid results despite severe weather in South West England and substantial bid costs Profit is after 9.0m bid costs as we invest in pursuing new opportunities South West Trains Alliance extended Negotiation of terms for new franchises - South West to 2019; East Midlands to 2017 One of three bidders for new Docklands Light Railway franchise to start September 2014 Bid submitted with Virgin for new East Coast franchise franchise to start March 2015 * The growth in South West Trains passenger miles is inflated by changes made by Transport for London to London Travelcard allocations.


11 UK Rail Meeting the challenges of extended severe weather 11 In two days at South West Trains 23 & 24 December incidents 140+ fallen trees Landslides Flooding in 9 locations Huge clear up operation over Christmas 2 Jan: 93% of services ran South Western Railway area
12 UK Rail Growth and outperformance through the recession and beyond 12 Change in passenger miles five years from 2006/7 to 2011/12* Stagecoach UK Rail Great Britain Rail Rail industry share of all modes passenger kilometres** 2006/7 7.4% 2011/12 9.1% Change +1.7% * Sources: Stagecoach UK Rail compounded like-for-like passenger volumes for years to 30 April for South West Trains, East Midlands Trains and 49% of West Coast Trains; Great Britain derived from Transport Statistics Great Britain, table TSGB0101, for years to 31 March. Rail and tram shown together. ** Source: Great Britain derived from Transport Statistics Great Britain, table TSGB0101, for years to 31 March. Rail and tram shown together.
13 Virgin Rail Group Transition to new franchise 13 Year to 30 April 2014 Year to 30 April 2013 Change Revenue and like-for-like revenue 49% share ( m) % Operating profit 49% share ( m) (75.2)% Operating margin (%) 0.6% 2.4% (180)bp Dividends received ( m) (68.2)% Estimated passenger miles (m) 3, , % Operating margin reflects full year of 1% management contract New franchise effective from 22 June 2014 Until 31 March 2017 with DfT option to extend by one year
14 Virgin Rail Group New franchise to benefit all stakeholders 14 Customer benefits Taxpayer benefits High bandwidth wi-fi Nectar loyalty scheme More standard class seating c. 20m stations investment Upgraded website and more ticket vending points New destinations Blackpool; Shrewsbury Shareholder benefits 433m expected premium over three years Government option to extend by one year (further 261m premium) Share of any financial outperformance Share of any GDP outperformance HS2 co-operation Community and employee benefits Improved risk-return trade off 3 to 4 years of further expected cash flows Appropriate GDP risk share Apprenticeships, internships and other young people s benefits Community Rail Partnerships and Champions Ex-offender and Princes Trust placements Virgin Unite Additional driver alerts to cut energy consumption CO 2 and waste reduction plans
15 Stagecoach Group A strong financial position 15 Year to 30 April 2014 Year to 30 April 2013 Change Net finance charges (including share of net finance income of joint ventures) ( m) (42.3) (42.8) 0.5 EBITDA from continuing operations and joint ventures* ( m) Closing net debt ( m) (461.6) (538.0) 76.4 Net Debt/EBITDA * 1.4x 1.6x (0.2)x EBITDA*/Net finance charges (including share of net finance income of joint ventures) 8.0x 7.8x 0.2x * excluding exceptional items
16 16 MARTIN GRIFFITHS CHIEF EXECUTIVE
")

17 Private operators underpin UK Bus industry success 17 Continued delivery Value for money: best value weekly ticket; average TfL weekly ticket costs 50% more Stable bus networks: commercial services largely maintained v cuts to LA contracted services Innovation: launch of new products (StagecoachGold, sleepercoach network) High customer satisfaction: Stagecoach leading major operators Growing proportion of network commercially funded Partnerships: schemes in place and under discussion Opportunities ahead Building on strong partnerships Recovering economy and modal shift Improved retail options and customer information through technology investment


18 Growing momentum in UK Rail 18 Continued delivery UK has highest passenger satisfaction, best safety record and fastest growth of any major European railway Rail Delivery Group providing leadership and focus on improvements to franchising model Insight from alliancing New terms agreed at West Coast Opportunities ahead Extensions at South West & East Midlands Additional rail capacity One of three bidders for DLR One of three bidders for East Coast

19 Investment and innovation driving growth in North America 19 Continued delivery Launch of megabus.com Florida network megabus.com now links c.130 destinations in US and Canada Progress with Twin America litigation Sale of small non-core business units Opportunities ahead Expansion of new megabus.com premium seat reservation facility Further scope to rationalise nonmegabus.com portfolio


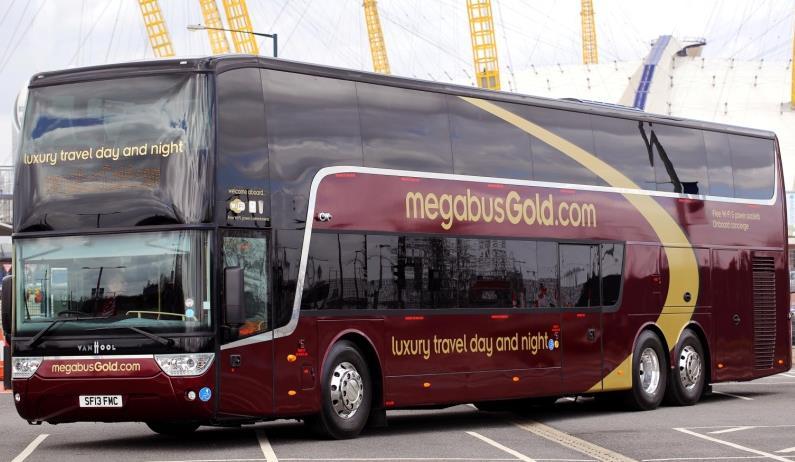

20 Growing inter-city coach services in UK and mainland Europe 20 UK France Germany Belgium High load factors on sleepercoach services Existing European services now profitable New London-Paris-Toulouse-Barcelona route Scope for further services in Europe The Netherlands Spain
21 21 Strong performance and healthy outlook Good 2013/14 results amidst significant challenges Current trading as expected Strong financial position Further opportunities ahead Extensions and new franchises in UK Rail megabus.com expansion North America and Europe Further organic growth
22 22 ANNUAL RESULTS YEAR ENDED 30 APRIL 2014
23 APPENDICES 23
24 Summary income statement 24 Year to 30 April 2014 m Year to 30 April 2013 m UK Bus (regional) operating profit UK Bus (London) operating profit Citylink profit after tax North America operating profit Change Twin America profit after tax (6.2) UK Rail operating profit (6.9) Virgin Rail Group profit after tax (6.3) Restructuring costs, Group overheads and other items (14.8) (17.4) 2.6 Operating profit Finance charges (net) (42.6) (43.3) 0.7 Tax (31.2) (36.3) 5.1 Profit excluding intangibles and exceptionals Intangibles and exceptionals, net of tax (17.0) (14.6) (2.4) Reported profit from continuing operations Adjusted earnings per share (pence) 26.0p 24.6p 1.4p m
25 Divisional income statements Year ended 30 April UK Bus (Regional) m UK Bus (London) m North America US$m Revenue 1, ,252.0 UK Rail m Rail franchise premia (599.0) Rail revenue support Other operating income Staff costs (499.8) (143.2) (276.7) (307.4) Fuel costs (i.e. diesel) (148.7) (35.4) (90.6) (52.6) Insurance and claims costs (27.3) (6.7) (46.6) (5.1) Depreciation (68.7) (5.9) (52.0) (8.2) Rolling stock costs lease & maintenance (205.1) Other operating leases (9.4) (15.0) (21.6) (1.9) Network Rail (217.5) Electricity for trains (33.4) Commissions payable (33.2) Materials & consumables (39.0) (8.6) (54.5) (32.9) Other costs (83.6) (8.7) (113.6) (116.5) Operating profit
26 26 Rail premium profiles Year to 31 March: South West m East Midlands m 2014 (465.4) (123.8) 2015 (515.8) (187.8) 2016 (598.4) (100.0)* 2017 (589.0) The amounts shown above do not reflect the changes to premium payments that result from the Rail Regulator s determination of Network Rail s charging of train operating companies for the five year control period that commenced on 1 April The effect on the premium payments has yet to be agreed with the Department for Transport. The above amounts are subject to adjustment for: (1) various inflation measures (2) risks borne by the Department for Transport (3) called options and (4) changes in Regulated Network Rail charges. The amounts shown above are based on estimated inflation and options called to date, and exclude revenue support. * Part year to October 2017
27 Miscellaneous income statement items 27 Year to 30 April 2014 Year to 30 April 2013 Change Twin America joint venture after tax* ( m) (6.2) Citylink joint venture after tax ( m) Group overheads ( m) (13.9) (15.7) 1.8 Restructuring costs (non-exceptional) ( m) (0.9) (1.7) 0.8 Intangible asset expenses ( m) (14.0) (16.1) 2.1 Post-tax exceptional items ( m) (7.5) (3.2) (4.3) Tough trading conditions at Twin America. Increased competition and loss of market share Principal exceptional items: Further refund of West Coast franchise bid costs Provision for Twin America litigation * excluding exceptional items
28 Taxation 28 Pre-tax profit m Year to 30 April 2014 Excluding intangible asset expenses and exceptional items (32.7) 17.9% Intangible asset expenses (14.0) % Exceptional items (8.5) % Tax m Rate % (27.2) 17.0% Reclassify joint venture taxation for reporting purposes (1.7) 1.7 Reported in income statement (25.5) 16.1% Cash tax paid (net) (20.2)
29 Movement in net debt 29 Year to 30 April 2014 m EBITDA from Group companies before exceptional items Loss on disposal of property, plant and equipment 2.1 Equity-settled share based payment expense 2.2 Dividends from joint ventures 8.2 Difference between employer pension contributions and pension expense in operating profit 1.6 Working capital movements (42.3) Net interest paid (33.5) Tax paid (20.2) Net cash from operating activities Net capital expenditure including new hire purchase and finance leases (118.9) Acquisitions /disposals of businesses, intangibles and investments (11.4) Token sales and redemptions (0.3) Cash generation Foreign exchange, income statement and other movements 12.0 Equity dividends (51.0) Net own shares purchased (2.3) Decrease in net debt 76.4 Opening net debt (538.0) Closing net debt (461.6)
30 Fuel hedging 30 UK Bus (regional operations) UK Bus (London) North America UK Rail 2014/15 - % of forecast consumption hedged 94% 50% 81% 72% - average hedge price (per litre) 49.1p 49.9p 75.8 cents 48.8p 2015/16 - % of forecast consumption hedged 36% 37% 30% 37% - average hedge price (per litre) 46.2p 48.4p 73.7 cents 47.2p 2016/17 - % of forecast consumption hedged - 25% 1% - - average hedge price (per litre) p 73.6 cents /18 - % of forecast consumption hedged - 12% 1% - - average hedge price (per litre) p 73.6 cents - Market price (per litre) 45.4p 45.4p 75.4 cents 45.6p Market prices are as at 30 May 2014 Prices exclude delivery margins, duty, taxes and Bus Service Operators Grant
31 Definitions 31 Like-for-like amounts are derived, on a constant currency basis, by comparing the relevant yearto-date amount with the equivalent prior year period for those businesses and individual operating units that have been part of the Group throughout both periods. Operating profit or loss for a particular business unit or division within the Group refers to profit or loss before net finance income/charges, taxation, intangible asset expenses, exceptional items and restructuring costs. Operating margin for a particular business unit or division within the Group means operating profit or loss as a percentage of revenue. Exceptional items means items which individually or, if of a similar type, in aggregate need to be disclosed by virtue of their nature, size or incidence in order to allow a proper understanding of the underlying financial performance of the Group. Gross debt is borrowings as reported on the consolidated balance sheet, adjusted to exclude accrued interest, the effect of fair value hedges on the carrying value of borrowings and unamortised gains on the early settlement of interest rate swaps. Net debt (or net funds) is the net of cash and gross debt.
32 32 ANNUAL RESULTS YEAR ENDED 30 APRIL 2014
Annual Results. Year ended 28 April June 2018
 1 Annual Results Year ended 28 April 2018 28 June 2018 Cautionary statement 2 This document is solely for use in connection with a briefing on the group headed by Stagecoach Group plc ( the Group ). This
Interim Results. Half-year ended 27 October December 2018
 1 Interim Results Half-year ended 27 October 2018 5 December 2018 Cautionary statement 2 This document is solely for use in connection with a briefing on the group headed by Stagecoach Group plc ( the
THE GO-AHEAD GROUP PLC HALF YEAR RESULTS FOR THE SIX MONTHS ENDED 29 DECEMBER 2018
 THE GO-AHEAD GROUP PLC HALF YEAR RESULTS FOR THE SIX MONTHS ENDED 29 DECEMBER 2018 BUSINESS OVERVIEW Continued good progress made in all three strategic pillars: protect and grow the core; win new bus
OPERATING AND FINANCIAL HIGHLIGHTS
 Copa Holdings Reports Net Income of US$32.0 Million and EPS of US$0.72 for the Second Quarter of 2012 Excluding special items, adjusted net income came in at $58.6 million, or EPS of $1.32 per share Panama
For Immediate Release: 2 December Holidaybreak plc ANNOUNCES PRELIMINARY RESULTS FOR THE YEAR ENDED 30 SEPTEMBER 2002
 For Immediate Release: 2 December 2002 ANNOUNCES PRELIMINARY RESULTS FOR THE YEAR ENDED 30 SEPTEMBER 2002 ( HBR ), the provider of specialist holidays, today announces its Preliminary results for the year
OPERATING AND FINANCIAL HIGHLIGHTS. Subsequent Events
 Copa Holdings Reports Net Income of US$113.1 Million and EPS of US$2.57 for the First Quarter of 2015 Excluding special items, adjusted net income came in at US$106.0 million, or EPS of US$2.41 per share
2006 Preliminary Results. 7 March 2007
 2006 Preliminary Results 7 March 2007 Anthony Rabin 16 Headline numbers 2005 2006 Revenue 4,938m 5,852m +19% Pre-tax profit* 134m 152m +13% Adjusted eps* 24.1p 27.3p +13% Full-year proposed dividend 8.1p
Copa Holdings Reports Net Income of $49.9 million and EPS of $1.18 for the Second Quarter of 2018
 Copa Holdings Reports Net Income of $49.9 million and EPS of $1.18 for the Second Quarter of 2018 Panama City, Panama --- Aug 8, 2018. Copa Holdings, S.A. (NYSE: CPA), today announced financial results
AIR CANADA REPORTS 2010 THIRD QUARTER RESULTS; Operating Income improved $259 million or 381 per cent from previous year s quarter
 AIR CANADA REPORTS 2010 THIRD QUARTER RESULTS; Operating Income improved $259 million or 381 per cent from previous year s quarter MONTRÉAL, November 4, 2010 Air Canada today reported operating income
OPERATING AND FINANCIAL HIGHLIGHTS SUBSEQUENT EVENTS
 Copa Holdings Reports Net Income of US$6.2 Million and EPS of US$0.14 for the Third Quarter of 2015 Excluding special items, adjusted net income came in at $37.4 million, or EPS of $0.85 per share Panama
Interim Report 3m Bilfinger Berger SE, Mannheim May 10, 2012 Joachim Müller, CFO
 Interim Report 3m 2012 Bilfinger Berger SE, Mannheim May 10, 2012 Joachim Müller, CFO Bilfinger Berger SE Interim report 3m 2012 May 10, 2012 Page 1 3m 2012: Highlights Growth in output volume and orders
CONTACT: Investor Relations Corporate Communications
 NEWS RELEASE CONTACT: Investor Relations Corporate Communications 435.634.3200 435.634.3553 Investor.relations@skywest.com corporate.communications@skywest.com SkyWest, Inc. Announces Second Quarter 2017
OPERATING AND FINANCIAL HIGHLIGHTS SUBSEQUENT EVENTS
 Copa Holdings Reports Financial Results for the Third Quarter of 2016 Excluding special items, adjusted net income came in at $55.3 million, or adjusted EPS of $1.30 per share Panama City, Panama --- November
Heathrow (SP) Limited
 Limited") Draft v2.0 10 Feb Heathrow (SP) Limited Results for year ended 31 December 2013 24 February 2014 Strong operational and financial performance in 2013 Passenger satisfaction at record high and over 72 million
Draft v2.0 10 Feb Heathrow (SP) Limited Results for year ended 31 December 2013 24 February 2014 Strong operational and financial performance in 2013 Passenger satisfaction at record high and over 72 million
Helloworld Travel Limited results announcement Half year ended 31 December 2017
 Helloworld Travel Limited results announcement Half year ended 31 December 2017 HIGHLIGHTS FOR THE HALF YEAR ENDED 31 DECEMBER 2017 Total Transaction Value (TTV) growth of 2.7% to $2.968 billion. Earnings
1.3% millionn euros. Net debt of 5.4 improvement. euros to. Financial Year. the Air. operating. equipped. ness and. also focus on.
 25 th July 2014 Financial Year 2014: First Half results SECOND QUARTER Revenues of 6.45 billion euros, upp 1.7% like-for-like; passenger unit revenue up 1.3% at constant currency thanks to strict capacity
Managing through disruption
 28 July 2016 Third quarter results for the three months ended 30 June 2016 Managing through disruption 3 months ended Like-for-like (ii) m (unless otherwise stated) Change 30 June 2016 30 June 2015 change
Interim Report 6m 2014
 August 11, 2014 Interim Report 6m 2014 Investors and Analysts Conference Call on August 11, 2014 Joachim Müller, CFO Latest ad-hoc release (August 4, 2014) Reduction of forecast, primarily due to a further
AIR CANADA REPORTS FULL YEAR AND FOURTH QUARTER 2010 RESULTS
 AIR CANADA REPORTS FULL YEAR AND FOURTH QUARTER 2010 RESULTS Record annual EBITDAR of $1.386 billion, 104 per cent improvement Operating income improvement of $677 million Employees to receive special
Highlights from the Annual Results December 2007
 Highlights from the Annual Results December 2007 Disclaimer The information in this document is taken from the BAA 2007 Annual Results ( the Results ) which were published on 11 March 2008 and other public
Overview. > Normalised earnings* before taxation of, up 30% > Statutory earnings before taxation of, up 40% > Statutory net profit after taxation of
 1 Overview > Normalised earnings* before taxation of, up 30% > Statutory earnings before taxation of, up 40% > Statutory net profit after taxation of > Operating revenue of > Strong operating cash flow
OPERATING AND FINANCIAL HIGHLIGHTS. Subsequent Events
 Copa Holdings Reports Net Income of $103.8 million and EPS of $2.45 for the Third Quarter of 2017 Excluding special items, adjusted net income came in at $100.8 million, or EPS of $2.38 per share Panama
OPERATING AND FINANCIAL HIGHLIGHTS. Subsequent Events
 Copa Holdings Reports Financial Results for the First Quarter of 2016 Excluding special items, adjusted net income came in at US$69.9 million, or EPS of US$1.66 per share Panama City, Panama --- May 5,
M.A.G INTERIM REPORT AND ACCOUNTS. magworld.co.uk. Six months ended 30 September 2013
 2013-14 M.A.G INTERIM REPORT AND ACCOUNTS Six months ended 30 September 2013 magworld.co.uk 02 Contents CONTENTS OUR BUSINESS 04 FINANCIAL AND BUSINESS HIGHLIGHTS Chief Executive s review 06 Financial
Copa Holdings Reports Net Income of $136.5 million and EPS of $3.22 for the First Quarter of 2018
 Copa Holdings Reports Net Income of $136.5 million and EPS of $3.22 for the First Quarter of 2018 May 9, 2018 PANAMA CITY, May 9, 2018 /PRNewswire/ -- Copa Holdings, S.A. (NYSE: CPA), today announced financial
Thank you for participating in the financial results for fiscal 2014.
 Thank you for participating in the financial results for fiscal 2014. ANA HOLDINGS strongly believes that safety is the most important principle of our air transportation business. The expansion of slots
CONTACT: Investor Relations Corporate Communications
 NEWS RELEASE CONTACT: Investor Relations Corporate Communications 435.634.3200 435.634.3553 Investor.relations@skywest.com corporate.communications@skywest.com SkyWest, Inc. Announces Fourth Quarter 2017
2012 Result. Mika Vehviläinen CEO
 2012 Result Mika Vehviläinen CEO 1 Agenda Market environment in Q4 Business performance and strategy execution Outlook Financials 2 Market Environment According to IATA, Global air travel continues to
EASYJET TRADING STATEMENT FOR THE QUARTER ENDED 31 DECEMBER easyjet delivers a good start to the year, in line with expectations
 EASYJET TRADING STATEMENT FOR THE QUARTER ENDED 31 DECEMBER 2018 easyjet delivers a good start to the year, in line with expectations Summary easyjet has delivered a good performance in the quarter with
OPERATING AND FINANCIAL HIGHLIGHTS
 Copa Holdings Reports Financial Results for the Fourth Quarter of 2015 Excluding special items, adjusted net income came in at $31.7 million, or EPS of $0.73 per share Panama City, Panama --- February
Finnair Q Result
 Finnair Q1 2015 Result 7 May 2015 CEO Pekka Vauramo, Interim CFO Mika Stirkkinen 1 Turbulent market environment The weakness of the Finnish economy continued to be reflected in the demand in the first
Adjusted net income of $115 million versus an adjusted net loss of $7 million in the second quarter of 2012, an improvement of $122 million
 Air Canada Reports Record Second Quarter 2013 Results Highest Adjusted Net Income, Operating Income and EBITDAR Results for Second Quarter in Air Canada s History Adjusted net income of $115 million versus
Interim results. 11 May 2010
 Interim results 11 May 2010 Introduction Andy Harrison Chief Executive Officer Strong performance despite disruption Improvement in revenue, margins and cash Continued network improvement has driven better
FIRST QUARTER RESULTS 2017
 FIRST QUARTER RESULTS 2017 KEY RESULTS In the 1Q17 Interjet total revenues added $4,421.5 million pesos that represented an increase of 14.8% over the income generated in the 1Q16. In the 1Q17, operating
Ramsay Health Care Limited Results Briefing Half Year ended 31 December 2018
 Ramsay Health Care Limited Results Briefing Half Year ended 31 December 2018 Craig McNally, Group Managing Director & Bruce Soden, Group Finance Director 28 February 2019 ramsayhealth.com Agenda Group
SkyWest, Inc. Announces First Quarter 2018 Profit
 NEWS RELEASE CONTACT: Investor Relations Corporate Communications 435.634.3200 435.634.3553 Investor.relations@skywest.com corporate.communications@skywest.com SkyWest, Inc. Announces First Quarter 2018
Copa Holdings Reports Net Income of $57.7 million and EPS of $1.36 for the Third Quarter of 2018
 Copa Holdings Reports Net Income of $57.7 million and EPS of $1.36 for the Third Quarter of 2018 November 14, 2018 PANAMA CITY, Nov. 14, 2018 /PRNewswire/ -- Copa Holdings, S.A. (NYSE: CPA), today announced
MGM Resorts International Reports Second Quarter Financial Results
 NEWS RELEASE MGM Resorts International Reports Second Quarter Financial Results 8/5/2014 Consolidated Adjusted EBITDA Increased 8%, Led By 10% Growth In Wholly Owned Domestic Resorts MGM China Declares
Copa Holdings Reports Record Earnings of US$41.8 Million for 4Q06 and US$134.2 Million for Full Year 2006
 Copa Holdings Reports Record Earnings of US$41.8 Million for 4Q06 and US$134.2 Million for Full Year 2006 Panama City, Panama --- March 7, 2007. Copa Holdings, S.A. (NYSE: CPA), parent company of Copa
TRAFFIC GROWS BY 35%, PROFITS INCREASE BY 44% TO 104.5M
 TRAFFIC GROWS BY 35%, PROFITS INCREASE BY 44% TO 104.5M Ryanair, Europe s largest low fares airline today (25 June 2001) announced a strong set of results for the year end March, 2001. Traffic for the
Copa Holdings Reports Net Income of US$113.9 Million for the Fourth Quarter of 2013
 Copa Holdings Reports Net Income of US$113.9 Million for the Fourth Quarter of 2013 Panama City, Panama --- February 12, 2014. Copa Holdings, S.A. (NYSE: CPA), today announced financial results for the
Heathrow (SP) Limited
 Limited") 28 April 2014 Heathrow (SP) Limited Results for three months ended 31 March 2014 Strong operational and financial performance at the outset of the new regulatory period Highest ever passenger satisfaction
28 April 2014 Heathrow (SP) Limited Results for three months ended 31 March 2014 Strong operational and financial performance at the outset of the new regulatory period Highest ever passenger satisfaction
FINANCIAL YEAR Key data
 March 8 th, 2012 FINANCIAL YEAR 2011 2011: A TOUGH YEAR Economic environment and geopolitical crises weigh on activity Insufficient level of unit revenues to absorb higher fuel bill Revenues up 4.5% to
Spirit Airlines Reports First Quarter 2018 Results
 Spirit Airlines Reports First Quarter 2018 Results MIRAMAR, Fla., April 26, 2018 - Spirit Airlines, Inc. (NYSE: SAVE) today reported first quarter 2018 financial results. For the first quarter 2018, Spirit
First Half 2017 results Result improvement driven by solid traffic and unit revenue performance
 28 th July 2017 2017 results Result improvement driven by solid traffic and unit revenue performance FIRST HALF 2017 Robust traffic resulting in an improved load factor, up 1.4 pts compared to last year
CONTACT: Investor Relations Corporate Communications
 NEWS RELEASE CONTACT: Investor Relations Corporate Communications 435.634.3200 435.634.3553 Investor.relations@skywest.com corporate.communications@skywest.com SkyWest, Inc. Announces Second Quarter 2016
Media Release QANTAS RESULTS FOR THE HALF YEAR ENDED 31 DECEMBER 2004 HIGHLIGHTS. Fully franked interim dividend of 10 cents per share
 Media Release QANTAS RESULTS FOR THE HALF YEAR ENDED 31 DECEMBER 2004 HIGHLIGHTS Profit before tax of $601.3 million Net profit after tax of $458.4 million Revenue of $6.4 billion Fully franked interim
OPERATING AND FINANCIAL HIGHLIGHTS
 Copa Holdings Reports Net Income of US$18.6 Million and EPS of US$0.42 for the Second Quarter of 2010 Excluding special items, adjusted net income came in at $26.3 million, or $0.60 per share Panama City,
For personal use only
 HELLOWORLD TRAVEL LIMITED RESULTS ANNOUNCEMENT Highlights for the year ended 30 June 2018 Total Transaction Value (TTV) growth of 3.5% to $6.1 billion, underpinned by strong air ticket sales volume growth.
Spirit Airlines Reports First Quarter 2017 Results
 Spirit Airlines Reports First Quarter 2017 Results MIRAMAR, Fla., April 28, 2017 - Spirit Airlines, Inc. (NASDAQ: SAVE) today reported first quarter 2017 financial results. GAAP net income for the first
OPERATING AND FINANCIAL HIGHLIGHTS
 Copa Holdings Reports Financial Results for the Fourth Quarter of 2018 Excluding special items, adjusted net profit came in at $44.0 million, or Adjusted EPS of $1.04 Panama City, Panama --- February 13,
An improvement in first-half results relative to the year-earlier period, driven by growth in tourism revenue.
 Paris, 30 May 2018 An improvement in first-half results relative to the year-earlier period, driven by growth in tourism revenue. I. Main events during H1 2017/2018 Financing operations In order to refinance
The Manager Company Announcements Australian Stock Exchange Limited Sydney NSW Dear Sir. Demerger of BHP Steel
 The Manager Company Announcements Australian Stock Exchange Limited Sydney NSW 2000 Dear Sir Demerger of BHP Steel At the time of the announcement of the creation of the DLC between BHP Limited and Billiton
TUI News Investor Relations
 records very successful financial year 2013/2014 Merger with TUI Travel PLC about to be closed Significant outperformance against earnings targets in full financial year 2013/2014; earnings growth driven
An innovative media company delivering sustainable, profitable growth Half year results 21 st August 2013
 An innovative media company delivering sustainable, profitable growth Half year results 21 st August 2013 Richard Findlay Chairman An innovative media company delivering sustainable, profitable growth
First Half 2013 Results. 16 mai 2013
 First Half 2013 Results 16 mai 2013 26 July 2013 Results Increasing effects of Transform 2015 Highlights of the First Half A difficult global economic environment Transform 2015 plan roll-out on track
Consolidated Statement of Financial Position as at December 31, 2017
 86 Key Figures Consolidated Statement of Financial Position as at December 31, 2017 Assets in million December 31, 2017 December 31, 2016 Non-current assets Goodwill 19.3 19.3 Investments in airport operating
Historical Statistics
 Historical Statistics FedEx Corporation Financial and Operating Statistics FY 2005 FY 2014 This report is a statistical supplement to FedEx s interim financial reports and is prepared quarterly. Additional
AIR CANADA REPORTS THIRD QUARTER RESULTS
 AIR CANADA REPORTS THIRD QUARTER RESULTS THIRD QUARTER OVERVIEW Operating income of $112 million compared to operating income of $351 million in the third quarter of 2007. Fuel expense increased 49 per
20 February 2019 FULL YEAR 2018 RESULTS Resilient results despite the impact of strikes and fuel bill increase
 20 February 2019 FULL YEAR 2018 RESULTS Resilient results despite the impact of strikes and fuel bill increase FULL YEAR 2018 More than 100 million passengers carried, the leading European group for long-haul
Executive Directors Review
 Financial Summary Turnover for the year ended 31 December 2011 amounted to HK$571.4 million ( 47.6 million) (2010: HK$706.8 million ( 58.7 million)). The turnover was principally attributable to the recognition
RYANAIR ANNOUNCES RECORD Q1 PROFIT INCREASE
 RYANAIR ANNOUNCES RECORD Q1 PROFIT INCREASE Ryanair, Europe s largest low fares airline today (Tuesday, 6 Aug 2002) announced its biggest increase in Q1 profits (end 30 Jun 02). Passenger traffic during
RESULTS AS AT 30 th JUNE 2018 Positive unit revenue securing stable operating result excluding strikes
 1 st August 2018 RESULTS AS AT 30 th JUNE 2018 Positive unit revenue securing stable operating result excluding strikes SECOND QUARTER 2018 Air France-KLM leveraged the solid ongoing demand to generate
INTESA SANPAOLO VITA RESULTS AT 31 MARCH 2017 APPROVED:
 INTESA SANPAOLO VITA RESULTS AT 31 MARCH 2017 APPROVED: Assets under management at 145,908.2 million euros (143,735.3 million euros at December 2016 +1.5%) Financial liabilities (unit and index linked)
Spirit Airlines Reports Second Quarter 2018 Results
 Spirit Airlines Reports Second Quarter 2018 Results MIRAMAR, Fla., July 25, 2018 - Spirit Airlines, Inc. (NYSE: SAVE) today reported second quarter 2018 financial results. GAAP net income for the second
NORWEGIAN AIR SHUTTLE ASA QUARTERLY REPORT SECOND QUARTER 2006 [This document is a translation from the original Norwegian version]
![NORWEGIAN AIR SHUTTLE ASA QUARTERLY REPORT SECOND QUARTER 2006 [This document is a translation from the original Norwegian version]](/thumbs/74/71229964.jpg "NORWEGIAN AIR SHUTTLE ASA QUARTERLY REPORT SECOND QUARTER 2006 [This document is a translation from the original Norwegian version]") NORWEGIAN AIR SHUTTLE ASA QUARTERLY REPORT SECOND QUARTER 2006 SECOND QUARTER IN BRIEF had earnings before tax of MNOK 24.8 (20.6) in the second quarter. The operating revenue increased by 44 % this quarter,
NORWEGIAN AIR SHUTTLE ASA QUARTERLY REPORT SECOND QUARTER 2006 SECOND QUARTER IN BRIEF had earnings before tax of MNOK 24.8 (20.6) in the second quarter. The operating revenue increased by 44 % this quarter,
Commenting on the results, Andy Harrison, easyjet Chief Executive said:
 easyjet plc Interim results for the six months to 31 March GOOD 1 ST HALF REVENUE PERFORMANCE; FULL YEAR GUIDANCE MAINTAINED Results at a glance H1 H1 change Total revenue () 1,032.8 892.2 15.8% Loss before
Annual Results Air New Zealand
 Annual Results 2011 Air New Zealand Highlights Normalised earnings* $75m Net cash position of $860m Operating cash flow down 5% Gearingat467% at 46.7% Final dividend 2.5 cents per share (unimputed) New
LOCATED AT THE GATEWAY OF THE TROPICAL PROVINCE, RIDING ON THE GROWTH MOMENTUM OF THE COUNTRY, WE ARE ON THE RIGHT TRACK OF TAKING OFF.
 LOCATED AT THE GATEWAY OF THE TROPICAL PROVINCE, RIDING ON THE GROWTH MOMENTUM OF THE COUNTRY, WE ARE ON THE RIGHT TRACK OF TAKING OFF. MANAGEMENT DISCUSSION INDUSTRY REVIEW Civil Aviation Industry in
Historical Statistics
 Historical Statistics FedEx Corporation Financial and Operating Statistics FY 2006 FY 2015 This report is a statistical supplement to FedEx s interim financial reports and is prepared annually. Additional
AEROFLOT ANNOUNCES FY 2017 IFRS FINANCIAL RESULTS
 AEROFLOT ANNOUNCES FY 2017 IFRS FINANCIAL RESULTS Moscow, 1 March 2018 Aeroflot Group ( the Group, Moscow Exchange ticker: AFLT) today publishes its audited financial statements in accordance with International
For personal use only
 ASX and Media Release QANTAS DELIVERS RECORD FIRST HALF PROFIT, INVESTS IN AIRCRAFT AND TRAINING Sydney, 22 February 2018 Underlying Profit Before Tax: $976 million (up 15%) Record results for Qantas Domestic,
PROFIT OF $1.24b ON STRONG REVENUE GAINS BUT FUEL COSTS REMAIN GREATEST CHALLENGE
 PROFIT OF $1.24b ON STRONG REVENUE GAINS BUT FUEL COSTS REMAIN GREATEST CHALLENGE HIGHLIGHTS OF THE GROUP S PERFORMANCE Financial Year 2005-06 4th Quarter 2005-06 Apr 2005 Mar 2006 Year-on-Year % Change
Gerry Laderman SVP Finance, Procurement and Treasurer
 Gerry Laderman SVP Finance, Procurement and Treasurer Safe Harbor Statement Certain statements included in this release are forward-looking and thus reflect our current expectations and beliefs with respect
PRESS RELEASE Financial Results. Rising passenger traffic at 12.5m Exceeding 1bn in consolidated revenue
 PRESS RELEASE 2016 Financial Results Rising passenger traffic at 12.5m Exceeding 1bn in consolidated revenue Kifissia, 23 March 2017 AEGEAN reports full year 2016 results with consolidated revenue at 1,020m,
Finnair Q Result
 Finnair Q2 2015 Result 14 August 2015 CEO Pekka Vauramo, Interim CFO Mika Stirkkinen 1 Market environment shows signs of improvement There were signs of a recovery in the demand for consumer and business
EASYJET INTERIM MANAGEMENT STATEMENT FOR THE QUARTER ENDED 31 DECEMBER 2010
 20 January 2011 easyjet Interim Management Statement Page 1 of 5 20 January 2011 EASYJET INTERIM MANAGEMENT STATEMENT FOR THE QUARTER ENDED 31 DECEMBER 2010 Highlights: Total revenue up by 7.5% to 654
Guidance on criteria for assessing the financial resources of new applicants and holders of operating licences
 Consumer Protection Group Risk Analysis Department Guidance on criteria for assessing the financial resources of new applicants and holders of operating licences Version 10 (20 April 2010) 1 Introduction
2018 full-year results
 2018 full-year results 01 Message from Chairman & CEO 02 FY 2018 Results 03 Business drivers 04 Outlook 02 FY 2018 financial results Key figures Revenue 2.85 Bn ROP 115 M Net debt 252 M Free cash flow
QANTAS RESULTS FOR THE HALF YEAR ENDED 31 DECEMBER 2005 HIGHLIGHTS
 Media Release QANTAS RESULTS FOR THE HALF YEAR ENDED 31 DECEMBER 2005 HIGHLIGHTS Profit before tax of $483.5 million Net profit after tax of $352.6 million Revenue of $6.8 billion Interim dividend of 11
QANTAS ANNOUNCES PROFIT RESULT YEAR ENDED 30 JUNE 2009
 QANTAS ANNOUNCES PROFIT RESULT YEAR ENDED 30 JUNE 2009 HIGHLIGHTS Profit before tax of $181 million, in a year when the International Air Transport Association forecast US$9 billion in losses for global
IAG results presentation. Quarter One th May 2018
 IAG results presentation Quarter One 2018 4 th May 2018 Highlights Willie Walsh, Chief Executive Officer Highlights Another strong quarter performance with an operating profit of 280m (5.6% margin, +2.3pts)
Virgin Australia Holdings Limited (ASX: VAH) H1 FY18 Results 1
 H1 FY18 Results 1") Virgin Australia Holdings Limited (ASX: VAH) H1 FY18 Results 1 Summary of H1 FY18 Group Outcomes 2 Group Underlying Profit Before Tax of $102.5 million up 142.3% Group Statutory Profit After Tax of $4.4
Virgin Australia Holdings Limited (ASX: VAH) H1 FY18 Results 1 Summary of H1 FY18 Group Outcomes 2 Group Underlying Profit Before Tax of $102.5 million up 142.3% Group Statutory Profit After Tax of $4.4
Delta Air Lines Reports June 2009 Quarter Financial Results
 CONTACT: Investor Relations 404-715-2170 Corporate Communications 404-715-2554 Delta Air Lines Reports June 2009 Quarter Financial Results ATLANTA, July 22, 2009 Delta Air Lines (NYSE:DAL) today reported
Copa Holdings Reports Fourth Quarter and Full Year 2007 Results
 Copa Holdings Reports Fourth Quarter and Full Year 2007 Results Panama City, Panama --- February 21, 2008. Copa Holdings, S.A. (NYSE: CPA), parent company of Copa Airlines and Aero Republica, today announced
FirstGroup plc South Western
 FirstGroup plc South Western Rail franchise award Monday 27 March 2017 Overview Delighted to be selected by the Department for Transport (DfT) to operate the South Western franchise for at least seven
For personal use only
 HELLOWORLD ANNOUNCES RESULTS FOR THE YEAR ENDED 30 JUNE 2014 HIGHLIGHTS Total Transaction Value (TTV) of $4.9 billion Adjusted EBITDAI (1) of $40.6 million Loss before tax of $61.2 million includes the
75 Years of Thrills and Entertainment. The Rank Group Plc Preliminary Results to 30 June 2012
 75 Years of Thrills and Entertainment The Rank Group Plc Preliminary Results to 30 June 2012 Agenda Introduction Ian Burke, chairman and chief executive Review of financial results Clive Jennings, finance
Kier Group plc. Preliminary results presentation. 14 September 2006
 Kier Group plc Preliminary results presentation 14 September 2006 Highlights 14 th year of continuous growth Pre-tax profits before exceptionals up 23.6% to 59.1m (2005: 47.8m) EPS before exceptionals
FULL YEAR 2017 RESULTS STRONG OPERATING RESULT AND SIGNIFICANT STRENGTHENING OF THE FINANCIAL STRUCTURE
 16 February 2018 FULL YEAR 2017 RESULTS STRONG OPERATING RESULT AND SIGNIFICANT STRENGTHENING OF THE FINANCIAL STRUCTURE FULL YEAR 2017 Robust traffic statistics with 99 million passengers carried, up
Norwegian Air Shuttle ASA
 Norwegian Air Shuttle ASA Q1 2018 Presentation 26 April 2018 Highlights Q1 2018 Successfully completed private placement of NOK 1.3 billion Added two 737-800s and six 787-9s to operations Launched interline
Crown Resorts Limited
 Crown Resorts Limited 2015 Full Year Results Presentation 13 August 2015 1 Crown Resorts Limited Results Overview Crown Resorts Limited (Crown) performance: Overall, the results for Crown s portfolio of
Interim Results Presentation to Investors
 Interim Results Presentation to Investors SIR IAN PROSSER CHAIRMAN BASS PLC Highlights 3 Turnover + 11.2% Operating profit * + 21.2% Earnings per share * + 13.6% Dividend per share + 3.1% * Adjusted for
Spirit Airlines Reports Third Quarter 2017 Results
 Spirit Airlines Reports Third Quarter 2017 Results MIRAMAR, Fla., October 26, 2017 - Spirit Airlines, Inc. (NASDAQ: SAVE) today reported third quarter 2017 financial results. GAAP net income for the third
Summary of Results for the First Quarter of FY2015/3
 Summary of for the First Quarter of FY2015/3 August 8, 2014 Tokyu Corporation (9005) http://www.tokyu.co.jp/ Contents Ⅰ.Executive Summary 2 Ⅱ.Conditions in Each Business 4 Ⅲ.Details of Financial for the
WestJet announces 18th consecutive quarter of profitability Airline reports third quarter net earnings of $31.4 million
 FOR IMMEDIATE RELEASE WestJet announces 18th consecutive quarter of profitability Airline reports third quarter net earnings of $31.4 million CALGARY, ALBERTA. November 4, 2009. WestJet (TSX:WJA) today
Investor Relations Update January 25, 2018
 General Overview Investor Relations Update Accounting Changes On January 1, 2018, the company adopted two new Accounting Standard Updates: (ASUs): ASU 2014-9: Revenue from Contracts with Customers (the
31 October 2018 RESULTS AS AT 30 SEPTEMBER 2018 Good resilience of operating result thanks to revenue performance and unit cost reduction
 31 October 2018 RESULTS AS AT 30 SEPTEMBER 2018 Good resilience of operating result thanks to revenue performance and unit cost reduction THIRD QUARTER 2018 Air France-KLM commercial teams delivered a
2006 Interim Results. 16 August 2006
 2006 Interim Results 16 August 2006 Sir David John Anthony Rabin Headline numbers First half 2005 First half 2006 Revenue 2,308m 2,773m +20% Pre-tax profit* 52m 60m +15% Adjusted eps* 9.3p 11.4p +23% Interim
Third Quarter Results
 1 Third Quarter 2010-11 Results Highlights of the Third Quarter Passenger business affected by significant disruptions Dynamic cargo activity Strong improvement in results Decline in ex-fuel unit costs