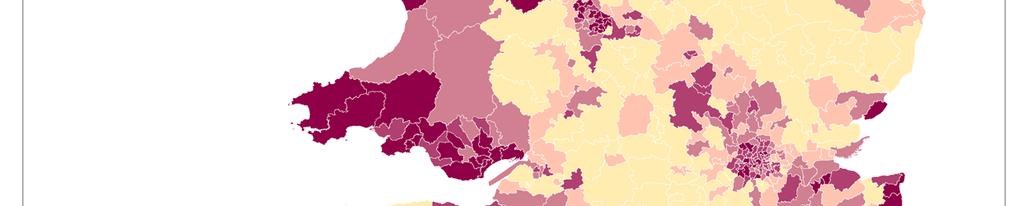
Unemployment by constituency, July 2014
|
|
|
- Brooke Boone
- 5 years ago
- Views:
Transcription
1 Unemployment by constituency, July 2014 RESEARCH PAPER 14/40 16 July 2014 This paper contains labour market figures for parliamentary constituencies, as well as a summary of the latest national and regional statistics. The number of people claiming Jobseeker s Allowance decreased by 36,300 between May 2014 and June 2014, to 1.04 million people aged 18 or over, the lowest level since October The unemployment rate was 6.5% in March-May The ILO measure of unemployment was 2.12 million people, down 121,000 from the previous quarter and down 383,000 from the previous year. The number of people in employment was million in March-May 2014, up 254,000 from the previous quarter and up 929,000 from the previous year. The employment rate was 73.1% and is now higher than its pre-recession peak of 73.0% in March-May Employment Aged 16+ Change on previous quarter Thousands -121 Unemployment Aged Inactivity Aged Aliyah Dar David Hough
2 Recent Research Papers 14/26 Economic Indicators, May /27 Consumer Rights Bill: Progress of the Bill /28 Deregulation Bill: Committee Stage Report /29 Marriage of same sex couples across the UK: What's the same and what's the difference 14/30 Unemployment by Constituency, May /31 Economic Indicators, June /32 European Parliament Elections /33 Local elections /34 Unemployment by Constituency, June /35 Childcare Payments Bill [Bill 7 of ] /36 Economic Indicators, July /37 Modern Slavery Bill [Bill 8 of ] /38 Social Action, Responsibility and Heroism Bill [Bill 9 of ] Research Paper 14/40 Contributing Authors: Feargal McGuinness, Economic Policy and Statistics section James Mirza Davies, Economic Policy and Statistics section Aliyah Dar, Economic Policy and Statistics section David Hough, Economic Policy and Statistics section This information is provided to Members of Parliament in support of their parliamentary duties and is not intended to address the specific circumstances of any particular individual. It should not be relied upon as being up to date; the law or policies may have changed since it was last updated; and it should not be relied upon as legal or professional advice or as a substitute for it. A suitably qualified professional should be consulted if specific advice or information is required. This information is provided subject to our general terms and conditions which are available online or may be provided on request in hard copy. Authors are available to discuss the content of this briefing with Members and their staff, but not with the general public. We welcome comments on our papers; these should be ed to papers@parliament.uk. ISSN
3 Contents 1 Employment and unemployment national 1 Claimant Count and unemployment 1 Employment 2 Inactivity 3 Vacancies 3 Earnings 3 2 Analysis and maps of the JSA claimant count by constituency 4 Rises and falls for constituencies 4 Universal Credit 4 Highest and lowest claimant rates 9 3 Key figures for constituencies 10 Table 1: JSA claimants and rates by constituency, alphabetical listing 10 4 Information about sources, methods and copyright Sources and copyright Unemployment rate methodology Notes and abbreviations 30 The denominators used to calculate the constituency claimant rates shown in this paper were updated in June 2014, in line with new data from the 2011 Census and constituency population estimates for mid Rates shown in editions of Unemployment by Constituency from June 2014 onwards may not be comparable with those shown in previous editions. Publication Unemployment by Constituency is published every month, on the same day that the Office for National Statistics publishes new data on the labour market (a Wednesday in the middle of the month). The next edition will be published on 13 August alert On the day that new labour market statistics are published, an alert is sent out to every Member with the latest headline unemployment figures for their constituency. Members staff can also sign up for this please contact David Hough on x6933 (or houghd@parliament.uk) to be added to the list. Requests for further information and feedback For further information or statistics on the labour market, Members and their staff can contact Feargal McGuinness on x4904. If you have any comments or suggestions about Unemployment by Constituency, please contact Feargal McGuinness on x4904.
4
5 RESEARCH PAPER 14/40 1 Employment and unemployment national Statistics on Jobseeker s Allowance (JSA) claimants are one part of a large selection of labour market data released on a monthly basis. 1 This section highlights some of the key national figures in the latest labour market release. Claimant Count and unemployment The number of people claiming JSA decreased by 36,300 between May 2014 and June 2014, to 1.04 million people aged 18 or over. 2 This is the lowest monthly claimant count since October There are 418,900 fewer people claiming JSA than in June 2013, the largest annual decrease since December The number of male claimants decreased by 22,300 between May 2014 and June 2014 to 668,100. The number of female claimants decreased by 14,000 to 376, Millions of people unemployed UK, seasonally adjusted People available for and looking for w ork (ILO definition) ILO unemployment was 2.12 million in March-May 2014, down 121,000 from the previous quarter and down 383,000 from the year before. 4 The unemployment rate was 6.5% (the percentage of the economically active population who are unemployed), down 0.4% points on the previous quarter and 1.3% points on the same period last year. This compares to a pre-recession low of 5.2% in March-May 2008 and a post-recession high of 8.4% in late People claiming Jobseeker's Allow ance Measuring unemployment: two sets of statistics are used to assess the health of the labour market: The claimant count: the number of people claiming Jobseeker s Allowance. This is the most up to date information and is available for local areas, but can be affected by changes to benefit rules. ILO unemployment: the standard international measure, which includes everyone looking for and available for work, whether or not they are claiming Jobseeker s Allowance. This is measured using surveys; data for constituencies and local authorities have a time lag and are subject to more sampling variation. There were 1.17 million men unemployed in March-May 2014, down 95,000 from the previous quarter. 956,000 women were unemployed, down 25,000 from the previous quarter. 817,000 young people aged were unemployed in March-May 2014, down 64,000 from the previous quarter and down 141,000 from the previous year. The unemployment rate for this age group is 17.8% down from 20.9% last year. 1 The latest labour market release is available from the ONS website. This section is based on data from this release and local labour market statistics from NOMIS. Data in this section are seasonally adjusted. 2 Figures for claimants aged 18+ are seasonally adjusted to remove the effects of changes to the claimant count that tend to happen every year. JSA data for constituencies later in this paper are not seasonally adjusted. Section 2 looks at patterns and trends in the non-seasonally adjusted constituency data. 3 The JSA claimant count excludes a small number of new jobseekers who are claiming Universal Credit rather than Jobseeker s Allowance. Further details are given in section 4. 4 Much of the data in this section, such as ILO unemployment and employment, are based on estimates from the Labour Force Survey (LFS). As these are liable to sampling variability, small changes in the figures should be interpreted with caution as they may be a result of sampling error. More information on sampling variability is available from table A11 of the labour market statistical section of the ONS website. 1
6 RESEARCH PAPER 14/40 749,000 people had been unemployed for longer than 12 months at March-May 2014, a fall of 57,000 from the previous quarter and 166,000 lower than a year earlier. 415,000 people had been unemployed for longer than two years, 15,000 fewer than the previous quarter and 59,000 lower than a year ago. On a country and regional basis the unemployment rate was highest in the North East (9.6%) and lowest in the South East (4.4%) in March-May The unemployment rate decreased over the year in all regions. The largest annual percentage falls in unemployment were in the West Midlands (down 2.4% points) and the East Midlands (down 2.0% points). However, note regional unemployment estimates are more volatile than for the UK. Employment million people were in employment in March-May Total unemployed Long term unemployment Millions, UK, seasonally adjusted ILO definition of unemployment Unemployed for at least 12 months Unemployment by country and region March-May 2014 ILO unemployment rates North East Yorkshire and The Humber West Midlands London North West Scotland Northern Ireland Wales United Kingdom East Midlands East of England South West South East 5.0% 4.4% 5.6% 5.4% 7.3% 7.3% 6.9% 6.7% 6.6% 6.5% 7.9% 7.4% 9.6% 0% 2% 4% 6% 8% 10% 12% Employment was up 254,000 from the previous quarter and 929,000 more people were in employment than a year ago. This is the largest annual increase since comparable records began in Employment, annual change to March-May 2014 Thousands +929 The employment rate (the proportion of the population aged in work) was 73.1% in +164 March-May 2014 and is now higher than its pre-recession peak of 73.0% in March-May It was All people Men Women up 0.5% points from the previous quarter and 1.7% points from the previous year Full time Part time The female employment rate was 68.1% in March-May The male employment rate was 78.1%. The number of men in employment increased by 121,000 over the past quarter and 527,000 over the past year, to million in March-May The number of women in employment was million, 133,000 more than in the previous quarter and 402,000 more than in the same period last year. 2
7 RESEARCH PAPER 14/ million people were working full-time in March-May 2014, up 231,000 on the previous quarter and 765,000 more than a year earlier. The number of people working part-time was 8.20 million, up 24,000 on the previous quarter and 164,000 more than a year ago million people were working in parttime jobs because they could not find a full-time job, down 61,000 on the previous quarter and 86,000 from the same period last year million people were self-employed in March-May 2014, an increase of 78,000 on the previous quarter and 404,000 on the same period last year. The number of people working as employees was up 190,000 on the previous quarter and up 552,000 on the previous year, at million. Inactivity The number of people aged who are economically inactive (not in work and not looking for work) was 8.78 million in March-May 2014, down 67,000 from the previous quarter and down 258,000 compared to the previous year. The proportion of the population aged who were inactive (the inactivity rate) was 21.7%. This equals the troughs of late 1989 and early 1990, when the inactivity rate was at its lowest point since comparable records began in The inactivity rate for men was 16.2%, unchanged compared to the previous quarter and 0.6% points lower than the previous year. The inactivity rate for women was 27.2% in March-May 2014, the lowest rate since comparable records began in million men aged were inactive, about the same as in the previous quarter. The number of women aged who were inactive was down 72,000 at 5.51 million. Vacancies There were 648,000 job vacancies in the three months to June 2014, 30,000 more than in the previous quarter and 117,000 higher than a year ago. This is the highest number of vacancies in the economy since the three months to June Earnings Average weekly total pay in Great Britain rose by 0.3% in March-May 2014 compared with the same period the year before. Real average weekly earnings Regular pay (excluding bonuses) was up May 2014 prices, adjusted for CPI inflation 0.7%. The Consumer Price Index increased by 1.5% between May 2013 and May Average weekly total pay in the private sector increased by 0.2% over this period. In the public sector total pay rose by 0.6%. Regular pay (excluding bonuses) rose by 0.9% in the private sector and by 0.6% in the public sector Including bonuses Excluding bonuses
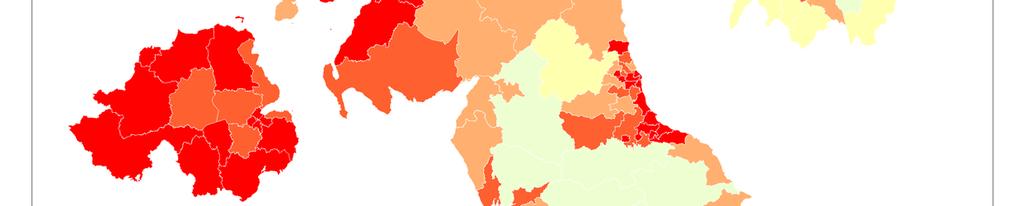
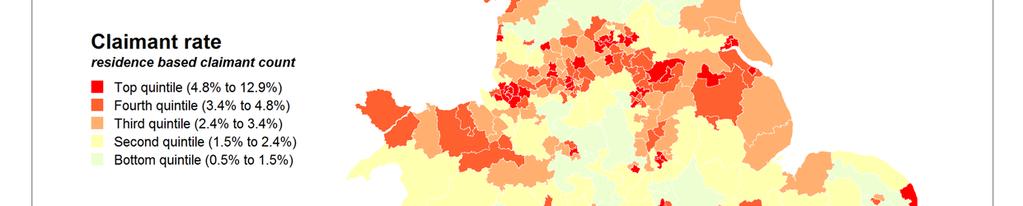
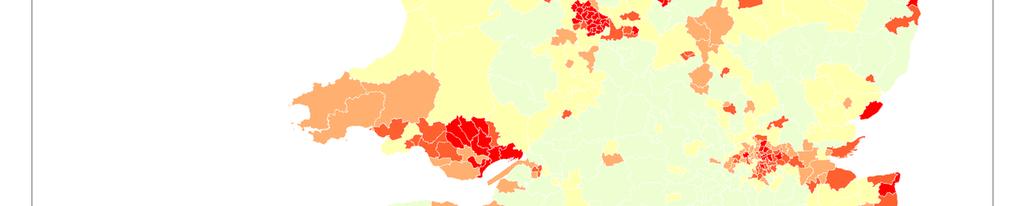
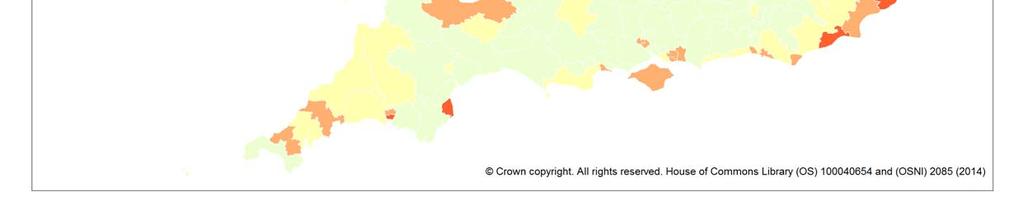
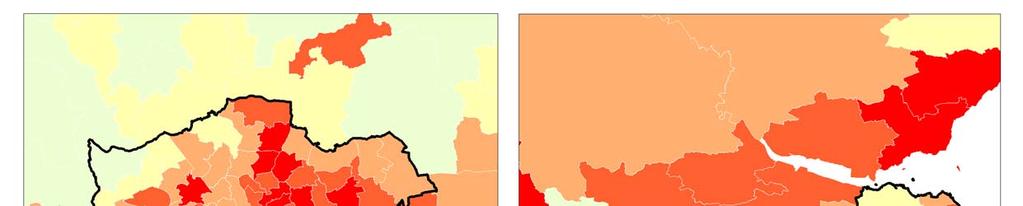
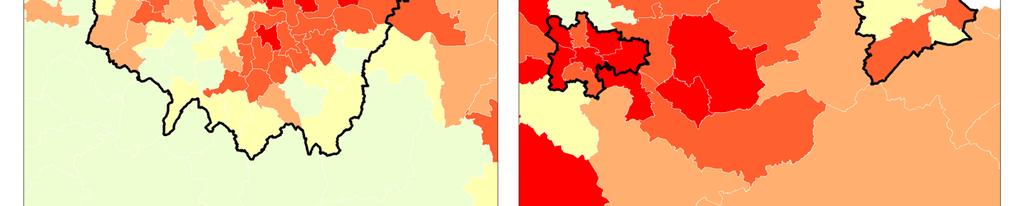
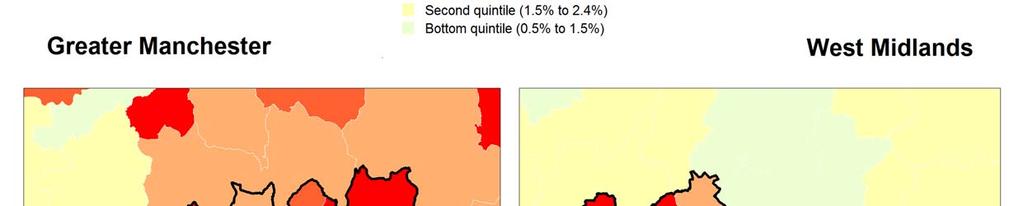
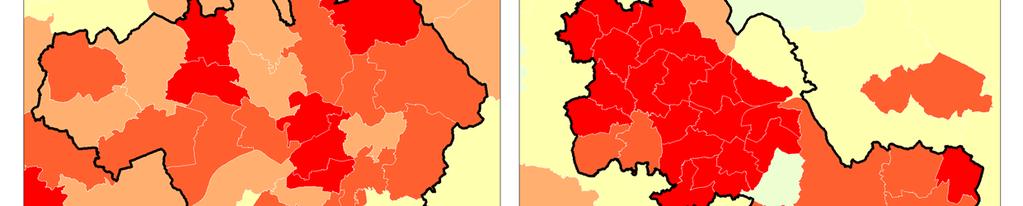
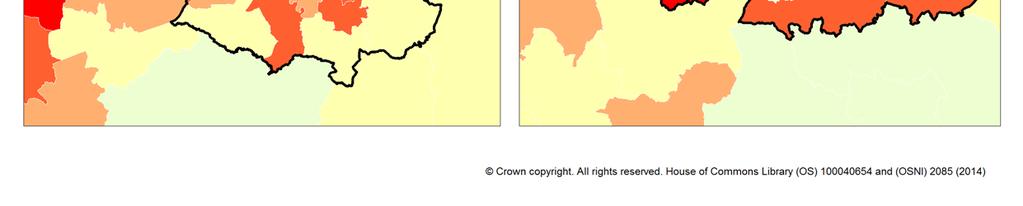
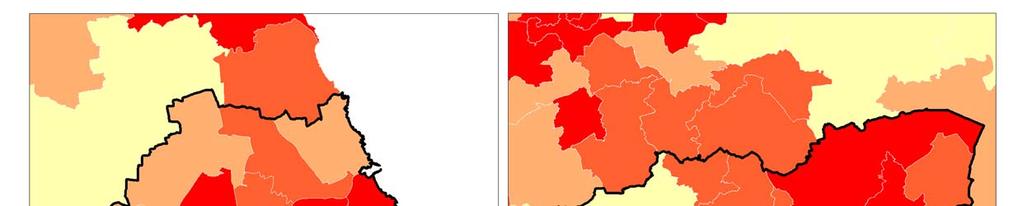
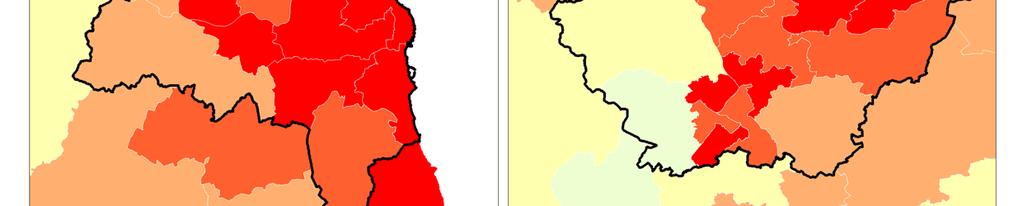
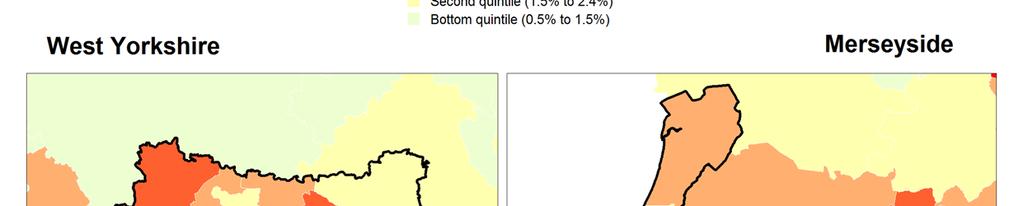
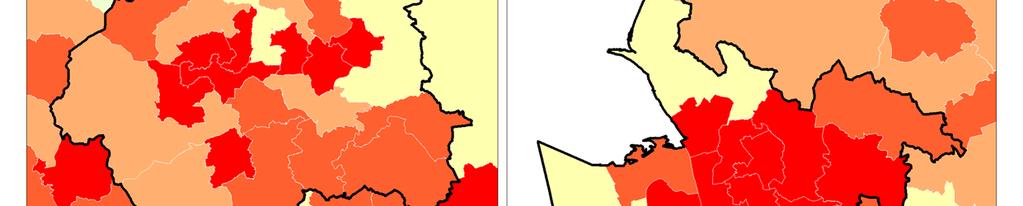
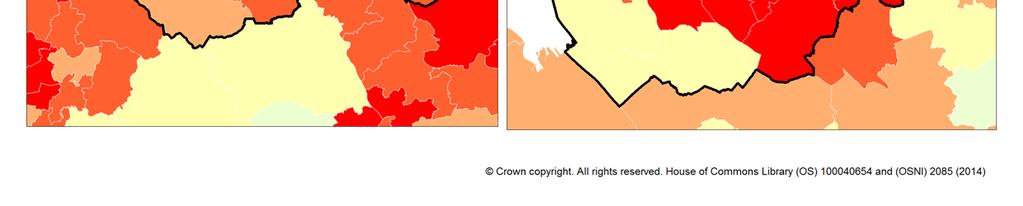
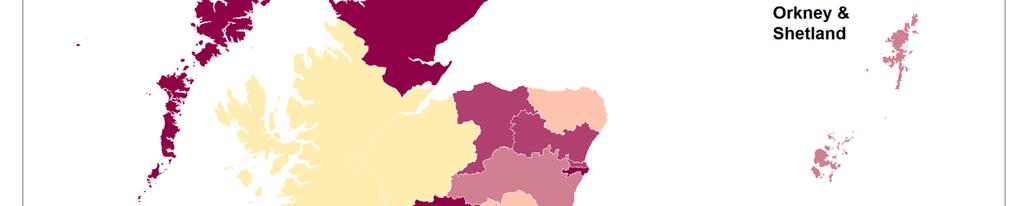
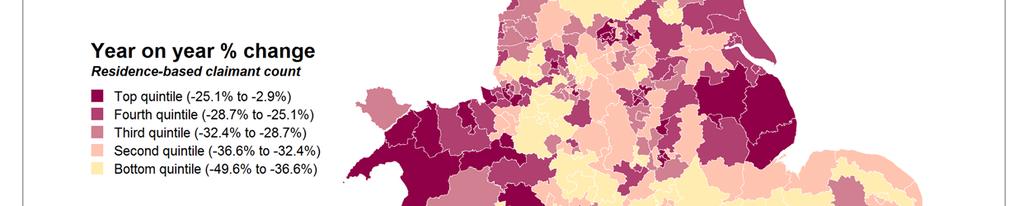
8 RESEARCH PAPER 14/40 2 Analysis and maps of the JSA claimant count by constituency Statistics on Jobseeker s Allowance (JSA) claimants are released monthly for each constituency. Unlike the national figures shown earlier in the paper, these figures are not seasonally adjusted and so reflect changes to the claimant count that tend to happen every year. On a non-seasonally adjusted basis, the number of people in the UK claiming Jobseeker s Allowance in June 2014 was 1.02 million, down 69,700 from the previous month. National data taking seasonal factors into account show that the claimant count fell by 36,300 between May and June, to 1.04 million. 5 The table in Section 3 shows figures for each constituency on this non-seasonally adjusted basis, along with figures for countries and regions (at the end of the table). Rises and falls for constituencies Over the last year, between June 2013 and June 2014, the claimant count decreased in all constituencies. Over the month to June 2014, the claimant count decreased in 648 constituencies and increased in two constituencies Dundee West and Dundee East. Universal Credit The claimant count figures presented in this paper do not include people claiming Universal Credit. From April 2013, single unemployed people without children attending certain jobcentres are claiming Universal Credit rather than JSA. Section 4.3 lists the Jobcentres affected, along with the date Universal Credit was rolled out in each area. The table below shows Universal Credit claimants by constituency. In total, 5,880 people were claiming Universal Credit at 30 April This will include people who continue to receive Universal Credit having entered employment. Universal Credit claimants by constituency at 30 April 2014 Constituency Caseload Constituency Caseload Oldham West and Royton 880 St Helens North 40 Ashton-under-Lyne 790 Ross, Skye and Lochaber 30 Wigan 710 Harrogate and Knaresborough 40 Oldham East and Saddleworth 660 North East Somerset 30 Warrington North 590 West Lancashire 20 Warrington South 530 Kensington 10 Makerfield 480 Leigh 10 Inverness, Nairn, Badenoch and Strathspey 300 Weaver Vale 10 Hammersmith 210 Halton 10 Rugby 180 Bolton West 10 Denton and Reddish 110 Manchester Central 10 Stalybridge and Hyde 70 Alyn and Deeside 10 Bath 70 Other 100 Figures are rounded to the nearest ten. Source: DWP, Universal Credit - experimental official statistics to April Figures on the number of claimants of Jobseeker s Allowance are affected by changes to benefit rules see Section 4.3 of a discussion of recent changes, which affect (a) lone parents; (b) long-term claimants (especially young people) and (c) some new jobseekers who are receiving Universal Credit rather than Jobseeker s Allowance. 4
9

10

11

12
13 RESEARCH PAPER 14/40 Highest and lowest claimant rates The tables show the constituencies ranking highest and lowest in terms of the claimant rate and claimant numbers. Claimant rate Number of claimants Claimant rate Number of claimants 1 Foyle 12.9% Birmingham, Ladywood 7,102 2 Birmingham, Ladywood 12.4% Leeds Central 5,653 3 Belfast West 11.9% Foyle 5,608 4 Birmingham, Hodge Hill 11.7% Birmingham, Hodge Hill 5,224 5 Belfast North 11.1% Belfast North 4,910 6 Bradford West 9.9% Bradford West 4,591 7 Middlesbrough 9.5% Belfast West 4,542 8 Bradford East 8.7% Tottenham 4,410 9 Wolverhampton South East 8.7% Bradford East 4, Nottingham North 8.6% Nottingham East 4,135 : : : : : 641 North Dorset 0.8% Derbyshire Dales South Cambridgeshire 0.8% West Dorset Stratford-on-Avon 0.8% Gordon Kenilworth and Southam 0.7% North East Hampshire Westmorland and Lonsdale 0.7% Henley Henley 0.7% Stratford-on-Avon Mid Sussex 0.7% Kenilworth and Southam North East Hampshire 0.7% Westmorland and Lonsdale Gordon 0.6% West Aberdeenshire and Kincardine West Aberdeenshire and Kincardine 0.5% Orkney and Shetland 210 Claimant rate is calculated as the number of claimants divided by the estimated economically active population aged Claimants aged Number Number 1 Birmingham, Hodge Hill 1, Birmingham, Ladywood 2,915 2 Foyle 1, Foyle 2,020 3 Birmingham, Ladywood 1, Leeds Central 1,985 4 Leeds Central 1, Birmingham, Hodge Hill 1,975 5 Bradford West 1, Bradford West 1,730 6 Belfast North 1, Belfast North 1,725 7 Belfast West 1, Belfast West 1,690 8 Nottingham North 1, Birmingham, Perry Barr 1,625 9 Sheffield, Brightside and Hillsborough 1, Bradford East 1, Bradford East 1, Middlesbrough 1,530 : : : : : : 641 Wokingham =639 North Dorset 65 =641 Mid Sussex =639 Kenilworth and Southam 65 =641 North East Hampshire South West Devon West Aberdeenshire and Kincardine =643 West Dorset Na h-eileanan An Iar =643 North East Hampshire 60 =645 Orkney and Shetland =643 Gordon 60 =645 Henley Orkney and Shetland Kenilworth and Southam =647 Stratford-on-Avon 45 =648 Westmorland and Lonsdale =647 West Aberdeenshire and Kincardine Harrogate and Knaresborough Westmorland and Lonsdale 40 Figures for claimants aged and claims of duration are rounded to the nearest five. East Devon also had 65 claimants of duration 9
14 Aberavon W 1, % Aberconwy W % Aberdeen North S 1, % Aberdeen South S % Airdrie and Shotts S 2, % Aldershot E % Aldridge-Brownhills E 1, % Altrincham and Sale West E % Alyn and Deeside W 1, % Amber Valley E 1, % Angus S 1, % Arfon W 1, % Argyll and Bute S 1, % Arundel and South Downs E % Ashfield E 1, % Ashford E 1, % Ashton-under-Lyne E 1,479-1, % Aylesbury E % Ayr, Carrick and Cumnock S 2, % Banbury E % Banff and Buchan S % Barking E 3,024-1, % Barnsley Central E 1, % Barnsley East E 1,844-1, % Barrow and Furness E 1, % Basildon and Billericay E 1, % Basingstoke E % Bassetlaw E 1, % Bath E % Batley and Spen E 2,155-1, % Battersea E 1, % Beaconsfield E % Beckenham E % Bedford E 2, % Belfast East N 2, %
15 Belfast North N 4, % 5 1, , Belfast South N 2, % Belfast West N 4, % 3 1, , Bermondsey and Old Southwark E 3,109-1, % , Berwickshire, Roxburgh and Selkirk S 1, % Berwick-upon-Tweed E % Bethnal Green and Bow E 3,387-1, % , Beverley and Holderness E 1, % Bexhill and Battle E % Bexleyheath and Crayford E 1, % Birkenhead E 2, % Birmingham, Edgbaston E 3, % , Birmingham, Erdington E 3,802-1, % , Birmingham, Hall Green E 3,899-1, % , Birmingham, Hodge Hill E 5,224-1, % 4 1, , Birmingham, Ladywood E 7,102-1, % 2 1, , , Birmingham, Northfield E 2,983-1, % , Birmingham, Perry Barr E 4,040-1, % , Birmingham, Selly Oak E 2, % Birmingham, Yardley E 3,096-1, % , Bishop Auckland E 1, % Blackburn E 2, % Blackley and Broughton E 3,388-1, % , Blackpool North and Cleveleys E 1, % Blackpool South E 2, % Blaenau Gwent W 2, % Blaydon E 1, % Blyth Valley E 1, % Bognor Regis and Littlehampton E % Bolsover E 1, % Bolton North East E 2, % Bolton South East E 2, % Bolton West E 1, % Bootle E 3,211-1, % , Boston and Skegness E 1, %
16 Bosworth E % Bournemouth East E 1, % Bournemouth West E 1, % Bracknell E % Bradford East E 4,285-1, % 8 1, , Bradford South E 2, % , Bradford West E 4,591-1, % 6 1, , Braintree E % Brecon and Radnorshire W % Brent Central E 4,096-1, % , Brent North E 1, % Brentford and Isleworth E 1, % Brentwood and Ongar E % Bridgend W 1, % Bridgwater and West Somerset E 1, % Brigg and Goole E 1, % Brighton, Kemptown E 1, % Brighton, Pavilion E 1, % Bristol East E 1, % Bristol North West E 1, % Bristol South E 1, % Bristol West E 2, % Broadland E % Bromley and Chislehurst E 1, % Bromsgrove E % Broxbourne E 1, % Broxtowe E 1, % Buckingham E % Burnley E 1, % Burton E 1, % Bury North E 1, % Bury South E 1, % Bury St Edmunds E % Caerphilly W 2, % Caithness, Sutherland and Easter Ross S %
17 Calder Valley E 1, % Camberwell and Peckham E 3,689-1, % , Camborne and Redruth E 1, % Cambridge E % Cannock Chase E 1, % Canterbury E % Cardiff Central W 2, % Cardiff North W 1, % Cardiff South and Penarth W 2, % Cardiff West W 2, % Carlisle E 1, % Carmarthen East and Dinefwr W % Carmarthen West and South Pembrokeshire W 1, % Carshalton and Wallington E 1, % Castle Point E % Central Ayrshire S 2, % Central Devon E % Central Suffolk and North Ipswich E % Ceredigion W % Charnwood E % Chatham and Aylesford E 1, % Cheadle E % Chelmsford E 1, % Chelsea and Fulham E 1, % Cheltenham E 1, % Chesham and Amersham E % Chesterfield E 1, % Chichester E % Chingford and Woodford Green E 1, % Chippenham E % Chipping Barnet E 1, % Chorley E 1, % Christchurch E % Cities of London and Westminster E 1, % City of Chester E %
18 City of Durham E 1, % Clacton E 1, % Cleethorpes E 1, % Clwyd South W 1, % Clwyd West W 1, % Coatbridge, Chryston and Bellshill S 2, % Colchester E 1, % Colne Valley E 1, % Congleton E % Copeland E 1, % Corby E 1,614-1, % Coventry North East E 2,894-1, % Coventry North West E 1, % Coventry South E 2, % Crawley E 1, % Crewe and Nantwich E 1, % Croydon Central E 1,871-1, % Croydon North E 3,194-1, % Croydon South E 1, % Cumbernauld, Kilsyth and Kirkintilloch East S 1, % Cynon Valley W 1, % Dagenham and Rainham E 2,102-1, % Darlington E 2, % Dartford E 1, % Daventry E % Delyn W 1, % Denton and Reddish E 1, % Derby North E 1, % Derby South E 3,206-1, % , Derbyshire Dales E % Devizes E % Dewsbury E 2, % Don Valley E 1, % Doncaster Central E 3,019-1, % Doncaster North E 2, %
19 Dover E 1, % Dudley North E 2, % Dudley South E 1, % Dulwich and West Norwood E 2,648-1, % , Dumfries and Galloway S 1, % Dumfriesshire, Clydesdale and Tweeddale S 1, % Dundee East S 1, % Dundee West S 2, % Dunfermline and West Fife S 1, % Dwyfor Meirionnydd W % Ealing Central and Acton E 2, % Ealing North E 2, % Ealing, Southall E 1, % Easington E 1,951-1, % East Antrim N 2, % East Devon E % East Dunbartonshire S % East Ham E 2,996-1, % East Hampshire E % East Kilbride, Strathaven and Lesmahagow S 1, % East Londonderry N 2, % East Lothian S 1, % East Renfrewshire S % East Surrey E % East Worthing and Shoreham E % East Yorkshire E 1, % Eastbourne E 1, % Eastleigh E % Eddisbury E % Edinburgh East S 1, % Edinburgh North and Leith S 2, % Edinburgh South S % Edinburgh South West S 1, % Edinburgh West S 1, % Edmonton E 3,180-1, % ,
20 Ellesmere Port and Neston E 1, % Elmet and Rothwell E % Eltham E 1, % Enfield North E 2, % Enfield, Southgate E 1, % Epping Forest E 1, % Epsom and Ewell E % Erewash E 1, % Erith and Thamesmead E 2,163-1, % Esher and Walton E % Exeter E 1, % Falkirk S 2, % Fareham E % Faversham and Mid Kent E % Feltham and Heston E 1, % Fermanagh & South Tyrone N 2, % Filton and Bradley Stoke E % Finchley and Golders Green E 1, % Folkestone and Hythe E 1, % Forest of Dean E % Foyle N 5, % 1 1, , Fylde E % Gainsborough E 1, % Garston and Halewood E 2, % Gateshead E 2, % Gedling E 1, % Gillingham and Rainham E 1, % Glasgow Central S 2, % Glasgow East S 2, % Glasgow North S 1, % Glasgow North East S 3, % , Glasgow North West S 2, % Glasgow South S 2, % Glasgow South West S 2, % Glenrothes S 2,170-1, %
21 Gloucester E 2, % Gordon S % Gosport E % Gower W % Grantham and Stamford E 1, % Gravesham E 1, % Great Grimsby E 3,215-1, % , Great Yarmouth E 2,183-1, % Greenwich and Woolwich E 2, % Guildford E % Hackney North and Stoke Newington E 3,240-1, % , Hackney South and Shoreditch E 3,557-1, % , Halesowen and Rowley Regis E 1, % Halifax E 2,969-1, % , Haltemprice and Howden E % Halton E 1, % Hammersmith E 2,599-1, % Hampstead and Kilburn E 2, % Harborough E % Harlow E 1, % Harrogate and Knaresborough E % Harrow East E 1, % Harrow West E 1, % Hartlepool E 3,045-1, % , Harwich and North Essex E % Hastings and Rye E 1,971-1, % Havant E 1, % Hayes and Harlington E 1, % Hazel Grove E % Hemel Hempstead E 1, % Hemsworth E 1, % Hendon E 1, % Henley E % Hereford and South Herefordshire E % Hertford and Stortford E %
22 Hertsmere E % Hexham E % Heywood and Middleton E 1,857-1, % High Peak E % Hitchin and Harpenden E % Holborn and St Pancras E 2, % Hornchurch and Upminster E 1, % Hornsey and Wood Green E 2, % Horsham E % Houghton and Sunderland South E 1, % Hove E 1, % Huddersfield E 2,609-1, % Huntingdon E % Hyndburn E 1, % Ilford North E 1, % Ilford South E 2,460-1, % Inverclyde S 1, % Inverness, Nairn, Badenoch and Strathspey S % Ipswich E 2, % Isle of Wight E 1,755-1, % Islington North E 2, % Islington South and Finsbury E 2, % Islwyn W 1, % Jarrow E 2, % Keighley E 1, % Kenilworth and Southam E % Kensington E 1, % Kettering E 1, % Kilmarnock and Loudoun S 2, % Kingston and Surbiton E 1, % Kingston upon Hull East E 3,317-1, % , Kingston upon Hull North E 3,594-1, % , Kingston upon Hull West and Hessle E 3,453-1, % , Kingswood E % Kirkcaldy and Cowdenbeath S 2,587-1, %
23 Knowsley E 2,779-1, % Lagan Valley N 1, % Lanark and Hamilton East S 1, % Lancaster and Fleetwood E % Leeds Central E 5,653-1, % 12 1, , Leeds East E 3,491-1, % , Leeds North East E 1, % Leeds North West E 1, % Leeds West E 3,026-1, % , Leicester East E 2,240-1, % Leicester South E 2,933-1, % , Leicester West E 2,705-1, % Leigh E 2, % Lewes E % Lewisham East E 2, % Lewisham West and Penge E 2, % Lewisham, Deptford E 2,849-1, % Leyton and Wanstead E 2, % Lichfield E % Lincoln E 2, % Linlithgow and East Falkirk S 2, % Liverpool, Riverside E 3, % , Liverpool, Walton E 3,553-1, % , Liverpool, Wavertree E 2,880-1, % Liverpool, West Derby E 2, % Livingston S 1, % Llanelli W 1, % Loughborough E % Louth and Horncastle E 1, % Ludlow E % Luton North E 1, % Luton South E 2, % Macclesfield E % Maidenhead E % Maidstone and The Weald E %
24 Makerfield E 1,234-1, % Maldon E % Manchester Central E 3,842-1, % , Manchester, Gorton E 3,029-1, % Manchester, Withington E 1, % Mansfield E 2, % Meon Valley E % Meriden E 2, % Merthyr Tydfil and Rhymney W 2, % Mid Bedfordshire E % Mid Derbyshire E % Mid Dorset and North Poole E % Mid Norfolk E % Mid Sussex E % Mid Ulster N 2, % Mid Worcestershire E % Middlesbrough E 3,915-1, % , Middlesbrough South and East Cleveland E 2,077-1, % Midlothian S 1, % Milton Keynes North E 1, % Milton Keynes South E 1, % Mitcham and Morden E 1, % Mole Valley E % Monmouth W % Montgomeryshire W % Moray S % Morecambe and Lunesdale E 1, % Morley and Outwood E 1, % Motherwell and Wishaw S 2, % Na h-eileanan An Iar S % Neath W 1, % New Forest East E % New Forest West E % Newark E % Newbury E %
PQ Local Authorities with exceedances of NO 2 annual mean limit value (based on 2015
 PQ 47949 - Local Authorities with exceedances of NO 2 annual mean limit value (based on 2015 compliance assessment) Local Authorities with exceedances of NO 2 annual mean limit value (based on 2015 compliance
Electorate statistics 2009
 Electorate statistics 2009 Standard Note: SN/SG/5423 Last updated: 1 April 2010 Author: Edmund Tetteh Social and General Statistics This Note provides data on the number of electors and attainers in each
School improvement monitoring and brokering grant provisional allocations for illustrative purposes
 School improvement monitoring and brokering grant provisional allocations for illustrative purposes The school improvement monitoring and brokering grant was announced on 30 November 2016. This grant of
Council Performance Ratings 2010
 Council Performance Ratings 2010 Tameside Metropolitan Borough Council North West 4 - Performs excellently Wandsworth Borough Council London 4 - Performs excellently City of Westminster Council London
Census data for the new parliamentary constituencies in England & Wales: Summary and overview
 Census data for the new parliamentary constituencies in England & Wales Summary and overview Research Paper 95/94-I (Part 1 of 2 vols.) 21 August 1995 This paper, in two volumes, summarises the results
Annex 3: CCGs confirmed for waves 1, 2, 3 and 4 for authorisation
 Annex 3: s confirmed for waves 1, 2, 3 and 4 for authorisation Below is a list of the clinical commissioning groups (s) which will be put forward for authorisation in wave 1, split by Commissioning Board
Winners of the Exemplar Awards 2016
 Winners of the Exemplar Awards 2016 Winner of the Exemplar Award 2016 Leeds City Council Winner of the Peer Award 2016 David Lloyd, Huntingdonshire District Council Data Quality & Performance Awards 2016
Council Tax since
 27 December 2015 Council Tax since 1996-97 Since 2010, central government has offered grants to local authorities to freeze or cut Council Tax. Additionally, local authorities wishing to Council Tax by
S31 Grant determination for a high needs strategic planning fund in : DCLG ref 31/2916
 S31 Grant determination for a high needs strategic planning fund in 2016-17: DCLG ref 31/2916 Purpose of the fund Local authorities can use this fund to carry out a strategic review of their high needs
Workless households for areas across the UK in 2010
 Workless households for areas across the UK in 2010 Coverage: UK Date: 08 September 2011 Geographical Area: Local Authority County Theme: Labour Market Animated YouTube Video A short video podcast explaining
NHS South Warwickshire CCG
 1 West Midlands South Worcestershire, Redditch, Bromsgrove & Wyre Forest (Fast Track with 2 & 3) NHS Redditch and Bromsgrove Worcestershire West Midlands NHS South Worcestershire NHS Wyre Forest 2 West
England screening uptake rates
 England screening uptake rates The average screening uptake rate in England is 58% In some cases it is as low as 33% 44% of s in England are below the national average Seven out of ten of the worst areas
Planned Expenditure by Local Authorities: Services for Young People
 Planned Expenditure by Local Authorities: Services for Young People Section 251 Under Section 251 of the Apprenticeships, Skills, Children and Learning Act 2009, local authorities are required to submit
Most regions saw price falls during 2012
 www.nationwide.co.uk/hpi Embargoed until 0700 Thurs 3 Jan 2013 Most regions saw price falls during 2012 11 out of 13 UK regions saw annual price falls during 2012 London best performing region in 2012
Technical specification: BS 4449:2005 GRADE B500B BAR AND COIL
 BS 4449:2005 GRADE B500B BAR AND COIL DIAMETER SIZE EXTRA* COIL EXTRA* 8 mm 40.00 15.00 10 mm 25.00 15.00 12 mm 20.00 15.00 Base price + the following extras per size and/or format (coil) 16 mm - 15.00
House prices fall in most regions during the third quarter
 www.nationwide.co.uk/hpi Q3 2010 Embargoed until 0700 Thurs 30 Sep 2010 House prices fall in most regions during the third quarter House prices fell in nine out of thirteen UK regions in the third quarter
Healthwatch is the independent champion for people who use health and social care services.
 B R I E F I N G State of Support Local Healthwatch Funding 2017/18 30 November 2017 Overview Healthwatch is the independent champion for people who use health and social care services. Across the country
Q Embargoed until March 2010
 www.nationwide.co.uk/hpi Embargoed until 0700 30 March 2010 London mini-boom leads UK price growth UK house prices increased by 1.6% quarter-on-quarter in Q1 London saw the strongest growth in the quarter
STAMP IDENTIFICATION NUMBERS
 STAMP IDENTIFICATION NUMBERS DEPARTMENT OF TRADE AND INDUSTRY WEIGHTS AND MEASURES (PRESCRIBED STAMP) REGULATIONS 1968 LIST OF IDENTIFICATION NUMBERS National Weights and Measures Laboratory Stanton Avenue
Independent Age estimates - Pension Credit *ONS population data (2017) **Using DWP data (2016/17)
 **Using DWP data (2016/17)") Independent Age estimates - Pension Credit *ONS population data (2017) **Using DWP data (2016/17) Constituency Total 75+* Number of 75+ households eligible for Pension Credit that are not claming** Aberavon
Independent Age estimates - Pension Credit *ONS population data (2017) **Using DWP data (2016/17) Constituency Total 75+* Number of 75+ households eligible for Pension Credit that are not claming** Aberavon
Table 1. Employment loss across parliamentary constituencies in Great Britain due to a 'no deal' Brexit
 Table 1. loss across parliamentary constituencies in Great Britain due to a 'no deal' Brexit Workplace-basis workers workers who live elsewhere Residence-basis residents who work elsewhere residents workers
UCAS main scheme applications,
 UCAS main scheme applications, 2011-12 Notes on the data The main scheme relates to applications before June 30 each year (so principally excludes applications through clearing). Individuals can submit
Numbers achieving 3 A grades in specific A-Level combinations by school type and LEA
 Numbers achieving 3 A grades in specific A-Level combinations by school type and LEA Statistics Report Series No. 9 Joanne L. Emery February 2009 Research Division Statistics Group Assessment, Research
For information. The information in this circular does not affect the content of the HB Guidance Manual.
 Housing Benefit Circular Department for Work and Pensions Caxton House, Tothill Street, London SW1H 9NA HB S5/2014 SUBSIDY CIRCULAR WHO SHOULD READ Housing Benefit managers and staff. Officers preparing
Table 1 - For full-time employee jobs a : United Kingdom, 2018
 United Kingdom K02000001 2,916 14.7 Great Britain K03000001 2,803 14.6 Key Statistical robustness England and Wales K04000001 2,608 14.9 CV
House prices in London continue to climb
 www.nationwide.co.uk/hpi Q2 2014 Embargoed until 0700 Wed 2 Jul 2014 House prices in London continue to climb All UK regions saw annual price rises in Q2 2014 London continues to lead, with annual price
Child Trust Fund: Accounts opened by Westminster Parliamentary Constituencies
 Westminster Parliamentary Constituencies opened England Aldershot 5,219 4,266 953 81.7% Aldridge-Brownhills 2,825 2,167 658 76.7% Altrincham and Sale West 3,901 3,109 792 79.7% Amber Valley 3,386 2,693
Actions to save bees by constituency
 Actions to save bees by constituency The list below shows how many actions to save bees have been taken in each UK constituency as part of the Bee Cause campaign. If the figure s high about 80 or more
Oriel 2018 (2019intake) Hospital and Health Board Employers
 Hospital and Health Board Employers") Oriel 2018 (2019intake) Hospital and Health Board Employers Employer Name ABERTAWE BRO MORGANNWG UNIVERSITY HEALTH BOARD AINTREE UNIVERSITY HOSPITAL NHS FOUNDATION TRUST AIREDALE NHS FOUNDATION TRUST ALDER
Oriel 2018 (2019intake) Hospital and Health Board Employers Employer Name ABERTAWE BRO MORGANNWG UNIVERSITY HEALTH BOARD AINTREE UNIVERSITY HOSPITAL NHS FOUNDATION TRUST AIREDALE NHS FOUNDATION TRUST ALDER
Research Note th June Council liabilities
 Research Note 136 26th June 2014 Council liabilities Public sector debt is forecast by the Office for Budgetary Responsibility to exceed 1.3 trillion in 2014-15. 1 However, as explained by previous TaxPayers
CCG Annual Assessment 2017/18
 Annual Assessment 2017/18 annual assessment 2017/18 Publications Gateway reference number: 08247 Version number: 3.0 First published: 12 July 2018 Prepared by: NHS England Assessment Team Classification:
Dear Louise. I can confirm that the full list of approved sites for this study is:
 From: TOTENHOFER, Ashley (HEALTH RESEARCH AUTHORITY) Sent: 28 June 2018 13:06 To: SAVIC, Louise (LEEDS TEACHING HOSPITALS NHS TRUST) Subject: RE: DALES 232512 Dear Louise I can confirm that the full list
BBC Local Democracy Reporter allocation
 BBC Local Democracy Reporter allocation Map shows distribution of reporters by BBC Nation and Region see page two, Table B for detail Page The distribution of reporters in Northern Ireland will be undertaken
Child Trust Fund: Accounts opened by Westminster Parliamentary Constituencies
 ENGLAND Aldershot 5,865 4,487 1,378 76.5% Aldridge-Brownhills 3,141 2,231 910 71.0% Altrincham and Sale West 4,094 3,073 1,021 75.1% Amber Valley 3,767 2,832 935 75.2% Arundel and South Downs 3,415 2,685
#element of bullying / harassment South West 2gether NHS FT Mental Health Small
 1 South West 2gether NHS FT Mental Health Small 3 2 0 3 0 Aintree University Hospital NHS FT Yorks and Humber Airedale NHS FT Combined Acute and Community Small 28 0 8 7 1 North West Alder Hey Children's
The Will of the People?
 The Will of the People? Changing attitudes towards Brexit People s Vote 1 Contents 2 Foreword 5 Labour-held seats 19 In the battleground seats The choice: free trade or restricted immigration Support for
Transitions into and out of unpaid care
 Transitions into and out of unpaid care Constituency statistics The carer population is not static it is changing all the time. New analysis by Michael Hirst 1, published in Carers UK s report Need to
Quarterly Statistics for New Businesses
 Quarterly Statistics for New Businesses 2006 Scottish Business Statistics Business Start-up Statistics are produced quarterly by The Committee of Scottish Clearing Bankers (CSCB), which incorporates Bank
EMPIRE. Bromley Clydebank Newcastle Sunderland ODEON UK & IRELAND
 CINEWORLD ABERDEEN UNION SQUARE ALDERSHOT ASHFORD ASHTON-UNDER-LYNE BEDFORD BEXLEYHEATH BIRMINGHAM BROAD STREET BOLDON BOLTON BRADFORD BRAINTREE BRIGHTON BRISTOL BURTON-ON-TRENT CARDIFF CASTLEFORD CHELTENHAM
No 68 GENERAL ELECTION RESULTS, 1 MAY 1997 CONTENTS
 No 68 GENERAL ELECTION RESULTS, 1 MAY 1997 This paper presents some analyses of voting in the general election held on 1 May 1997. It is based on the definitive results which are published in Britain Votes
Compilation of child poverty local indicators, update to September 2017
 Compilation of child poverty local indicators, update to September 2017 Laura Valadez-Martinez and Donald Hirsch, Centre for Research in Social Policy, Loughborough University Where child poverty is highest
Census Briefing Paper One. Housing Tenure Structure in England (2001)
") 1 Census Briefing Paper One Housing Tenure Structure in England (2001) Summary The aim of this briefing paper is to provide an accessible summary of information from the 2001 census. The main objective
1 Census Briefing Paper One Housing Tenure Structure in England (2001) Summary The aim of this briefing paper is to provide an accessible summary of information from the 2001 census. The main objective
2016-BASED HOUSEHOLD PROJECTIONS
 2016-BASED HOUSEHOLD PROJECTIONS PLANNING DESIGN ENVIRONMENT PEGASUSGROUP.CO.UK ECONOMICS 2016-BASED HOUSEHOLD PROJECTIONS The Office for National Statistics (ONS) released its 2016-household projections
Electoral Statistics 2012
 Electoral Statistics 2012 Standard Note: SN/SG/6258 Last updated: 10 July 2013 Author: Aliyah Dar Section Social and General Statistics This note provides data on electorates of parliamentary constituencies
Supplementary information for Parliamentary Questions UIN : VOA Closures and UIN : VOA Staff. 15 December 2017
 Supplementary information for Parliamentary Questions UIN 117327: VOA Closures and UIN 117328: VOA Staff 15 December 2017 Notes about this release All dates shown in the attached pack are provisional and
Quarterly Statistics for New Businesses
 Quarterly Statistics for New Businesses 2007 Scottish Business Statistics Business Start-up Statistics are produced quarterly by The Committee of Scottish Clearing Bankers (CSCB), which incorporates Bank
Strategic Estate Advisers Contact Details
 Strategic Estate Advisers Midlands & East of CCG Basildon & Brentwood Ian Greggor i.greggor@communityhealthpartnerships.co.uk Bedfordshire Anthony Smith anthony.smith@property.nhs.uk Birmingham Cross City
Happiness is a town called Harrogate destination named happiest place to live for THIRD year running
 Rightmove plc 3 rd & 4 th Floor 33 Soho Square London W1D 3QU Under embargo until 00.01 Thursday 6 th August Happiness is a town called Harrogate destination named happiest place to live for THIRD year
Census 2011: City snapshot
 Census Snapshot September 2012 Census 2011: snapshot Rachel Smith, September 2012 On 16 July 2012 the first outputs from the Census 2011 for England and Wales were released, followed on 19 September 2012
Suitability of the subsurface for infiltration SuDS in Great Britain
 The British Geological Survey Suitability of the subsurface for in Great Britain Infiltration Drainage Ground stability Groundwater protection What are? Infiltration SuDS are sustainable drainage systems
Local Authority Parking Finances in England
 Local Authority Parking Finances in England 1. Introduction Local authorities are required to submit details of their finances to the Department of Communities and Local Government (DCLG, now the Ministry
2018 TOWN HALL RICH LIST. Theo Hutchinson April 2018
 2018 TOWN HALL RICH LIST Theo Hutchinson April 2018 For the eleventh comprehensive list of local authority employees in the United Kingdom whose total annual 6-17 financial year, the most recent full year
Specialised perinatal community team that meets Perinatal Quality Network Standards Type 1
 7 DATA UK Health Teams (Provision in 7) Specialised perinatal community team that meets Perinatal Quality Network Standards Type http://bit.ly/jouvad http://bit.ly/ahavex More than in women develop a mental
City employment: An overview from the Business Register & Employment Survey (BRES)
") employment September 2012 employment: An overview from the Business Register & Employment Survey (BRES) Rachel Smith, September 2012 On 28 September, the latest employment estimates for 2011, taken from
employment September 2012 employment: An overview from the Business Register & Employment Survey (BRES) Rachel Smith, September 2012 On 28 September, the latest employment estimates for 2011, taken from
00: Not for broadcast or publication before 00:01 Hrs Monday 20th June 2011
 Press Release Embargoed until: 00:01 20.06.11 Not for broadcast or publication before 00:01 Hrs Monday 20th June 2011 This is the Halifax review of economic and price performance at a local level. The
Contact your MSP about Scotland s Climate Change Plan
 Contact your MSP about Scotland s Climate Change Plan Nearly everyone in Scotland has an MSP on one of the four s responsible for reviewing Scotland s draft Climate Change Plan To find which of your is
*** STRICTLY EMBARGOED UNTIL 7.00AM THURSDAY 2 APRIL 2009 *** Price falls across all regions in Q1 2009
 Price falls across all regions in 2009 Northern Ireland sees first moderation in price falls in two years Scotland saw prices fall sharply during but still the most resilient market Wales sees biggest
Brexit Shift AuguSt
 Brexit Shift August www.bestforbritain.org www.hopenothate.org.uk 14 August Major new analysis shows over half of UK constituencies now support staying in the EU n Ground-breaking research by Best for
Unemployment by Constituency, February 2000
 15 MARCH 2000 Unemployment by Constituency, February 2000 This paper shows the number of unemployed claimants recorded as resident in each constituency in the United Kingdom in February 2000, with comparisons
356,500 people commuted to jobs in the City of London. 40 per cent from inner London, 29 per cent from outer London, 31 per cent from outside London
 CIS 2014-11 Commuting in London July 2014 The 2011 Census recorded the place of work and method of travel to work of all respondents aged 16 or over. The Special Workplace Statistics dataset provides information
RSN Economic Profiling Service
 RSN Economic Profiling Service Introduction The RSN has developed an economic profiling service for its members. Information will be provided based on the indicators and to the frequency set out in the
IMPORTANT. Anyway, here is the list of the sections of routes on which passes may be used: 007 Deal Canterbury Bluewater Eltham Eltham VCS
 Whilst passes are not valid on most of the National Express network, on certain sections which have been registered as "local routes", they may be used for free travel. IMPORTANT Free passes are accepted
Virgin Media Street Works Contact List
 Civils Engineering, and Contact List Civils Engineering, & Virgin Media Street Works Contact List Senior Contact Virgin Media Address Phone / Fax Email Statutory, Regulatory & Standards (Street works Legislative
Area1 Area Code Cut-off Date In Bank Date Area North East Essex. 28th 14th Mid Essex South East Essex
 North East Essex 5PW Mid Essex 5PX West Essex 5PV 28th 14th Mid Essex South East Essex 5P1 South West Essex 5PY Somerset 5QL 27th 15th Somerset York 5NV 27th 15th North Yorkshire and Humber Rotherham 5H8
75,402 sq ft. 88,866 sq ft NOTTINGHAM. panattoni park CONSTRUCTION UNDER. Two industrial/warehouse units TO LET AVAILABLE Q3 2018
 panattoni park Two industrial/warehouse units 88,866 sq ft TO LET AVAILABLE Q3 2018 75,402 sq ft TO LET AVAILABLE Q4 2018 /J26 UNDER CONSTRUCTION INDICATIVE IMAGE www.pp.com panattoni park NG16 NN7 4DE
Universal Credit national expansion
 Universal Credit national expansion Following the successful roll out of Universal Credit in the north-west of England, the Department for Work and Pensions (DWP) can provide details of the first tranche
CHAPLAINCY COSTS SURVEY, ENGLAND
 CHAPLAINCY COSTS SURVEY, ENGLAND APRIL 2009 Mental Health & Care Trusts, NHS & Foundation Trusts & Primary Care Trusts Trust Salaries per annum ( )* Staff - Whole time Equivalent 2gether NHS Foundation
 Inverness LOCH NESS CALEDONIAN LOCH OICH LOCH LOCHY WATERWAY MAP Key SCALE 0 50 kilometres Fort William Managed by British Waterways 0 10 20 30 miles Managed by British Waterways Scotland Perth Dundee
Amber Valley Bexley Breckland Blackpool UA Blackpool UA Barrow-in-Furness Blackburn with Darwen. Blackburn with Darwen Basildon
 Less than or equal to 0.4% Band D equivalent growth Year 1 (2011-12) Year 2 (2012-13) Year 3 (2013-14) Year 4 (2014-15) Year 5 (2015-16) Year 6 (2016-17) Adur Allerdale Barrow-in-Furness Adur Adur Adur
Regional Volunteer registration form
 Regional Volunteer registration form Please clearly complete all sections of this form, sign the agreement and return it along with a passport-sized photograph to: War Memorials Trust, 1 st Floor, 14 Buckingham
Scotland's Employment by Industry and Geography
 SPICe Briefing Pàipear-ullachaidh SPICe Scotland's Employment by Industry and Geography Alison O'Connor This paper provides an overview of employment in Scotland by industry sector and geography. Topics
The local elections of
 The local elections of 17 MAY 99 6 May 1999 This paper provides a brief summary of the local elections which took place in most parts of Great Britain on 6 May 1999. In the interest of producing the paper
NHS Retirement Fellowship
 NHS Retirement Fellowship Reg. Charity No: 287936 THE CHARITY The NHS Retirement Fellowship is a charity registered with the Charity Commission for England and Wales. FOUNDER PRESIDENT The Founder President
Hackney asking rents increase by two thirds in 10 years
 Q1 (January March 2018) Under embargo for 00:01 hours, Wednesday 28 th March 2018 Hackney asking rents increase by two thirds in 10 years Over the past decade the cost of renting a two-bed home in Hackney
Happy and healthy Hart tops 2012 Quality of Life Survey
 NOT FOR BROADCAST OR PUBLICATION BEFORE 00.01HRS Saturday 22 nd December 2012 The seventh annual Halifax Quality of Life Survey tracks where living standards are highest in the United Kingdom by ranking
Three in a row for Hart as it hangs on to title of best place to live
 NOT FOR BROADCAST OR PUBLICATION BEFORE 00.01HRS 21 DECEMBER 2013 The eighth annual Halifax Quality of Life Survey tracks where living standards are highest in the United Kingdom by ranking local performance
Initial proposals for new Parliamentary constituency boundaries in London
 Initial proposals for new Parliamentary constituency boundaries in London Contents Summary 3 1 What is the Boundary Commission for England? 5 2 Background to the 2018 Review 7 3 Initial proposals for London
Local Authority to Jobcentre Plus District
 Local Authority to Jobcentre Plus District Local Authority Aberdeen City Aberdeenshire Adur Allerdale Amber Valley Angus Argyll and Bute Arun Ashfield Ashford Aylesbury Vale Babergh Barking and Dagenham
Living Rents. 4th quartile earnings. Local Authority
 Local Authority 4th quartile earnings 1 bed Living Rents 2 bed 3 bed United Kingdom 251.80 70.50 91.66 112.81 Great Britain 253.00 70.84 92.09 113.34 England and Wales 252.90 70.81 92.06 England 253.60
Graduates and Regional Productivity. Graham Gudgin Regional Forecasts Ltd
 Graduates and Regional Productivity Graham Gudgin Regional Forecasts Ltd Extensive Literature in Economics linking Education and productivity: Private returns to Education Cross-Country Studies Private
Patterns of housing wealth inequality in Wales, Scotland and Northern Ireland
 Briefings No Appendix August 1 Housing Wealth and Household Welfare BRIEFINGS Patterns of housing wealth inequality in Wales, Scotland and Northern Ireland Appendix This appendix provides additional tables
Levy-supported starts (May 2017 to April 2018) Local Authority District
 Local Authority District") Number of levy-supported apprenticeship starts by local authority district since the introduction of apprenticeship levy (May 2017 - April 2018 provisional) Local Authority District Levy-supported starts
Number of levy-supported apprenticeship starts by local authority district since the introduction of apprenticeship levy (May 2017 - April 2018 provisional) Local Authority District Levy-supported starts
The local elections of 4 May Research Paper 95/ May 1995
 The local elections of 4 May 1995 Research Paper 95/59 10 May 1995 This paper provides a brief summary of the local elections which took place in most of England and Wales on 4 May 1995. It also summarises
Unemployment by Constituency July 1995
 Unemployment by Constituency July 1995 Research Paper 95/93 16 August 1995 Official unemployment rates for parliamentary constituencies only exist for those few constituencies which are self-contained
SUPPLEMENTARY INFORMATION: REGIONAL AND POLITICAL PARTY SUMMARIES. Liveable Lives Research Team
 Acting on Equalities: Are Local Authorities in England Meeting the Duties of the Equality Act 2010 and Addressing Sexual Orientation & Gender Identity? SUPPLEMENTARY INFORMATION: REGIONAL AND POLITICAL
Census 2011 Constituency results: United Kingdom
 Census 2011 Constituency results: United Kingdom 26 February 2014 This paper presents 2011 Census summary data for the 650 parliamentary constituency areas in the UK. It covers key census statistics for
Unemployment by Constituency May 1995
 Unemployment by Constituency May 1995 Research Paper 95/75 14 June 1995 Official unemployment rates for parliamentary constituencies only exist for those few constituencies which are self-contained labour
Business bailiff instructions
 Local authority Residential/consumer bailiff instructions Residential properties Business bailiff instructions Business properties Authority Type % of residential properties % of business properties Adur
CLUB WITH (CLUBS WITH * HAVE BEEN APPROVED BY UKA WHO HAVE MORE THAN 5 CLUBS FOR GEOGRAPHIC REASONS) CITY OF PLYMOUTH, PLYMOUTH HARRIERS, TAVISTOCK AC
 CITY OF PLYMOUTH, PLYMOUTH HARRIERS, TAVISTOCK AC") WITH (S WITH * HAVE BEEN APPROVED BY UKA WHO HAVE MORE THAN 5 S FOR ANDOVER & OVERTON ANDOVER OVERTON ERN ATHLETICS, WESSEX TRK & FIELD, HAMPSHIRE SPORTS HALL & ERN COUNTIES VETS TRK & FIELD ARMADA ATHLETICS
WITH (S WITH * HAVE BEEN APPROVED BY UKA WHO HAVE MORE THAN 5 S FOR ANDOVER & OVERTON ANDOVER OVERTON ERN ATHLETICS, WESSEX TRK & FIELD, HAMPSHIRE SPORTS HALL & ERN COUNTIES VETS TRK & FIELD ARMADA ATHLETICS
Club With (Clubs with * have been approved by UKA who have more than 5 clubs for geographic reasons) Andover AC Overton Harriers South East
 Andover AC Overton Harriers South East") Alnwick / Blyth Alnwick Blyth Running North North East Youth Development Andover & Overton Andover Overton East SAL, Wessex Track & Field, Hampshire Sports Hall & ern Counties Vets Track & Field Armada
Alnwick / Blyth Alnwick Blyth Running North North East Youth Development Andover & Overton Andover Overton East SAL, Wessex Track & Field, Hampshire Sports Hall & ern Counties Vets Track & Field Armada
business register and employment survey ONS Crown Copyright Reserved [from Nomis on 15 February 2011]
![business register and employment survey ONS Crown Copyright Reserved [from Nomis on 15 February 2011]](/thumbs/89/100799196.jpg "business register and employment survey ONS Crown Copyright Reserved [from Nomis on 15 February 2011]") business register and employment survey ONS Crown Copyright Reserved [from Nomis on 15 February 2011] date 2009 "TSA: Tourism Industries" industry Full-time employees Part-time employees Area Employees
business register and employment survey ONS Crown Copyright Reserved [from Nomis on 15 February 2011] date 2009 "TSA: Tourism Industries" industry Full-time employees Part-time employees Area Employees
Location Phone number Address. ABERYSTWYTH /38 Great Darkgate Street Aberystwyth
 Location Phone number Address ABERYSTWYTH 01970 611194 36/38 Great Darkgate Street Aberystwyth Ceredigion Wales, SY23 1DE ANDOVER 01264 323652 62 High Street Andover Hampshire England, SP10 1NG AYLESBURY
Embargoed until 16/04/2012
 NOT FOR BROADCAST OR PUBLICATION BEFORE 00.01 HRS Monday 16 th April 2012 The Halifax Key Worker Housing Review tracks housing affordability for five groups of public sector workers: nurses, teachers,
Swine Flu Weekly Vaccine Uptake 2009/10 - Frontline HCWs (Primary Care Organisations) Week 4 w/e 31/01/2010 For organisations under HPA
 Week 4 w/e 31/01/2010 For organisations under HPA") Swine Flu Weekly Vaccine Uptake 2009/10 - Frontline HCWs (Primary Care Organisations) Week 4 w/e 31/01/2010 For organisations under HPA Trust Code Trust Name SHA Org Code SHA Name Swine Flu Vaccination
Swine Flu Weekly Vaccine Uptake 2009/10 - Frontline HCWs (Primary Care Organisations) Week 4 w/e 31/01/2010 For organisations under HPA Trust Code Trust Name SHA Org Code SHA Name Swine Flu Vaccination
Compilation of child poverty local indicators, update to December 2015
 Loughborough University Institutional Repository Compilation of child poverty local indicators, update to December 2015 This item was submitted to Loughborough University's Institutional Repository by
Research Report England Repossession Hotspots 2010/11
 Research Report England Repossession Hotspots From the Shelter policy library June 2011 www.shelter.org.uk 2011 Shelter. All rights reserved. This document is only for your personal, non-commercial use.
Identifying Pro-Growth Locations in England. May 2018
 Identifying Pro-Growth Locations in England May 2018 About Turley Turley is a national planning and development consultancy which, since being founded in 1983, has established a strong reputation for providing
Identifying Pro-Growth Locations in England. June 2018
 Identifying Pro-Growth Locations in England June 2018 About Turley Turley is a national planning and development consultancy which, since being founded in 1983, has established a strong reputation for
Regional Spread of Inbound Tourism
 Regional Spread of Inbound Tourism Foresight issue 164 VisitBritain Research, January 2019 1 Contents Introduction Summary Key metrics by UK area Analysis by UK area Summary of growth by UK area Scotland
HARPER DENNIS HOBBS LAUNCH BRITAIN S FIRST EVER VITALITY RANKINGS
 7 th October 2014 HARPER DENNIS HOBBS LAUNCH BRITAIN S FIRST EVER VITALITY RANKINGS Retail specialist Harper Dennis Hobbs, have devised a unique ranking of the top 500 British retail centres, which scores