BUSINESS BAROMETER. Annual report Credit: Robby Whiitfield
|
|
|
- Lewis Bond
- 5 years ago
- Views:
Transcription


1 BUSINESS BAROMETER Annual report 2018 Credit: Robby Whiitfield


2 Contents Foreword..3 Introduction Key findings...5 Monthly performance summary Visit Kent update National context...10 Visitor Attractions: Annual performance Serviced Accommodation: Annual performance..18 Self-catering Accommodation: Annual snapshot Visitor Information Centres: Annual performance..23 Conferences and Events: Annual performance..25 Cross-channels carriers: Annual performance...27 BREXIT- Business sentiment Other news: Glossary..33 References

3 Foreword We are delighted to present the full year results of the 2018 Visit Kent Business Barometer. Although overall results are positive, the results show that in a year which ranged from The Beast from the East to a Tropical Heatwave, the impact on our visitor economy was mixed. Not surprisingly our coastal resorts performed well in the Summer but that meant that many of our larger attractions lost business as visitors took advantage of the sunshine. The early, and extremely cold, Easter was also challenging for many in a year that will be remembered for its extremes. Our accommodation occupancy saw modest growth and ensuring that we continue to expand the availability of good quality accommodation in the county will be a key priority for Visit Kent as we seek to increase the number of overnight stays. Whilst 2018 may have been a year of sunshine and blizzards, it was clear that love was also in the air as weddings increased by a whopping 11% - and it wasn't even a leap year! My thanks to all our businesses who contribute to the monthly Business Barometer. This data is vital in supporting our work to promote the county and in giving a timely snapshot of the visitor economy s performance in Kent. It will also be particularly valuable in monitoring any potential impact of BREXIT and there will be additional questions in this year's barometer to track business performance over the coming months which we will feed directly to local and central Government. We want as many businesses as possible to contribute to this valuable exercise so please make sure that you keep the information coming. Congratulations to all our businesses on another successful year - we look forward to supporting you in the months ahead. Deirdre Wells OBE Chief Executive Visit Kent 3


4 Introduction We all know how important it is for organisations and destinations to be able to access timely information on the performance of the visitor economy and the factors that may influence it, either positively or negatively. This is what the Business Barometer sets out to do offering a monthly snapshot of the industry s performance, based on the feedback received from a range of tourism businesses including, visitor attractions, visitor information centres, conference and event venues, cross-channel carriers and serviced accommodation providers. For the majority of businesses, data is collected through the use of a short online survey, sent out on a monthly basis, with questions centred on visitor footfall for that particular month and for the same month the previous year. This allows for direct like-for-like comparisons to be made and to ensure the results are based on a reliable and robust sample. For serviced accommodation providers, data is provided by hotel benchmarking company STR Global, who were also awarded the contract to provide serviced accommodation data by VisitEngland. In using this method it allows accommodation data to feed into national level studies such as the England occupancy survey, consequently allowing the monthly business barometer figures to be accurately benchmarked against national level figures. This report aims to summarise findings from 2018, looking at the performance of tourism businesses and giving a snapshot of Kent s visitor economy in comparison to Alongside this, the report will also look to benchmark against national level figures. We are always actively working to increase the sample of businesses that contribute to the barometer and we would really encourage tourism businesses that do not currently take part to sign-up, as the barometer has proven to be a valuable and timely benchmarking tool, with results having been previously used to support strategic plans and planning and funding applications. 4
5 5


6 Monthly performance: Visitor Attractions -6.6% Reduced opening times compared to January % Snowy weather +4.0% Good weather and popular bank holiday weekend -6.9% Due to the hot weather visitors opted to visit the beach instead of attractions +4.8% Increased marketing and PR activity +8.2% Increased attendance at events and membership visits Jan March May July Sep Nov 2018 Feb April June Aug Oct Dec +9.5% Popular half term offer and an increase in membership visits -15.7% Change in dates of Easter, Kent Big Weekend and May bank holiday +5.3% Good weather and popular events -11.2% A decrease in offers and promotions available -5.3% Partial closures and a decrease in the number of group visits +0.9% Popular Christmas offering and an increase in school groups 6


7 Visit Kent Update: Digital & PR o In 2018, a new content strategy was introduced to all of the Visit Kent digital channels. This strategy has seen a more focused approach to content creation, which has included advanced planning and a regularly updated stream of thematic content, with three to four new features written and promoted on the website each month and shared across the social media channels. o Each feature was an opportunity to highlight and cross-promote a range of partners, as investors were invited to submit their content for inclusion in the themed features. Digital and PR o Overall the new strategy saw great success, with the new features section of the website rapidly growing to account for nearly 10% of all page views in the final quarter of In addition to this, a change in the content shared on the Visit Kent social media channels to focus more on promoting the features resulted in excellent engagement, with good growth across all three channels. o Our PR work and resulting coverage for the year reached over 20 million people, and we continued to receive fantastic feedback from the national and international press on the quality of service. o We sent out 21 press releases in 2018 and hosted over 25 press visits to Kent resulting in coverage and relationship building with key publications such as the Sunday Telegraph, Decanter, the I Newspaper and National Geographic. o We attended several national and international media events throughout 2018, working closely with VisitEngland on their large press campaigns and continued to build on the relationships Visit Kent has formed with several influential bloggers and vloggers. 7


8 Visit Kent Update: Digital statistics Website 1,139,397 sessions 1.38 average dwell time 196,436 average pages viewed per month Digital stats 45,977 followers +10% Social Media 20,260 followers +25% 15,573 followers +27% 8


9 Visit Kent Update: Travel Trade o Whilst most partners reported 2018 as a very successful year on numbers from the travel trade, certain markets began to shift in the build up to Brexit and as a result of the growth of terrorism. International student travellers via travel trade became less willing to travel due to safety, whilst VisitBritain reported that the perception of Britain began to show signs of dropping in the international rankings. International long-haul markets have grown considerably this year, with visitors from as far as China and South America being more willing to travel outside of London to experience new products. o The is partly helped by the continued work on the Discover England Fund projects which aim to position destinations and products outside of London as more accessible to international visitors. We are thrilled that our destination continues to be featured in several of these projects. o The travel trade continues to seek out bespoke, memorable experiences as part of itineraries, rather than standard visits and guided tours. They are looking for ways to enhance the visitor experience. With the rise of social media and the online presence of holidays and leisure, the more bespoke and exclusive experiences are selling well. o In 2018, the team attended 15 trade shows across Europe and North America and our team are now looking to develop a brand new travel trade strategy for with an even more enhanced and proactive approach towards trade which will shortly be shared with partners. Vakantiebeurs UKinbound Conference Coach Tourism Association Conference Explore GB ITB Berlin Group Travel Business Forum Tourism Symposium UKinbound Summer Ball RDA Workshop, Cologne UKinbound Discover Kent event UKinbound Autumn General Meeting Destination Britain North America + Boston educational operator sales mission Eurotunnel showcase event Global European Marketplace World Travel Market Travel Trade 9


10 National context o This section of the report will aim to look at the key national level trends for 2018 from both VisitEngland and VisitBritain. It should also be noted that at the time of writing this report, the following data is the most recent data available and some of the totals for 2018 may be provisional. Domestic visitors o Looking at the volume of domestic day trips to England in 2018, the latest results show that visits decreased by -5% to 1.4 billion compared to However, although the volume of day visits saw a reduction, the value of these visits increased by +4.0% to 53.0 billion compared to Looking at domestic overnight trips to England, year to November the number of holiday trips saw a -4.0% decrease versus the period the previous year 3. Inbound visitors o With regards to figures for inbound visitors to the UK, provisional figures for 2018 show that overall, the volume of inbound trips was down -4% compared to 2017 as a whole, with spend also seeing a -7% decrease 7. Attractions performance and optimism To establish the performance of attractions in particular, the following findings are taken from VisitEngland s Tourism Business Monitor which is designed to monitor the performance and confidence of tourism businesses and the factors which influence them 2. o In 2018, 56% of visitor attractions experienced an increase in footfall, with 27% seeing a reduction and 17% remaining the same 2. o Looking at factors that may have influenced performance, the uncertainty surrounding Brexit and exchange rates were raised by attractions. Alongside this, the very hot and poor weather was cited as a factor to have negatively impacted visitor footfall 4. o However, overall the summer weather did have a higher positive impact on business performance, with 39% of attractions reporting an increase for this period, compared to the 28% that reported a decrease in visitor footfall due to high temperatures 5. 10

11 National context Accommodation o According to the England Occupancy Survey (December 2018), December year to date room occupancy saw an average of 78% occupancy in 2018 and a +1% increase compared to figures seen in In addition, supply saw a +2.2% increase and demand a +4.8% increase compared to o Among domestic visitors, in 2018 as a whole compared to 2017, overnight trips to hotels saw the largest net increase, closely followed by caravan/camping 4. Business optimism for 2019 o The outlook among accommodation providers remains positive, with bookings for summer 2019 appearing stable, with 58% reporting the same booking levels as in However, although the latter remains positive, just under a quarter are reporting fewer bookings than in 2018 and overall there is currently a net decline in bookings 4. o With regards to business optimism for 2019, 53% of attractions stated they expect their performance to be better than in 2018, with only 8% expecting a decline. Although this presents a positive outlook, optimism is at a slightly lower level than seen in previous January waves inbound forecast o Looking at the coming year, VisitBritain's 2019 inbound forecast predicts an increase of +3.3% in overseas visitors and a +7.8% increase in spend to 24.9bn 6. o The forecast also highlights that in the first seven weeks of 2019, weak flight bookings from Europe have been observed, with flight bookings to the UK made through direct channels during this period being significantly down year-on-year. However, bookings from long-haul markets are in line with those seen a year earlier, but European bookings were down especially for arrival after March 29th 6. o The forecast also highlights that overall Brexit remains a key uncertainty for 2019, as currently there is little clarity on a settlement and the forecast assumes there will be no major travel disruptions. The ongoing value of the pound also remains an uncertainty, currently lower than its pre-referendum value and forecasted to be weak throughout the medium term 6. 11
12 Visitor Attractions 12
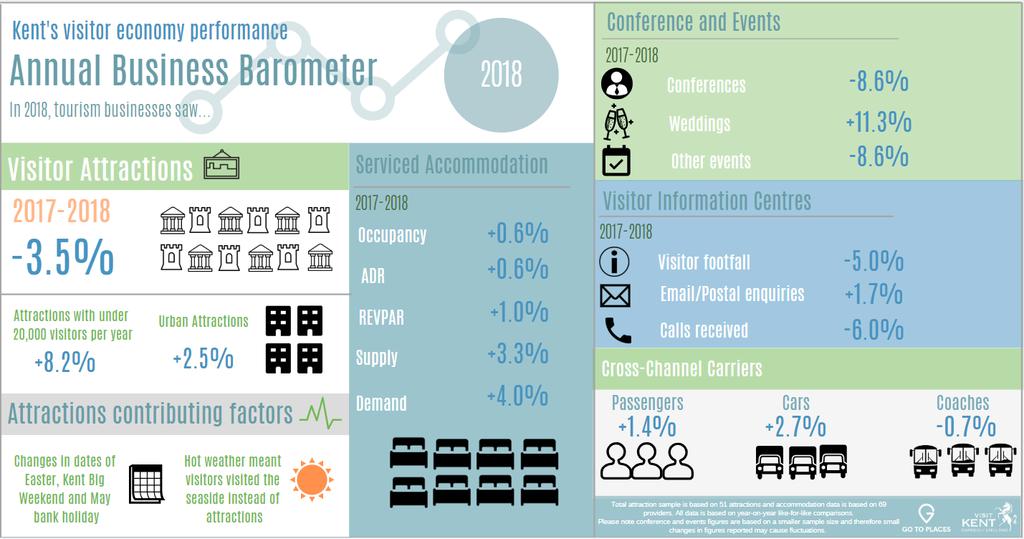
13 Visitor Attractions Visitor numbers 2017/ % change 6,042,419 5,828, % Range of performance 2017/2018 Attractions up Attractions down 49% 51% Contributing factors Popular half term offer and an increase in membership visits Good weather and popular events The hot weather meant people opted to visit the beach instead Changes in dates of Easter, Kent Big Weekend and May bank holiday Attraction visitor footfall 2017/2018 Jan Feb Mar Apr May Jun Jul Aug Sep Oct Nov Dec A popular Christmas offer and increase in school groups Decrease in the number of offers and promotions o Looking at 2018 as a whole, Kent attractions saw a -3.5% decrease in footfall, compared to Comparing these to the provisional national data, domestic day trips to England decreased by -5% with inbound visits to the UK s a decrease of -4%, mirroring the county s performance. o 49% of Kent attractions were up year-on-year, ranging from +0.1% up to % up, while 51% of attractions reported a reduced footfall, ranging from -0.3% down to -33.3% down. Figure 1. Graph showing the visitor footfall to Kent attractions in 2018 vs


.")
14 Visitor Attractions Performance according to cost 2017/2018 Charging Free to enter -4.4% +0.3% Performance according to attraction size per year 2017/ ,000 or less 20,001-50,000 50, ,000 Over 200, % -3.0% -3.0% -5.1% o Looking at the performance of attractions based on price, attractions that are charging reported a -4.4% decrease in visitor footfall compared to However, those attractions that are free to enter experienced a slight increase of +0.3% compared to figures seen in o Alongside price, the performance of attractions for 2018 was also looked at in terms of size. As seen in the table above, the majority of attractions experienced a decrease in footfall, particularly those with over 200,000 visitors per year (-5.1%). However, figures reported by smaller attractions (those with less than 20,000 visitors per year) saw an increase of +8.2% compared to o These results firstly show a preference towards free to enter attractions, perhaps due to the current economic climate and uncertainty. In addition, the positive performance seen from smaller attractions shows the popularity and interest in smaller, more unique hidden gems the county has to offer. Credit: Robby Whiitfield 14


 and museums and art galleries, which saw a +7.2% increase compared to 2017.")

15 Visitor Attractions Performance according to attraction type 2017/2018 o Looking at figures based on attraction type, results show that vineyards/wineries and breweries performed most positively, seeing a +51% increase in visitor footfall. This increase could be due to the positive weather experienced in the summer period, alongside a heightened visitor offer and the increased marketing and PR activity in 2018 as part of the Wine Garden of England project. Museums / Art Galleries Historic Houses / Castles Visitor/ Heritage Centres Gardens Vineyards/wineri es and breweries Wildlife attractions/ zoos/farms Leisure/theme parks Other o Other types of attractions that performed well included visitor/heritage centres (+8.7%) and museums and art galleries, which saw a +7.2% increase compared to o Looking at performance by attraction location, coastal and rural attractions both saw a decrease in visitor footfall compared to However, those attractions situated in urban areas experienced an increase in footfall of +2.5% compared to % -5.2% +8.7% -3.2% +51% -14.8% -26.1% +0.8% Performance according to attraction location 2017/2018 Urban Rural Coastal +2.5% -3.9% -10.5% 15
16 Visitor numbers: Year to date Month % change for month YTD Totals 2017 YTD Totals 2018 % change for YTD January 182, , % 182, , % February 277, , % 460, , % March 360, , % 820, , % April 732, , % 1,553,021 1,419, % May 616, , % 2,169,596 2,061, % June 597, , % 2,766,790 2,690, % July 729, , % 3,496,235 3,369, % August 947, , % 4,444,057 4,210, % September 490, , % 4,934,720 4,724, % October 519, , % 5,454,676 5,216, % November 251, , % 5,706,342 5,489, % December 336, , % 6,042,419 5,828, % 16

17 Visitor Attractions: Quarterly performance o Looking at performance on a quarterly basis, the start of year saw attractions experience a slight decrease in visitor footfall, compared to 2017, although February s figures were up +3.1% year to date. This performance was most predominantly due to the decrease in footfall due to the snowy weather in March. Moving to the second quarter, attractions also saw a decrease compared to 2017 figures, however this was largely due to the fact that in 2017 Easter and Kent Big Weekend fell in April, whereas this year these fell in March. o The third quarter of 2018 saw the biggest decrease in footfall, as visitors opted to visit beaches and seaside destinations rather than attractions. During July 2018, four of our top ten visited pages on our website were coastal destinations, while our top blogs included both Blue Flag and quirky beaches. This point supports the notion that although visitors may have opted to visit coastal areas rather than attractions, this may have incurred additional secondary spend benefiting other businesses such as, shops, cafes and restaurants. o Finally looking at the final quarter of 2018, attractions overall saw a minor decrease of -0.4% compared to 2017, with both November and December experiencing an increase in visitor footfall Quarterly performance 2017/2018 Quarter % change Q1 820, , % Q2 1,946,041 1,887, % Q3 2,167,930 2,034, % Q4 1,107,699 1,103, % Total 6,042,419 5,828, % Visitor attractions quarterly footfall 2017/2018 Q1 Q2 Q3 Q Figure 2: Graph showing the quarterly performance of Kent visitor attractions during 2018 compared to the same quarters in


18 Kent Accommodation PETER KOCIHA Photography 18
19 Serviced Accommodation o o According to figures from STR Global, for 69 larger and chain hotels, in 2018 Kent accommodation providers experienced an average occupancy of 76.1%, a slight increase of +0.6%, compared to figures seen in When comparing figures with those on a national level, Kent accommodation saw a slightly lower average occupancy, however the rate of growth was nearly on par. The highest increases in occupancy were observed in January and November, particularly at the start of the year with providers seeing an increase of +7.9% in occupancy levels compared to January Year on year room occupancy comparison (%) Kent /18 Occupancy 75.7% 76.1% +0.6% Monthly occupancy 2018 (%) Kent Jan 2018 Feb 2018 Mar 2018 Apr 2018 May 2018 June 2018 Occupancy 59.7% 68.4% 68.8% 75.1% 80.1% 81.7% July Aug Sep Oct Nov Dec Occupancy 86.8% 86.8% 82.6% 79.2% 74.6% 69.8% Serviced Accommodation occupancy (2017 vs. 2018) Figure 3. Graph showing the occupancy of serviced accommodation providers in Kent in 2018 vs
 Kent 2017 2018 17/18 ADR 59.93 60.29 +0.6% Year on year revenue per available room comparison (%) Kent 2017 2018 17/18 80.00 70.")
20 Serviced Accommodation o In 2018, the average daily rate saw a +0.6% increase, compared to figures recorded in 2017, while revenue per available room saw a slight increase of +1.0% compared to 2017 Year on year average daily rate comparison (%) Kent /18 ADR % Year on year revenue per available room comparison (%) Kent / Serviced Accommodation: Average daily rate 2017/2018 RevPAR % Figure 4. Graph showing the ADR of serviced accommodation providers in Kent in 2018 vs

21 Serviced Accommodation o Looking at the supply and demand for serviced accommodation providers in Kent, 2018 saw a monthly average supply of 279,175, seeing a +3.3% increase compared to o When looking at the level of demand for serviced accommodation, this also saw a healthy increase of +4.0%, when compared to Average monthly supply comparison (%) Kent /18 Supply 270, , % Average monthly demand comparison (%) Kent /18 Demand 204, , % Figure 5. Map showing the locations of serviced accommodation providers that contribute monthly to the Kent Business Barometer through STR Global Ltd. 21


22 Self-catering Accommodation Across 2018 as a whole, self-catering accommodation in Kent performed well, with all of the below providers seeing an increase in bookings compared to the previous year, which includes a total of over 450 properties and three camping and caravanning sites across Kent. The Camping and Caravanning Club were pleased to report that 2018 saw an 8% increase in touring pitch night sales at their three club sites in Kent versus figures seen in 2017 Mulberry Cottages were pleased to report that in 2018 Kent bookings saw an increase of +9.7% compared to 2017 In 2018, Kent and Sussex Cottages saw an increase of +1% in Kent bookings compared to The majority of guests stayed for an average of 7 nights. Bookings via affiliate partners increased by +75%, accounting for 22% of overall bookings, being +5% up compared to 2017 Image credit: Camping and Caravanning Club Image credit: Mulberry Cottages Image credit: Kent and Sussex Cottages Please note: With regards to reporting on self-catering accommodation occupancy figures, due to a change in sample and changes to national level reporting, we are currently reviewing the data collection process to get a better understanding of self-catering trends in the county. 22

23 Visitor Information Centres 23
24 Visitor Information Centres o In 2018, VICs experienced a -5.0% decrease in footfall compared to This reduction was particularly prominent throughout February, April and more recently in December, with factors cited to have influenced performance including reduced opening times and poor weather conditions. Outside of these periods, additional negative factors included a reduction in the number of group visits, alongside the impact of nearby visitor attraction being closed for maintenance. o However, VICs did experience an increase in visitor footfall during May, October and November. Factors cited to have positively influenced performance included good weather, relocation to a more accessible site and a strong half term offer from nearby visitor attractions. o The number of calls received saw a -6.0% decrease compared to 2017, however the number of /postal enquires received saw an increase of +1.7% compared to the previous year. Furthermore, an increase in enquires may illustrate a shift towards online communication, which may be a more convenient way to obtain necessary information compared to visiting VICs Footfall to Visitor Information Centres (2017 vs. 2018) o Overall, VICs performed well with regards to receiving and postal enquiries. However, the reduction in visitor numbers could be a direct effect of the decrease in attractions footfall nearby. Figure 6. Graph showing the visitor footfall to visitor information centres in Kent in 2018 vs.2017 VICs performance 2018/2017 Jan Feb Mar Apr May Jun July Aug Sep Oct Nov Dec ,764 42,212 53,142 64,718 75,091 75,546 83,738 94,364 69,892 63,539 46,778 48, ,817 47,213 53,413 74,853 74,902 83,543 90,451 98,128 72,150 61,029 43,765 57,789 % change -0.1% -10.6% -0.5% -13.5% +0.3% -9.6% -7.4% -3.8% -3.1% +4.1% +6.9% -16.0% +1.7% increase in /postal enquires 24

25 Business Tourism 25

26 Business Tourism o In 2018, the number of conferences saw a decrease of -8.6% when compared to o o The number of other events also experienced a decrease of -8.6%, when compared to figures seen in The number of weddings taking place in 2018 shows a +11.3% increase compared to the previous year. Performance according to event type, % change 2017/2018* Conferences Other events Weddings -8.6% -8.6% +11.3% Number of conferences (2017 vs. 2018) *Please note this figure is based on a smaller sample size and therefore small changes in figures reported may cause fluctuations Figure 7. Graph showing the number of conferences in Kent in 2018 vs

27 Cross-Channel Carriers 27

28 Cross-Channel Carriers Cross-Channel performance 2017/ % change Passengers 14,279,806 14,473, % +1.4% increase in passengers Cars 3,686,306 3,784, % Coaches 91,006 3,686, % o o Cross-channel carriers saw a +1.4% increase in the number of passengers in 2018 as a whole, compared to figures seen in In 2018, the number of coaches saw a decrease of -0.7% when compared to 2017, although the number of cars saw a healthy increase of +2.7% when compared Credit: s_pandya 28

29 BREXIT- Business Sentiment Our quarterly attraction surveys looked to capture business sentiment surrounding the potential impact of Brexit, highlighting top concerns and opportunities, the possible impact on domestic and inbound markets, as well as the effect on employment and staff retention. o Attractions were asked what impact they felt BREXIT would have on their business overall. The December survey results (Q4) show that over half of attractions (52%) thought there would be no impact, followed by 46% expressing they thought it may have a negative impact on their business. However, in terms of having a positive impact, only 2% of attractions felt this was the case. Top 5 concerns affecting future business performance o When comparing the above results with those from the previous quarterly survey (September Q3), the results show that the top three concerns remain unchanged. However, the number of attractions who selected poor transport network saw an increase, being now in the top five concerns. With regards to negative perceptions around ease of access, although still in the top five, this saw a decrease of - 7% compared to the results of the previous quarterly survey. Alongside this, more businesses generally indicated concerns, with the number of businesses that felt there were no real concerns decreasing by -9%. Negative perceptions around ease of access (35%) Poor transport network (38%) Strength of the pound/exchange rates (42%) Traffic disruptions (56%) UK economic climate (58%) Figure 8. Diagram showing attractions top five concerns affecting future performance due to Brexit 29
 of attractions felt that near European (France, Belgium, Netherlands and Germany) markets would be negatively affected.")


30 BREXIT- Business Sentiment o Attractions were also asked if they felt various markets would be negatively affected. As seen in figure 9, the Q4 results show that the majority (58%) of attractions felt that near European (France, Belgium, Netherlands and Germany) markets would be negatively affected. o In terms of Brexit s impact on employment and staff retention, Q4 results show that half of attractions were not sure what to expect (50%). 33% believed that BREXIT will have no impact on employment and 17% selected that it would, stressing their reliance on European staff members, both permanent and seasonal. In addition, the percentage of respondents who believe Brexit will impact employment has increased compared to the data collected in September (Q3). Do you feel any of the following markets will be negatively affected by BREXIT? o With regards to other comments from both quarterly surveys, in the September survey (Q3) attractions highlighted the possibility that Europeans markets may choose to travel elsewhere, however this will depend heavily on the strength of the pound and ease of access. Alongside this, possible delays at Calais and The Dover Port were cited by attractions. o Concerns surrounding potential traffic disruptions, particularly around ease of access via the Port of Dover were also voiced by attractions in the results of the December survey (Q4), alongside highlighting the issue surrounding the UK portraying a negative perception of welcome to overseas markets. o However, looking at potential opportunities, businesses stated that potential anti-british sentiment in Europe could possibly be outweighed by favourable exchange rates, resulting in an increase of inbound visitors to the UK. Lastly, attractions also cited that due to a potential period of economic uncertainly, domestic markets may look to spend less. In addition, uncertainties around anti-british sentiment in Europe and the strength of the pound, may result in an increase in UK domestic staycations. Potential anti- British sentiment and negative perception of welcome Favourable exchange rates Issues with ease of access and possible travel disruptions Figure 9. Diagram showing business sentiment on the affect of BREXIT on various markets Potential increase in UK domestic staycations 30

31 Other News 31


32 Other News Research sources This section provides information and links to other key and research resources from both Visit Kent and external organisations. Cambridge Economic Impact study The Cambridge Economic Impact Model is an industry respected tool for measuring the economic impact of tourism in a given area. Knowing the volume and value of tourism is an essential part of developing policies for managing tourism. The most recent reports based on 2017 figures are now available on our website here Latest England research reports VisitEngland s latest trends dashboard presents the latest results from surveys and research findings and is updated on a monthly basis with annual results from key reports. Key statistics include, domestic day visits, domestic overnights visits and latest inbound visitor statistics. This can be accessed here 32
33 Glossary VICs- Visitor Information Centres CTR- Click through rate AVE- Advertising Value Equivalent GTOs- Group Travel Organisers DMOs- Destination Management Organisations OP- On par ADR- Average Daily rate RevPAR- Revenue per available room YTD- Year to date 33
34 References 1 VisitEngland (2018) GB Day Visits 2018 December 2018 GB & England 2 VisitEngland (2018) England Occupancy Survey December 2018 Results 3 VisitEngland (2019) Latest England Research reports: Latest Trends dashboard 4 VisitEngland (2018) Tourism Business Monitor 2018 Wave 3 Post Christmas Full report 5 VisitEngland (2018) Tourism Business Monitor 2018 Wave 2 Post summer holidays Full report 6 VisitBritain (2019) 2019 inbound tourism forecast 7 VisitBritain (2019) Monthly Inbound Update December
35 Business Barometer Contacts If you would like to be part of the Business Barometer, or have any questions on its content, please contact Ruby Berkeley-Cornner- Previous reports To view our previous Business Barometer reports and other research resources please visit- Acknowledgements If you wish to use any figures or information contained within this report, please acknowledge the source as Visit Kent Annual Business Barometer, And finally thank you! We would like to thank all participants in the Kent Business Barometer. With your help we can provide key tourism intelligence to businesses in Kent, and have supporting data in lobbying for the county. If you are interested in taking part you be sign-up here 35
BUSINESS BAROMETER December 2018
 Credit: Chris Orange BUSINESS BAROMETER December Credit: Nigel Moore 1 Contents Summary of findings 3 Annual monthly performance: visitor attractions..4 Visit Herts Team update 5 National context.8 Visitor
Kent Business Barometer December 2018
 Kent Business Barometer December Q4 1 Contents BREXIT- Business sentiment 3 Summary of findings 4 Marketing update 5 Visitor Attractions: monthly performance 7 Visitor Attractions: quarterly performance
Kent Visitor Economy Barometer 2016
 Kent Visitor Economy Barometer 2016 In 2016 Kent s Tourism Businesses saw 2 Summary 2016 saw a strong performance for attractions, although fluctuations did occur from month to month. Accommodation providers
Hertfordshire Business Barometer September 2018
 Hertfordshire Business Barometer September 1 Contents Summary of findings 3 Marketing update 4 Visitor Attractions: monthly performance 6 Serviced Accommodation: monthly performance 10 Other news: national
Hertfordshire Business Barometer April 2018
 Hertfordshire Business Barometer April 1 Contents Summary of findings 3 Marketing update 4 Visitor Attractions: monthly performance 6 Serviced Accommodation: monthly performance 10 Other news: national
Hertfordshire Business Barometer July 2018
 Hertfordshire Business Barometer July 1 Contents Summary of findings 3 Marketing update 4 Visitor Attractions: monthly performance 6 Serviced Accommodation: monthly performance 10 Other news: national
Visit Kent Business Barometer: July 2017
 Visit Kent Business Barometer: July 2017 In July 2017, Kent attractions experienced an increase in visitor footfall, being 3.6% up compared to the same month last year. Serviced accommodation providers
Latest Tourism Trends. Humphrey Walwyn Head of VisitEngland Research
 Latest Tourism Trends Humphrey Walwyn Head of VisitEngland Research 1 Inbound Tourism 2 2003 2004 2005 2006 2007 2008 2009 2010 2011 2012 2013 2014 2015 2016 2017 UK inbound long term trend Spend per visit
Tourism Trends. Humphrey Walwyn Head of VisitEngland Research October 2018
 Tourism Trends Humphrey Walwyn Head of VisitEngland Research October 2018 1 England Research & Evaluation GBTS - Overnights (statutory research & official statistic) GBDVS - Day (statutory/ official) Occupancy
Visit Wales Research Update
 Visit Wales Research Update 19 January 21 This update summarises tourism performance by drawing upon Visit Wales own research and information from other relevant sources. It is based upon information available
Tourism Business Monitor Accommodation Report. Wave 2 Post-Easter holidays
 Tourism Business Monitor 2017 Accommodation Report Wave 2 Post-Easter holidays Contents Background Key Findings Business Dashboards Visitor Profile Business Performance Workforce Business Confidence 2
Produced by: Destination Research Sergi Jarques, Director
 Produced by: Destination Research Sergi Jarques, Director Economic Impact of Tourism North Norfolk District - 2016 Contents Page Summary Results 2 Contextual analysis 4 Volume of Tourism 7 Staying Visitors
Produced by: Destination Research Sergi Jarques, Director
 Produced by: Destination Research Sergi Jarques, Director Economic Impact of Tourism Norfolk - 2016 Contents Page Summary Results 2 Contextual analysis 4 Volume of Tourism 7 Staying Visitors - Accommodation
Tourism Business Monitor Accommodation Report. Wave 3 Post-Easter until mid-july
 Tourism Business Monitor 20 Accommodation Report Wave 3 Post-Easter until mid-july Background, objectives and research method Tourism Business Monitor designed to measure, monitor and understand tourism
Produced by: Destination Research Sergi Jarques, Director
 Produced by: Destination Research Sergi Jarques, Director Economic Impact of Tourism Oxfordshire - 2016 Economic Impact of Tourism Headline Figures Oxfordshire - 2016 number of trips (day & staying) 27,592,106
Produced by: Destination Research Sergi Jarques, Director
 Produced by: Destination Research Sergi Jarques, Director Economic Impact of Tourism Norfolk - 2017 Contents Page Summary Results 2 Contextual analysis 4 Volume of Tourism 7 Staying Visitors - Accommodation
Performance of Tourism Accommodation January September 2018p
 Headlines This is a brief snapshot of tourism accommodation performance in up to September 2018, based on preliminary results from Fáilte s accommodation occupancy survey. The analysis gives us an opportunity
Produced by: Destination Research Sergi Jarques, Director
 Produced by: Destination Research Sergi Jarques, Director Economic Impact of Tourism Epping Forest - 2014 Economic Impact of Tourism Headline Figures Epping Forest - 2014 Total number of trips (day & staying)
Coast to coast. STR Coastal Town Review Coastal Towns Market Review Report_JE.indd 3
 Coast to coast. STR Coastal Town Review 16 Coastal Towns Market Review Report_JE.indd 3 4//17 8:31:38 AM Table of Contents Introduction...3 United Kingdom...4 Blackpool...6 Bournemouth...8 Brighton...
REPORT. VisitEngland Business Confidence Monitor Wave 5 Autumn
 REPORT VisitEngland Business Confidence Monitor 2011 5-7 Museum Place Cardiff, Wales CF10 3BD Tel: ++44 (0)29 2030 3100 Fax: ++44 (0)29 2023 6556 www.strategic-marketing.co.uk Page 2 of 31 Contents Page
Produced by: Destination Research Sergi Jarques, Director
 Produced by: Destination Research Sergi Jarques, Director Economic Impact of Tourism Oxfordshire - 2015 Economic Impact of Tourism Headline Figures Oxfordshire - 2015 Total number of trips (day & staying)
Tourism Business Monitor Visitor Attractions Report. Wave 2 Post-Easter holidays
 Tourism Business Monitor 20 Visitor Attractions Report Wave 2 Post-Easter holidays Background, objectives and research method Tourism Business Monitor designed to measure, monitor and understand tourism
Tourism Business Monitor. Accommodation Report. Wave 5 Post-October half term
 Tourism Business Monitor Accommodation Report Wave 5 Post-October half term Background, objectives and research method Tourism Business Monitor designed to measure, monitor and understand tourism business
Economic Impact of Tourism. Hertfordshire Results. Commissioned by: Visit Herts. Produced by:
 Commissioned by: Visit Herts Produced by: Destination Research www.destinationresearch.co.uk December 2016 Contents Page Introduction and Contextual Analysis 3 Headline Figures 5 Volume of Tourism 7 Staying
Latest market insights and marketing plans from VisitBritain/VisitEngland. Anke Monestel, VisitEngland 8 th February 2018
 Latest market insights and marketing plans from VisitBritain/VisitEngland Anke Monestel, VisitEngland 8 th February 2018 1 Inbound tourism trends 2 Friday, February 9, 2018 2003 2004 2005 2006 2007 2008
Tourism Business Monitor Accommodation Report. Wave 5 Mid-September until the end of October
 Tourism Business Monitor Accommodation Report Wave 5 Mid-ember until the end of October Background, objectives and research method Tourism Business Monitor designed to measure, monitor and understand tourism
Commissioned by: Economic Impact of Tourism. Stevenage Results. Produced by: Destination Research
 Commissioned by: Produced by: Destination Research www.destinationresearch.co.uk December 2016 Contents Page Introduction and Contextual Analysis 3 Headline Figures 5 Volume of Tourism 7 Staying Visitors
Tourism Snapshot. A focus on the markets in which the CTC and its partners are active. February 2015 Volume 11, Issue 2.
 Tourism Snapshot Tourism Whistler/Mike Crane A focus on the markets in which the CTC and its partners are active www.canada.travel/corporate February Volume 11, Issue 2 Key highlights The strong beginning
The overarching aim of this strategy is to ensure that Devon can achieve its potential to be a first class visitor destination.
 Devon Tourism Strategy 2013-2016 1.0 Introduction This strategy, produced by the Devon Tourism Partnership (), aims to provide an overarching guiding framework for the development of the tourism sector
Tourism Snapshot. June 2015 Volume 11, Issue 6. A focus on the markets in which Destination Canada (DC) and its partners are active.
 and its partners are active.") Tourism Snapshot Tourism PEI / Paul Baglole A focus on the markets in which Destination Canada (DC) and its partners are active. www.destinationcanada.com June Volume 11, Issue 6 Key highlights Over the
Tourism Snapshot Tourism PEI / Paul Baglole A focus on the markets in which Destination Canada (DC) and its partners are active. www.destinationcanada.com June Volume 11, Issue 6 Key highlights Over the
Tourism Snapshot A Monthly Monitor of the Performance of Canada s Tourism Sector
 Tourism Snapshot A Monthly Monitor of the Performance of Canada s Tourism Sector December Volume 14, Issue 12 www.destinationcanada.com Tourism Snapshot December 1 Newfoundland and Labrador Tourism KEY
Tourism Snapshot A focus on the markets in which the CTC and its partners are active
 Tourism Snapshot A focus on the markets in which the CTC and its partners are active www.canada.travel/corporate June Volume 1, Issue 6 Key highlights CTC s overseas markets leaped 1% over the same month
Destination Performance 2012
 Destination Performance 2012 Sample Council City 2 Prepared by: TSE Research www.tourismsoutheast.com Contextual Information Welcome to the Destination Intelligence report for British Destinations members.
Tourism Snapshot A Monthly Monitor of the Performance of Canada s Tourism Industry
 Tourism Snapshot A Monthly Monitor of the Performance of Canada s Tourism Industry May 2018 Volume 14, Issue 4 Greg Funnell www.destinationcanada.com Tourism Snapshot May 2018 1 KEY HIGHLIGHTS Note: This
Tourism activity supports 60,007 full-time equivalent jobs locally
 Marketing Lancashire STEAM Tourism Economic Impacts 2017 Year in Review The Visitor Economy of Lancashire This is a summary of the annual tourism economic impact research undertaken for Marketing Lancashire
The Economic Impact of Poole s Visitor Economy 2015
 The Economic Impact of Poole s Visitor Economy 2015 Produced By The South West Research Company Ltd October 2016 Contents Page Introduction 3 Poole data 4 Dorset data 17 Introduction This report examines
AUCKLAND DESTINATION OVERVIEW
 AUCKLAND DESTINATION OVERVIEW AUGUST 218 An in-depth overview of Auckland s visitor economy from the latest arrival, accommodation, spend and cruise data through to past five- commentary. Prepared September
Trends & Statistics - July 2013
 Trends & Statistics - July 2013 Insight Department VisitScotland July 2013 1 Welcome In today s rapidly changing world, having an informed outlook is vital. The tourism and hospitality sectors are increasingly
% change vs. Dec ALL VISITS (000) 2,410 12% 7,550 5% 31,148 1% Spend ( million) 1,490 15% 4,370-1% 18,710 4%
 2,410 12% 7,550 5% 31,148 1% Spend ( million) 1,490 15% 4,370-1% 18,710 4%") HEADLINES FULL YEAR 2012 (PROVISIONAL) 1 Overall visits 31.148 million visits making 2012 the best year for inbound tourism since 2008 but not a record. 1% increase in visits on 2011 (30.798 visits) slightly
HEADLINES FULL YEAR 2012 (PROVISIONAL) 1 Overall visits 31.148 million visits making 2012 the best year for inbound tourism since 2008 but not a record. 1% increase in visits on 2011 (30.798 visits) slightly
Construction Industry Focus Survey. Sample
 Construction Industry Focus Survey 1 CONTENTS Executive Summary 1 1. Leading Activity Indicator 2 2. Activity by sector and constraints Residential, Non-residential, Civil Engineering 3. Orders and Tenders
West Somerset 2015 Local data version
 West Somerset 2015 Local data version Introduction This report examines the volume and value of tourism and the impact of visitor expenditure on the local economy in West Somerset and Somerset county in
Tourism Snapshot A Monthly Monitor of the Performance of Canada s Tourism Industry
 Tourism Snapshot A Monthly Monitor of the Performance of Canada s Tourism Industry September Volume 14, Issue 8 Tourism Toronto www.destinationcanada.com Tourism Snapshot September 1 KEY HIGHLIGHTS IMPORTANT
Tourism Snapshot A Monthly Monitor of the Performance of Canada s Tourism Industry
 Tourism Snapshot A Monthly Monitor of the Performance of Canada s Tourism Industry July 2018 Volume 14, Issue 6 www.destinationcanada.com Tourism Snapshot July 2018 1 KEY HIGHLIGHTS IMPORTANT: The July
Tourism Snapshot A Monthly Monitor of the Performance of Canada s Tourism Industry
 Tourism Snapshot A Monthly Monitor of the Performance of Canada s Tourism Industry December 2015 Volume 11, Issue 12 www.destinationcanada.com Tourism Snapshot December 2015 1 2 Tourism Snapshot December
Tourism Business Monitor Visitor Attractions Report. Wave 4 Mid-July until end of the Summer holidays
 Tourism Business Monitor 20 Visitor Attractions Report Wave 4 Mid-July until end of the Summer holidays Background, objectives and research method Tourism Business Monitor designed to measure, monitor
Jan-18. Dec-17. Travel is expected to grow over the coming 6 months; at a slower rate
 Analysis provided by TRAVEL TRENDS INDEX DECEMBER 2018 CTI reading of 51.8 in December 2018 indicates that travel to or within the U.S. grew 3.6% in December 2018 compared to December 2017. LTI predicts
AUCKLAND DESTINATION OVERVIEW
 AUCKLAND DESTINATION OVERVIEW September 218 An in-depth overview of Auckland s visitor economy from the latest arrival, accommodation, spend, cruise and event data through to past five- commentary. Prepared
Tourism Snapshot A focus on the markets in which the CTC and its partners are active
 Tourism Snapshot A focus on the markets in which the CTC and its partners are active www.canada.travel/corporate January 214 Volume 1, Issue 1 Key highlights Total arrivals from CTC s international markets
Domestic tourism in 2017
 Domestic tourism in 2017 1 2017 was a good year for domestic holidays in England Holiday trip volume equalled the record previously set in 2009 Holiday trip expenditure equalled the record previously set
49 May-17. Jun-17. Travel is expected to grow over the coming 6 months; at a slower rate
 Analysis provided by TRAVEL TRENDS INDEX MAY 2018 CTI reading of 51.7 in May 2018 shows that travel to or within the U.S. grew 3.4% in May 2018 compared to May 2017. LTI predicts moderating travel growth
Commissioned by: Visit Kent. Economic Impact of Tourism. Canterbury Results. Produced by: Destination Research
 Commissioned by: Visit Kent Produced by: Destination Research www.destinationresearch.co.uk November 2016 Contents Page Introduction and Contextual Analysis 3 Headline Figures 6 Volume of Tourism 8 Staying
The Economic Impact of Gloucestershire s Visitor Economy Forest of Dean district
 The Economic Impact of Gloucestershire s Visitor Economy 201 Forest of Dean district Produced on behalf of the Wye Valley and Forest of Dean Tourism Association By The South West Research Company Ltd January
The Economic Impact of Gloucestershire s Visitor Economy Forest of Dean district
 The Economic Impact of Gloucestershire s Visitor Economy 2014 Forest of Dean district Produced on behalf of the Wye Valley and Forest of Dean Tourism Association By The South West Research Company Ltd
Tourism Business Monitor Visitor Attractions Report. Wave 2 Easter up until the end of May
 Tourism Business Monitor 20 Visitor Attractions Report Wave 2 Easter up until the end of May Background, objectives and research method Tourism Business Monitor designed to measure, monitor and understand
GERMANY & VISITBRITAIN CAMPAIGNS. Holger Lenz, Manager Central Europe 2 nd November 2016
 GERMANY & VISITBRITAIN CAMPAIGNS Holger Lenz, Manager Central Europe 2 nd November 2016 1 Key UK inbound market facts Visits' 3,249,000' To'UK:'%,'rank' 9.0%' 3 rd '' Spending' To'UK:'%,'rank' 1,378,000'
Understanding Business Visits
 Understanding Business Visits Foresight issue 153 VisitBritain Research 1 Contents Introduction Summary and Highlights Business Visits in Context UK Business visits and spend Averages Duration of stay
AUCKLAND DESTINATION OVERVIEW
 AUCKLAND DESTINATION OVERVIEW October 218 An in-depth overview of Auckland s visitor economy from the latest arrival, accommodation, spend, cruise and event data through to past five- commentary. Prepared
Trends & Statistics - December 2014
 Trends & Statistics - December 2014 Insight Department VisitScotland December 2014 1 Welcome In today s rapidly changing world, having an informed outlook is vital. The tourism and hospitality sectors
Insight Department: Scotland The key facts on tourism in 2016
 Insight Department: Scotland The key facts on tourism in 2016 September 2017 Executive Summary & Background Information In 2016 just under 14.5 million overnight tourism trips were undertaken in Scotland.
Insight Department: Scotland The key facts on tourism in 2016
 Insight Department: Scotland The key facts on tourism in 2016 September 2017 Executive Summary & Background Information In 2016 just under 14.5 million overnight tourism trips were undertaken in Scotland.
TripAdvisor Workshop Christchurch 7 June 2016
 TripAdvisor Workshop Christchurch 7 June 2016 TripAdvisor: The World s Largest Travel Site 1 M I L L I O N Reviews & Opinions 3402005 MILLION 2000 Unique visitors a month M I L L I O N 350 r e vie w s
Economic Impact of Tourism. Cambridgeshire 2010 Results
 Economic Impact of Tourism Cambridgeshire 2010 Results Produced by: Tourism South East Research Department 40 Chamberlayne Road, Eastleigh, Hampshire, SO50 5JH sjarques@tourismse.com http://www.tourismsoutheast.com
Visitor Attraction Trends in England Full Report
 Visitor Attraction Trends in England 2016 Full Report Contents Acknowledgement & Introduction Sample Headlines Weather Summary Visitor admission trends Category, Region, Charge, Geographic location, Size,
Oct-17 Nov-17. Sep-17. Travel is expected to grow over the coming 6 months; at a slightly faster rate
 Analysis provided by TRAVEL TRENDS INDEX SEPTEMBER 2018 CTI reading of.8 in September 2018 indicates that travel to or within the U.S. grew 1.6% in September 2018 compared to September 2017. LTI predicts
Third Quarter Marketing Report B R A N SON/LAKES A R EA C VB N OVEMBER, 2013
 Third Quarter Marketing Report B R A N SON/LAKES A R EA C VB N OVEMBER, 2013 Economic Outlook +5.1% from July 2011 Consumer Confidence is Up 7% This Year Increasing from 66.7 in Dec to 71.2 Today +6.7%
Travel Profiles A SNAPSHOT OF KEY MARKETS
 Travel Profiles A SNAPSHOT OF KEY MARKETS Tourism is a vital part of the Irish economy. It is integral to sustainable regional development and an important source of national employment (240,000 jobs in
Regional Spread of Inbound Tourism. VisitBritain Research, August 2018
 Regional Spread of Inbound Tourism VisitBritain Research, August 218 1 Contents Introduction Summary Key metrics by UK area Analysis by UK area Summary of growth by UK area Scotland Wales North East North
Tourism Business Monitor Visitor Attractions Report. Wave 5 Mid-September until the end of October
 Tourism Business Monitor 20 Visitor Attractions Report Wave 5 Mid-ember until the end of October Background, objectives and research method Tourism Business Monitor designed to measure, monitor and understand
Tourism Snapshot A Monthly Monitor of the Performance of Canada s Tourism Industry
 Tourism Snapshot A Monthly Monitor of the Performance of Canada s Tourism Industry October 2018 Volume 14, Issue 9 Brian Caissie www.destinationcanada.com Tourism Snapshot October 2018 1 KEY HIGHLIGHTS
Fáilte Ireland Tourism Barometer September 2018
 Tourism Barometer Contents Page 1. Headline Findings... 2 2. Qualitative Findings... 4 3. Overall Visitor Volumes in 2018 and Expectations... 7 4. Hotels... 9 5. Guesthouses... 13 6. B&Bs... 15 7. Self-catering...
VisitEngland Business Support Update. Vicky Parr, VisitEngland Business Support Manager Tuesday 2 nd April 2019
 VisitEngland Business Support Update Vicky Parr, VisitEngland Business Support Manager Tuesday 2 nd April 2019 1 Our Aims As the National Tourism Agency: VisitBritain: Market the nations and regions of
REPORT. VisitEngland 2010 Business Confidence Monitor. Wave 1 New Year
 REPORT VisitEngland Wave 1 New Year 5-7 Museum Place Cardiff, Wales CF10 3BD Tel: ++44 (0)29 2030 3100 Fax: ++44 (0)29 2023 6556 www.strategic-marketing.co.uk Contents Page 1. Headline Findings... 3 2.
International Visitation to the Northern Territory. Year ending September 2017
 International Visitation to the Northern Territory Year ending September 2017 The following is a summary of information relevant to the Northern Territory (NT) tourism industry including visitation results
Tourism Snapshot A Monthly Monitor of the Performance of Canada s Tourism Industry
 Tourism Snapshot A Monthly Monitor of the Performance of Canada s Tourism Industry February 2017 Volume 13, Issue 2 www.destinationcanada.com Tourism Snapshot February 2017 1 KEY HIGHLIGHTS Canada welcomed
Tourism Snapshot A Monthly Monitor of the Performance of Canada s Tourism Industry
 Tourism Snapshot A Monthly Monitor of the Performance of Canada s Tourism Industry April 2018 Volume 14, Issue 3 www.destinationcanada.com Tourism Snapshot April 2018 1 KEY HIGHLIGHTS Following an exceptionally
Commissioned by: Visit Kent. Economic Impact of Tourism. Dover Results. Produced by: Destination Research
 Commissioned by: Visit Kent Produced by: Destination Research www.destinationresearch.co.uk November 2016 Contents Page Introduction and Contextual Analysis 3 Headline Figures 6 Volume of Tourism 8 Staying
Easter boosts results in tourism accommodation
 16 May 2016 Tourism Activity March 2016 Easter boosts results in tourism accommodation Hotel establishments recorded 1.4 million guests and 3.7 million overnight stays in March 2016, the equivalent to
National tourist board update
 National tourist board update Patricia Yates, Director of Strategy & Communications The British Tourist Authority 11 March 2016 About the British Tourist Authority Focus Maintain distinct activities to
Oct-17 Nov-17. Travel is expected to grow over the coming 6 months; at a slower rate
 Analysis provided by TRAVEL TRENDS INDEX OCTOBER 2018 CTI reading of 51.6 in October 2018 indicates that travel to or within the U.S. grew 3.2% in October 2018 compared to October 2017. LTI predicts travel
TOURISM PERFORMANCE 2017
 4 th QUARTER TOURISM PERFORMANCE 2017 TOTAL STAYOVER ARRIVALS 105,658 TOTAL CRUISE ARRIVALS 224,212 TOTAL VISITOR NIGHTS AVERAGE HOTEL OCCUPANCY 935,402 71.7% ECONOMIC IMPACT $142.6 million HOW WAS OUR
Tourism Snapshot. A focus on the markets in which the CTC and its partners are active. October 2012 Volume 8, Issue 10.
 Tourism Snapshot Niagara Helicopters Tour A focus on the markets in which the CTC and its partners are active www.canada.travel/corporate October 2012 Volume 8, Issue 10 Total arrivals from CTC s international
visitor insights 2016
 visitor insights 2016 table of contents Purpose of Report 3 Surf Coast Data Regions 3 Maps 3 Executive Summary 4 Summary of Total Visitation to Surf Coast 5 Total Visitation and Visitor Nights 5 Total
Significant increase in accommodation activity but slightly less than in the previous month
 Tourism activity February 2015 15 April, 2015 Significant increase in accommodation activity but slightly less than in the previous month Hotel establishments recorded approximately 2.2 million overnight
Tourism Snapshot A focus on the markets in which the CTC and its partners are active
 Tourism Snapshot A focus on the markets in which the CTC and its partners are active www.canada.travel/corporate May Volume 1, Issue 5 Key highlights Total arrivals from CTC s international markets improved
PEI Tourism Performance
 PEI Tourism Performance Brian Dunn Manager - Evaluation, Measurements & Business Intelligence Department of Economic Development and Tourism November 25, 2016 Presentation Outline 1. Global Performance
Economic Impact of Tourism. Norfolk
 Economic Impact of Tourism Norfolk - 2009 Produced by: East of England Tourism Dettingen House Dettingen Way, Bury St Edmunds Suffolk IP33 3TU Tel. 01284 727480 Contextual analysis Regional Economic Trends
Tourism Business Monitor Wave 2 Post-Easter holidays
 Tourism Business Monitor 2017 Wave 2 Post-Easter holidays Contents Background Key Findings Business Dashboards Visitor Profile Business Performance Workforce - Accommodation Workforce Attractions Business
Tourism Snapshot A Monthly Monitor of the Performance of Canada s Tourism Industry
 Tourism Snapshot A Monthly Monitor of the Performance of Canada s Tourism Industry February Volume 14, Issue 1 www.destinationcanada.com Tourism Snapshot February 1 KEY HIGHLIGHTS After a slow start in
1. Headline Findings Qualitative Findings Overall Visitor Volumes in 2014 and Expectations Hotels Guesthouses...
 Contents Page 1. Headline Findings... 2 2. Qualitative Findings... 5 3. Overall Visitor Volumes in 2014 and Expectations... 7 4. Hotels... 10 5. Guesthouses... 15 6. B&Bs... 17 7. Self-catering... 19 8.
International Visitation to the Northern Territory. Year ending December 2017
 International Visitation to the Northern Territory Year ending December 2017 The following is a summary of information relevant to the Northern Territory (NT) tourism industry including visitation results
Tourism Snapshot A focus on the markets in which the CTC and its partners are active
 Tourism Snapshot A focus on the markets in which the CTC and its partners are active www.canada.travel/corporate April Volume 1, Issue 4 Key highlights Total arrivals from CTC s international markets improved
Tourism Snapshot A Monthly Monitor of the Performance of Canada s Tourism Industry
 Tourism Snapshot A Monthly Monitor of the Performance of Canada s Tourism Industry Volume 14, Issue 5 www.destinationcanada.com Tourism Snapshot 1 KEY HIGHLIGHTS IMPORTANT: The frontier counts released
Tourism Snapshot A focus on the markets that the CTC and its partners are active in Ontario June 2011 Volume 7, Issue 6
 Tourism Snapshot Ontario A focus on the markets that the CTC and its partners are active in www.canada.travel/corporate June 2011 Volume 7, Issue 6 Key highlights In June 2011, overnight travel to Canada
South West Coast Path Local Business Survey Final report
 South West Coast Path Local Business Survey 2015 Final report Produced for and on behalf of The South West Coast Path Association by The South West Research Company Ltd. March 2016 Contents Page Summary
Residents ensure increase on overnight stays in hotels and similar establishments
 13 July 2018 Tourism Activity May 2018 Residents ensure increase on overnight stays in hotels and similar establishments Hotels and similar establishments registered 2.0 million guests and 5.4 million
PARTNERSHIP BROCHURE. Working with businesses to grow and develop the visitor economy
 PARTNERSHIP BROCHURE Working with businesses to grow and develop the visitor economy www.experienceoxfordshire.org EXPERIENCE OXFORDSHIRE Visitors to Oxfordshire are vitally important to the county s economy.
Driving Customer Satisfaction
 Driving Customer Satisfaction Getting the most out of the VE Brand & Satisfaction Tracker Jim Eccleston, TNS RI Travel & Tourism Destinations Conference 20 th October, 2011 Today s Coverage The context
Activities in Britain s nations and regions
 Activities in Britain s nations and regions Foresight issue 165 VisitBritain Research January 2019 1 Contents Please note: underlined text can be used to navigate through this document Introduction UK
Tourism Snapshot A Monthly Monitor of the Performance of Canada s Tourism Industry
 Tourism Snapshot A Monthly Monitor of the Performance of Canada s Tourism Industry March Volume 14, Issue 2 Tourism Saskatoon / Carey Shaw www.destinationcanada.com Tourism Snapshot March 1 KEY HIGHLIGHTS
AUCKLAND DESTINATION OVERVIEW
 AUCKLAND DESTINATION OVERVIEW JUNE 218 An in-depth overview of Auckland s visitor economy from the latest arrival, accommodation, spend and cruise data through to past five-year commentary. Prepared July