Q2 & H1 FY17 RESULT UPDATE October 2016
|
|
|
- Robert Strickland
- 5 years ago
- Views:
Transcription


1 Q2 & H1 FY17 RESULT UPDATE October 2016
2 DISCUSSION SUMMARY Q2 & H1 FY17 RESULT HIGHLIGHTS Q2 & H1 FY17 PORTFOLIO UPDATE AMUSEMENT PARK, BANGALORE RESORT, BANGALORE AMUSEMENT PARK, KOCHI AMUSEMENT PARK, HYDERABAD COMPANY OVERVIEW ANNEXURE 2
3 Q2 & H1 FY17 RESULTS HIGHLIGHTS Q2 FY17 YoY Analysis REVENUES EBITDA & EBITDA MARGIN CASH PAT, PAT & PAT MARGIN % 20.3% % % 27.6% % % % Q2 FY16 Q2 FY17 Q2 FY16 Q2 FY17 Q2 FY16 Q2 FY17 EBITDA EBITDA Margin % PAT Cash PAT PAT Margin % H1 FY17 YoY Analysis 1,104.4 REVENUES EBITDA & EBITDA MARGIN CASH PAT, PAT & PAT MARGIN 49.8% 36.2% 35.5% 18.3% 1, % % % % H1 FY16 H1 FY17 H1 FY16 H1 FY17 EBITDA EBITDA Margin % H1 FY16 H1 FY17 PAT Cash PAT PAT Margin % In Rs Mn 3
4 Q2 & H1 FY17 RESULTS HIGHLIGHTS FINANCIAL UPDATE Q2 FY17 Revenues from Operations grew by 16.2% YoY to Rs mn driven by 9.6% growth in average revenue per visitor and 5.6% growth in footfalls. Bangalore park witnessed 20.2% increase in average ticket revenue and 37.6% increase in average non-ticket revenue. Kochi park witnessed 3.1% decrease in average ticket revenue and 10.2% increase in average non-ticket revenue. Footfalls in Bangalore park declined by 27.5% and in Kochi park increased by 6.4%. Performance at Bangalore park was largely impacted by the political instability caused by the Cauvery River dispute. Hyderabad park average ticket revenue increased by 14.4% QoQ and average non-ticket revenue increased by 3.4% QoQ. Footfalls were lower than expected due to unusual floods for over two weeks in September. Q2 FY17 EBITDA decreased by 30.7% YoY to Rs mn. EBITDA margin decreased from 34.0% in Q2 FY16 to 20.3% in Q2 FY17. There was an overall increase in operating expenses primarily on account of addition of Hyderabad park. Other expenses also included provisions of Rs 13.8 mn on account of service tax. Q2 FY17 PAT decreased by 75.2% YoY to Rs 29.6 mn. PAT margin decreased from 27.6% in Q2 FY16 to 5.9% in Q2 FY17. 4
5 Q2 & H1 FY17 REVENUE ANALYSIS SERVICES VS. PRODUCTS PORTFOLIO BREAKUP , , , , % 4.8% 4.7% 4.2% 14.5% 17.5% 13.1% 16.5% 15.6% 19.6% 39.5% 46.0% 30.8% 85.5% 86.9% 41.6% 82.5% 83.5% 49.2% 55.8% 37.9% 45.4% Services Products Park - Bangalore Park - Kochi Park - Hyderabad Resort - Bangalore TICKET VS. NON-TICKET TOTAL FOOTFALLS (In 000) , , % 24.4% 20.3% 23.2% 1, , % 75.6% 79.7% 76.8% % 9.5 % Ticket Non-Ticket In Rs Mn 5
6 Q2 & H1 FY17 REVENUE ANALYSIS AVG. REVENUE PER VISITOR (In Rs)* AVG. TICKET REVENUE PER VISITOR (In Rs) , % 15.0 % 5.5% 10.8 % AVG. NON-TICKET REVENUE PER VISITOR (In Rs) BREAK-UP OF NON-TICKET REVENUE % 33.5% * Includes sale of services, sales of products & other operating income. Q 41.3% 18.0% 40.4% 16.4% 18.2% 17.1% 16.1% 33.0% 16.6% 34.1% 20.5% 22.5% 16.9% 25.5% 13.6% 26.2% 5.3% 5.4% 7.0% 6.2% Restaurants Cooked Food Products Resort Others 6
7 PORTFOLIO UPDATE AMUSEMENT PARK, BANGALORE Launched in 2005 by the name Wonderla Wonderla Bangalore is located off the Bangalore-Mysore highway, 28 km from Central Bangalore Situated on acres of land with 59 land and water based attractions and other allied facilities 5 restaurants offering various cuisines, of which two are operated by the Company The park has won 11 awards since inception Q2 FY17 Q2 FY16 YoY % Total Revenues (Rs Mn) * % No of Visitors (In 000) % Avg. Revenue Per Visitor (Rs) 1, % H1 FY17 H1 FY16 YoY % Total Revenues (Rs Mn) * % No of Visitors (In 000) % Avg. Revenue Per Visitor (Rs) 1, % * Includes sale of services, sales of products & other operating income. LOCATION BANGALORE Total Land Available (In Acres) Developed Land (In Acres) Land Availability for Future development (In Acres) Total No of Rides 61 No of Wet Rides 21 No of Dry Rides 40 7
8 BANGALORE PARK REVENUE & FOOTFALL ANALYSIS AVG. TICKET REVENUE PER VISITOR (In Rs) AVG. NON-TICKET REVENUE PER VISITOR (In Rs) % 24.3 % 37.6 % 23.7 % FOOTFALLS WALK-IN Vs. GROUP / CHANNEL ( 000) FOOTFALLS REGIONWISE BREAKUP ( 000) % 5.5% 4.0% 3.5% 25.5% 21.1% 3.5% 41.7% 35.3% 3.1% 6.0% 4.2% 22.1% 18.0% 13.1% 9.4% 63.1% 65.5% 72.6% 78.9% 58.3% 64.7% 74.5% 78.9% 8.0% 7.9% 4.3% 4.0% Walk-in Group Kerala Karnataka Tamil Nadu Andhra Pradesh Others 8
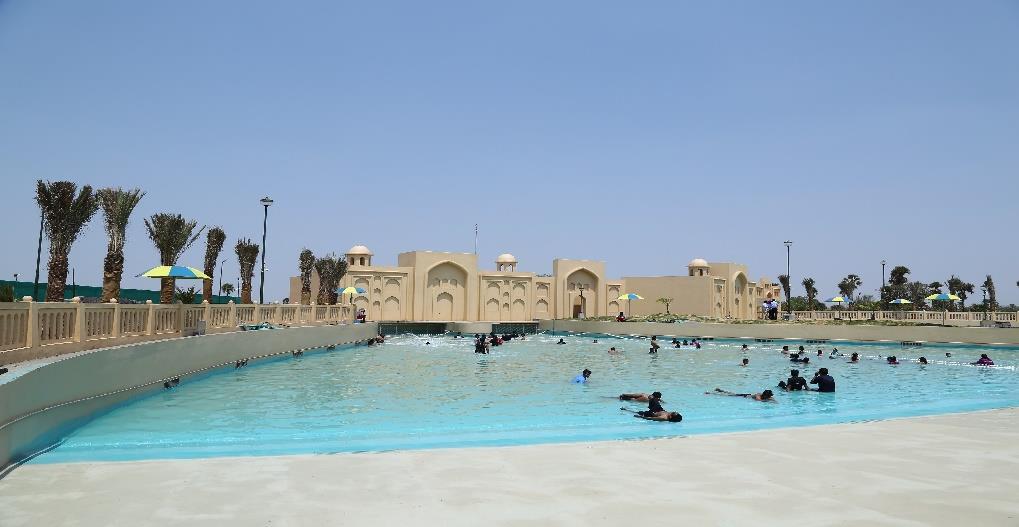
9 BANGALORE PARK 9

10 PORTFOLIO UPDATE WONDERLA RESORT, BANGALORE Three Star leisure resort attached to the amusement park; launched in March 2012 The resort has 84 luxury rooms The resort also has 4 banquet halls / conference rooms, totalling 8,900 sq. ft. with a capacity to hold 800 guests and a well equipped board room Suitable for hosting wedding receptions, parties and other corporate events and meetings Other amenities include a multi-cuisine restaurant, rest-o-bar, solar heated swimming pool, recreation area, kids activity centre and a well equipped gym Q2 FY17 Q2 FY16 YoY % Total Revenues (Rs Mn) * % Total No of Room Nights Available (No.) to Guests 7,487 7, % Occupancy % 45% 33% - Avg. Room Rental for the period (Rs) * Includes other operating income. 4,313 4, % H1 FY17 H1 FY16 YoY % Total Revenues (Rs Mn) * % Total No of Room Nights Available (No.) to Guests 14,850 15, % Occupancy % 56% 40% - Avg. Room Rental for the period (Rs) 4,488 4, % 10

11 PORTFOLIO UPDATE AMUSEMENT PARK, KOCHI Launched in 2000 by the name Veegaland and operating under the name Wonderla since April 2008 Situated on acres of land, and currently occupying acres for 62 land and water based attractions and other allied facilities 5 restaurants offering various cuisines, of which two are operated by the Company The park has won 16 awards since inception Q2 FY17 Q2 FY16 YoY % Total Revenues (Rs Mn) * % No of Visitors (In 000) % Avg. Revenue Per Visitor (Rs) % H1 FY17 H1 FY16 YoY % Total Revenues (Rs Mn) * % No of Visitors (In 000) % Avg. Revenue Per Visitor (Rs) % * Includes sale of services, sales of products & other operating income. LOCATION KOCHI Total Land Available (In Acres) Developed Land (In Acres) Land Availability for Future development(in Acres) Total No of Rides 62 No of Wet Rides 23 No of Dry Rides 39 11
12 KOCHI PARK REVENUE & FOOTFALL ANALYSIS AVG. TICKET REVENUE PER VISITOR (In Rs) AVG. NON-TICKET REVENUE PER VISITOR (In Rs) % 7.8% 10.2 % 22.2 % FOOTFALLS WALK-IN Vs. GROUP / CHANNEL ( 000) % 42.9% 28.8% 30.2% 58.8% 57.1% 71.2% 69.8% FOOTFALLS REGIONWISE BREAKUP ( 000) % 3.7% 3.7% 3.4% 0.4% 0.3% 0.5% 0.4% 37.0% 42.7% 28.5% 34.3% 0.8% 1.1% 0.5% 0.6% 66.5% 60.7% 57.9% 52.7% Walk-in Group Kerala Karnataka Tamil Nadu Andhra Pradesh Others 12


13 KOCHI PARK 13
14 PORTFOLIO UPDATE AMUSEMENT PARK, HYDERABAD Launched in April 2016 by the name Wonderla Situated on 49.5 acres of land, and currently occupying 27.0 acres for 43 land and water based attractions and other allied facilities 4 restaurants offering various cuisines, of which 3 are operated by the Company Q2 FY17 Q1 FY17 QoQ % Total Revenues (Rs Mn) * % No of Visitors (In 000) % Avg. Revenue Per Visitor (Rs) % H1 FY17 H1 FY16 Total Revenues (Rs Mn) * No of Visitors (In 000) Avg. Revenue Per Visitor (Rs) * Includes sale of services, sales of products & other operating income. LOCATION HYDERABAD Total Land Available (In Acres) 49.5 Developed Land (In Acres) 27.0 Land Availability for Future development(in Acres) 22.5 Total No of Rides 43 No of Wet Rides 18 No of Dry Rides 25 14
15 HYDERABAD PARK REVENUE & FOOTFALL ANALYSIS AVG. TICKET REVENUE PER VISITOR (In Rs) AVG. NON-TICKET REVENUE PER VISITOR (In Rs) % 3.4 % Q1 FY17 Q2 FY17 H1 FY17 FOOTFALLS WALK-IN Vs. GROUP / CHANNEL ( 000) % 26% 14% 91% 74% 86% Q1 FY17 Q2 FY17 H1 FY17 Q1 FY17 Q2 FY17 H1 FY17 FOOTFALLS REGIONWISE BREAKUP ( 000) % 1.0% 4.3% 62.9% 96.4% 71.8% 31.6% 2.6% 23.9% Q1 FY17 Q2 FY17 H1 FY17 Walk-in Group Andhra Pradesh Telengana Others 15


16 HYDERABAD PARK 16
17 FINANCIALS P&L STATEMENT Particulars (Rs Mn) Q2 FY17 Q2 FY16 QoQ % H1 FY17 H1 FY16 YoY % FY16 Sale of Services % 1, % 1,764.4 Sale of products % % Total Revenue from Operations % 1, , % 2,053.6 Direct Operating Expenses % % Purchase of Stock-in-Trade % % Changes in Inventories of Stock-in-trade Employee Expenses % % Advertisement and marketing expense % % Other Expenses % % EBITDA % % EBITDA Margin % 20.3% 34.0% bps 35.5% 49.8% bps 41.0% Depreciation % % Other Income % % Finance Cost % % 13.3 PBT % % Tax Expense % % PAT % % PAT Margin % 5.9% 27.6% bps 18.3% 36.2% bps 29.1% Earnings Per Share (EPS) % % Note Income from services includes income from sale of entry tickets, share of revenue from restaurant sales and income from resort. Income from sale of products includes income from sale of traded goods, packaged food and other merchandise sold within amusement parks 17
18 FINANCIALS BALANCE SHEET Particulars (Rs Mn) H1 FY17 FY16 Share Holders Funds: Equity share capital Reserves and Surplus 3, ,465.0 Total of Shareholder funds 4, ,030.0 Minority interest - - Non-current liabilities: Long term Borrowings Deferred tax liabilities (Net) Long Term Provisions Total of Non-current liabilities Current liabilities: Short-term borrowings Trade payables Other current liabilities Short-term provisions Total of Current liabilities Total Equity & Liabilities 4, ,523.8 Particulars (Rs Mn) H1 FY17 FY16 Non-current assets: Fixed assets Tangible assets 3, ,522.3 Intangible assets Capital Work-in-Progress ,588.7 Total Fixed Assets 3, ,116.5 Deferred Tax Assets (net) Long-term loans and advances Other non-current assets Total non-current assets Current assets: Current Investments Inventories Trade receivables Cash and bank balances Short-term loans and advances Other Current Assets Total Current Assets 1, ,249.2 Total Assets 4, ,
19 COMPANY OVERVIEW ABOUT US OUR PEDIGREE One of the largest amusement park operators in India with over 16 years of successful operations. Management has operational experience in the amusement park industry for over a decade The promoters launched the first amusement park in 2000 in Kochi under the name Veegaland and later successfully launched the second park in Bangalore in 2005 and third park in Hyderabad in 2016 under the name Wonderla Promoted by Mr. Kochouseph Chittilappilly and Mr. Arun Chittilappilly Mr. Kochouseph Chittilappilly also incorporated V-Guard Industries Ltd., a publicly listed company since 2008 BUSINESS OVERVIEW Own and operate three amusement parks under the brand name Wonderla situated at Kochi, Bangalore and Hyderabad and a resort at Bangalore The Company recently opened its third amusement park in Hyderabad in April 2016 spread over 49.5 acres of land (27 acres developed) In-house manufacturing facility located at Kochi which manufactures / constructs rides and attractions for both the parks The Company and its first two parks have won 30 awards / certifications since inception, including National Awards for Excellence from Indian Association of Amusement Parks & Industries in the areas of total number and variety of rides, most innovative ride, etc STRONG FINANCIALS Consolidated Revenues, EBITDA and PAT were Rs 2,053.6 mn, Rs mn and Rs mn in FY16 having grown at CAGR of 15.7%, 10.3% and 19.0% over FY12 to FY16. Both the Parks Operational in Kochi and Bangalore are generating positive cash flows from operations. Robust balance sheet with Total Debt to Equity at 0.01x as of FY16. Healthy Return Ratios: FY16 ROCE 18.1%, FY16 ROE 15.8% 19
20 COMPANY OVERVIEW SHAREHOLDING STRUCTURE Share Price Performance Market Data As on (BSE) Market capitalization (Rs Mn) 22,956.2 Price (Rs.) Oct Jan Apr Jul Oct-16 No. of shares outstanding (Mn) 56.5 Face Value (Rs.) week High-Low (Rs.) Source: BSE % Shareholding September-16 Key Institutional Investors at September-16 % Holding Svenska Hendelsbanken 2.00% Public 29.01% UTI Mutual Fund 2.16% DNB Fund 1.94% Valuequest India Moat Fund 1.64% Promoter 70.99% Acacia Partners 1.35% Steinberg India Emerging Opp. Fund Limited 1.12% Source: BSE Catamaran Management Services Pvt. Limited 1.00% Source: Company 20
21 COMPANY OVERVIEW BOARD OF DIRECTORS & MANAGEMENT TEAM KOCHOUSEPH CHITTILAPPILLY PROMOTER AND NON EXECUTIVE DIRECTOR 16 yrs in the industry Founded V-Guard Industries Ltd., a publicly listed company since 2008 and is currently its Chairman Post Graduate Degree in Physics ARUN KOCHOUSEPH CHITTILAPPILLY PROMOTER AND MANAGING DIRECTOR 12+ yrs in the industry Holds a masters degree in industrial engineering Actively involved in day-to-day operations and management of Wonderla since 2003 GEORGE JOSEPH CHAIRMAN & NON- EXECUTIVE INDEPENDENT DIRECTOR 38+ yrs of total work experience Director in Muthoot Finance Ltd. RAMACHANDRAN PANJAN MOOTHEDATH INDEPENDENT DIRECTOR 32+ yrs of total work experience Promoter, Chairman and Managing Director of Jyothy Laboratories Ltd PRIYA SARAH CHEERAN JOSEPH EXECUTIVE DIRECTOR 12+ yrs in the Industry Involved in F&B Operations and HR department of Wonderla since 2005 D.S. SACHDEVA (DIPY) CHIEF EXECUTIVE OFFICER (CEO) 26+ years of work experience Prior experience in well established companies at M/s 3M India Ltd, Hindustan Unilever Ltd Holds a degree in engineering from BIT, Ranchi and is also an alumnus of IIM-Bangalore NANDAKUMAR T. CFO 18 yrs of experience Chartered Accountant SIVADAS M. SENIOR GM - OPERATIONS 27 yrs of experience Bachelor s Degree in Physics AJIKRISHNAN A. G. DEPUTY GM - TECHNICAL 18 yrs of experience B.E, MBA RAMANAKUMAR V.B. AGM - MARKETING 21 yrs of experience Degree in Marketing Management MAHESH M.B. AGM COMMERCIAL 21 yrs of experience MBA in International Business ANIL SHINDE CHIEF PEOPLE OFFICER 24 yrs of experience BE, MBA(IIM Ahmedabad) Worked for L&T, Reliance Digital and Suzlon Energy 21
22 COMPANY OVERVIEW UNDERSTANDING THE WONDERLA ADVANTAGE KEY CONCERNS ON SCALABILITY WONDERLA ADVANTAGE HIGHLY CAPITAL INTENSIVE BUSINESS In-House Design Capability for the Amusement Park In-House Ride Manufacturing Facility in Kochi Manufactured / constructed 42* rides / attractions in-house Typical Capex for a New Park is ~Rs 2,500 mn including Land cost AFFORDABILITY TICKET PRICES ARE HIGH Typical Target Audience is the Middle class which can spend Rs 4,000-5,000 per trip for a Family All three Parks have Land as well as Water rides under the same Ticket Average Ticket prices are in the Range of Rs per person LAND AVAILABILITY, LOCATION & CONNECTIVITY All three Operational Parks have large Land Parcels and have good connectivity (Within km from the city) Parks witness audiences from neighbouring states like Tamil Nadu and Kerala 22
23 OUR SUSTAINABLE COMPETITIVE ADVANTAGES OVER A DECADE OF OPERATIONAL EXPERIENCE AND BRAND EQUITY 16 yrs of successful operations of the parks has built significant brand equity Mr. Kochouseph and Mr. Arun have over 16 yrs and 12+ yrs of experience respectively in amusement park industry Won several awards, including best tourism destination and highest number and variety of innovative rides IN-HOUSE MANUFACTURING FACILITY AT WONDERLA KOCHI PROXIMITY TO CITY WITH AMPLE LAND AVAILABLE FOR FUTURE DEVELOPMENT Owns acres in Kochi, acres in Bangalore and 49.5 acres in Hyderabad, within which further expansion of existing parks can be undertaken All the three parks - Kochi, Bangalore and Hyderabad - are situated in the proximity of the main city. STRONG CUSTOMER INSIGHTS - CONSTANTLY INNOVATING NEW ATTRACTIONS Benefits from certain cost efficiencies and improves maintenance efficiency of rides Enables customisation and modification of rides purchased Manufactured / constructed 42* rides / attractions in-house In-depth understanding of customer preference and needs helps while conceptualising new rides Won the IAAPI** excellence award for the highest number and variety of innovative rides four times 23
24 OUR FUTURE GROWTH STRATEGY SCALABILITY EXPANSION THROUGH SETTING NEW AMUSEMENT PARKS Already acquired acres of land near Hyderabad and in the process of acquiring land in Chennai FOCUS ON IMPROVISING EXISTING PARKS TO IMPROVE FOOTFALLS Evaluate customer preferences to innovate attractions based on popular concepts Develop the undeveloped land at existing parks to increase operational capacity ENHANCED VISITOR EXPERIENCE THROUGH PARKS INTEGRATED WITH RESORTS Wonderla Resort enables visitors to stay longer at the park and increases spend per head Enhance visitor experience at other parks by integrating them with resorts EXPAND IN-HOUSE RIDE DESIGN AND MANUFACTURING CAPABILITIES Introduce new rides and attractions based on customer preferences and research done by visiting parks in other parts of the world Continue to invest in new manufacturing facilities at upcoming parks EXPAND REVENUE STREAMS AND INNOVATING MARKETING INITIATIVES TO SUPPLEMENT INCOME FROM ENTRY FEES Bolster revenues from entry tickets by offering value-added services Introduce character and theme based attractions and promote this through marketing initiatives, ad campaigns using media as well as tour operators 24


25 COMPANY OVERVIEW GLOBAL RANKING AND RECOGNITION Wonderla parks were ranked at #1 and #2 in India by Tripadvisor for Wonderla parks were ranked at #7 and #9 in Asia by TripAdvisor for 2015, highest for any Indian theme parks. Other Indian parks rated were: Adlabs Imagica, Mumbai (#18); Ramoji Film City, Hyderabad (#21); Essel World, Mumbai (#23). 25
26 DISCLAIMER This presentation and the following discussion may contain forward looking statements by Wonderla Holidays Limited ( Wonderla or the Company) that are not historical in nature. These forward looking statements, which may include statements relating to future results of operations, financial condition, business prospects, plans and objectives, are based on the current beliefs, assumptions, expectations, estimates, and projections of the management of Wonderla about the business, industry and markets in which Wonderla operates. These statements are not guarantees of future performance, and are subject to known and unknown risks, uncertainties, and other factors, some of which are beyond Wonderla s control and difficult to predict, that could cause actual results, performance or achievements to differ materially from those in the forward looking statements. Such statements are not, and should not be construed, as a representation as to future performance or achievements of Wonderla. In particular, such statements should not be regarded as a projection of future performance of Wonderla. It should be noted that the actual performance or achievements of Wonderla may vary significantly from such statements. 26

27 FOR FURTHER QUERIES THANK YOU Mr. Nandakumar Wonderla Holidays Ltd. CFO - nandakumar@wonderla.com Nilesh Dalvi / Rohan Rege Dickenson Seagull IR Contact No : / nilesh.dalvi@dickensonir.com rohan.rege@dickensonir.com 27
Q3 & 9M FY16 RESULT UPDATE FEBRUARY 2016
 Q3 & 9M FY16 RESULT UPDATE FEBRUARY 2016 GLOBAL RANKING AND RECOGNITION Wonderla parks were ranked at #1 and #2 in India by Tripadvisor for 2015. Wonderla parks were ranked at #7 and #9 in Asia by TripAdvisor
Q4 & FY17 RESULT UPDATE MAY 2017
 Q4 & FY17 RESULT UPDATE MAY 2017 DISCUSSION SUMMARY Q4 & FY17 RESULT HIGHLIGHTS Q4 & FY17 PORTFOLIO UPDATE AMUSEMENT PARK, BANGALORE RESORT, BANGALORE AMUSEMENT PARK, KOCHI AMUSEMENT PARK, HYDERABAD COMPANY
Q2 & H1 FY16 RESULT UPDATE OCTOBER 2015
 Q2 & H1 FY16 RESULT UPDATE OCTOBER 2015 GLOBAL RANKING AND RECOGNITION Wonderla parks were ranked at #1 and #2 in India by Tripadvisor for 2015. Wonderla parks were ranked at #7 and #9 in Asia by TripAdvisor
Q2 & H1 FY18 RESULT HIGHLIGHTS Q2 & H1 FY18 PORTFOLIO UPDATE AMUSEMENT PARK, BANGALORE RESORT, BANGALORE AMUSEMENT PARK, KOCHI AMUSEMENT PARK,
 Q2 & H1 FY18 RESULT HIGHLIGHTS Q2 & H1 FY18 PORTFOLIO UPDATE AMUSEMENT PARK, BANGALORE RESORT, BANGALORE AMUSEMENT PARK, KOCHI AMUSEMENT PARK, HYDERABAD FINANCIALS COMPANY OVERVIEW 2 Q2 & H1 FY18 RESULT
Q1 FY19 RESULT UPDATE August 2018
 RESULT UPDATE August 2018 RESULT HIGHLIGHTS PORTFOLIO UPDATE AMUSEMENT PARK, BANGALORE RESORT, BANGALORE AMUSEMENT PARK, KOCHI AMUSEMENT PARK, HYDERABAD FINANCIALS COMPANY OVERVIEW 2 RESULT HIGHLIGHTS
Q3 & 9M FY18 RESULT UPDATE February 2018
 Q3 & 9M FY18 RESULT UPDATE February 2018 Q3 & 9M FY18 RESULT HIGHLIGHTS Q3 & 9M FY18 PORTFOLIO UPDATE AMUSEMENT PARK, BANGALORE RESORT, BANGALORE AMUSEMENT PARK, KOCHI AMUSEMENT PARK, HYDERABAD FINANCIALS
Q4 & FY16 RESULT UPDATE MAY 2016
 Q4 & FY16 RESULT UPDATE MAY 2016 GLOBAL RANKING AND RECOGNITION Wonderla parks were ranked at #1 and #2 in India by Tripadvisor for 2015. Wonderla parks were ranked at #7 and #9 in Asia by TripAdvisor
Q4 & FULL YEAR FY15 RESULTS UPDATE MAY 2015
 Q4 & FULL YEAR FY15 RESULTS UPDATE MAY 2015 DISCUSSION SUMMARY Q4 & FY15 RESULTS HIGHLIGHTS OUR PORTFOLIO UPDATE AMUSEMENT PARK, BANGALORE RESORT, BANGALORE AMUSEMENT PARK, KOCHI AMUSEMENT PARK, HYDERABAD
Indiabulls Real Estate Limited (CIN : L45101DL2006PLC148314)
") Indiabulls Real Estate Limited (CIN : L45101DL2006PLC148314) Earnings Update Audited Financial Results FY 2013-14 April 23, 2014 Safe Harbor Statement This document contains certain forward looking statements
Indiabulls Real Estate Limited (CIN : L45101DL2006PLC148314) Earnings Update Audited Financial Results FY 2013-14 April 23, 2014 Safe Harbor Statement This document contains certain forward looking statements
Nicco Parks & Resorts Ltd BSE Scrip Code:
 Nicco Parks & Resorts Ltd BSE Scrip Code: 526721 Other Leisure Facilities September 14, 2012 Equity Statistics Current Market Price Rs. 15.9 52 Week High / Low Rs. 24.4/15.2 Market Capitalisation Rs. crores
M2 Group Ltd 2014 Interim Results
 M2 Group Ltd 2014 Interim Results 24 February 2014 Geoff Horth, CEO Presentation Content Record Financial Performance Strong Organic Growth FY14 Priorities and Guidance Slide 2, 24 February 2014 Record
ERW. 022/ ACC003/ th February Subject: Management's Discussion and Analysis period ending 31 st December 2012
 ERW. 022/ ACC003/56 26 th February 2013 Subject: Management's Discussion and Analysis period ending 31 st December 2012 Attention: The President, The Stock Exchange of Thailand Dear Sir, The Erawan Group
Fourth Quarter and Full Year 2009
 Investor and analyst meeting: Fourth Quarter and Full Year 29 25 th February 21 2 The views expressed here contain some information derived from publicly available sources that have not been independently
DLF Ltd. Q1 Analyst Presentation
 DLF Ltd. Q1 Analyst Presentation 1 Results at a Glance Q1 Sl.No. Consolidated Financials 1Q FY08 Rs. In Crores A) 1 Sales and Other Receipts 3074 2 Other Income 47 Percentage of Total Revenue Margins(%)
JET AIRWAYS (I) LTD. Presentation on Financial Results Q3 2012
 LTD. Presentation on Financial Results Q3 2012") JET AIRWAYS (I) LTD Presentation on Financial Results Q3 2012 20.01.2012 1 1 1 Domestic operating environment 2 2 2 Domestic industry. 8.00 7.00 6.00 5.00 4.00 3.00 Q3 12 vs Q3 11 Industry capacity 17%
JET AIRWAYS (I) LTD Presentation on Financial Results Q3 2012 20.01.2012 1 1 1 Domestic operating environment 2 2 2 Domestic industry. 8.00 7.00 6.00 5.00 4.00 3.00 Q3 12 vs Q3 11 Industry capacity 17%
MGM Resorts International Reports Second Quarter Financial Results
 NEWS RELEASE MGM Resorts International Reports Second Quarter Financial Results 8/5/2014 Consolidated Adjusted EBITDA Increased 8%, Led By 10% Growth In Wholly Owned Domestic Resorts MGM China Declares
JET AIRWAYS (I) LTD. Presentation on Financial Results Q4 FY08
 LTD. Presentation on Financial Results Q4 FY08") JET AIRWAYS (I) LTD Presentation on Financial Results Q4 FY08 June 24, 2008 1 1 1 Agenda Domestic operating environment Jet Airways performance highlights JetLite performance highlights Consolidated Jet
JET AIRWAYS (I) LTD Presentation on Financial Results Q4 FY08 June 24, 2008 1 1 1 Agenda Domestic operating environment Jet Airways performance highlights JetLite performance highlights Consolidated Jet
Creating Happiness. Business Model. Business Mission
 Business Model Creating Happiness Oriental Land Co., Ltd. (OLC) was established with a strong aspiration to create a large-scale recreational facility, right here in Japan when Maihama was still a part
JET AIRWAYS (I) LTD. Presentation on Financial Results Q July 24, 2009
 LTD. Presentation on Financial Results Q July 24, 2009") JET AIRWAYS (I) LTD Presentation on Financial Results Q1 2010 July 24, 2009 1 1 1 Agenda Domestic operating environment Jet Airways performance highlights JetLite performance highlights Outlook 2 2 2 Domestic
JET AIRWAYS (I) LTD Presentation on Financial Results Q1 2010 July 24, 2009 1 1 1 Agenda Domestic operating environment Jet Airways performance highlights JetLite performance highlights Outlook 2 2 2 Domestic
Investor Presentation
 Investor Presentation ICR XChange January 17, 2008 Forward-Looking Statements Some of the statements in this presentation constitute forward-looking statements. Forward-looking statements relate to expectations,
All Time High Quarter I Results, FY Net Sales up 35.7 %, EBITDA up 65.6 %, Net profit up 55.8%
 All Time High Quarter I Results, FY 2014-15 Net Sales up 35.7 %, EBITDA up 65.6 %, Net profit up 55.8% Mumbai, July 30, 2014: Pharma Major, Lupin Ltd. reported its performance for the first quarter ending
Financial Results Q1 FY September 2017
 Financial Results Q1 FY18 12 September 2017 2 Key Highlights Q1FY18 Net profit after tax of INR 58cr Ninth successive profitable quarter for the Group Gross debt reduced by INR 398cr and net debt almost
JET AIRWAYS (I) LTD. Presentation on Financial Results Q2 FY10
 LTD. Presentation on Financial Results Q2 FY10") JET AIRWAYS (I) LTD Presentation on Financial Results Q2 FY10 October 27, 2009 1 1 1 Agenda Domestic operating environment Jet Airways performance highlights JetLite performance highlights Outlook 2 2
JET AIRWAYS (I) LTD Presentation on Financial Results Q2 FY10 October 27, 2009 1 1 1 Agenda Domestic operating environment Jet Airways performance highlights JetLite performance highlights Outlook 2 2
Quarterly Meeting # 2/2014
 Quarterly Meeting # 2/2014 Performance & Outlook 15 May 2014 The views expressed here contain some information derived from publicly available sources that have not been independently verified. No representation
ERW. 083/ ACC012/ th November Subject: Management's Discussion and Analysis period ending 30 th September 2012
 ERW. 083/ ACC012/55 12 th November 2012 Subject: Management's Discussion and Analysis period ending 30 th September 2012 Attention: The President, The Stock Exchange of Thailand Dear Sir, The Erawan Group
Brigade Group. Investor Presentation Q2 FY
 Brigade Group Investor Presentation Q2 FY 2014 15 Q2 FY 15 Key Highlights Standalone Q2 FY 2014 15 Revenue of Rs. 3.29 Bn (82% Y o Y increase) and PAT of Rs. 0.22 Bn (13% Y o Y increase) Standalone YTD
Royal Orchid Hotels Ltd Q4FY17 & FY17 Results Presentation. Expect more from Royal Orchid Hotels
 Royal Orchid Hotels Ltd Q4FY17 & FY17 Results Presentation Expect more from Royal Orchid Hotels 1 in every 11 people worldwide are employed by TOURISM SECTOR High Employment Potential Sector Rs 10 Lakhs
OPERATING AND FINANCIAL HIGHLIGHTS
 Copa Holdings Reports Net Income of US$32.0 Million and EPS of US$0.72 for the Second Quarter of 2012 Excluding special items, adjusted net income came in at $58.6 million, or EPS of $1.32 per share Panama
Helloworld Travel Limited results announcement Half year ended 31 December 2017
 Helloworld Travel Limited results announcement Half year ended 31 December 2017 HIGHLIGHTS FOR THE HALF YEAR ENDED 31 DECEMBER 2017 Total Transaction Value (TTV) growth of 2.7% to $2.968 billion. Earnings
Financial Results Q3 FY16
 Financial Results Q3 FY16 6 February 2016 Agenda Key performance highlights Jet Airways performance highlights JetLite performance highlights 2 Key highlights Highest ever quarterly and period profit Jet
Sub. Rev Eng. Ad. Rev Hin. Ad. Rev Ver. Ad. Rev.
 June 2015 1 2 Print Industry Revenues (Rs bn) Media Spend as % of GDP 243 224 209 193 51 46 42 36 50 45 37 41 53 57 59 62 263 57 54 65 67 69 75 81 87 2010 2011 2012 2013 2014 Sub. Rev Eng. Ad. Rev Hin.
Summary of Results for the First Three Quarters FY2015/3
 Summary of Results for the First Three Quarters FY2015/3 February 10, 2015 Tokyu Corporation (9005) http://www.tokyu.co.jp/ Contents Ⅰ.Executive Summary 2 Ⅱ.Conditions in Each Business 5 Ⅲ.Details of Financial
Highlights from the Annual Results December 2007
 Highlights from the Annual Results December 2007 Disclaimer The information in this document is taken from the BAA 2007 Annual Results ( the Results ) which were published on 11 March 2008 and other public
Corporate Presentation 2012/13 Interim Results
 Corporate Presentation 2012/13 Interim Results 26 February 2013 0 Disclaimer The information contained in this presentation is intended solely for your personal reference. Such information is subject to
Interim Report 6m 2014
 August 11, 2014 Interim Report 6m 2014 Investors and Analysts Conference Call on August 11, 2014 Joachim Müller, CFO Latest ad-hoc release (August 4, 2014) Reduction of forecast, primarily due to a further
SET Opportunity Day #3/2011
 SET Opportunity Day #3/2011 2Q11 & 1H11 Performance & Outlook 18 August 2011 The views expressed here contain some information derived from publicly available sources that have not been independently verified.
TUI GROUP INVESTOR PRESENTATION
 TUI GROUP INVESTOR PRESENTATION German Investment Conference UniCredit / Kepler Munich, 26-27 September 2012 Future-related statements This presentation contains a number of statements related to the future
DLF Limited. Q2 Analyst Presentation
 DLF Limited Q2 Analyst Presentation 1 Results at a Glance Q2 Q2 FY08 Percentage Sl.No. Consolidated Financials Rs. Crs. of Total Revenue Rs. Crs A) 1 Sales and Other Receipts 3,250 3,074 2 Other Income
RESULTS RELEASE 20 August GENTING HONG KONG GROUP ANNOUNCES FIRST HALF RESULTS FOR 2015 Highlights
 RESULTS RELEASE 20 August 2015 FOR IMMEDIATE RELEASE INTERNATIONAL GENTING HONG KONG GROUP ANNOUNCES FIRST HALF RESULTS FOR 2015 Highlights The commentary below is prepared based on a comparison of the
Corporate Presentation
 Corporate Presentation ASEAN Conference 2011 Singapore gp September 2011 1 Our Vision: To be the leading Leisure, Hospitality & Entertainment t t Corporation in the world 2 Agenda Introduction Financial
Investor update presentation. November 2016
 Investor update presentation November 2016 Content Update on Q3 2016 financial performance 3-8 Recap on ATG Evolution 9-10 Update on hospitality strategic business unit 11-14 Update on online travel and
2011 Full Year Result
 2011 Full Year Result 23 February 2012 CEO Brett Chenoweth CFO Peter Myers 1 Financial results for 2011 FY 2011 AUD millions 2011 2010 Δ% Revenue 1,072.4 1,059.1 1% EBITDA* 208.9 244.3 (14%) EBIT* 171.4
Preliminary Figures FY 2016
 February 14, 2017 Preliminary Figures FY 2016 Capital Markets Day 2017 Tom Blades (CEO) Disclaimer This presentation has been produced for support of oral information purposes only and contains forwardlooking
IPO Report LEMON TREE HOTELS LTD AVOID. Valuation. IPO Details o. Research Analyst : Astha Jain
 IPO Report LEMON TREE HOTELS LTD AVOID IPO Details o Issue Date 26 th Mar-28 th Mar 2018 Price Band 54-56/Share Bid Lot 265 & in multiplethere of Face Value Rs 10/Share Listing BSE, NSE Offer For Sale
Brigade Group Investor Presentation Q1 FY
 Brigade Group Investor Presentation Q1 FY 2015 16 (CIN: L85110KA1995PLC019126) Q1 FY 16 Key Highlights Consolidated Q1 FY 2015 16 Revenue was Rs. 3,537 Mn (83% increase over Q1 FY15; 9% decrease over Q4
AGENDA. Group overview. Financial highlights. Operational highlights. Expansion plans
 1 AGENDA Group overview Financial highlights Operational highlights Expansion plans 2 3 CURRENT FOOTPRINT Kenya 12 stores 2 DCs Tanzania 2 stores Number of stores 31-Dec-16 31-Dec-17 Increase: Dec-16 to
PRESS RELEASE / NOTICE TO INVESTORS
 March 25, 2015 PRESS RELEASE / NOTICE TO INVESTORS El Al's CEO David Maimon and its CFO, Dganit Palti, today presented the financial statements for the fourth quarter of 2014 In 2014 the Company's revenues
Jet Airways (India) Ltd. Presentation on Financial Results Q3 FY th January 2008
 Ltd. Presentation on Financial Results Q3 FY th January 2008") Jet Airways (India) Ltd. Presentation on Financial Results Q3 FY08 28 th January 2008 1 1 1 Agenda Performance highlights Q3 FY08 Apr - Dec FY08 Outlook JetLite performance highlights 2 2 2 Performance
Jet Airways (India) Ltd. Presentation on Financial Results Q3 FY08 28 th January 2008 1 1 1 Agenda Performance highlights Q3 FY08 Apr - Dec FY08 Outlook JetLite performance highlights 2 2 2 Performance
Nicco Parks & Resorts Limited
 Nicco Parks & Resorts Limited 15 th June 2015 Nicco Park the 1 st theme park of Eastern India has come a long way since it s opening on 13 th October 1991. The park has had the pleasure of hosting about
Corporate Presentation. Genting Malaysia Berhad ( GENM ) May 2012
 May 2012") Corporate Presentation Genting Malaysia Berhad ( GENM ) May 2012 1 Agenda Introduction Financial Highlights Malaysian Operations Resorts World Genting Overseas Operations United Kingdom United States Looking
Corporate Presentation Genting Malaysia Berhad ( GENM ) May 2012 1 Agenda Introduction Financial Highlights Malaysian Operations Resorts World Genting Overseas Operations United Kingdom United States Looking
Investor update presentation. August 2016
 Investor update presentation August 2016 Content Update on Q2 2016 financial performance 4-8 Update on hospitality projects 10-11 Update on E-commerce businesses 13-16 2 Section 1 Update on Q2 2016 financial
Presentation to Investors as of 12 September 2018
 as of Table of contents The Philippine Economy 3 About Belle Corporation 4 Property 9 Gaming 11 Track Record 15 Financials 17 2 Million tourists Philippines : strong macroeconomic fundamentals Young workforce
Copa Holdings Reports Record Earnings of US$41.8 Million for 4Q06 and US$134.2 Million for Full Year 2006
 Copa Holdings Reports Record Earnings of US$41.8 Million for 4Q06 and US$134.2 Million for Full Year 2006 Panama City, Panama --- March 7, 2007. Copa Holdings, S.A. (NYSE: CPA), parent company of Copa
Quarterly Meeting# 1/2018
 Quarterly Meeting# 1/2018 4Q17 & FY17 Performance & Outlook 2 March 2018 1 2016 ERAWAN. All rights reserved. The views expressed here contain some information derived from publicly available sources that
OPERATING AND FINANCIAL HIGHLIGHTS
 Copa Holdings Reports Financial Results for the Fourth Quarter of 2015 Excluding special items, adjusted net income came in at $31.7 million, or EPS of $0.73 per share Panama City, Panama --- February
Summary of Results for the First Quarter of FY2015/3
 Summary of for the First Quarter of FY2015/3 August 8, 2014 Tokyu Corporation (9005) http://www.tokyu.co.jp/ Contents Ⅰ.Executive Summary 2 Ⅱ.Conditions in Each Business 4 Ⅲ.Details of Financial for the
OPERATING AND FINANCIAL HIGHLIGHTS. Subsequent Events
 Copa Holdings Reports Net Income of $103.8 million and EPS of $2.45 for the Third Quarter of 2017 Excluding special items, adjusted net income came in at $100.8 million, or EPS of $2.38 per share Panama
For personal use only
 HELLOWORLD TRAVEL LIMITED RESULTS ANNOUNCEMENT Highlights for the year ended 30 June 2018 Total Transaction Value (TTV) growth of 3.5% to $6.1 billion, underpinned by strong air ticket sales volume growth.
OPERATING AND FINANCIAL HIGHLIGHTS SUBSEQUENT EVENTS
 Copa Holdings Reports Financial Results for the Third Quarter of 2016 Excluding special items, adjusted net income came in at $55.3 million, or adjusted EPS of $1.30 per share Panama City, Panama --- November
2007/08 Interim Results
 Bossini International Holdings Limited 2007/08 Interim Results For the six months ended 31 December 2007 Corporate Presentation 19 March 2008 0 Agenda Results Highlights Review of Operations Future Plans
Lemon Tree Hotels Limited
 Lemon Tree Hotels Limited Q4 & FY18 Earnings Presentation May 25, 2018 Disclaimer Certain statements in this communication may be forward looking statements within the meaning of applicable laws and regulations.
--- Disclosure A uirements) A~ulatlons October 24, 2018 IGAUSECT / /1 0
 A~ulatlons October 24, 2018 IGAUSECT / /1 0") October 24, 2018 IGAUSECT /1 0-1 8/1 0 To National Stock Exchange of India limited Exchange Plaza, C - 1, Block G Sandra Kurla Complex Sandra - (E) Mumbai - 400 051 Symbol: INDIGO To Department of Corporate
October 24, 2018 IGAUSECT /1 0-1 8/1 0 To National Stock Exchange of India limited Exchange Plaza, C - 1, Block G Sandra Kurla Complex Sandra - (E) Mumbai - 400 051 Symbol: INDIGO To Department of Corporate
Royal Orchid Hotels Investor Presentation Q2FY17. Expect more from Royal Orchid Hotels
 Royal Orchid Hotels Investor Presentation Q2FY17 Expect more from Royal Orchid Hotels 1 in every 11 people worldwide are employed by TOURISM SECTOR High Employment Potential Sector Rs 10 Lakhs of Investment
Peppers Docklands, Melbourne
 Peppers Docklands, Melbourne Contents Mantra Group Overview State of Market 8 3 Australian Market Mantra Group 18 24 Mantra Salt, Kingscliff Peppers Noosa, Noosa Mantra Group* CBD - RevPAR (A$) Largest
Presentation to Investors as of 8 November 2018
 as of Table of contents The Philippine Economy 3 About Belle Corporation 4 Property 9 Gaming 11 Track Record 15 Financials 17 2 Million tourists Philippines : strong macroeconomic fundamentals Young workforce
OPERATING AND FINANCIAL HIGHLIGHTS
 Copa Holdings Reports Financial Results for the Fourth Quarter of 2018 Excluding special items, adjusted net profit came in at $44.0 million, or Adjusted EPS of $1.04 Panama City, Panama --- February 13,
9M 13 Results. October 31, M 13 Results.
 October 31, 2013 www.atresmediacorporacion.com 1 9M 13 Highlights According to Infoadex, Total Ad market declined by -12.6% in 9M 13 (TV and Radio down by -10.4% and -12.7% yoy respectively) Atresmedia
Summary o f Results for the First Half of FY2018
 Summary o f Results for the First Half of FY2018 November 9, 2018 (9005) https://www.tokyu.co.jp/ Contents Ⅰ.Executive Summary 2 Ⅱ.Conditions in Each Business 6 Ⅲ.Details of Financial Results for the 13
75 Years of Thrills and Entertainment. The Rank Group Plc Preliminary Results to 30 June 2012
 75 Years of Thrills and Entertainment The Rank Group Plc Preliminary Results to 30 June 2012 Agenda Introduction Ian Burke, chairman and chief executive Review of financial results Clive Jennings, finance
1H 13 Results. July 25th, H 13 Results.
 July 25th, 2013 www.atresmediacorporacion.com 1 1H 13 Highlights According to Infoadex, Total Ad market declined by -14% in 1H 13 (TV and Radio down by -13% and -14% yoy respectively) Atresmedia Television
GMR Infrastructure Limited, Q1-FY 11 Performance Highlights. Financial Highlights for Q (Rs. Cr.)
") Press release Bangalore, 08 th Aug, 2010 GMR Infrastructure Limited, Q1-FY 11 Performance Highlights Financial Highlights for Q1 2010-11 (Rs. Cr.) Particulars 30th June 10 30th June 09 % change 31st March
Press release Bangalore, 08 th Aug, 2010 GMR Infrastructure Limited, Q1-FY 11 Performance Highlights Financial Highlights for Q1 2010-11 (Rs. Cr.) Particulars 30th June 10 30th June 09 % change 31st March
MGM MIRAGE Reports Record Second Quarter Revenue, Cash Flow and Net Income
 NEWS RELEASE MGM MIRAGE Reports Record Second Quarter Revenue, Cash Flow and Net Income 7/24/2001 PRNewswire LAS VEGAS MGM MIRAGE (NYSE: MGG) today reported earnings of 47 cents per diluted share for the
PRESS RELEASE. First Half 2017 Financial Results Higher Load Factors and traffic lead to a significant rebound in second quarter profitability
 PRESS RELEASE First Half 2017 Financial Results Higher Load Factors and traffic lead to a significant rebound in second quarter profitability Kifissia, 12 September 2017 AEGEAN announces first half 2017
Copa Holdings Reports Net Income of US$113.9 Million for the Fourth Quarter of 2013
 Copa Holdings Reports Net Income of US$113.9 Million for the Fourth Quarter of 2013 Panama City, Panama --- February 12, 2014. Copa Holdings, S.A. (NYSE: CPA), today announced financial results for the
HOPEWELL HOLDINGS LIMITED ANNOUNCES FY 2018/19 INTERIM RESULTS
 Press Release HOPEWELL HOLDINGS LIMITED ANNOUNCES FY 2018/19 INTERIM RESULTS Highlights 1H FY19 (1 April to 30 September 2018) First financial year after the change of financial year end date from 30 June
OPERATING AND FINANCIAL HIGHLIGHTS. Subsequent Events
 Copa Holdings Reports Net Income of US$113.1 Million and EPS of US$2.57 for the First Quarter of 2015 Excluding special items, adjusted net income came in at US$106.0 million, or EPS of US$2.41 per share
Copa Holdings Reports Net Income of $49.9 million and EPS of $1.18 for the Second Quarter of 2018
 Copa Holdings Reports Net Income of $49.9 million and EPS of $1.18 for the Second Quarter of 2018 Panama City, Panama --- Aug 8, 2018. Copa Holdings, S.A. (NYSE: CPA), today announced financial results
Quarterly Meeting# 4/2018
 Quarterly Meeting# 4/2018 3Q18 & 9M18 Performance & Outlook 14 November 2018 1 2016 ERAWAN. All rights reserved. The views expressed here contain some information derived from publicly available sources
1Q13 R sults esentation
 1Q13 Results Presentation 14 May 2013 Disclaimer The presentation is dated the day it is given. The delivery of this presentation shall not, under any circumstances, create any implication that there has
Quarterly Meeting# 2/2017
 Quarterly Meeting# 2/2017 1Q17 Performance & Outlook 16 May 2017 1 2017 ERAWAN. All rights reserved. The views expressed here contain some information derived from publicly available sources that have
Performance of Q1 2017
 Performance of Q1 2017 Business Overview FPT BAFS was founded in 1983 by the Cabinet Resolution to provide aircraft refueling system services. The scope of services comprises of : I. Aviation fuel storage
Air China Limited Annual Results. March Under IFRS
 Air China Limited 21 Annual Results Under IFRS March 211 Agenda Part 1 Highlights Part 2 Business Overview Part 3 Financial Overview Part 4 Outlook 2 Part 1 Highlights Steady Economic Growth; Asia Pacific
Lemon Tree Hotels Limited
 Lemon Tree Hotels Limited Q1 FY19 Earnings Presentation Aug 13, 2018 Disclaimer Certain statements in this communication may be forward looking statements within the meaning of applicable laws and regulations.
Copa Holdings Reports Net Income of $136.5 million and EPS of $3.22 for the First Quarter of 2018
 Copa Holdings Reports Net Income of $136.5 million and EPS of $3.22 for the First Quarter of 2018 May 9, 2018 PANAMA CITY, May 9, 2018 /PRNewswire/ -- Copa Holdings, S.A. (NYSE: CPA), today announced financial
Financial Results Q2 FY November 2016
 Financial Results Q2 FY17 11 November 2016 2 Agenda Key performance highlights Jet Airways performance highlights 3 Key highlights Net profit after tax of INR 84.9 crores - Sixth successive profitable
Q1 FY18 Earnings Presentation 17 July 2017
 Q1 FY18 Earnings Presentation 17 July 2017 Highlights- Q1FY18 Total System Revenues at Rs. 6,788 mn, growth at 11.5%% Domino s Pizza Same Store Sales Growth (SSG) at 6.5% JFL EBITDA at Rs. 796 mn, 11.7%
Royal Orchid Hotels Ltd Q1FY18 Results Presentation. Expect more from Royal Orchid Hotels
 Royal Orchid Hotels Ltd Q1FY18 Results Presentation Expect more from Royal Orchid Hotels 1 in every 11 people worldwide are employed by TOURISM SECTOR High Employment Potential Sector Rs 10 Lakhs of Investment
Cairo, May 21, TMG Holding reports EGP BN consolidated revenue, EGP 161 MN consolidated net profit
 First Quarter ending Earning Release Cairo, May 21, - reports EGP 1.139 BN consolidated revenue, EGP 161 MN consolidated net profit after minority and EGP 2.2 BN of new sales value for the first quarter
Tiger Airways Holdings Limited FY11 Results
 Tiger Airways Holdings Limited FY11 Results May 2011 Financial Year Ended 31 March 2011 Disclaimer The information contained in this presentation (the "Information") is provided by Tiger Airways Holdings
China Lodging Group (HTHT.US) Q4 and full year 2017 Earnings Call March 13, 2018
 Q4 and full year 2017 Earnings Call March 13, 2018") China Lodging Group (HTHT.US) Q4 and full year 2017 Earnings Call March 13, 2018 Agenda Strategy Review Operational and Financial Review Q & A Appendix 1 Strong RevPAR Growth Driven by ADR + Occupancy
China Lodging Group (HTHT.US) Q4 and full year 2017 Earnings Call March 13, 2018 Agenda Strategy Review Operational and Financial Review Q & A Appendix 1 Strong RevPAR Growth Driven by ADR + Occupancy
JAPAN AIRLINES Co., Ltd. Financial Results 1 st Quarter Mar/2017(FY2016) July 29, 2016
 July 29, 2016") JAPAN AIRLINES Co., Ltd. Financial Results Mar/2017(FY2016) July 29, 2016 Today s Topics P.1 P.2 P.13 From the first quarter of this fiscal year, figures for Revenue Passengers Carried, ASK, RPK and Load
JAPAN AIRLINES Co., Ltd. Financial Results Mar/2017(FY2016) July 29, 2016 Today s Topics P.1 P.2 P.13 From the first quarter of this fiscal year, figures for Revenue Passengers Carried, ASK, RPK and Load
The Property Franchise Group
 The Property Franchise Group Capital Markets Event 22 October 2015 This afternoon s agenda 2 15:15 Welcome Richard Martin, Chairman 15:20 Introduction to MartinCo PLC Ian Wilson, Chief Executive Officer
FIRST QUARTER RESULTS 2017
 FIRST QUARTER RESULTS 2017 KEY RESULTS In the 1Q17 Interjet total revenues added $4,421.5 million pesos that represented an increase of 14.8% over the income generated in the 1Q16. In the 1Q17, operating
Interim Report 3m Bilfinger Berger SE, Mannheim May 10, 2012 Joachim Müller, CFO
 Interim Report 3m 2012 Bilfinger Berger SE, Mannheim May 10, 2012 Joachim Müller, CFO Bilfinger Berger SE Interim report 3m 2012 May 10, 2012 Page 1 3m 2012: Highlights Growth in output volume and orders
Earnings Report 1 st Quarter 2016 Grupo Viva Aerobus
 Earnings Report 1 st Quarter 2016 Grupo Viva Aerobus Grupo Viva Aerobus announces results for the first quarter of 2016 Mexico City, Mexico, April 29, 2016- Grupo Viva Aerobus S.A. de C.V. ( Grupo Viva
An Overview of SATS. Cho Wee Peng, CFO SIAS Corporate Profile & Investment Seminar 30 November 2013
 An Overview of SATS Cho Wee Peng, CFO SIAS Corporate Profile & Investment Seminar 30 November 2013 Forward Looking Statements This presentation may contain forward-looking statements regarding, among other
Imagica : Heralding a new era in outdoor entertainment
 Investor Presentation February 2018 Safe Harbour This presentation and the accompanying slides (the Presentation ), which have been prepared by Adlabs Entertainment Limited (the Company ), have been prepared
Minor International Public Company Limited
 Minor International Public Company Limited Management Discussion & Analysis MINT s financial performance as of 30th September 2008 Summary of Key Financial Performance 3Q08 Performance Minor International
Investor Presentation
 TUI Group Investor Presentation WestLB Deutschland Conference 2010 17 November 2010 TUI AG Investor Relations Seite 1 Future-related related statements This presentation contains a number of statements
Management Presentation. March 2016
 Management Presentation March 2016 Forward looking statements This presentation as well as oral statements made by officers or directors of Allegiant Travel Company, its advisors and affiliates (collectively