Beautiful City: Urban Growth, Leisure, and Aesthetics. Jerry Carlino Albert Saiz
|
|
|
- Dominic Green
- 5 years ago
- Views:
Transcription
1 Beautiful City: Urban Growth, Leisure, and Aesthetics Jerry Carlino Albert Saiz
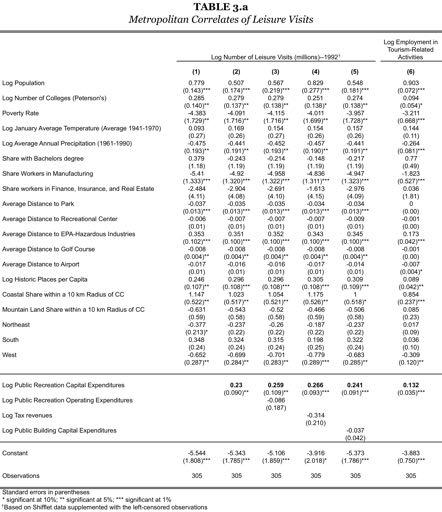
2 Main Message I Revision of extant working paper What drives urban and residential real estate growth in the USA? Increased role of amenities: consumer city hypothesis. But how important quantitatively? Need measurements of leisure amenities and environmental and architectural beauty
3 Measuring Urban Lifestyle Amenities How do you measure city lifestyle attraction? Places that are attractive places for leisure activities generate more touristic visits: NYC, Paris, Florence, Barcelona, London, Singapore, Tokyo Fractal version at the US urban level More visits More employment in tourism-related activities Revealed preference for aesthetics: online user generated picturesque location Detour: validate online photo frequency as a measure of aesthetics
4 Main Message II Provide some measurable correlates of city attractiveness Evaluate the different importance of characteristics that make a city attractive for leisure activities in the US
5 Main Message III Study the correlates of urban growth and housing demand in the United States (descriptive) What is the relative strength of urban growth predictors in the USA?
6 Tourism Data Proprietary: D.K. Shifflet and Associates Destinations for individuals who traveled for leisure purposes Mailing of 180,000 households in 1992 Returned samples are re-balanced to be representative of the U.S. population Sample of 155 MSAs: top destinations
7 Imputation Use variables that explain tourism and alternative measure of tourism activity: number of employees in tourism-related activities Hotels Air travel Amusement/recreation The latter variable is very strongly associated with observable tourism visits in noncensored observations
8 Estimated Tourism Trips and Employment Atlantic City Leisure-travel-based Measure Orlando Myrtle Beach Knoxville Lancaster Flagstaff San Nashville-Davidson Diego Asheville(balance) San Francisco Oklahoma Columbus San City Austin Antonio NorfolkAtlanta Indianapolis Tampa Erie New City Orleans (balance) Sioux FallsRapid City St. Louis Chattanooga Harrisburg Santa Cincinnati Charlotte Madison Barbara Washington New Jacksonville Green Lexington-Fayette York Galveston Bay Biloxi Birmingham Cleaveland Buffalo Amarillo Des Moines Daytona Dallas Denver Menphis Panama City Portland Savannah Houston Raleigh Beach Lubbock Los Louisville Albuquerque Angeles Richmond Minneapolis Omaha Springfield Pittsburgh Corpus Gainesville Chicago Christi Charlottesville Springfield Tucson Phoenix Salinas Colorado Springs Billings Little Rock Kansas Lincoln City Charleston Mobile Philadelphia Shreveport Rochester Tulsa Burlington Santa Fe Baltimore Albany SyracuseState Milwaukee Spokane BostonColumbia Duluth Roanoke Salt Lake Seattle City Toledo Montgomery Dayton Pensacola Ocala Greensboro Topeca CollegeWichita ColumbiaFargo PeoriaTallahassee Wilmington Huntsville Eugene Medford Portland Reading Naples Baton Bakersfield Cedar Rapids Salem Rouge Waco Allentown Charleston Santa Rosa Rochester Boise City Fort Myers Grand Fayetteville Detroit Rapids San Jose Fort Lauderdale Fresno Fort Lansing Riverside Miami Wayne South Bend Macon Sarasota Augusta-Richmond Rockford County (balance) Appleton Jackson Greenville Akron Fort Worth El Tacoma Paso Hartford West Palm Beach Oakland Newark Las Vegas Reno Employment-based Measure
9
10 (DETOUR) Crowdsourcing Architectural Beauty: Online Photo Frequency Predicts Building Aesthetic Ratings (Forthcoming at PlosOne) Albert Saiz Arianna Salazar Massachusetts Institute of Technology
11 What? We demonstrate that the local frequency photos posted by internet users in two photo-sharing websites (Panoramio and Flicker) and geotagged around a building strongly predicts its subjective beauty ratings by independent raters. Validates incipient literature using online photo frequencies and tags with independent separate rating survey
12 Why? Many factors may affect the propensity of internet users to upload photos. a) Some buildings acquire iconic status, regardless of their potential aesthetic b) Others happen to be in high-traffic (e.g., touristic) areas or cities. c) Users may upload photos for idiosyncratic reasons (noise).problems if: i) the noise to signal ratio is too high for image uploads to be practical; ii) idiosyncratic noise is correlated negatively with the latent variable of interest iii) the aesthetic tastes of people actively sharing online content are substantially different from those of the public at large. Therefore, the use of geotagged image frequencies as proxies for the human appreciation of urban environmental features needs to be validated.

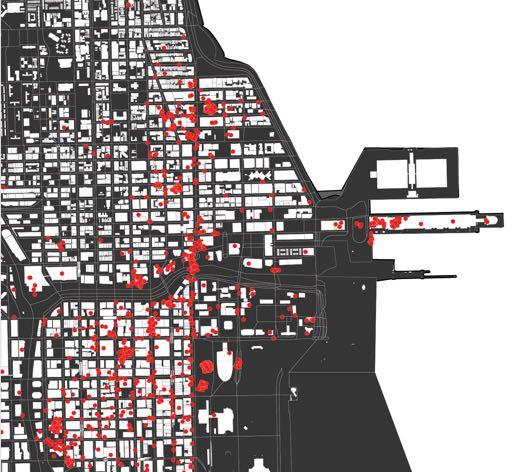
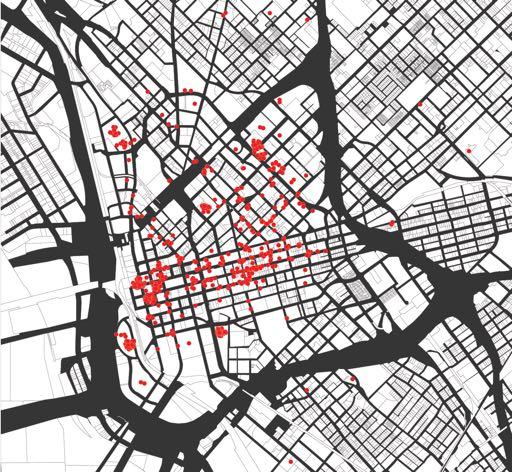
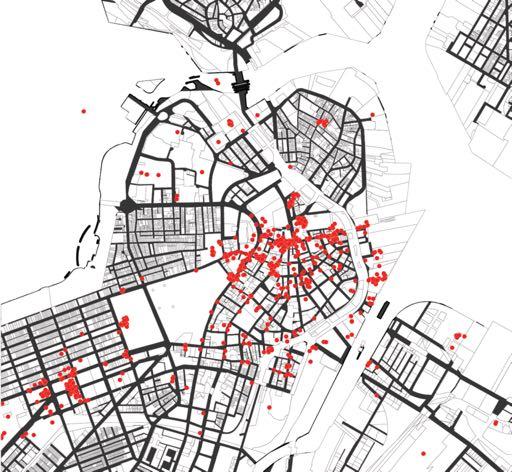
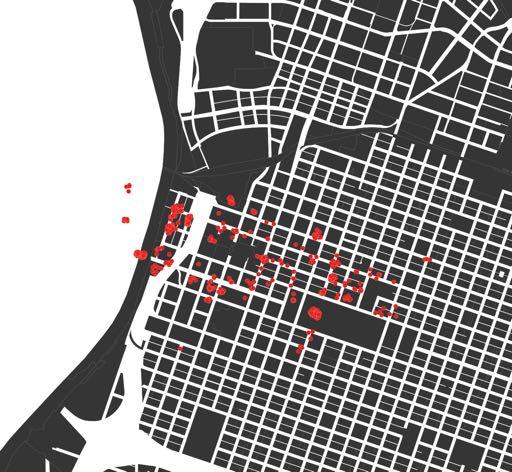
13 Spatial Distribution of Photos Uploaded on Panoramio 2014
14 Matching Photos to Building Calculate rings around each building in the dataset by Emporis (206,216 buildings) Use address of building to geocode Number of photos around each ring akin to probability field: need to use this with LLN in mind! Automatic GPS coordinates from where photos was taken Users position photos with a bias toward locating it at the building s centroid Data consistent with he joint hypothesis that more photos around 50 meters tend to associated with the specific building s beauty
15
16
17
18

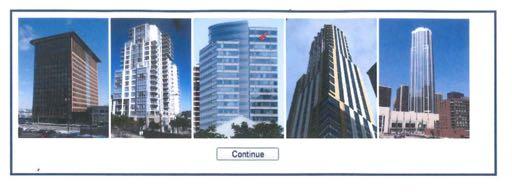
19 Architectural Beauty Survey

20 Beauty is in the Eye of the Rater
21
22 Covariance of subjective beauty with photo frequency Correlate scores of buildings to frequency of photos around building Average Effects: cluster by building Allows to then control by rater characteristics
23 Average survey score Flickr photo uploads frequency of number of images Linear fit Quadratic fit
24 Average survey score Panoramio (2014) photo uploads frequency of number of images Linear fit Quadratic fit
25 More Photos in field implies better independent ratings
26
27 Conditional spatial decay: not contextual Change in survey scores Change in survey scores Distance (meters) Distance (meters) Estimated score gains Moving average Estimated score gains Moving average Linear fit Quadratic fit Linear fit Quadratic fit
28 Correlates of Rated Beauty
29 Observable Beauty Correlates with Localized Photo Frequency
30 Is this driven by tastes of internet junkies?
31
32 Conclusions Local photo frequency seems to capture aspects of perceived beauty of buildings Robust result; extremely difficult to explain otherwise Photo frequencies (as uploaded by internet enthusiasts) capture well ratings of people who seldom post stuff online (END OF DETOUR)
33 Pop.Adjusted Log Panoramio Photos in Flagstaff Fort Collins San Luis Obispo Barnstable Naples Town Bellinghan Las Vegas Rapid City Salinas Fort Myers Santa Barbara Boulder Melbourne Myrtle Beach Redding Santa Cruz Santa Fe Visalia Provo Eugene Burlington Bloomington Asheville Atlantic Grand MissoulaGlenn FallsPortland Reno Riverside Sarasota Fort Junction Walton Colorado Duluth Hagerstown Beach Iowa City Medford Daytona Springs Beach Panama OrlandoCity Tacoma Santa Pittsfield Rosa Tucson San Francisco Galveston Chicago Charleston Austin Charlottesville Corvallis Newburgh Fresno Gainesville Savannah Bremerton Chico Las Punta Cruces Vallejo Gorda New Phoenix Bakersfield London Knoxville Miami Olympia Seattle Portland Tampa West San Buenaventura Palm Beach (Ventura) Salt Lake Albuquerque Richland Fort Pierce Boise Salem City San Jacksonville Diego Pensacola Yuma San Jose City Benton Harbor Ann Harbor Bryan Champaign Casper Cheyenne Fort Fayetteville Lauderdale Pocatello Yakima Lawrence Raleigh State Madison College Lakeland Boston DenverMobile Oakland Providence Norfolk Brownsville Ocala Nashville-Davidson Billings Auburn Bangor Akron Athens Albany Atlanta BismarckBiloxi - Clarke Charlotte Chattanooga Columbia Lancaster (balance) Merced Greeley Scranton Utica Washington Williamsport Eau Cumberland Dallas Claire Grand Lawton Forks Johnstown Fort Los Kenosha Worth Jamestown Johnson Angeles Sheboygan Spokane Lynchburg Minneapolis Syracuse Wilmington New Haven City Grand Rapids County Corpus Dubuque (balance) Christi Amarillo AllentownAlexandria Abilene Buffalo Great Huntsville Lexington-Fayette Falls Greenville Houston Omaha New San Lincoln Columbus Orleans AntonioSpringfield Sioux Falls McAllenPueblo Trenton Harrisburg Fargo Baltimore Dover Augusta-Richmond Baton Bloomington Rouge Cincinnati Binghamton Cleaveland Columbia Indianapolis City (balance) Hamilton Hartford Jacksonville Kankakee Kansas Crosse CityMenphis Roanoke Springfield Sherman Rochester St. Louis Tulsa Richmond Tallahassee Yuba Oklahoma City Racine City Hickory Gary Lafayette El Houma Paso Milwaukee Lafayette Vineland Wausau Columbus Pittsburgh South Davepont Reading Joplin Fort Smith Greensboro City Bend (balance) Little County Cedar Rock Des (balance) Rapids Springfield MoinesGreen Bay Newark Muncie Saginaw Terre Kalamazoo Appleton Louisville Birmingham Erie Florence Jonesboro Philadelphia Tyler Haute Tuscaloosa WheelingWaco New York Parkersburg San Evansville Angelo Topeca York Lansing Macon Charleston Gadsden Longview Detroit KilleenLaredo Montgomery Rochester Lubbock Modesto Wichita Falls St. Cloud Stockton Huntington Odessa Clarkesville Dayton Elkhart Decatur Sharon Elmira Canton Mansfield Decatur Lewiston Rockford Toledo Wichita Peoria Shreveport Janesville Beaumont Flint Lake Hattiesburg Charles Sioux City Youngstown Steubenville Texarkana Florence Fort Wayne JacksonMonroe Sumter Altoona GreenvilleJackson Owensboro St. Joseph Victoria Enid Dothan Jackson Fayetteville Waterloo Jersey City Kokomo Goldsboro Danville Pine Bluff Albany Lima Rocky Mountain Pop.Adjusted Log Million Tourists in 1990
34
35
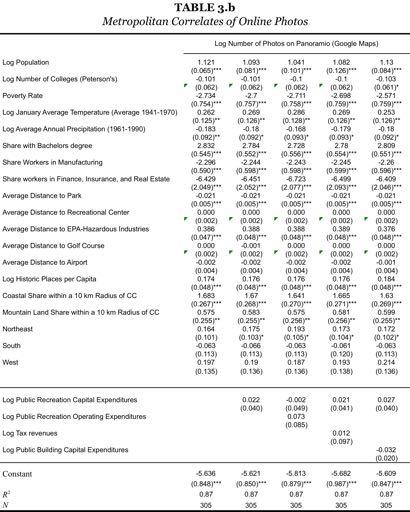
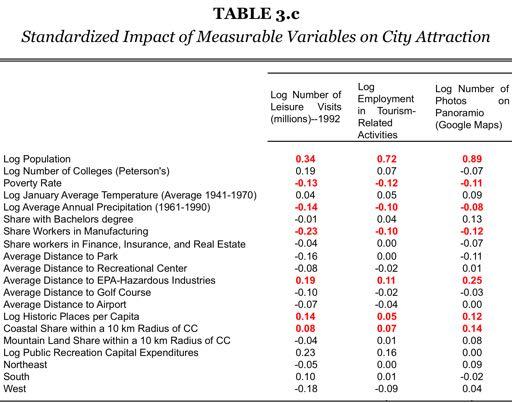
36 Drivers of Attractiveness Reassuringly, the 3 proxies have very similar predictors Perhaps sadly, effect of capital expenditures in recreation on urban beauty does not seem robust, although it may increase expenditures on local tourism
37 Leisure and Picturesqueness Tourism levels and picturesqueness highly correlated even after controlling for population Of course, photos could be endogenous to growth Therefore, use 1992 tourism instrument for 2014 photos!
38
39 Pop.Adjusted Log Panoramio Photos in Flagstaff Fort Collins San Luis Obispo Barnstable Naples Town Bellinghan Las Vegas Rapid City Salinas Fort Myers Santa Barbara Boulder Melbourne Myrtle Beach Redding Santa Cruz Santa Fe Visalia Provo Eugene Burlington Bloomington Asheville Atlantic Grand MissoulaGlenn FallsPortland Reno Riverside Sarasota Fort Junction Walton Colorado Duluth Hagerstown Beach Iowa City Medford Daytona Springs Beach Panama OrlandoCity Tacoma Santa Pittsfield Rosa Tucson San Francisco Galveston Chicago Charleston Austin Charlottesville Corvallis Newburgh Fresno Gainesville Savannah Bremerton Chico Las Punta Cruces Vallejo Gorda New Phoenix Bakersfield London Knoxville Miami Olympia Seattle Portland Tampa West San Buenaventura Palm Beach (Ventura) Salt Lake Albuquerque Richland Fort Pierce Boise Salem City San Jacksonville Diego Pensacola Yuma San Jose City Benton Harbor Ann Harbor Bryan Champaign Casper Cheyenne Fort Fayetteville Lauderdale Pocatello Yakima Lawrence Raleigh State Madison College Lakeland Boston DenverMobile Oakland Providence Norfolk Brownsville Ocala Nashville-Davidson Billings Auburn Bangor Akron Athens Albany Atlanta BismarckBiloxi - Clarke Charlotte Chattanooga Columbia Lancaster (balance) Merced Greeley Scranton Utica Washington Williamsport Eau Cumberland Dallas Claire Grand Lawton Forks Johnstown Fort Los Kenosha Worth Jamestown Johnson Angeles Sheboygan Spokane Lynchburg Minneapolis Syracuse Wilmington New Haven City Grand Rapids County Corpus Dubuque (balance) Christi Amarillo AllentownAlexandria Abilene Buffalo Great Huntsville Lexington-Fayette Falls Greenville Houston Omaha New San Lincoln Columbus Orleans AntonioSpringfield Sioux Falls McAllenPueblo Trenton Harrisburg Fargo Baltimore Dover Augusta-Richmond Baton Bloomington Rouge Cincinnati Binghamton Cleaveland Columbia Indianapolis City (balance) Hamilton Hartford Jacksonville Kankakee Kansas Crosse CityMenphis Roanoke Springfield Sherman Rochester St. Louis Tulsa Richmond Tallahassee Yuba Oklahoma City Racine City Hickory Gary Lafayette El Houma Paso Milwaukee Lafayette Vineland Wausau Columbus Pittsburgh South Davepont Reading Joplin Fort Smith Greensboro City Bend (balance) Little County Cedar Rock Des (balance) Rapids Springfield MoinesGreen Bay Newark Muncie Saginaw Terre Kalamazoo Appleton Louisville Birmingham Erie Florence Jonesboro Philadelphia Tyler Haute Tuscaloosa WheelingWaco New York Parkersburg San Evansville Angelo Topeca York Lansing Macon Charleston Gadsden Longview Detroit KilleenLaredo Montgomery Rochester Lubbock Modesto Wichita Falls St. Cloud Stockton Huntington Odessa Clarkesville Dayton Elkhart Decatur Sharon Elmira Canton Mansfield Decatur Lewiston Rockford Toledo Wichita Peoria Shreveport Janesville Beaumont Flint Lake Hattiesburg Charles Sioux City Youngstown Steubenville Texarkana Florence Fort Wayne JacksonMonroe Sumter Altoona GreenvilleJackson Owensboro St. Joseph Victoria Enid Dothan Jackson Fayetteville Waterloo Jersey City Kokomo Goldsboro Danville Pine Bluff Albany Lima Rocky Mountain Pop.Adjusted Log Million Tourists in 1990
40
41 Not a Tourism Industry Issue Actually, these cities had relatively less growth in leisure-related services (hotels, restaurants, etc) as personal services and tertiarization were catching up in more remote metros (regression to mean). Include contemporaneous changes in tourismrelated employment ( ): no changes to coefficients
42
43 Not driven by income/productivity In fact, the effect stays the same after controlling for contemporaneous change sin income ( ) Very demanding specification, as income and population growth are jointly co-determined
44
45 Not driven by previous trends Pop growth trends are very persistent Possibility that even tourism in 1992 driven by secular growth However, results robust to including growth in Due to the possibility of over-controlling: this seems to be a relatively newer phenomenon!
46 0.5 1 Log Population Log Population 1990 Las Vegas Naples Fayetteville McAllen Austin Boise City Provo Greeley Raleigh Laredo Myrtle Phoenix Beach Yuma Fort Myers Atlanta Orlando Richland Charlotte Ocala Reno Fort Pierce Auburn Fort Collins Bryan Dallas Riverside Grand Junction Bellinghan Houston Brownsville Colorado Springs Greenville Fort Worth Nashville-Davidson Sioux Falls Olympia Bakersfield Las Cruces DenverKilleen San Antonio (balance) West Palm Beach Albuquerque Lakeland Columbia Clarkesville Portland Dover Salt Springfield Lake City Tucson Jacksonville Daytona Beach Columbia Athens Charlottesville - Clarke Huntsville Fresno Merced County (balance) Punta Gorda Missoula Des Jonesboro Moines Fort Lauderdale Flagstaff Lexington-Fayette Medford Salem Visalia Stockton Sarasota Tyler Asheville Fargo Santa Fe Greensboro Iowa Gainesville City Modesto El Paso Indianapolis Knoxville Baton Billings Rouge Bismarck Bloomington Fort Hattiesburg City Galveston Savannah Augusta-Richmond Ann Amarillo Columbus Smith Greenville Lincoln Rochester Washington Yuba Lawrence Tallahassee Tacoma City (balance) Charleston Boulder Bremerton Bloomington Harbor County (balance) Casper Cedar Rapids Cheyenne Green Elkhart Bay Eugene Jackson Kenosha Joplin Little Rock Madison Seattle Melbourne Panama Tampa City Pueblo Spokane Richmond Lafayette Oklahoma Appleton Hickory Fort Walton Beach Chattanooga Corvallis Grand Hamilton Minneapolis City Pensacola Sherman Omaha Tuscaloosa Yakima York Miami Newburgh Pocatello Lubbock Kansas City Lafayette Lynchburg Macon Rapids Birmingham Florence Hagerstown Menphis Mobile St. Cloud Montgomery Tulsa Rockford Reading State Jackson Wichita Wilmington Waco Odessa College Rapid Lancaster San City Buenaventura Santa San Rosa (Ventura) San Diego Luis Obispo Biloxi Allentown Oakland Burlington Chico Kankakee Champaign Fort Chicago Eau Corpus Harrisburg Wayne Goldsboro Dothan Claire Jacksonville Decatur Jersey Lake Johnson Louisville Janesville Charles Fayetteville Christi Atlantic City Houma City Barnstable Town Cincinnati City Redding Vallejo San Jose Wausau Longview Victoria La CrossePortland Baltimore Norfolk Salinas Vineland Rocky Florence Lawton Evansville New York Columbus Owensboro Racine Texarkana Mountain Santa Cruz Barbara AlbanyCity Boston San Dubuque Gary RoanokeAbilene (balance) Los Angelo Angeles St. Enid Beaumont Joseph Shreveport Springfield Sheboygan San Trenton Francisco Newark Jackson Akron Kalamazoo Philadelphia Milwaukee Monroe New St. Topeca Haven Lansing Glenn Falls Albany New Louis Hartford PeoriaSioux Wichita South City Falls BendLondon Waterloo Davepont Great Gadsden FallsRochester Providence Bangor Sumter Duluth Cumberland Canton Huntington Kokomo Terre Haute Erie Springfield Lewiston Charleston Parkersburg Cleaveland Alexandria Flint Detroit Benton Muncie Saginaw Altoona Scranton Toledo Harbor Danville Lima Dayton Syracuse Mansfield Decatur Pittsburgh Sharon Williamsport Jamestown Pittsfield Buffalo Binghamton Grand Forks Wheeling Elmira Utica Johnstown Youngstown New Orleans Pine Bluff Steubenville Log Population Log Population 1980

47
48 Predictors of US metro growth: Urban picturesqueness and leisure Good weather Immigration Low taxes How does the picture change if we omitted urban beauty?
49
50 Are these better measures? Measure is better than previously used ad hoc variables These are more likely to be reverse-caused by growth
51
52 Other outcomes More picturesque cities associated with: Increased in human capital levels Increase in housing prices Potential slower growth in income and wages, adjusting for human capital (consistent with Rosen-Roback framework)
53
54
DEGREE DAY AND DESIGN TEMPERATURES
 DEGREE DAY AND TABLE D DEGREE DAY AND a FOR CITIES IN THE UNITED S / % Dry bulb / % Wet bulb / % AL Birmingham Huntsville Mobile Montgomery, 3,,, 33 3 3 3 3 AK Anchorage Fairbanks Juneau Nome,,,, -8-8
UNITED STATES 1. metropolitan areas (see note below).
.") UNITED STATES 1 1 These maps show the functional urban areas belonging to the two largest classes: metropolitan areas and large metropolitan areas (see note below). 1 UNITED STATES WEST UNITED STATES EAST
UNITED STATES 1 1 These maps show the functional urban areas belonging to the two largest classes: metropolitan areas and large metropolitan areas (see note below). 1 UNITED STATES WEST UNITED STATES EAST
Item 185 Storage-In-Transit First Ea. Add'l. Service
 Service Day Day 4 Birmingham, AL 19.62 0.68 2 8 Dothan, AL 15.08 0.48 2 12 Huntsville, AL 15.55 0.50 2 16 Mobile, AL 16.23 0.68 3 20 Montgomery, AL 16.23 0.68 3 22 State of Alaska 14.76 0.55 4 24 Flagstaff,
Service Service Area Name
 Atlas Van Lines, Inc. Origin and Destination s Effective: 05/15/2018 Area Name 4 Birmingham, AL 6.99 8 Dothan, AL 4.80 12 Huntsville, AL 7.37 16 Mobile, AL 4.80 20 Montgomery, AL 7.37 22 State of Alaska
Appendix D: Aggregation Error for New England Metro Areas and for Places
 Appendix D: for New England Metro Areas and for Places D-1 Appendix D: s Figure D-1: New England Metro Areas - Summary of Tract s (2000) Metro ID (msapma99) Metro Area Name Census NCDB 1120 Boston, MA-NH
Location, Location, Location. 19 th Annual NIC Conference NIC MAP Data & Analysis Service
 Location, Location, Location 19 th Annual NIC Conference NIC MAP Data & Analysis Service The Great Occupancy Decline 94% Occupancy Trends Majority Nursing Seniors Housing 93% 92% 91% 92.8% 91.0% 90% 89%
Charleston, WV 18 Juneau, AK Peoria, IL Jefferson City,
 2004 Ranking Diocese Catholics Diocesan Seminarians 2004 Ratio (Catholics / Seminarians) 2003 Ranking 1 Lincoln, NE 89431 35 2555 2 2 Yakima, WA 68561 20 3428 5 3 Savannah, GA 75987 22 3454 13 4 Cheyenne,
Norwegian's Free Airfare Promotion
 Norwegian's Free Airfare Promotion Start planning your next vacation with 200+ cruises to incredible destinations, including Alaska, Bahamas & Florida, Bermuda, Canada & New England, Caribbean, Mexican
NIELSEN RADIO DIARY MARKETS WITH IN-TAB TARGETS SPRING 2017
 NIELSEN RADIO DIARY S WITH IN-TAB S SPRING 2017 By Market... 2 By Rank... 7 Metro P12+ ranks are determined from population estimates based upon Census 2010 counts updated and projected to January 1, 2017,
NIELSEN RADIO DIARY MARKETS WITH IN-TAB TARGETS FALL 2016
 NIELSEN RADIO DIARY S WITH IN-TAB S FALL 2016 By Market... 2 By Rank... 7 Metro ranks are determined from population estimates based upon Census 2010 counts updated and projected to January 1, 2017, by
Appendix A TRIP Urban Roads Report 2018
 Appendix A TRIP Urban Roads Report 2018 Pavement Conditions and Extra Vehicle Operating Costs for Urban Areas with Population of 500K or More Akron OH 49% 12% 14% 25% $837 Albany Schenectady Troy NY 15%
US Metropolitan Areas Population in 1998 & 1990
 US Metropolitan Areas Population in 1998 & 1990 Alphabetical Listing Population Ranking Percentage Population Change Ranking Population Change Ranking DEMOGRAPHIA An undertaking of Wendell Cox Consultancy
Domestic Clearance Report for Alexander Haig's World Business Review Show # 1342
 Domestic Clearance Report for Alexander Haig's World Business Review Show # 1342 1 New York New York Network New York Monday 6:30am EDT August 25 New York Sunday 9:30pm August 24 2 Los Angeles Los Angeles
U.S. Regional Outlook
 U.S. Regional Outlook Presented by: Mark McMullen Director of Government Consulting FTA Revenue Estimating Conference September 18, 26 Widespread Pattern of Economic Expansion Based on employment and industrial
STATEMENT FOR THE PRESS MONTHLY STATEMENT OF DEBITS TO INDIVIDUAL ACCOUNTS BI BANKS IN REPORTING CENTERS
 Form Fft-286 For immediate release STATEMENT FOR THE PRESS Board oif Governors of the Federal Reserve System November 7, MONTHLY STATEMENT OF DEBITS TO INDIVIDUAL ACCOUNTS BI BANKS IN REPORTING CENTERS
v,^»f D-E.R-Ar, RESERVE/ NVdtrsH^-i Ve^ie* * w BANK DEBITS AND DEPOSIT TURNOVER
 v,^»f D-E.R-Ar, RESERVE/ NVdtrsH^-i Ve^ie* * w p z For immediate release -D August 17, 196? BANK DEBITS AND DEPOSIT TURNOVER Bank debits to demand deposit accounts (except interbank and U. S. Government
Initial Locations of 2020 Area Census Offices
 1 of 6 Anchorage* AK At Large Birmingham* AL 007 Huntsville AL 005 Mobile AL 001 Fayetteville AR 003 Little Rock AR 002 Flagstaff AZ 001 Window Rock AZ 001 Maricopa (Central)* AZ 006 Maricopa (South) AZ
(Monthly figures are derived from weekly reports, the figures for weeks that do not fall entirely within a single calendar month being prorated)
") For immediate release STATEMENT POR THE PRESS Board of Governors of 'tiie Federal Reserve System May 11, 1937 MONTHLY STATEMENT OF DEBITS TO INDIVIDUAL ACCOUNTS BY BANKS IN REPORTING CENTERS (Monthly figures
For immediate release STATEMENT POR THE PRESS Board of Governors of 'tiie Federal Reserve System May 11, 1937 MONTHLY STATEMENT OF DEBITS TO INDIVIDUAL ACCOUNTS BY BANKS IN REPORTING CENTERS (Monthly figures
Row Labels Sum of SPOT COUNT Sum of EST. COST PRESIDENT US SENATE/OH US SENATE/PA US SENATE/WI USSEN/IN
 Total mentions* of jobs, trade, and China trade, and total negative mentions of Bain Capital, in all ads tracked by CMAG Total estimated spending per issue on ads mentioning jobs, trade, and China trade,
BANK DEBITS, DEPOSITS, AND DEPOSIT TURNOVER (DOLLAR AMOUNTS IN BILLIONS, SEASONALLY ADJUSTED) DEBITS TO DEMAND DEPOSIT ACCOUNTS (AN NUAL RATE BASIS)
 DEBITS TO DEMAND DEPOSIT ACCOUNTS (AN NUAL RATE BASIS)") El FEDERAL statistical RESERVE release FOR IMMEDIATE RELEASE July 2, 1974 BANK DEBITS, DEPOSITS, AND DEPOSIT TURNOVER (DOLLAR AMOUNTS IN BILLIONS, SEASONALLY ADJUSTED) DEBITS TO DEMAND DEPOSIT ACCOUNTS
El FEDERAL statistical RESERVE release FOR IMMEDIATE RELEASE July 2, 1974 BANK DEBITS, DEPOSITS, AND DEPOSIT TURNOVER (DOLLAR AMOUNTS IN BILLIONS, SEASONALLY ADJUSTED) DEBITS TO DEMAND DEPOSIT ACCOUNTS
DEMAND DEPOSITS (END OF MONTH) TOTAL LEADING CENTERS TOTAL ; 1 CENTERS OTHER
 TOTAL LEADING CENTERS TOTAL ; 1 CENTERS OTHER") Ml ' "f
Ml ' "f
Park-Related Total* Expenditure per Resident, by City
 Park-Related Total* per Resident, by City FY 2008 City Population Total Park per Resident Washington, D.C. 591,833 $153,324,830 $259 Seattle 598,541 $150,672,543 $252 Scottsdale 235,371 $50,429,049 $214
Per capita carbon emissions from transportation and residential energy use, 2005
 Per capita carbon emissions from transportation and residential energy use, 2005 Metropolitan Area Carbon Footprint Honolulu, HI 1 1.356 Los Angeles-Long Beach-Santa Ana, CA 2 1.413 Portland-Vancouver-Beaverton,
RANKING OF THE 100 MOST POPULOUS U.S. CITIES 12/7/ /31/2016
 OVERVIEW OF THE DATA The following information is based on incoming communication to the National Human Trafficking Hotline via phone, email, and online tip report from December 7, 2007 December 31, 2016
US Cities Over 100,000 Population in 1998 & 1990
 US Cities Over 100,000 Population in 1998 & 1990 Population Ranking Alphabetical Listing Population Change Ranking Percentage Population Change Ranking DEMOGRAPHIA An undertaking of Wendell Cox Consultancy
Sioux Falls Regional Airport Sioux Falls, South Dakota
 Sioux Falls Regional Airport Sioux Falls, South Dakota Volume 154 Twelve Months Ended Fourth Quarter 2015 May 2016 27% At Sioux Falls, Allegiant generated $28.1 million in revenue from 176,850 passengers,
Hector International Airport Fargo, North Dakota
 Hector International Airport Fargo, North Dakota Volume 072 Twelve Months Ended June 2007 November 2007 Airlines Serving Fargo Carried 830 Onboard Passengers Per Day for the Twelve Months Ended June 2007,
APPENDIX D SIZING STORM WATER DRAINAGE SYSTEMS. TABLE D-1 Maximum Rates of Rainfall for Various Cities
 APPENDIX D SIZING STORM WATER DRAINAGE SYSTEMS D 1 Roof Drainage. The rainfall rates in Table D-1 should be used for design unless higher values are established locally. D 2 Sizing by Flow Rate. Storm
District Match Data Availability
 District Match Data Availability National & State Data Location Available National Data Australia Parliament, Provincial and Territory Assemblies Canada Parliament, Provincial Legislative Assemblies New
Investors Metro Monitor
 FAST FAST Atlantic City, NJ Augusta-Richmond County, GA Bellingham, WA Boise City-Nampa, ID Charlottesville, VA Chattanooga, TN College Station-Bryan, TX Colorado Springs, CO Dallas-Plano, TX Des Moines,
Investors Metro Monitor
 FAST FAST Augusta-Richmond County, GA Boise City-Nampa, ID Charlottesville, VA College Station-Bryan, TX Colorado Springs, CO Dallas-Plano, TX Greeley, CO Olympia, WA Orlando, FL Provo-Orem, UT Raleigh-Cary,
Rank Place State Native Hawaiian and Pacific Islander population (alone or in combination
 TABLE 2a: 100 Largest Places Ranked by Number of s (race alone or in *) Living in Hard-to- Census Rank Place State (alone or in 1 Honolulu (CDP) HI 64,196 11,130 17.3 2 New York City NY 14,981 8,211 54.8
(Monthly figures are derived from weekly reports, the figures for weeks that do not fall entirely within a single calendar month being prorated)
") Form Fft-286 For immediate release STATEMENT FOR THE PRESS Board of Governors of the Federal Reserve System October 12, 1937 MONTHLY STATEMENT OF DEBITS TO INDIVIDUAL ACCOUNTS BY BANKS IN REPORTING CENTERS
Form Fft-286 For immediate release STATEMENT FOR THE PRESS Board of Governors of the Federal Reserve System October 12, 1937 MONTHLY STATEMENT OF DEBITS TO INDIVIDUAL ACCOUNTS BY BANKS IN REPORTING CENTERS
Hector International Airport Fargo, North Dakota
 Hector International Airport Fargo, North Dakota Volume 073 Twelve Months Ended September 2007 January 2008 Airlines Serving Fargo Carried 831 Onboard Passengers Per Day for the Twelve Months Ended September
@2$ Lindsay Rose Race Weighted Markets
 1350 Avenue of the Americas LINDSA New York, New York 10019 lient Ser (212) 887-1326 Radio Repr ROSE e Representati sentative/networ To: From: Re: All Representative and Network Researchers Lindsay Rose
House Prices. House Prices in America: 4 th Quarter 2008 Update. Summary. Recent Evidence on House Prices
 House Prices in America: 4 th Quarter 2008 Update Summary House price depreciation accelerated sharply and became more widespread during the fourth quarter of 2008. Nationally, prices declined at a 13.0%
Alexander Haig's World Business Review CNBC (as paid programming) Clearance Report Show # WBR0201C
 Clearance Report Show # WBR0201C") Alexander Haig's World Business Review CNBC (as paid programming) Clearance Report Show # WBR0201C Rank Market Day Time Air date 1 NEW YORK 2 LOS ANGELES 3 CHICAGO 4 PHILADELPHIA 5 SAN FRANCISCO-OAK-SAN
Alexander Haig's World Business Review CNBC (as paid programming) Clearance Report Show # WBR0201C Rank Market Day Time Air date 1 NEW YORK 2 LOS ANGELES 3 CHICAGO 4 PHILADELPHIA 5 SAN FRANCISCO-OAK-SAN
Population Estimates for U.S. Cities Report 1: Fastest Growing Cities Based on Numeric Increase,
 ulation s for U.S. Cities Report 1: Fastest Growing Cities Based on Numeric Increase, 2015-2015 1 Phoenix AZ 32,113 2.0 1,582,904 1,615,017 167,393 11.6 2 Los Angeles CA 27,173 0.7 3,949,149 3,976,322
Form FR-286 STATEMENT FOR THE PRESS Board of Governors of the Federal Reserve System Fs>r ^mediate release December 12, 1939
 Form FR-286 STATEMENT FOR THE PRESS Board of Governors of the Federal Reserve System Fs>r ^mediate release December 12, 1939 MONTHLY STATEMENT OF DEBITS TO INDIVIDUAL ACCOUNTS BY BANKS IN REPORTING CENTERS
BOARD OF GOVERNORS OF THE FEDERAL RESERVE SYSTEM BANK DEBITS TO DEMAND DEPOSIT ACCOUNTS EXCEPT INTERBANK AND U. S. GOVERNMENT ACCOUNTS
 BOARD OF GOVERNORS OF THE FEDERAL RESERVE SYSTEM (For Immediate Release) January 16, 1961 BANK DEBITS TO DEMAND DEPOSIT ACCOUNTS EXCEPT INTERBANK AND U. S. GOVERNMENT ACCOUNTS Bank debits to demand deposit
BOARD OF GOVERNORS OF THE FEDERAL RESERVE SYSTEM (For Immediate Release) BANK DEBITS
 BANK DEBITS") BOARD OF GOVERNORS OF THE FEDERAL RESERVE SYSTEM (For Immediate Release) January 15, I960 BANK DEBITS TO DEMAND DEPOSIT ACCOUNTS EXCEPT INTERBANK AND U.S. GOVERNMENT ACCOUNTS Bank debits to demand deposit
BOARD OF GOVERNORS OF THE FEDERAL RESERVE SYSTEM (For Immediate Release) January 15, I960 BANK DEBITS TO DEMAND DEPOSIT ACCOUNTS EXCEPT INTERBANK AND U.S. GOVERNMENT ACCOUNTS Bank debits to demand deposit
Major Metropolitan Area Sales Tax Rates
 August 19, 2010 No. 239 FISCAL FACT Major Metropolitan Area Sales Tax Rates By Lawrence Summers Introduction General sales taxes levied by state, county and city governments in the United States vary greatly,
BANK DEBITS DEPOSIT TURNOVER
 urn statistical FEDERAL release RESERVE G>6 For immediate release AND BANK DEBITS DEPOSIT TURNOVER 15 ' ^ Bank debits to demand deposit accounts, except interbank and U. 8. Government accounts, as reported
Markets where an Aetna-Humana merger warrants antitrust scrutiny
 Markets where an Aetna-Humana merger warrants antitrust scrutiny Analysis of data from the 2015 update to Competition in health insurance: A comprehensive study of U.S. markets Health Policy Group American
41 Harrisburg-Lncstr-Leb-York 738, Las Vegas 728, Norfolk-Portsmth-Newpt Nws 718, Albuquerque-Santa Fe 689,
 1 New York 7,433,820 6.495 2 Los Angeles 5,654,260 4.940 3 Chicago 3,492,850 3.052 4 Philadelphia 2,950,220 2.578 5 Dallas-Ft. Worth 2,489,970 2.175 6 San Francisco-Oak-San Jose 2,476,450 2.164 7 Boston
SPRING Web Links. Contents
 SPRING 2011 Web Links 2010-2013 Diary Survey Schedule...www.arbitron.com/home/surveysched.asp 2011 PPM Survey Schedule...www.arbitron.com/home/surveysched.asp Custom Survey Area Reports... www.arbitron.com/radio_stations/csars.htm
ILLINOIS INTERSTATE AND INTRASTATE LOCAL REDUCED CITY-PAIR FARES
 The following section contains city-pair fares that are lower than walkup mileage-based fares. Although shown in only one direction, the fares in this section apply in both directions, unless otherwise
House Prices in America
 House s in America Updated for the 2 nd Quarter of 2008 A Global Insight / National City Corporation Joint Venture September 2008 House s in America: 2 nd Quarter 2008 Update Summary House price declines
ALN Apartment Data, Inc. (Continued on next page)
") AK - Anchorage 93.0% 90.9% -210-2.2% $1,035 $1,018-1.7% 93.0% 90.9% -210-2.2% $1,035 $1,018-1.7% AK - Misc. AK 90.3% 86.8% -350-3.8% $1,218 $1,245 2.3% 90.3% 86.8% -350-3.8% $1,218 $1,245 2.3% Alaska Average
AK - Anchorage 93.0% 90.9% -210-2.2% $1,035 $1,018-1.7% 93.0% 90.9% -210-2.2% $1,035 $1,018-1.7% AK - Misc. AK 90.3% 86.8% -350-3.8% $1,218 $1,245 2.3% 90.3% 86.8% -350-3.8% $1,218 $1,245 2.3% Alaska Average
MANGO MARKET DEVELOPMENT INDEX REPORT
 MANGO MARKET DEVELOPMENT INDEX REPORT 2015-2016 UNDERSTANDING THE MARKET INDEX The Mango Market Development Index is designed to measure and compare mango sales volume relative to population by region
Medicare Advantage markets where an Aetna- Humana merger warrants antitrust scrutiny
 Medicare Advantage markets where an Aetna- Humana merger warrants antitrust scrutiny Analysis of data from HealthLeaders- InterStudy s Managed Market Surveyor 2013 Health Policy Group American Medical
BANK DEBITS TO DEMAND DEPOSIT ACCOUNTS EXCEPT INTERBANK AND U. S. GOVERNMENT ACCOUNTS
 G.6 BOARD OF GOVERNORS OF THE FEDERAL RESERVE SYSTEM (For Immediate Release) June 15, 1961 BANK DEBITS TO DEMAND DEPOSIT ACCOUNTS EXCEPT INTERBANK AND U. S. GOVERNMENT ACCOUNTS Bank debits to demand, deposit
Total, 344. Not seasonally adjusted P47-9
 H statistical FEDERAL release RESERVE For immediate release January 15, 196k G.6 BANK DEBITS AND DEPOSIT TURNOVER Bank debits to demand deposit accounts, except interbank and U. S. Government accounts,
Oct-17 Oct-18 bps %CHG Oct-17 Oct-18 %CHG Oct-17 Oct-18 bps %CHG Oct-17 Oct-18 %CHG
 AK - Anchorage 92.6% 89.9% -270-2.9% $1,023 $1,011-1.2% 92.6% 89.9% -270-2.9% $1,023 $1,011-1.2% AK - Misc. AK 89.9% 85.8% -410-4.6% $1,227 $1,230 0.2% 89.9% 85.8% -410-4.6% $1,227 $1,230 0.2% Alaska Average
At the end of the bill (before the short title), insert the following:
, insert the following:") AMENDMENT TO H. R. (CONTINUING APPROPRIATIONS, 0) OFFERED BY MR. PENCE OF INDIANA At the end of the bill (before the short title), insert the following: 0 SEC. ll. None of the funds made available by this
AMENDMENT TO H. R. (CONTINUING APPROPRIATIONS, 0) OFFERED BY MR. PENCE OF INDIANA At the end of the bill (before the short title), insert the following: 0 SEC. ll. None of the funds made available by this
Copyright 2014 The Nielsen Company All Rights Reserved 1 of 6
 1 Los Angeles 1,927,420 13.252 2 New York 1,433,400 9.856 3 Miami-Ft. Lauderdale 732,020 5.033 4 Houston 647,700 4.453 5 Chicago 528,290 3.632 6 Dallas-Ft. Worth 525,250 3.611 7 San Antonio 444,430 3.056
Local Television Market Universe Estimates Estimates as of January 1, 2013 and used throughout the television season
 1 New York 7,384,340 6.468 2 Los Angeles 5,613,460 4.917 3 Chicago 3,484,800 3.052 4 Philadelphia 2,949,310 2.583 5 Dallas-Ft. Worth 2,588,020 2.267 6 San Francisco-Oak-San Jose 2,502,030 2.191 7 Boston
41 Milwaukee 64, Colorado Springs-Pueblo 63, Detroit 60, Minneapolis-St. Paul 60, Oklahoma City 59,930
 1 Los Angeles 1,933,480 12.811 2 New York 1,456,790 9.653 3 Miami-Ft. Lauderdale 798,890 5.294 4 Houston 692,620 4.589 5 Dallas-Ft. Worth 553,080 3.665 6 Chicago 535,870 3.551 7 San Antonio 458,930 3.041
Peak to Trough Price Decline of less that 10% Peak to Trough Price Decline between 10% and 20%
 Peak to Trough Price Decline of less that 10% Minimal Price Decline Pop. Rank Market Peak to Trough % Decline Current Rebound% 4 Dallas-Fort Worth-Arlington, TX -4.68% 115.17% 35 Austin-Round Rock, TX
*Race of Householder is Asian alone or in combination with any other race. 5 of 5
 1 Los Angeles 704,810 13.140 2 New York 646,560 12.054 3 San Francisco-Oak-San Jose 555,310 10.353 4 Washington, DC (Hagrstwn) 218,030 4.065 5 Chicago 196,880 3.671 6 Honolulu 191,610 3.572 7 Houston 177,770
3-Digit ZIP Code Sort Option for Drop-Ship Mailers
 3-Digit ZIP Code Sort Option for Drop-Ship Mailers lists the 5-digit ZIP Codes for machinable parcels eligible to be entered at designated SCFs when sorted into 3-digit containers. The corresponding rate
Hector International Airport Fargo, North Dakota
 Hector International Airport Fargo, North Dakota Volume 081 Twelve Months Ended March 2008 July 2008 Airlines Serving Fargo Carried 838 Onboard Passengers Per Day for the Twelve Months Ended March 2008,
CONNECTICUT INTERSTATE AND INTRASTATE LOCAL REDUCED CITY-PAIR FARES
 PASSENGER TARIFF AND SALES MANUAL CONNECTICUT INTERSTATE AND INTRASTATE LOCAL REDUCED CITY-PAIR S The following section contains city-pair fares that are lower than walkup mileage-based fares. Although
Monthly Employment Watch: Milwaukee and the Nation's Largest Cities
 Monthly Employment Watch: Milwaukee and the Nation's Largest Cities A monthly report on employment trends in the nation s largest cities Prepared by: The University of Wisconsin-Milwaukee Center for Economic
RANK BASED ON TV HOUSEHOLDS - OFFICIAL DMA RANK RANK-TV HOMES DESIGNATED MARKET AREA (DMA) TV HOMES % OF US
 TV HOMES % OF US") ESTIMATES AS OF JANUARY 1, 2019 AND USED THROUGHOUT THE 2018-2019 TELEVISION SEASON ESTIMATES ARE EFFECTIVE SEPTEMBER 22, 2018 RANK BASED ON TV HOUSEHOLDS - OFFICIAL DMA RANK 1 New York 7,100,300 6.441
ESTIMATES AS OF JANUARY 1, 2019 AND USED THROUGHOUT THE 2018-2019 TELEVISION SEASON ESTIMATES ARE EFFECTIVE SEPTEMBER 22, 2018 RANK BASED ON TV HOUSEHOLDS - OFFICIAL DMA RANK 1 New York 7,100,300 6.441
Augusta-Richmond County MSA in the Top Ten for Cities Winning the Battle For Information Jobs 2014
 For Additional Information: Walter C. Sprouse, Jr., CEcD, CCE, FM 706-821-1321 706-284-5610 FOR IMMEDIATE RELEASE Augusta-Richmond County MSA in the Top Ten for Cities Winning the Battle For Information
Markets where an Aetna-Humana merger warrants antitrust scrutiny
 Markets where an Aetna-Humana merger warrants antitrust scrutiny Analysis of data from the 2016 update to the AMA Competition in health insurance: A comprehensive study of U.S. markets Health Policy Group
UNIFORMAT II City Cost Indexes (Assemblies) ~ Year 2014 Base
 ~ Year 2014 Base") ALABAMA ANNISTON BIRMINGHAM BUTLER DECATUR DOTHAN A Substructure 95.7 65.0 77.0 96.4 79.7 86.2 97.3 58.2 73.5 90.6 67.0 76.2 97.8 55.5 72.0 B10 Shell: Superstructure 96.9 75.0 88.3 97.1 85.3 92.4 95.7
ALABAMA ANNISTON BIRMINGHAM BUTLER DECATUR DOTHAN A Substructure 95.7 65.0 77.0 96.4 79.7 86.2 97.3 58.2 73.5 90.6 67.0 76.2 97.8 55.5 72.0 B10 Shell: Superstructure 96.9 75.0 88.3 97.1 85.3 92.4 95.7
UNIFORMAT II City Cost Indexes (Assemblies) ~ Year 2010 Base
 ~ Year 2010 Base") ALABAMA ANNISTON BIRMINGHAM BUTLER DECATUR DOTHAN A Substructure 90.7 67.2 76.8 95.0 77.9 84.9 92.3 61.0 73.8 90.1 68.6 77.4 92.6 58.0 72.2 B10 Shell: Superstructure 94.5 76.7 87.1 96.4 84.3 91.4 93.3
ALABAMA ANNISTON BIRMINGHAM BUTLER DECATUR DOTHAN A Substructure 90.7 67.2 76.8 95.0 77.9 84.9 92.3 61.0 73.8 90.1 68.6 77.4 92.6 58.0 72.2 B10 Shell: Superstructure 94.5 76.7 87.1 96.4 84.3 91.4 93.3
Top 20 metro areas by estimated unauthorized immigrant population, 2014
 Top 20 metro areas by estimated unauthorized, 2014 % of Rank by U.S. 11,100,000 +/-170,000 26 3.5 - - New York-Newark-Jersey City, NY-NJ-PA 1,150,000 +/-45,000 19 5.7 1 1 Los Angeles-Long Beach-Anaheim,
INDIANA INTERSTATE AND INTRASTATE LOCAL REDUCED CITY-PAIR FARES
 The following section contains city-pair fares that are lower than walkup mileage-based fares. Although shown in only one direction, the fares in this section apply in both directions, unless otherwise
FEDERAL DEBITS, DEMAND DEPOSITS, AND TURNOVFO AT 2 33 INDIVIDUAL CENTERS. G NOVEMBER 1967 For Immediate release December 15, 1967
 F GOVe, FEDERAL RESERVE r e l e a s e, DEMAND DEPOSITS, AND TURNOVFO AT 2 33 INDIVIDUAL CENTERS G. 11 - NOVEMBER 1967 For Immediate release December 15, 1967 OEM AND DEPOSITS TURNOVER
(See Note 1) Solar Energy Factor (SEF D ) Solar Fraction (SF D ) Estimated Energy Savings SYSTEM DETAILS
 Solar Energy Factor (SEF D ) Solar Fraction (SF D ) Estimated Energy Savings SYSTEM DETAILS") OG-300 ICC-SRCC TM CERTIFIED SOLAR SYSTEM # SYSTEM INFORMATION Pumped Internal Backup: Gas Tank Collector Type: Glazed Flat Plate Solar Tank Volume: 379 liter (100 gal) Collector Heat Transfer Fluid: GRAS
OG-300 ICC-SRCC TM CERTIFIED SOLAR SYSTEM # SYSTEM INFORMATION Pumped Internal Backup: Gas Tank Collector Type: Glazed Flat Plate Solar Tank Volume: 379 liter (100 gal) Collector Heat Transfer Fluid: GRAS
note, artwork cannot be returned. Artwork that does not conform to the guidelines will be disqualified. PLEASE CIRCLE: Boy Girl Grade
 Missionary Childhood Association Annual Christmas Artwork Contest 2015-2016 **PLEASE READ CAREFULLY AS SOME ENTRY RULES HAVE CHANGED. Announcing the 2015-2016 Missionary Childhood Association (MCA) Christmas
Monthly Employment Watch: Milwaukee and the Nation's Largest Cities
 Monthly Employment Watch: Milwaukee and the Nation's Largest Cities A monthly report on employment trends in the nation s largest cities Prepared by: The University of Wisconsin-Milwaukee Center for Economic
BANK DEBITS T 16,19ft AND DEPOSIT TURNOVER
 statist i(o release For immediate release BANK DEBITS T 16,19ft AND DEPOSIT TURNOVER Bank debits to demand deposit accounts, except interbank and U. S. Government accounts, as reported by "banks in 3^4
Innovation Clusters in the Decade of the 1990s
 Innovation Clusters in the Decade of the 1990s TARGET MISSOURI January 2002 Additional information is available on-line at: http://www.missourieconomy.org Innovation Clusters in the Decade of the 1990s
Mango Market Development Index
 Mango Market Development Index 2016-2017 Understanding the Market Index The Mango Market Development Index is designed to measure and compare mango volume sold at retail relative to population by region
*All Local Monthlies Data releases are scheduled from 9:00pm - 11:00pm for the date shown on the schedule
 MAY 2016 Local Monthlies Release Schedule Market Name Sequence *All Local Monthlies Data releases are scheduled from 9:00pm - 11:00pm for the date shown on the schedule Please note that ethnic release
House Prices in America
 House s in America Update for the 2 nd Quarter of 2006 A Global Insight / National City Corporation Joint Venture September 2006 House s in America: Update Summary Overvaluation became more pervasive
DEBITS TO INDIVIDUAL ACCOUNTS BY BAMS IN REPORTING CENTERS Federal
 STAiEMENT FOR THE PRESS Released for publication St. 5639 Sunday morning, Jan. 15; Federal Reserve Board, not earlier. January l4, 192S. BANK CEBITS Debits to individual accounts as reported to the Federal
*All Local Monthlies Data releases are scheduled from 9:00pm - 11:00pm for the date shown on the schedule
 MAY 2018 Local Monthlies Release Schedule Market Name Sequence *All Local Monthlies Data releases are scheduled from 9:00pm - 11:00pm for the date shown on the schedule Please note that ethnic release
Geography Quiz: State Capitals
 Geography Quiz: State Capitals Directions: Select the correct capital city for each state in the United States of America. 1. Alabama a. Jackson b. Montgomery c. Jefferson city d. Augusta e. Boston 6.
8,891 25,958 4,054 5,240 5,652 4,476 8,210 20,941 9,109 39,207 15,762 8,144 17,543
 Released for publication StLiday morning, Jan. 21 j not earlier. STATEMENT FOE THE PRESS BAM DEBITS. St,3311* Federal Preserve Board, January 20, 1923* Bank debits for the week ending January 17 totaled
Contents. Radio Spring SCHEDULE OF SURVEY DATES
 Radio Spring 2001 Contents 2001-2002 Market Survey Schedule... 2 Ethnic Reports Available via CD Access... 8 Custom Survey Area Reports... 9 Metro Survey Area Rankings and Population... 10 Total Survey
Newspaper. Investing In OWNERSHIP REPORT
 Investing In Newspaper OWNERSHIP REPORT 2015 Also available on CD ROM and via the Internet through BIA s MEDIA Access Pro BIA/Kelsey. 15120 Enterprise Ct., Chantilly, VA 20151-1217 Phone: 703-818-2425
Lower Income Journey to Work Market Share From American Community Survey
 Lower Income Journey to Work Market Share From American Community Survey 2006-2010 Table 1: Overall National Data Table 2: Car, Truck or Van Table 3: Transit Table 4: Metrics Table 1 Work Trip Market Share:
U.S. Cities Eligible for National Resource Network Request for Assistance
 U.S. Cities Eligible for National Resource Network Request for Assistance City Birmingham Mobile Montgomery Fort Smith North Little Rock Pine Bluff Springdale Lake Havasu City Phoenix Tucson Yuma Apple
Delta Already Has Access to 79 Percent of U.S.-Rome Traffic with Its JFK Service
 Already Has Access to 79 Percent of U.S.-Rome Traffic with Its Service Philadelphia R-103 (Rebuttal to -103) Seattle Portland Salt Lake City Denver Chicago Detroit Cleveland Columbus Dayton Pittsburgh
Alabama Y Y Birmingham-Hoover, AL Y Y. Alaska N/A. Arizona N Y Phoenix-Mesa-Scottsdale, AZ N Y Tucson, AZ N Y
 - requires bidders to obtain out of state Alabama Y Y Birmingham-Hoover, AL Y Y Alaska Arizona N Y Phoenix-Mesa-Scottsdale, AZ N Y Tucson, AZ N Y Arkansas Y N Little Rock-North Little Rock, AR Y N Memphis,
Change at Top 300 U.S. Airports - Twelve Months Ended September 2013.
 Change at Top 300 U.S. Airports -. Overall domestic passenger traffic growth remains flat over the last two years. That is the headline of consolidation and airline profitability. However, on an airport
2015 U.S. PLACE EQUITY INDEX RESONANCE REPORT
 2015 U.S. PLACE EQUITY INDEX RESONANCE REPORT RESONANCE CONSULTANCY CREATES DEVELOPMENT STRATEGIES, PLANS, POLICIES AND BRANDS THAT SHAPE THE FUTURE OF PLACES AROUND THE WORLD. INTRODUCTION All cities,
STATEMENT FOR THE PRESS. not earlier. May ^ V$2Z. BANK DEBITS.
 STATEMENT FOR THE PRESS Released for publication 2779 Sunday corning, May 14; Federal Rese.rve*Board, not earlier. May ^ V$2Z. BANK DEBITS. Volume of business for the week ending May 10 was $8,796,000,000,
SAMPLE SAMPLE. Metro Housing Starts Forecast Chartbook October
 2.5 Metro Housing Starts Forecast Chartbook 2016-2018 October 2016 2.0 1.5 0.5 1990 1994 1998 2002 2006 2010 2014 2018 www.housingeconomics.com Table of Contents (Metro Housing Starts Forecasts and Economic
FALSE PREMISES, FALSE PROMISES
 Appendices A-G FALSE PREMISES, FALSE PROMISES A Quantitative History of Ownership Consolidation in the Radio Industry by Peter DiCola Research Director, Future of Music Coalition December 2006 Appendices
Average Years Between Claims Best Drivers Report Ranking. Change in Ranking From 2017 to 2018
 2018 Best Drivers Report Ranking City Average Years Between Claims Relative Claim Likelihood (Compared to National Average) 2018 Drivewise Hard-Braking Events Per 1,000 Miles 1 2017 Best Drivers Report
Vu Qube V10 Operation and Dish Elevation. Quick Reference. 1) Operation 2) ZIP Codes and Elevation 3) Elevation Maps
 Operation 2) ZIP Codes and Elevation 3) Elevation Maps") Vu Qube V10 Operation and Dish Elevation Quick Reference 1) Operation 2) ZIP Codes and Elevation 3) Elevation Maps Vu Qube V10 Operation IMPORTANT! CLEAR LINE OF SIGHT for Vu Qube Antenna to the SOUTHERN
Vu Qube V10 Operation and Dish Elevation Quick Reference 1) Operation 2) ZIP Codes and Elevation 3) Elevation Maps Vu Qube V10 Operation IMPORTANT! CLEAR LINE OF SIGHT for Vu Qube Antenna to the SOUTHERN
Schedule of Survey Dates. Contents
 R a d i o F a l l 2 0 0 4 2004-2005 Schedule of Survey Dates Fall 2004... Sept. 23 - Dec. 15 Winter 2005...Jan. 6 - March 30 Spring 2005... March 31 - June 22 Summer 2005...June 30 - Sept. 21 Fall 2005...
House Prices in America
 House Prices in America Methodology Update A Global Insight / National City Corporation Joint Venture December 2007 House Prices in America: Valuation Methodology Summary This study employs a statistical
C.5 BANK DEBITS TO DEPOSIT ACCOUNTS EXCEPT INTERBANK ACCOUNTS Summary figures, by districts, by months Individual centers by months
 C.5 BANK DEBITS TO DEPOSIT ACCOUNTS EXCEPT INTERBANK ACCOUNTS 1950 Summary figures, by districts, by months Individual centers by months These figures include debits or charges to deposit accounts of individuals,