The Quality of Life Report
|
|
|
- Pierce Wilson
- 5 years ago
- Views:
Transcription


1 The Quality of Life Report A Foundation for Policy Development Tulsa City Council / Term Tulsa Skyline - view from ONEOK field by Vladxp, Creative Commons (NC-ND 2011)
2 I know not anything more pleasant, or more instructive, than to compare experience with expectation, or to register from time to time the difference between idea and reality. It is by this kind of observation that we grow daily less liable to be disappointed. Samuel Johnson

3 Overall Health & Wealth Median Income College Education Unemployment Disability Life Expectancy Obesity
4 Overall Health & Wealth Portland Minneapolis Omaha Cleveland Pittsburgh Oakland Denver Albuquerque Wichita Kansas City Tulsa Oklahoma City St. Louis Louisville Nashville Raleigh Tucson Ft. Worth New Orleans Tampa
5 Portland Minneapolis Omaha Cleveland Pittsburgh Oakland Denver Albuquerque Wichita Kansas City Tulsa Oklahoma City St. Louis Louisville Nashville Raleigh Tucson Ft. Worth New Orleans Tampa Most current data for comparable cities...

6 0 200, , , ,000 1,000,000 Portland Oakland Fort Worth Denver Nashville Portland Oklahoma City Louisville Albuquerque Tucson Kansas City Omaha Raleigh Oakland Minneapolis Tulsa Cleveland Wichita Tucson New Orleans Tampa St. Louis Pittsburgh Denver Albuquerque Omaha Wichita Tulsa Minneapolis Oklahoma City Ft. Worth Kansas City median St. Louis Louisville Nashville New Orleans Cleveland Pittsburgh Tampa Raleigh Most current data for comparable cities...
7 12 and City of Tulsa data over time
8 Demography

9 0 100, , , , , , , ,000 Fort Worth Denver Nashville Portland Oklahoma City Louisville Albuquerque Tucson Kansas City Omaha Raleigh Oakland Minneapolis Tulsa Cleveland Wichita New Orleans Tampa St. Louis Pittsburgh 398,724 median 2013 Population

10 -25% -15% -5% 5% 15% 25% 35% 45% 55% -22% -18% Raleigh Fort Worth Albuquerque Oklahoma City Denver Tampa Nashville Portland Omaha Louisville Wichita Tucson Kansas City Minneapolis Oakland Tulsa -9% -9% St. Louis Pittsburgh Cleveland 52% 47% 24% 21% 17% 16% 16% 15% 11% 11% 10% 8% 6% 5% 2% 1% median New Orleans Population Change

11 ,000 1,500 2,000 2,500 3,000 3,500 4,000 4,500 5,000 5,500 6,000 6,500 7,000 7,500 Minneapolis Oakland Pittsburgh St. Louis Cleveland Portland Denver Omaha Tampa Albuquerque Raleigh Wichita Tucson Fort Worth New Orleans Tulsa Louisville Kansas City Nashville Oklahoma City 1,992 median Population Density (people per square mile)

12 0% 10% 20% 30% 40% 50% 60% 70% Albuquerque Wichita Tucson Omaha Louisville Oklahoma City Tulsa Nashville Raleigh New Orleans Portland Denver Kansas City Cleveland Pittsburgh Tampa Fort Worth Minneapolis St. Louis Oakland median 41.4% 2013 City Population as % of MSA

13 population distribution 90% 80% City of Tulsa and Its Suburbs Percent of MSA Population ( ) 70% 60% 50% 40% 30% 20% 10% % City of Tulsa % Outside City 0% 2013 (est.)
 80% 70% 60% 96% City of Tulsa Largest Suburbs Combined 78%")

14 100% 90% City of Tulsa and Its Suburbs Population Growth by Decade ( ) 80% 70% 60% 96% City of Tulsa Largest Suburbs Combined 78% 50% 40% 30% 43% 40% 20% 10% 29% 6% 13% 30% 31% 34% 27% 33% 0% 5% 1% 6% 2% 7%
15 700, ,000 Tulsa and Oklahoma City - Population History ( ) 500, , , ,000 Oklahoma City City of Tulsa 100, (est.)
 +31,082 0 150,000 100,000-10,000-20,000 Not Hispanic or Latino -25,407-30,000 50,000 0 1900 1910 1920 1930 1940 1950 1960 1970 1980 1990 2000 2010 2013 (est.")
16 450,000 City of Tulsa Population History 398, , ,000 Net Growth from : +5, ,000 30, , ,000 20,000 10,000 City of Tulsa Population Change ( ) Hispanic or Latino (of any race) +31, , ,000-10,000-20,000 Not Hispanic or Latino -25,407-30,000 50, (est.)
17 450,000 City of Tulsa Population History 398, , , , , , , ,000 50, (est.)
")
18 450,000 City of Tulsa Population History 400, , , ,317 (-25,407) 250, , , ,000 50,000 with no Hispanic population growth from (est.)
19 100% 90% Hispanic or Latino Percent of Total City of Tulsa Population 80% 70% 60% 50% 40% 30% 20% 10% 0% 14.1% 14.8% 7.2% 2.6% (est.)

20 0% 5% 10% 15% 20% 25% 30% 35% 40% 45% 50% Albuquerque Tucson Fort Worth Denver Oakland Tampa Oklahoma City Wichita Tulsa Omaha Cleveland Raleigh Kansas City Nashville Portland Minneapolis New Orleans Louisville St. Louis Pittsburgh 14.8% median Percent Hispanic or Latino (any race)


21 51.6% Hispanic or Latino Origin Tulsa County Census Tracts where Hispanic or Latino Residents are More than 33% of the Population


22 Race/Ethnicity 100% 100% 90% 90% 80% 80% 70% 70% 60% 60% 50% 50% 40% 40% 30% 30% 20% 20% 10% 10% 0% 0% Other Black or African American White Hispanic or Latino (any race)
23 Race/Ethnicity 100% 100% 90% 90% 80% 80% 70% 70% 60% 60% 50% 50% 40% 40% 30% 30% 20% 20% 10% 10% 0% 0% Other Black or African American White Hispanic or Latino (any race)

24 0% 5% 10% 15% 20% 25% 30% 35% 40% Oakland Tucson Fort Worth Albuquerque Denver Tampa Oklahoma City Minneapolis Portland Wichita Raleigh Nashville Tulsa Omaha Kansas City Cleveland Pittsburgh St. Louis New Orleans Louisville 16.2% median Language Other Than English Spoken at Home

25 Louisville Portland Oakland Albuquerque Tampa New Orleans Kansas City Cleveland Tulsa St. Louis Omaha Denver Oklahoma City Wichita Nashville Pittsburgh Tucson Raleigh Minneapolis Fort Worth median 34.7 Median Age


26 100% Age Profile 100% 90% 90% 80% 80% 70% 70% 60% 60% 50% 50% 40% 40% 30% 30% 20% 20% 10% 10% 0% 0% 65-Years and Older Years Younger than 18-Years "Millennials" (18-34 Years)
27 100% Age Profile 100% 90% 90% 80% 80% 70% 70% 60% 60% 50% 50% 40% 40% 30% 30% 20% 20% 10% 10% 0% 0% 65-Years and Older Years Younger than 18-Years "Millennials" (18-34 Years)

28 0% 1% 2% 3% 4% 5% 6% 7% 8% 9% 10% 11% 12% 13% 14% 15% Minneapolis Denver Pittsburgh Raleigh Portland Nashville St. Louis New Orleans Oakland Kansas City Tampa Omaha Albuquerque Oklahoma City Louisville Tulsa Fort Worth Wichita Cleveland Tucson 4.7% median Young Professionals Percent of Population Age with Bachelor's Degree or Higher
29


30 TU/Kendall-Whittier Downtown/ Riverview Renaissance/Florence Park/ Yorktown/Gillette/Swan Lake Brookside 14.2% Lewis Crest/ Southern Hills King s Landing/Crown Chase Apts./Silver Chase/Hunter s Pointe Jenks Young Professionals Tulsa County Census Tracts where Residents Age with Bachelor s Degrees are 10% or More of the Population
 40,000 30,000 20,000 10,000")
31 60,000 50,000 City of Tulsa Age Distribution (2000 and 2013) 40,000 30,000 20,000 10,000 0
 30% 20% 10% 0% -10% -20%")
32 50% 40% City of Tulsa - Age Range Growth (from 2000 to 2013) 30% 20% 10% 0% -10% -20% -30%
33 Economic Vitality
34 $0 $50,000 $100,000 $150,000 $200,000 $250,000 $300,000 $350,000 $400,000 $450,000 Fort Worth Oakland Minneapolis Denver Portland St. Louis Pittsburgh Cleveland Tampa Kansas City Nashville New Orleans Oklahoma City Rahleigh Louisville Tulsa Omaha Albuquerque Tucson Wichita $55,000 median 2013 Gross Domestic Product (MSA) (in millions current dollars)

35 5.2%

36 $0 $10,000 $20,000 $30,000 $40,000 $50,000 $60,000 $70,000 $80,000 Oakland Portland Minneapolis Denver Fort Worth Omaha New Orleans Cleveland Nashville Kansas City Pittsburgh Raleigh Tulsa Oklahoma City St. Louis Louisville Wichita Albuquerque Tampa Tucson $51,599 median 2013 Real Per Capita Gross Domestic Product (MSA)
 400,000 350,000 300,000 250,000 200,000 Service Providing 150,000")
 2013 2012 2011 2010 2009 2008 2007 2006 2005 2004 2003 2002 2001 2000")
37 500, ,000 Tulsa Area Employment ( & Oct. 2014) 400, , , , ,000 Service Providing 150, ,000 50,000 Goods Producing (Oct.)
 4% 3% 2% 1% 0% -1% -2% 1991 1992 1993 1994 1995 1996 1997 1998 1999 2000 2001 2002 2003 2004 2005 2006")
38 6% 5% Tulsa Area Employment Growth ( and Oct. 2014) 4% 3% 2% 1% 0% -1% -2% (Oct.) -3% -4% -5%

39 0% 2% 4% 6% 8% 10% 12% Oakland Cleveland St. Louis Louisville Wichita Tampa Tucson Kansas City New Orleans Denver Pittsburgh Portland Albuquerque Nashville Fort Worth Raleigh Tulsa Oklahoma City Minneapolis Omaha 5.3% median 2013 Average Unemployment Rate
 8% 6% 4% 2% Oklahoma Tulsa MSA City of Tulsa U.S. 0% Oct.")

40 10% Average Annual Unemployment Rate ( and Oct. 2014) 8% 6% 4% 2% Oklahoma Tulsa MSA City of Tulsa U.S. 0% Oct
41 Unemployment Tulsa County Census Tracts with Unemployment above 10% 12.7%

42 Average Weekly Wage Cost of Living Index $1,400 Wages vs. Cost of Living 140 $1, $1, $ $ $ $ $ County Average Weekly Wage Composite Cost of Living (US Avg. 100)

43 $0 $200 $400 $600 $800 $1,000 $1,200 Denver Nashville Minneapolis Pittsburgh St. Louis Raleigh Oklahoma City Tulsa Louisville Omaha Cleveland Tampa Kansas City Fort Worth New Orleans Wichita Albuquerque Tucson Portland Oakland $1,004 median Average Weekly Wage Adjusted for Cost of Living

44 8% Tulsa County Growth in Average Annual Pay ( ) 7% 6% 5% 4% 3% 2% 1% 0% -1%
45 36.6% Wealth Tulsa County Census Tracts with More than 25% of Households with Annual Income of $200,000 or More
46 Peoria 36 th Street N. 67.7% Charles Page Eugene Field 61 st & Peoria Poverty Tulsa County Census Tracts where More than 40% of Families with Income Live in Poverty
47 0% 10% 20% 30% 40% 50% 60% 70% Cleveland New Orleans St. Louis Tucson Tampa Tulsa Fort Worth Albuquerque Pittsburgh Wichita Minneapolis Denver Oakland Kansas City Oklahoma City Nashville Omaha Louisville Portland Raleigh 15.8% median Percent of Families with Incomes below Poverty

48 0% 10% 20% 30% 40% 50% 60% 70% Cleveland New Orleans St. Louis Tucson Tampa Tulsa Fort Worth Albuquerque Pittsburgh Wichita Minneapolis Denver Oakland Kansas City Oklahoma City Nashville Omaha Louisville Portland Raleigh 47.4% Percent of Families Headed by Single Mothers, with Children under 5, with Incomes below Poverty

49 0% 5% 10% 15% 20% 25% 30% 35% 40% Cleveland St. Louis New Orleans Portland Tucson Tampa Pittsburgh Tulsa Minneapolis Louisville Fort Worth Oklahoma City Albuquerque Kansas City Wichita Nashville Oakland Omaha Denver Raleigh 17.7% median Percent of Households with Cash Public Assistance or Food Stamps/SNAP
 TANF (persons) Child Care Subsidies ( 5 Years) 20,000 10,000 0 2001 2002 2003 2004 2005 2006 2007 2008 2009 2010 2011 2012")
50 100,000 90,000 Tulsa County Public Support for Families (for the month of December , and February 2014) 80,000 70,000 60,000 50,000 40,000 30,000 Food Stamps (persons) TANF (persons) Child Care Subsidies ( 5 Years) 20,000 10,
51 12,000 Bankruptcy Filings (N.D. Okla ) 10,000 8,000 6,000 4,000 2,
52 Sales Tax Revenue (in thousands) $150,000 $140,000 City of Tulsa 2 Sales Tax Revenue $130,000 $120,000 $110,000 $100,000 $90,000 $80,000 $70,000 $60,

53 $180,000,000 $160,000,000 Tulsa MSA Retail Trade ( ) +149% $140,000,000 $120,000,000 $100,000,000 $80,000,000-13% $60,000,000 $40,000,000 $20,000,000 Food (Groceries) Eating & Drinking Out $0 Sep-14 Mar-14 Sep-13 Mar-13 Sep-12 Mar-12 Sep-11 Mar-11 Sep-10 Mar-10 Sep-09 Mar-09 Sep-08 Mar-08 Sep-07 Mar-07 Sep-06 Mar-06 Sep-05 Mar-05 Sep-04 Mar-04 Sep-03 Mar-03 Sep-02 Mar-02 Sep-01 Mar-01 Sep-00 Mar-00 Sep-99 Mar-99
54 The Relationship between Employment, Retail Sales, and Property Crime
55 Sales Tax Revenue (in thousands) Tulsa Area Non-Farm Employment $150,000 $140,000 Tulsa Area Employment 2 Sales Tax Revenue 450, , ,000 $130, , ,000 $120,000 $110,000 $100,000 $90,000 $80,000 $70, , , , , , , , , , ,000 $60, ,

56 Sales Tax Revenue (in thousands) Tulsa Area Non-Farm Employment $150,000 $140,000 Tulsa Area Employment 2 Sales Tax Revenue 450, , ,000 $130, , ,000 $120,000 $110,000 $100, , , , , ,000 $90,000 $80,000 $70,000 R 2 =.97 (97% explained variance) 350, , , , ,000 $60, ,
57 Property Crimes Unemployment Rate 30,000 City of Tulsa Average Annual Unemployment Rate City of Tulsa Property Crimes 8% 28,000 7% 26,000 6% 5% 24,000 4% 22,000 3% 20,000 2% 18,000 1% 16,000 0%
58 Property Crimes Unemployment Rate 30,000 City of Tulsa Average Annual Unemployment Rate City of Tulsa Property Crimes 8% 28,000 7% 26,000 6% 5% 24,000 4% 22,000 3% 20,000 18,000 R 2 =.82 (82% explained variance) 2% 1% 16,000 0%
59 Consistent with Studies On the whole, the preponderance of the evidence suggests that there is an important relationship between unemployment rates and property crime but little impact of unemployment on violent crime. The relationship between unemployment and property crime is empirically meaningful as property crime would be predicted to rise by between 9 and 18 percent during a serious recession in which unemployment increased by three percentage points. Moreover, this, if anything, may understate the magnitude of the relationship as crime appears to be particularly sensitive to the existence of employment opportunities for low skilled-men. Chalfin & McCrary, Criminal Deterrence: A Review of the Literature (2014)
60 Property Crimes Unemployment Rate 30,000 City of Tulsa Average Annual Unemployment Rate City of Tulsa Property Crimes 8% 28,000 7% 26,000 6% 5% 24,000 4% 22,000 3% 20,000 2% 18,000 1% 16,000 0%

61 Property Crimes Unemployment Rate 30,000 City of Tulsa Average Annual Unemployment Rate City of Tulsa Property Crimes 8% 28,000 7% 26,000 6% 5% 24,000 4% 22,000 3% 20,000 2% 18,000 1% 16,000 0%

62 Property Crimes Unemployment Rate 15,000,000 14,000,000 National Average Annual Unemployment Rate National Property Crimes 10% 9% 13,000,000 8% 12,000,000 7% 11,000,000 10,000,000 9,000,000 6% 5% 4% 3% 8,000,000 2% 7,000,000 1% 6,000,000 0%
63 Public Safety
64 6, , , , National Property Crime Rate -47% 2, , National Violent Crime Rate -45%
65 100% 90% Gallop Poll: Is there more crime in the U.S. than there was a year ago, or less? 80% 70% 60% 50% 40% % More % Less 30% 20% 10% 0%

66 100% 90% Gallop Poll: Is there more crime in the U.S. than there was a year ago, or less? 80% 70% 60% 50% 40% % More % Less 30% 20% 10% 0%
67 40,000 City of Tulsa Part I Crimes 35,000 30,000 25,000 20,000 15,000 In 2012, there were 11,757 fewer major crimes reported than in 1987 (-32%). 10,000 5,000 0
68 10,000 City of Tulsa Part I Crimes per 100,000 Residents 9,000 8,000 7,000 6,000 5,000 4,000 The property crime rate decreased by 42% from 1987 to ,000 2,000 1,000 0 The violent crime rate decreased by 27% from 1992 to 2013.


69 70 Property Crimes per 1,000 Residents 60 Violent Crimes per 1,000 Residents median median 0

70 New Orleans St. Louis Oakland Kansas City Tulsa Pittsburgh Cleveland Oklahoma City Omaha Minneapolis Tucson Tampa Louisville Albuquerque Denver Fort Worth Nashville Wichita Raleigh Portland median 1.52 Murder and Non-Negligent Manslaughter per 10,000 Residents

71 Cleveland Tulsa Kansas City St. Louis Oklahoma City Albuquerque Oakland Minneapolis Fort Worth Louisville Wichita Tucson Nashville New Orleans Omaha Denver Raleigh Pittsburgh Portland Tampa median 150 Burglaries per 10,000 Residents
72 Tulsa Comparison City Median Robberies per 10,000 Residents Aggravated Assaults per 10,000 Residents Larcenies-Thefts per 10,000 Residents Motor Vehicle Thefts per 10,000 Residents


73 5,000 City of Tulsa Part I Crimes per 100,000 Residents 4,500 4,000 3,500 3,000 2,500 2,000 Larceny-Theft Rate Aggravated Assault Rate Robbery Rate Murder and Manslaughter Rate Burglary Rate Motor Vehicle Theft Rate Rape Rate 1,500 1,

74 60,000 Tulsa Fire Department Responses ( ) 50,000 Mutual Aid Responses Hazardous Materials Responses 40,000 Other Hazardous Responses False Alarms All Other Responses 30,000 Rescue, Emergency Medical Responses Fires 20,000 10,

75 80,000 70,000 EMSA Eastern Division Transports ( ) 60,000 50,000 Emergency Transports Non-Emergency Transports 40,000 30,000 20,000 10,
76 Transportation


77 Minutes 30 Average Travel Time to Work 25 median


78 Commuting Profile 100% 90% 7.1% 13.5% 80% 70% 18.4% 80.5% 85.8% 60% 50% 12.1% Other Work at Home 40% 30% 20% 10% Bike or Walk Public Transportation Carpool Drive Alone 0%
79 31.2% Walking Tulsa County Census Tracts where More than 7% of Residents Walk to Work
80 6.7% Transit Tulsa County Census Tracts where More than 5% of Residents Take Public Transportation to Work
81 ,000 1,100 1,200 Oakland Portland Denver Minneapolis St. Louis New Orleans Pittsburgh Cleveland Tucson Albuquerque Nashville Raleigh Tampa Louisville Kansas City Fort Worth Tulsa Wichita Omaha Oklahoma City median Annual Transit Passenger Miles Per Capita (all modes)
82 Oakland Portland New Orleans Pittsburgh Minneapolis Tucson Denver Cleveland St. Louis Kansas City Albuquerque Louisville Raleigh Tampa Nashville Fort Worth Tulsa Omaha Wichita Oklahoma City median Annual Transit Passenger Trips Per Capita (all modes)

83 $0 $100 $200 $300 $400 $500 $600 Oakland Portland New Orleans Pittsburgh Minneapolis Denver Cleveland St. Louis Tucson Kansas City Albuquerque Nashville Louisville Raleigh Tampa Fort Worth Tulsa Omaha Wichita Oklahoma City median Annual Transit Operating Expenditures Per Capita (all modes)

84 Arterial Pavement Condition ( , and projected to 2019) Council District 1 Council District 2 Council District 3 Council District 4 Council District 5 Council District 6 Council District 7 Council District 8 Council District 9 City-wide Weighted Average
")


85 Non-Arterial Pavement Condition ( , and projected to 2019) Council District 1 Council District 2 Council District 3 Council District 4 Council District 5 Council District 6 Council District 7 Council District 8 Council District 9 City-wide Weighted Average
 6,500 6,000 290,000 5,500 270,000 5,000 250,000 230,000 4,500 210,000 4,000 190,000 170,000 150,000 Total Passengers Total Cargo 12 per. Mov. Avg.")
86 Passengers Tons of Cargo 350, , ,000 Tulsa Airports Monthly Traffic (2007-Nov. 2014) 6,500 6, ,000 5, ,000 5, , ,000 4, ,000 4, , , ,000 Total Passengers Total Cargo 12 per. Mov. Avg. (Total Passengers) 12 per. Mov. Avg. (Total Cargo) J M M J S N J M M J S N J M M J S N J M M J S N J M M J S N J M M J S N J M M J S N J M M J S N ,500 3,000

87 0 500,000 1,000,000 1,500,000 2,000,000 2,500,000 3,000, Tulsa Port of Catoosa Tonnage ( )
88 Neighborhood Vitality


89 0 5,000 10,000 15,000 20,000 25,000 Fort Worth Denver Oakland Portland Minneapolis Tampa Nashville Raleigh Kansas City Louisville Omaha Pittsburgh Albuquerque Oklahoma City Tucson St. Louis Tulsa Wichita New Orleans Cleveland 616 3, Number of New 5+Family Dwelling Units 2013 Number of New Single- Family Dwelling Units


90 # Units Value 40% 14% 35% 12% 30% 11.1% 10% 8% 25% 6% 20% 4% 15% 2% 10% 11.6% 0% -2% 5% -4% 0% -6% Growth in # of New Single Family Housing Units Growth in Average Value of New Single Family Housing Units

91 $250,000 Tulsa MSA - New Single-Family Building Permits ( ) 6,000 $200,000 Units Value ($) 5,000 4,000 $150,000 3,000 $100,000 2,000 $50,000 1,000 $
 40% 30% 20% 10% 0% -10% 1981 1982 1983 1984 1985 1986 1987 1988")

92 60% 50% Tulsa MSA - New Single-Family Building Permits Annual Percent Change ( ) 40% 30% 20% 10% 0% -10% % -30% -35.5% -40% -44.9% -50%

93 ,000 1,200 1,400 1,600 1,800 2,000 Jun-08 Jul-08 Aug-08 Sep-08 Oct-08 Nov-08 Dec-08 Jan-09 Feb-09 Mar-09 Apr-09 May-09 Jun-09 Jul-09 Aug-09 Sep-09 Oct-09 Nov-09 Dec-09 Jan-10 Feb-10 Mar-10 Apr-10 May-10 Jun-10 Jul-10 Aug-10 Sep-10 Oct-10 Nov-10 Dec-10 Jan-11 Feb-11 Mar-11 Apr-11 May-11 Jun-11 Jul-11 Aug-11 Sep-11 Oct-11 Nov-11 Dec-11 Jan-12 Feb-12 Mar-12 Apr-12 May-12 Jun-12 Jul-12 Aug-12 Sep-12 Oct-12 Nov-12 Dec-12 Jan-13 Feb-13 Mar-13 Apr-13 May-13 Jun-13 Jul-13 Aug-13 Sep-13 Oct-13 Nov-13 Dec-13 Jan-14 Feb-14 Mar-14 Apr-14 May-14 Jun-14 Jul-14 Aug-14 Sep-14 Oct-14 Tulsa Metro Area Home Sales ( ) 12-Month Moving Average
94 City of Tulsa - Foreclosures per 10,000 Homes ( ) month moving average Sep-14 May-14 Jan-14 Sep-13 May-13 Jan-13 Sep-12 May-12 Jan-12 Sep-11 May-11 Jan-11 Sep-10 May-10 Jan-10 Sep-09 May-09 Jan-09 Sep-08 May-08 Jan-08 Sep-07 May-07 Jan-07 Sep-06 May-06 Jan-06 Sep-05 May-05 Jan-05 Sep-04 May-04 Jan-04
95 35% City of Tulsa Percentage of Homes Sold for Loss ( ) 30% 25% 20% 15% 10% 5% 0% Sep-14 May-14 Jan-14 Sep-13 May-13 Jan-13 Sep-12 May-12 Jan-12 Sep-11 May-11 Jan-11 Sep-10 May-10 Jan-10 Sep-09 May-09 Jan-09 Sep-08 May-08 Jan-08 Sep-07 May-07 Jan-07 Sep-06 May-06 Jan-06 Sep-05 May-05 Jan-05 Sep-04 May-04 Jan-04

96 0% 5% 10% 15% 20% 25% Cleveland St. Louis New Orleans Kansas City Pittsburgh Tulsa Tucson Oklahoma City Tampa Wichita Louisville Albuquerque Nashville Fort Worth Raleigh Omaha Oakland Denver Minneapolis median 12.7% Portland % Vacant Housing Units
97 33.5% Housing Vacancy Tulsa County Census Tracts where More than 25% of the Housing Units are Vacant

98 $0 $50,000 $100,000 $150,000 $200,000 $250,000 $300,000 $350,000 $400,000 $450,000 Oakland Portland Denver Raleigh Minneapolis Albuquerque New Orleans Nashville Tampa Louisville Oklahoma City Omaha Kansas City Tucson Tulsa Fort Worth Wichita St. Louis Pittsburgh Cleveland $121,300 median Median Value of Owner-Occupied Units


99 100% 90% 49.0% 80% 70% 60% 50% 40% 51.0% 30% 20% Renter-Occupied Units Owner-Occupied Units 10% 0%
100 98.1% 98.2% Housing Tenure

101 $0 $200 $400 $600 $800 $1,000 $1,200 Oakland Portland Tampa New Orleans Raleigh Denver Fort Worth Nashville Minneapolis Albuquerque Pittsburgh Kansas City Omaha Oklahoma City Tucson Tulsa St. Louis Louisville Wichita Cleveland $727 median Median Gross Rent

102 0% 10% 20% 30% 40% 50% 60% 70% 80% 90% 100% New Orleans Cleveland Tucson Oakland Albuquerque Portland Tampa Pittsburgh St. Louis Omaha Denver Kansas City Minneapolis Fort Worth Louisville Tulsa Oklahoma City Wichita Raleigh Nashville 38.1% median Gross Rent 35% or More of Household Income
103 Human Investment
104 0% 10% 20% 30% 40% 50% 60% 70% 80% 90% 100% Raleigh Minneapolis Portland Denver Pittsburgh Oakland Nashville New Orleans Tampa Albuquerque Omaha St. Louis Kansas City Tulsa Wichita Fort Worth Oklahoma City Louisville Tucson Cleveland 31.0% median Bachelor's Degree or Higher High School Graduate or Higher (including GED)


105 0% 10% 20% 30% 40% 50% 60% 70% 80% 90% 100% Raleigh Minneapolis Portland Denver Pittsburgh Oakland Nashville New Orleans Tampa Albuquerque Omaha St. Louis Kansas City Tulsa Wichita Fort Worth Oklahoma City Louisville Tucson Cleveland Bachelor's Degree or Higher High School Graduate or Higher (including GED)
106 25 Public Schools $30, $25, $20,000 $15, $10,000 5 $5,000 0 $0 Student/Teacher Ratio (largest public district in city) Total Expenditures per Student (largest public district in city)


107 25 Public Schools $30, $25, $20,000 $15, $10,000 5 $5,000 0 $0 Student/Teacher Ratio (largest public district in city) Total Expenditures per Student (largest public district in city)

108 25 $30, $25, $20,000 $15, $10,000 5 $5,000 0 Tulsa Union Jenks $0 Student/Teacher Ratio Total Expenditures per Student

109 Percent of 4-Year-Olds Enrolled in State Pre-Kindergarten (Statewide) 0% 10% 20% 30% 40% 50% 60% 70% 80% 90% 100% Tampa Oklahoma City Tulsa Fort Worth New Orleans Louisville Omaha Raleigh Nashville Wichita Albuquerque Oakland Denver Pittsburgh Portland Tucson Kansas City St. Louis Cleveland Minneapolis median


110 35% 30% Health Profile Percent Obese Percent of Adults who Smoke Percent who Exercise 25% 20% 15% 10% 5% 0%

111 8,000 Percent Obese 33% 7, Population Density (per square mile) 31% 6,000 29% 5,000 4,000 3,000 27% 25% 23% 21% 2,000 19% 1,000 17% 0 15%
112


113 0% 5% 10% 15% 20% 25% 30% Fort Worth Tulsa Oklahoma City Tucson St. Louis Oakland Kansas City New Orleans Nashville Cleveland Albuquerque Denver Wichita Raleigh Tampa Portland Louisville Omaha Minneapolis Pittsburgh median Children with no health insurance coverage Adults with no health insurance coverage
114 45.4% Health Insurance Tulsa County Census Tracts where More than 40% of Residents Have no Health Insurance Coverage
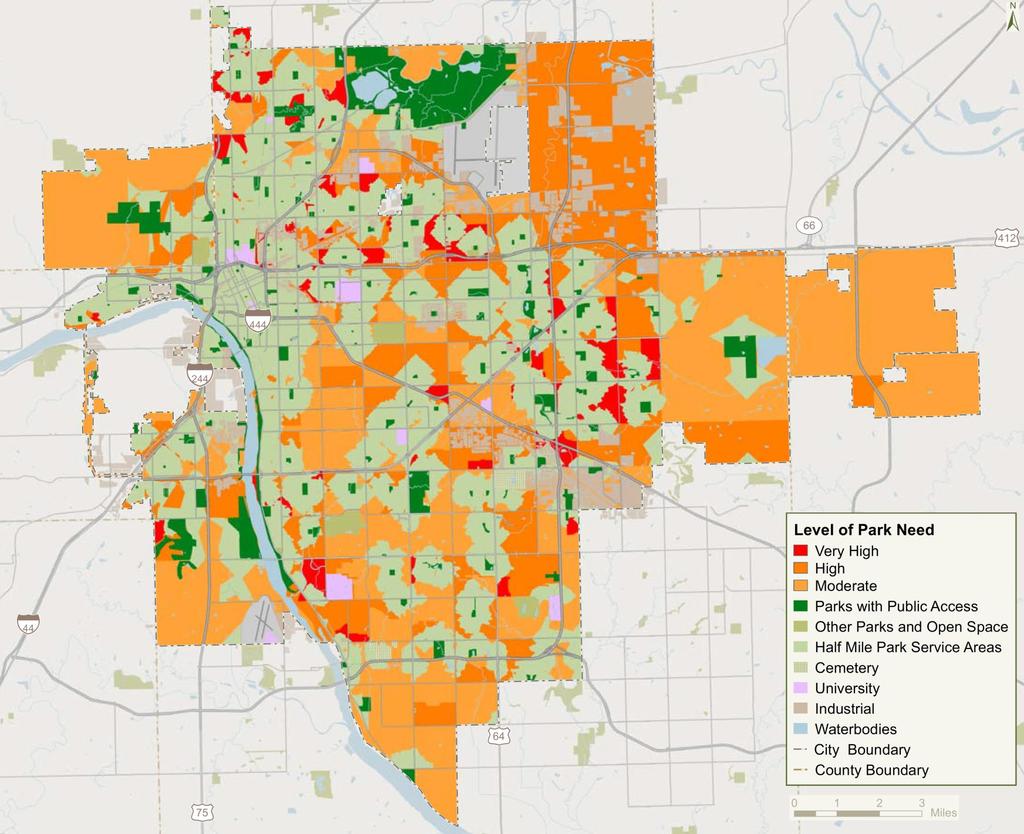
115 Recreation & Culture


 230")
116 Tulsa Park and Recreation Department 5,995 acres River Parks Authority 1,066 acres Tulsa County Parks (within city of Tulsa) 230 acres 7,291 acres


117 0% 5% 10% 15% 20% 25% Minneapolis Omaha St. Louis Denver Portland Fort Worth Cleveland Oakland Tampa Raleigh Kansas City Pittsburgh Albuquerque Wichita Louisville Tulsa Nashville Tucson New Orleans Oklahoma City 1.9% 3.9% Parkland as Percent of Adjusted Total Land Area Designed Parkland (all jurisdictions) Natural Parkland (all jurisdictions)


118 80 70 Acres of Parkland per 1,000 Residents # Park Units per 100,000 Residents median median
119 100% 94% Percent of Population With Walkable Park Access (only calculated for 50 largest cities) 90% 80% 85% 81% 80% 78% 76% 76% 70% 64% 60% 55% 54% 53% 52% 50% median 50% 42% 40% 36% 32% 30% 20% 10% 0% Park Access is the ability to reach a publicly owned park within a half-mile walk on the road network, unobstructed by freeways, rivers, fences, and other obstacles.
120


121 $0 $15 $30 $45 $60 $75 $90 $105 $120 $135 $150 $165 $180 $195 $210 $225 Minneapolis Raleigh Oakland Portland Tampa St. Louis Kansas City Denver Tucson Cleveland Pittsburgh Fort Worth Omaha New Orleans Louisville/Jefferson Nashville/Davidson Albuquerque Wichita Oklahoma City Tulsa $34.18 $4.99 median Park Operating Expenditure per Resident Park Capital Expenditure per Resident


122 400,000 Attendance Performing Arts Center (FY ) $14,000, ,000 Gross Ticket Sales $12,000, ,000 $10,000, ,000 $8,000, ,000 $6,000, , ,000 $4,000,000 50,000 $2,000,000 0 FY02 FY03 FY04 FY05 FY06 FY07 FY08 FY09 FY10 FY11 FY12 FY13 FY14 $0
123 Environment
124 Pittsburgh Fort Worth Cleveland St. Louis Tulsa Louisville Oklahoma City Albuquerque Oakland Tampa Raleigh Nashville Omaha Tucson Portland Wichita Denver Kansas City Minneapolis New Orleans median Air Quality - Ten Year Average Annual Number of Unhealthy Days for Older Adults and Children (County)
125 parts per million Tulsa Area Ground Level Ozone (3-Year average of the 4th highest ozone level)


126 Pounds 3,000,000 Tulsa County Toxic Chemical Releases ( ) 2,500,000 Total On-site Releases to Land Total Underground Injection 2,000,000 Surface Water Discharges Total Air Emissions 1,500,000 1,000, ,

127 Tons 16,000 14,000 City of Tulsa Residential Recycling (FY01-14) 12,000 10,000 8,000 6,000 4,000 subscription service 2,000 0 FY01 FY02 FY03 FY04 FY05 FY06 FY07 FY08 FY09 FY10 FY11 FY12 FY13 FY14
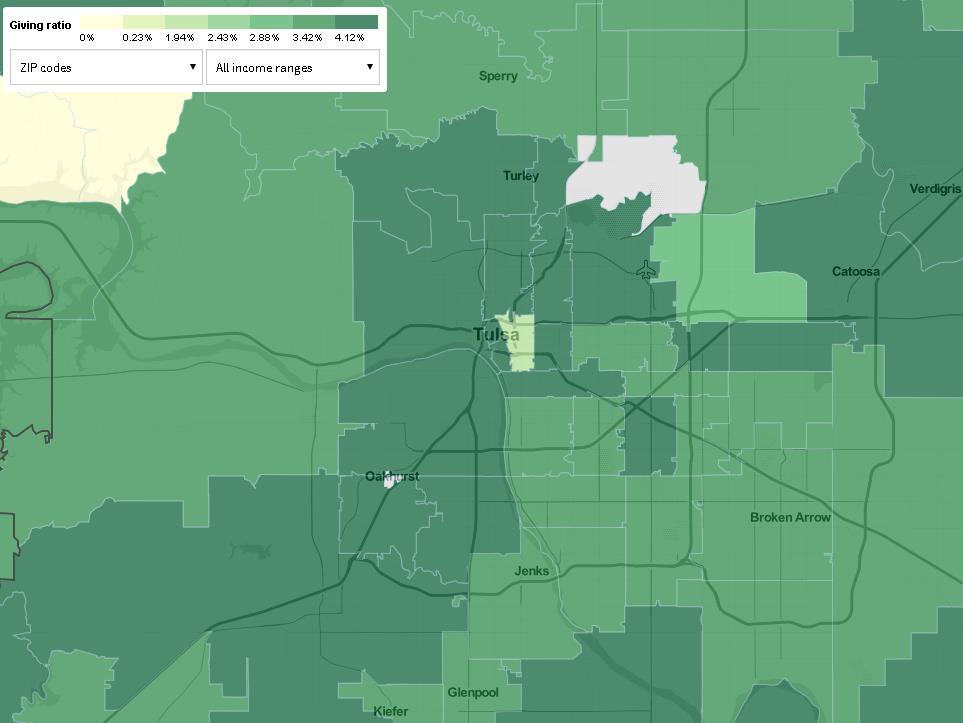
128 Citizen Engagement


129 rate hours 40% 35% 2012 Volunteer Rates 2012 Volunteer Hours per Resident % 35 25% 20% 15% % 10 5% 5 0% 0
130 6% Percent of Adjusted Gross Income Given to Charity (County) $5,000 5% 5.53% Median Annual Charitable Contribution (County) $4,500 $4,000 4% $3,500 $3,000 3% $2,500 $2,000 2% $1,500 1% $1,000 $500 0% $0
 $5,000 $4,500 $4,000 4% $3,500 $3,000 3% $2,500")
131 6% Percent of Adjusted Gross Income Given to Charity (County) 5% $4, % Median Annual Charitable Contribution (County) $5,000 $4,500 $4,000 4% $3,500 $3,000 3% $2,500 $2,000 2% $1,500 1% $1,000 $500 0% $0
132

133
A COMPARISON OF THE MILWAUKEE METROPOLITAN AREA TO ITS PEERS
 KRY/WJS/EDL #222377 (PDF: #223479) 1/30/15 PRELIMINARY DRAFT Memorandum Report A COMPARISON OF THE MILWAUKEE METROPOLITAN AREA TO ITS PEERS EXECUTIVE SUMMARY This memorandum report provides a statistical
A COMPARISON OF THE MILWAUKEE METROPOLITAN AREA TO ITS PEERS
 KRY/WJS/EDL #222377 v4 (PDF: #223479v2) 4/1/15 APPENDIX D REVISED DRAFT Memorandum Report A COMPARISON OF THE MILWAUKEE METROPOLITAN AREA TO ITS PEERS EXECUTIVE SUMMARY This report provides a statistical
January 2018 Air Traffic Activity Summary
 January 2018 Air Traffic Activity Summary Jan-2018 Jan-2017 CY-2018 CY-2017 Passengers 528,947 505,421 4.7% 528,947 505,421 4.7% Passengers 537,332 515,787 4.2% 537,332 515,787 4.2% Passengers 1,066,279
The Housing Market and the Macroeconomy
 The Housing Market and the Macroeconomy New England Mortgage Bankers Association October 2, 2009 1 The World is in a Deep Recession In the U.S. EMPLOYMENT: Job losses in August, 2009: -216,000 Job losses
October 2018 October 2017 Change
 AIR TRAFFIC REPORT SUMMARY: OCTOBER PASSENGERS October October Change Domestic Passengers 1,969,141 1,861,225 5.8% International Passengers 89,328 74,157 20.5% Total Passengers 2,058,469 1,935,382 6.4%
November 2013 Passenger and Cargo Traffic Statistics Reno-Tahoe International Airport
 November 2013 Passenger and Cargo Traffic Statistics Reno-Tahoe International Airport December 26, 2013 U.S. DOMESTIC INDUSTRY OVERVIEW FOR NOVEMBER 2013 All RNO Carriers Domestic Systemwide year over
June Air Traffic Statistics. Prepared by the Office of Corporate Risk and Strategy
 June 214 Air Traffic Statistics Prepared by the Office of Corporate Risk and Strategy Air Traffic Statistics Table of Contents Summary Air Traffic Summary... 1 SH&E Air Traffic Schedule Activity... 3 Passenger
Fort Lauderdale August 8, 2017
 Fort Lauderdale August 8, 2017 8/10/2017 TAP Software Analytics Division Brian Finucane TAP Reports Jeff Eastman TAP Hotel Reports Jeanne Eastman TAP Data Source Jeff Eastman Cloud Database Numerous Data
Park-Related Total* Expenditure per Resident, by City
 Park-Related Total* per Resident, by City FY 2008 City Population Total Park per Resident Washington, D.C. 591,833 $153,324,830 $259 Seattle 598,541 $150,672,543 $252 Scottsdale 235,371 $50,429,049 $214
Chattanooga & Hamilton Co. Tourism Trends & Economic Outlook
 Chattanooga & Hamilton Co. Tourism Trends & Economic Outlook How Tourism Works for Chattanooga, TN January 21, 2010 Presentation by: Steve Morse, Ph.D. Director & Economist, Tourism Institute University
Puerto Ricans in Rhode Island, the United States, and Puerto Rico, 2013
 Issued September 2016 Centro DS2015US-07 Puerto Ricans in Rhode Island, the United States, and Puerto Rico, 2013 In 2013 an estimated 36,217 Puerto Ricans lived in Rhode Island and accounted for at least
December 2013 Passenger and Cargo Traffic Statistics Reno-Tahoe International Airport
 December 2013 Passenger and Cargo Traffic Statistics Reno-Tahoe International Airport January 24, 2014 U.S. DOMESTIC INDUSTRY OVERVIEW FOR DECEMBER 2013 All RNO Carriers Domestic Systemwide year over year
October 2013 Passenger and Cargo Traffic Statistics Reno-Tahoe International Airport
 October 2013 Passenger and Cargo Traffic Statistics Reno-Tahoe International Airport December 4, 2013 U.S. DOMESTIC INDUSTRY OVERVIEW FOR OCTOBER 2013 All RNO Carriers Systemwide year over year comparison
Puerto Ricans in Connecticut, the United States, and Puerto Rico, 2014
 Issued April 2016 Centro DS2016US-8 Puerto Ricans in Connecticut, the United States, and Puerto Rico, 2014 In 2014, Connecticut was the 6th state with most Puerto Ricans (301,182) in the United States.
Asheville Metro Economic Report 2014 Second Quarter
 Asheville Metro Economic Report Johnson Price Sprinkle PA HIGHLIGHTS: ASHEVILLE METRO The Asheville metro area gained 2,400 more jobs than one year earlier, averaging a growth rate of 1.4 percent, continuing
National Housing Trends
 National Housing Trends America s Choice of Best Long Term Investment Gallup 2017 The Cost of RENTING vs. BUYING HISTORICALLY: NOW: Percentage of Income Needed to Afford Median Rent 25.8% 29.2% Percentage
RIDERSHIP TRENDS. October 2017
 RIDERSHIP TRENDS October 2017 Prepared by the Division of Strategic Capital Planning December 2017 Table of Contents Executive Summary...1 Ridership...3 Estimated Passenger Trips by Line...3 Estimated
Rank Place State Native Hawaiian and Pacific Islander population (alone or in combination
 TABLE 2a: 100 Largest Places Ranked by Number of s (race alone or in *) Living in Hard-to- Census Rank Place State (alone or in 1 Honolulu (CDP) HI 64,196 11,130 17.3 2 New York City NY 14,981 8,211 54.8
Kern County: Last Redoubt of the California Dream?
 Kern County: Last Redoubt of the California Dream? Speech to Kern County EDC Economic Summit Bakersfield, CA March 15, 2017 By Joel Kotkin, Presidential Fellow in Urban Futures, Chapman University and
With the completion of this project, we would like to follow-up on the projections as well as highlight a few other items:
 TO: FROM: Mayor and Council Interim City Manager Rebecca Underhill, Director of Finance DATE: February 28, 2014 SUBJECT: Water Meter Project Analysis On March 28, 2012, Acting City Manager Mike Loftin
Note: These Louisiana indicators show the percentage difference from Second Quarter 2004 to Second Quarter 2005.
 Second Quarter 2005 The Louisiana Travel Pulse is a quarterly industry travel barometer designed to present recent trends in travel industry performance. This issue s emphasis is on the Second Quarter
PROFILE OF THE PUERTO RICAN POPULATION IN UNITED STATES AND PUERTO RICO: 2008
 PROFILE OF THE PUERTO RICAN POPULATION IN UNITED STATES AND PUERTO RICO: 2008 Sonia G. Collazo, Camille L. Ryan, Kurt J. Bauman U.S. Census Bureau Housing and Household Economic Statistics Division This
October Air Traffic Statistics. Prepared by the Office of Corporate Risk and Strategy
 October 214 Air Traffic Statistics Prepared by the Office of Corporate Risk and Strategy Metropolitan Washington Airports Authority Air Traffic Statistics Table of Contents Summary Air Traffic Summary...
Monthly Employment Watch: Milwaukee and the Nation's Largest Cities
 Monthly Employment Watch: Milwaukee and the Nation's Largest Cities A monthly report on employment trends in the nation s largest cities Prepared by: The University of Wisconsin-Milwaukee Center for Economic
Puerto Ricans in Ohio, the United States, and Puerto Rico, 2014
 Issued April 2016 Centro DS2015US-12 Puerto Ricans in Ohio, the United States, and Puerto Rico, 2014 In 2014, Ohio had the tenth largest number of Puerto Ricans in the United States with 108,174 residents,
Monthly Employment Watch: Milwaukee and the Nation's Largest Cities
 Monthly Employment Watch: Milwaukee and the Nation's Largest Cities A monthly report on employment trends in the nation s largest cities Prepared by: The University of Wisconsin-Milwaukee Center for Economic
Existing Services, Ridership, and Standards Report. June 2018
 Existing Services, Ridership, and Standards Report June 2018 Prepared for: Prepared by: Contents Overview of Existing Conditions... 1 Fixed Route Service... 1 Mobility Bus... 34 Market Analysis... 41 Identification/Description
ELMHURST, NY MARKET PROFILE. FOR INFORMATION: Macerich.com
 ELMHURST, NY MARKET PROFILE 2016 PROPERTY TYPE: Super-regional TOTAL SQUARE FEET: 966,000 MAJOR RETAILERS: Apple, Forever 21, H&M, JCPenney, Macy s RESTAURANTS & ENTERTAINMENT: Applebee s Neighborhood
July air traffic statistics. Prepared by the Office of Corporate Risk and Strategy
 July 214 air traffic statistics Prepared by the Office of Corporate Risk and Strategy Air Traffic Statistics Table of Contents Summary Air Traffic Summary... 1 SH&E Air Traffic Schedule Activity... 3 Passenger
September 2013 Passenger and Cargo Traffic Statistics Reno-Tahoe International Airport
 September 2013 Passenger and Cargo Traffic Statistics Reno-Tahoe International Airport October 31, 2013 U.S. DOMESTIC INDUSTRY OVERVIEW FOR SEPTEMBER 2013 All RNO Carriers Systemwide year over year comparison
RIDERSHIP TRENDS. August 2018
 RIDERSHIP TRENDS August Prepared by the Division of Strategic Capital Planning October Table of Contents Executive Summary...1 Ridership...3 Estimated Passenger Trips by Line...3 Estimated Passenger Trips
ELIZABETHTOWN, KY MARKET PROFILE. FOR INFORMATION: Macerich.com
 ELIZABETHTOWN, KY MARKET PROFILE 2016 PROPERTY TYPE: Regional TOTAL SQUARE FEET: 350,000 MAJOR RETAILERS: Belk, JCPenney, Sears RESTAURANTS & ENTERTAINMENT: LongHorn Steakhouse FOOD COURT: 5 units BUILT:
T H E VILLAGE OF P h i l m o n t, N Y
 T H E VILLAGE OF P h i l m o n t, N Y Summit Reservoir Area Plan November 17, 2014 Executive Steering Committee Meeting 2 Agenda 1:00 1. Welcome 2. Housekeeping & updates i. Committee contact list review
THANK YOU TO OUR SPONSOR
 THANK YOU TO OUR SPONSOR THANK YOU TO OUR HOST POPULATION POPULATION GROWTH St. Petersburg & Pinellas County Population Growth Rate 3.50% 3.00% 2.50% 2.00% 1.50% 1.00% 0.50% 0.00% -0.50% -1.00% -1.50%
RIDERSHIP TRENDS. January 2018
 RIDERSHIP TRENDS January 2018 Prepared by the Division of Strategic Capital Planning March 2018 Table of Contents Executive Summary...1 Ridership...3 Estimated Passenger Trips by Line...3 Estimated Passenger
Visit Wales Research Update
 Visit Wales Research Update 19 January 21 This update summarises tourism performance by drawing upon Visit Wales own research and information from other relevant sources. It is based upon information available
August air traffic statistics. Prepared by the Office of Corporate Risk and Strategy
 August 214 air traffic statistics Prepared by the Office of Corporate Risk and Strategy Metropolitan Washington Airports Authority Air Traffic Statistics Table of Contents Summary Air Traffic Summary...
May 2011 Passenger and Cargo Traffic Statistics Reno-Tahoe International Airport
 May 2011 Passenger and Cargo Traffic Statistics Reno-Tahoe International Airport July 5, 2011 U.S. DOMESTIC INDUSTRY OVERVIEW FOR MAY 2011 All RNO Carriers Systemwide year over year comparison Average
Monthly Employment Watch: Milwaukee and the Nation's Largest Cities
 Monthly Employment Watch: Milwaukee and the Nation's Largest Cities A monthly report on employment trends in the nation s largest cities Prepared by: The University of Wisconsin-Milwaukee Center for Economic
Puerto Ricans in Massachusetts, the United States, and Puerto Rico, 2014
 Issued April 2016 Centro DS2016US-07 Puerto Ricans in Massachusetts, the United States, and Puerto Rico, 2014 In 2014, Massachusetts was the fifth state with most Puerto Ricans in the United States. In
March 2014 Passenger and Cargo Traffic Statistics Reno-Tahoe International Airport
 March 2014 Passenger and Cargo Traffic Statistics Reno-Tahoe International Airport April 25, 2014 U.S. DOMESTIC INDUSTRY OVERVIEW FOR MARCH 2014 All RNO Carriers Domestic Systemwide year over year comparison
The Outlook for the Residential Construction Industry Hunter and the Central Coast
 The Outlook for the Residential Construction Industry Hunter and the Central Coast Graham Wolfe HIA Chief Executive Industry Policy and Media HIA Industry Outlook Breakfast Newcastle February 2013 Backdrop:
International migration. Total net migration. Domestic migration
 Indicator Direction Comparables a. Net population migration b. Crime rate (city) c. Housing costs d. Cost-of-living index N.A. e. State & local tax intensity f. Performing arts groups g. Air quality index
Monthly Employment Watch: Milwaukee and the Nation's Largest Cities
 Monthly Employment Watch: Milwaukee and the Nation's Largest Cities A monthly report on employment trends in the nation s largest cities Prepared by: The University of Wisconsin-Milwaukee Center for Economic
Table of Contents PAGE
 FEBRUARY 2018 EL PASO INTERNATIONAL AIRPORT MONTHLY ACTIVITY REPORT February 2018 Table of Contents PAGE AIRPORT ACTIVITY OVERVIEW 1 NONSTOP DESTINATION ANALYSIS 2 MAP OF NONSTOP DESTINATIONS 3 FLIGHT
January 2014 Passenger and Cargo Traffic Statistics Reno-Tahoe International Airport
 January 2014 Passenger and Cargo Traffic Statistics Reno-Tahoe International Airport March 12, 2014 U.S. DOMESTIC INDUSTRY OVERVIEW FOR DECEMBER 2013 All RNO Carriers Domestic Systemwide year over year
Inter-Office Memo Reno-Tahoe Airport Authority
 Inter-Office Memo Reno-Tahoe Airport Authority Date: November 30, 2009 To: Statistics Recipients From: Krys T. Bart, A.A.E., President/CEO Subject: RENO-TAHOE INTERNATIONAL AIRPORT PASSENGER STATISTICS
November Air Traffic Statistics. Prepared by the Office of Corporate Risk and Strategy
 November 214 Air Traffic Statistics Prepared by the Office of Corporate Risk and Strategy Air Traffic Statistics Table of Contents Summary Air Traffic Summary... 1 SH&E Air Traffic Schedule Activity...
U.S. DOMESTIC INDUSTRY OVERVIEW FOR MARCH
 Inter-Office Memo Reno-Tahoe Airport Authority Date: April 30, 2009 To: Statistics Recipients From: Krys T. Bart, A.A.E., President/CEO Subject: RENO-TAHOE INTERNATIONAL AIRPORT PASSENGER STATISTICS U.S.
August Air Traffic Statistics. Prepared by the Office of Corporate Risk and Strategy
 August 215 Air Traffic Statistics Prepared by the Office of Corporate Risk and Strategy Metropolitan Washington Airports Authority Air Traffic Statistics Table of Contents Summary Air Traffic Summary...
Passenger and Cargo Statistics Report
 Passenger and Cargo Statistics Report Reno-Tahoe International Airport October 2018 U.S. DOMESTIC INDUSTRY OVERVIEW FOR OCTOBER 2018 Systemwide RNO Carriers Domestic Flights year over year comparison Average
BRANSON 2 nd QUARTER 2014 MARKETING REPORT
 BRANSON 2 nd QUARTER 2014 MARKETING REPORT October 14, 2014 Branson Convention & Visitors Bureau PRESENTATION OVERVIEW Economic Overview Travel Industry Update Branson 2Q 2014 Update ECONOMIC OUTLOOK Consumer
Get Smart Market Insights from Our Research Team Customer Conference
 Get Smart Market Insights from Our Research Team 217 Customer Conference Presenters Amanda Nunnink Amanda Nunnink Steve Steve Guggenmos Guggenmos Sara Steve Hoffman Griffin Steve Sara Griffin Hoffmann
September Air Traffic Statistics. Prepared by the Office of Corporate Risk and Strategy
 September 214 Air Traffic Statistics Prepared by the Office of Corporate Risk and Strategy Air Traffic Summary September 214 Commercial Total Dom Int'l Passengers % Change Passenger Activity (in Millions)
Monthly Employment Watch: Milwaukee and the Nation's Largest Cities
 Monthly Employment Watch: Milwaukee and the Nation's Largest Cities A monthly report on employment trends in the nation s largest cities Prepared by: The University of Wisconsin-Milwaukee Center for Economic
August 2014 Passenger and Cargo Traffic Statistics Reno-Tahoe International Airport
 August 2014 Passenger and Cargo Traffic Statistics Reno-Tahoe International Airport October 8, 2014 U.S. DOMESTIC INDUSTRY OVERVIEW FOR AUGUST 2014 All RNO Carriers Domestic Systemwide year over year comparison
COMPARATIVE INDICATORS TO OTHER HAMPTON ROADS CITIES. David Bradley
 COMPARATIVE INDICATORS TO OTHER HAMPTON ROADS CITIES David Bradley July 14, 2017 EXPENDITURES BY CATEGORY - FY 2015-16 ALL FUNDS 100.0% 8.1% 4.1% 7.2% 9.2% 5.8% 8.6% 6.9% 80.0% 60.0% 45.0% 49.1% 36.1%
air traffic statistics
 October 213 air traffic statistics Prepared by the Office of Finance Department of Internal Controls, Compliance and Financial Strategy Metropolitan Washington Airports Authority Air Traffic Statistics
BRAZIL INTERNATIONAL INBOUND TRAVEL MARKET PROFILE (2011) Copyright 2012 by the U.S. Travel Association. All Rights Reserved.
 Copyright 2012 by the U.S. Travel Association. All Rights Reserved.") BRAZIL INTERNATIONAL INBOUND TRAVEL MARKET PROFILE (211) Copyright 212 by the U.S. Travel Association. All Rights Reserved. EXECUTIVE SUMMARY With a population of nearly 2 million and a GDP exceeding $2
BRAZIL INTERNATIONAL INBOUND TRAVEL MARKET PROFILE (211) Copyright 212 by the U.S. Travel Association. All Rights Reserved. EXECUTIVE SUMMARY With a population of nearly 2 million and a GDP exceeding $2
December 2012 Passenger and Cargo Traffic Statistics Reno-Tahoe International Airport
 December 2012 Passenger and Cargo Traffic Statistics Reno-Tahoe International Airport January 29, 2013 U.S. DOMESTIC INDUSTRY OVERVIEW FOR DECEMBER 2012 All RNO Carriers Systemwide year over year comparison
2nd Quarter. AEDC is pleased to present the Anchorage Quarterly Economic Indicators Report for the second quarter of 2010.
 2010 AEDC is pleased to present the Anchorage Quarterly Economic Indicators Report for the second quarter of 2010. This report summarizes recently updated data from the Anchorage Economic Indicators Database,
May Air Traffic Statistics. Prepared by the Office of Corporate Risk and Strategy
 May 214 Air Traffic Statistics Prepared by the Office of Corporate Risk and Strategy Commercial Total Int'l Dom Air Traffic Summary May 214 Passenger Activity (in Millions) Current Month Year-to-Date Last
Regional Outlook STEVEN G. COCHRANE, MANAGING DIRECTOR
 Regional Outlook STEVEN G. COCHRANE, MANAGING DIRECTOR Differences Narrow; Southeast Vies for Lead Employment, % change yr ago 3.5 3.0 Southwest 2.5 2.0 1.5 East South Central South Atlantic Northeast
Lower Income Journey to Work Market Share From American Community Survey
 Lower Income Journey to Work Market Share From American Community Survey 2006-2010 Table 1: Overall National Data Table 2: Car, Truck or Van Table 3: Transit Table 4: Metrics Table 1 Work Trip Market Share:
VALLEY STREAM, NY MARKET PROFILE. FOR INFORMATION: Macerich.com
 VALLEY STREAM, NY MARKET PROFILE 2016 PROPERTY TYPE: Regional TOTAL SQUARE FEET: 1,799,000 MAJOR RETAILERS: American Eagle, Best Buy, BJ s Wholesale Club, Century 21, Express, Forever 21, H&M, JCPenney,
Cheatham County, TN. Hotel, Restaurant, and Travel Industries: Economic Profile and Business Trends, 2006
 Cheatham County, TN Cheatham County (Kingston Springs & Ashland City areas) Hotel, Restaurant, and Travel Industries: Economic Profile and Business Trends, Steve Morse, Ph.D. Director & Economist Tourism
Monthly Employment Watch: Milwaukee and the Nation's Largest Cities
 Monthly Employment Watch: Milwaukee and the Nation's Largest Cities A monthly report on employment trends in the nation s largest cities Prepared by: The University of Wisconsin-Milwaukee Center for Economic
The Economic Impact of Travel in Kansas. Tourism Satellite Account Calendar Year 2013
 The Economic Impact of Travel in Kansas Tourism Satellite Account Calendar Year 2013 Who we are Tourism Economics Union of industry expertise and economic disciplines Real world insights based on quantitative
MANGO MARKET DEVELOPMENT INDEX REPORT
 MANGO MARKET DEVELOPMENT INDEX REPORT 2015-2016 UNDERSTANDING THE MARKET INDEX The Mango Market Development Index is designed to measure and compare mango sales volume relative to population by region
Passenger and Cargo Statistics Report
 Passenger and Cargo Statistics Report Reno-Tahoe International Airport December 2014 U.S. DOMESTIC INDUSTRY OVERVIEW FOR DECEMBER 2014 All RNO Carriers Domestic Systemwide year over year comparison Average
U.S. DOMESTIC INDUSTRY OVERVIEW FOR OCTOBER 2010 All RNO Carriers Systemwide year over year comparison
 Inter-Office Memo Reno-Tahoe Airport Authority Date: November 22, 2010 To: Chairman and Board of Trustees From: Krys T. Bart, A.A.E., President/CEO Subject: RENO-TAHOE INTERNATIONAL AIRPORT OCTOBER 2010
Passenger and Cargo Statistics Report
 Passenger and Cargo Statistics Report RenoTahoe International Airport July 2018 U.S. DOMESTIC INDUSTRY OVERVIEW FOR JULY 2018 Systemwide RNO Carriers Domestic Flights year over year comparison Average
Passenger and Cargo Statistics Report
 Passenger and Cargo Statistics Report RenoTahoe International Airport June 2018 U.S. DOMESTIC INDUSTRY OVERVIEW FOR JUNE 2018 Systemwide RNO Carriers Domestic Flights year over year comparison Average
Major US City Preparedness For an Oil Crisis Which Cities and Metro Areas are Best Prepared for $4 a Gallon Gas and Beyond?
 Major US City Preparedness For an Oil Crisis Which Cities and Metro Areas are Best Prepared for $4 a Gallon Gas and Beyond? March 4, 2008 By Warren Karlenzig President Common Current www.commoncurrent.com
Loudon County, TN. Hotel, Restaurant, and Travel Industries: Economic Profile and Business Trends, Loudon County (Loudon and Lenoir City areas)
") Loudon County, TN Loudon County (Loudon and Lenoir City areas) Hotel, Restaurant, and Travel Industries: Economic Profile and Business Trends, Steve Morse, Ph.D. Director & Economist Tourism Institute
Loudon County, TN Loudon County (Loudon and Lenoir City areas) Hotel, Restaurant, and Travel Industries: Economic Profile and Business Trends, Steve Morse, Ph.D. Director & Economist Tourism Institute
Housing Outlook. Mr Sam White, Ray White Group Mr Harley Dale, Housing Industry Association. 29 October 2007
 Housing Outlook Mr Sam White, Ray White Group Mr Harley Dale, Housing Industry Association 29 October 2007 Australian Business Economists October 2007 Presented by Sam White Average Prices 700,000 600,000
Passenger and Cargo Statistics Report
 Passenger and Cargo Statistics Report RenoTahoe International Airport September 2017 U.S. DOMESTIC INDUSTRY OVERVIEW FOR SEPTEMBER 2017 Systemwide RNO Carriers Domestic Flights year over year comparison
February Air Traffic Statistics. Prepared by the Office of Marketing & Consumer Strategy
 February 218 Air Traffic Statistics Prepared by the Office of Marketing & Consumer Strategy 1 This report includes only data submitted by airlines as of the date of publication: April 18, 218. Reports
Maury County, TN. Hotel, Restaurant, and Travel Industries: Economic Profile and Business Trends, Maury County (Columbia and Spring Hill area)
") Maury County, TN Maury County (Columbia and Spring Hill area) Hotel, Restaurant, and Travel Industries: Economic Profile and Business Trends, 06 Steve Morse, Ph.D. Director & Economist Tourism Institute
Maury County, TN Maury County (Columbia and Spring Hill area) Hotel, Restaurant, and Travel Industries: Economic Profile and Business Trends, 06 Steve Morse, Ph.D. Director & Economist Tourism Institute
RANKING OF THE 100 MOST POPULOUS U.S. CITIES 12/7/ /31/2016
 OVERVIEW OF THE DATA The following information is based on incoming communication to the National Human Trafficking Hotline via phone, email, and online tip report from December 7, 2007 December 31, 2016
Puerto Ricans in Georgia, the United States, and Puerto Rico, 2014
 Issued September 2016 Centro DS2014GA-14 Puerto Ricans in Georgia, the United States, and Puerto Rico, 2014 In 2014, an estimated 89,462 Puerto Ricans lived in Georgia and accounted for 1.7 percent of
State of the Shared Vacation Ownership Industry. ARDA International Foundation (AIF)
") State of the Shared Vacation Ownership Industry ARDA International Foundation (AIF) This paper includes a high-level overview of the timeshare industry with a core focus on financial growth, owner demographics
State of the Shared Vacation Ownership Industry ARDA International Foundation (AIF) This paper includes a high-level overview of the timeshare industry with a core focus on financial growth, owner demographics
Table of Contents PAGE
 DECEMBER 2018 EL PASO INTERNATIONAL AIRPORT MONTHLY ACTIVITY REPORT December 2018 Table of Contents PAGE AIRPORT ACTIVITY OVERVIEW 1 NONSTOP DESTINATION ANALYSIS 2 MAP OF NONSTOP DESTINATIONS 3 FLIGHT
Mango Market Development Index
 Mango Market Development Index 2016-2017 Understanding the Market Index The Mango Market Development Index is designed to measure and compare mango volume sold at retail relative to population by region
Table of Contents PAGE
 OCTOBER 2018 EL PASO INTERNATIONAL AIRPORT MONTHLY ACTIVITY REPORT October 2018 Table of Contents PAGE AIRPORT ACTIVITY OVERVIEW 1 NONSTOP DESTINATION ANALYSIS 2 MAP OF NONSTOP DESTINATIONS 3 FLIGHT SCHEDULE
Table of Contents PAGE
 NOVEMBER 2018 EL PASO INTERNATIONAL AIRPORT MONTHLY ACTIVITY REPORT November 2018 Table of Contents PAGE AIRPORT ACTIVITY OVERVIEW 1 NONSTOP DESTINATION ANALYSIS 2 MAP OF NONSTOP DESTINATIONS 3 FLIGHT
PHOENIX, AZ MARKET PROFILE. FOR INFORMATION: Macerich.com
 PHOENIX, AZ MARKET PROFILE 2016 PROPERTY TYPE: Super-regional TOTAL SQUARE FEET: 1,151,000 MAJOR RETAILERS: Costco, Dillard s, JCPenney, Macy s, Sears RESTAURANTS & ENTERTAINMENT: Chili s, Chipotle, Chompie
Louisville Neighborhoods A Statistical Portrait
 Louisville Neighborhoods A Statistical Portrait Michael Price Kentucky State Data Center University of Louisville March 2013 West Louisville 9th Street Algonquin Parkway Kentucky County Population Growth
Table of Contents PAGE
 April 2015 EL PASO INTERNATIONAL AIRPORT MONTHLY ACTIVITY REPORT April 2015 Table of Contents PAGE AIRPORT ACTIVITY OVERVIEW 1 NONSTOP DESTINATION ANALYSIS 2 MAP OF NONSTOP DESTINATIONS 3 FLIGHT SCHEDULE
July 2012 Passenger and Cargo Traffic Statistics Reno-Tahoe International Airport
 July 2012 Passenger and Cargo Traffic Statistics Reno-Tahoe International Airport August 31, 2012 U.S. DOMESTIC INDUSTRY OVERVIEW FOR JULY 2012 All RNO Carriers Systemwide year over year comparison Average
Manual vs. Automatic Operation and Operational Restrictions
 Customer Services, Operations, and Safety Committee Board Information Item IV-B March 11, 2010 Manual vs. Automatic Operation and Operational Restrictions Page 81 of 91 Washington Metropolitan Area Transit
U.S. Hotel Industry Performance. Brad Garner Chief Operating Officer
 U.S. Hotel Industry Performance Brad Garner Chief Operating Officer 1 Agenda Total US Review Scale Review Segmentation Markets Supply Pipeline 2013 / 2014 Forecast 2 www.hotelnewsnow.com Click on Hotel
The contribution of Tourism to the Greek economy in 2017
 The contribution of Tourism to the Greek economy in 2017 1 st edition (provisional data) May 2018 Dr. Aris Ikkos, ISHC Research Director Serafim Koutsos Analyst INSETE Republishing is permitted provided
Annual Diversion Rate for Class I Waste by Sector. Annual Diversion Rate for Class I Waste. January September University of Arkansas
 Annual Diversion Rate for Class I Waste by Sector Waste (Metric Ton) Recycling (Metric Ton) Diversion Rate Facilities Management 761.8 272.17 26% 91.5 6.37 6% 173.9 39.23 18% 229.38 3.87 12% Total Tons
The Beacon Hill Institute
 The Beacon Hill Institute at Suffolk University Metro Area Competitiveness Report 2007 BHI Metro Area Rankings 2007 Alphabetical Listing Subindexes, Rank in 2007 Overall Govt & Fiscal Policy Security Infrstrc
DTTAS Quarterly Aviation Statistics Snapshot Quarter Report
 Contents DTTAS Quarterly Aviation Statistics Snapshot Quarter 4 2015 Report 1.1 Dublin Airport Key Statistics... 1 1.2 Cork Airport Key Statistics... 3 1.3 Shannon Airport Key Statistics... 5 1.4 Total
DTTAS Quarterly Aviation Statistics Snapshot Quarter Report
 Contents DTTAS Quarterly Aviation Statistics Snapshot Quarter 1 2018 Report 1.1 Dublin Airport Key Statistics... 1 1.2 Cork Airport Key Statistics... 3 1.3 Shannon Airport Key Statistics... 5 1.4 Total
February Air Traffic Statistics. Prepared by the Office of Corporate Risk and Strategy
 February 215 Air Traffic Statistics Prepared by the Office of Corporate Risk and Strategy Commercial Total Dom Int'l Passengers % Change Air Traffic Summary February 215 Passenger Activity (in Millions)
MEDIA LIFESTYLE MAGAZINE COMMUNITY ORIENTED
 MEDIA LIFESTYLE MAGAZINE COMMUNITY ORIENTED ABOUT US Live it up Doral is a printed and digital magazine that invites readers to enjoy the city of Doral. Its editorial line combines life style with community
Visit Tallahassee. Economic Impact of Tourism Report Fiscal Year 2016
 Visit Tallahassee Economic Impact of Tourism Report Fiscal Year 2016 1 Study Methods Economic impact of tourism for Visit Tallahassee was based on data from the following sources: 3,984 interviews conducted