2016 Springfield, Illinois Visitor Study
|
|
|
- Jeffrey Carpenter
- 6 years ago
- Views:
Transcription


1 2016 Springfield, Illinois Visitor Study
2 2 Contents EXECUTIVE SUMMARY... 3 STUDY OBJECTIVE... 5 STUDY METHODOLOGY... 5 SECTION 1: PROFILE OF VISITORS... 7 A. Demographic Information of Visitors... 7 B. Motivation of Visitors C. Travel Behavior Patterns of Visitors D. Spending E. Activity Profiles F. Visitor Experience SECTION 2: NON-VISITOR COMPARISON with VISITORS A. Demographic Information B. Travel Intentions of Non-Visitors C. Non-Visitors Perceptions of Springfield, Illinois SECTION 3: EVALUATION OF INFORMATION A. Information B. Advertising and Promotion SECTION 4: DESTINATION CHOICE SECTION 5: CONVERSION RATE APPENDIX A: Origin of Travelers (by ZIP code) APPENDIX B: Reasons For Multiple Visitation (#Times, Comments) APPENDIX C: Most Memorable Part of Visit To Springfield, Illinois... 51
3 3 EXECUTIVE SUMMARY Study Objective The objective of this research project was to conduct an assessment of inquiries to the Springfield Convention and Visitors Bureau (CVB) between January 2010, and the close of the survey (January, 2016). Profiles of visitors and non-visitors were developed based on the data collected. Study Methodology An online survey was designed and conducted (December January, 2016) to identify the effectiveness of the marketing information sent to inquirers, and to develop a profile of visitors and non-visitors to Springfield. A total of 492 visitors and 132 non-visitors responded to the survey. Visitor Profile survey respondents that had previously visited Springfield are, on average: White, well-educated married couples over 46 years old with no children under the age of 18 living at home. Traveled to Springfield to visit historical sites and attractions, particularly Lincolnrelated sites and attractions. Traveled by car (less than 500 miles each way) and stayed an average of 3 nights in a hotel/motel, spending an average of $ per person over the course of their visit not including transportation to Springfield. The summer months were the most popular time to visit Springfield, with another small peak of visitation occurring in October. Top 5 visitor activities: 1. Explored sites and attractions related to Abraham Lincoln 2. Dining 3. Visited historic sites 4. Went to a museum or memorial 5. Took a tour Visitors reported a desire to participate in six activities of which they had been unaware: visiting a wildlife park or sanctuary, exploring Route 66, visiting an art gallery, winery or microbrewery, or taking in a show. Described the most memorable part of their trip to Springfield (Top 3 words used) 1. Lincoln 2. Museum 3. Historic Sixty percent of visitors intended to visit again in the next 2 years, while 93% would recommend Springfield to others. Non-Visitor Profile Non-visitors were not distinctly different from visitors in their demographic profile. More than half reported that it was likely or very likely that they would visit Springfield within 2 years, and 85% would recommend Springfield to others, even without having visited themselves. Top 3 reasons for not visiting: 1. Planning to visit in the future 2. Lacked time for a trip 3. Financial reasons Top 5 images attributed to Springfield: 1. Historic
4 2. Interesting 3. Friendly 4. Family friendly 5. Safe Top 3 most important attributes when choosing a trip 1. Safe 2. Interesting 3. Affordable Attributes important for destination choice, but perceived to be lacking in Springfield were: adventurous, exciting, outdoorsy, and scenic. Information Use and Outcomes Eighty-seven percent of the sample recalled receiving information about Springfield On average, the information received from the CVB positively affected the choice of Springfield as a destination. o Approximately 20% reported that the information they had received prompted them to extend their stay by one or two nights. o Information resulted in ~$30 more spending per person. o Information about what to see and do was considered the most useful information provided. Only 30% of respondents recalled seeing any advertising or promotion for Springfield, Illinois prior to requesting information. Advertising or promotion was most frequently recalled when it appeared in magazines, newspaper, and other print ads (58.92% of total respondents recalling an ad or promotion), followed by TV (42.16%) and travel websites (32.43%). Most (73%) utilized the Springfield Visitors Guide. Over half also accessed the Springfield, Illinois website as a source of information for their upcoming trip. Most visitors (71%) used travel-related websites to plan their trip. Top 3 websites used: 1. Trip Advisor 2. Expedia 3. Travelocity Visitors were 50% more likely than non-visitors to use travel related apps for their trip. Top 3 travel apps: 1. Trip Advisor 2. Google 3. Expedia Top 5 destinations considered in competition with Springfield: 1. St. Louis, MO 2. Chicago, IL 3. Hannibal, MO 4. Galena, IL 5. Indianapolis, IN 4
5 5 STUDY OBJECTIVE The objective of this project was to establish baseline data for the tourist destination of Springfield, Illinois by conducting an assessment of recent inquiries to the Springfield Convention and Visitors Bureau. The data collected provide an understanding of the market segment interest in Springfield, Illinois as a tourist destination over the past six years, which can then be used as a benchmark for tourist interest in the future. In short, data collected allow us to determine who is choosing to visit Springfield, Illinois as well as who is not choosing to visit Springfield. Profiles of visitors and non-visitors were developed based on the data collected. STUDY METHODOLOGY Using inquiry data (obtained from the Springfield CVB), an online survey was designed and conducted (December January, 2016) to identify perceptions of the marketing information sent to inquirers, to examine the effectiveness of that information, and to develop a profile of visitors and non-visitors to Springfield, Illinois. Individuals who had contacted the Springfield CVB between January 2010 and December 2015 to request travel information were contacted via , and asked to participate in the survey. The survey instrument included 48 questions, collecting information on: (1) travel information received, (2) travel purpose, experiences and behavior, (3) perceptions of Springfield as a tourist destination, (4) travel expenditures, and (5) demographics. The survey was launched on December 16 th 2015, and remained open for 24 days. Survey participants were asked about their travel experiences between January 2010, and the time of the survey (December January, 2016). The participants were contacted directly via , with a link directing them to the survey provided. The responses of the survey participants were automatically stored in a database created for this project by Qualtrics. s were sent in three waves. s were sent to 1,039 unique addresses from the database of walk-in inquiries on December 17, A random sample of 6,310 unique addresses were drawn from the database of information requests, and sent invitations on December 17, Another 4,594 unique addresses were drawn from the database of information requests, and ed the survey link on December 28, Seven hundred eighty-three surveys were accessed; 624 completed surveys were included for analysis. For further details, please see Table 1.
6 6 Table 1. Sample Size and Responses Walk-ins Other info requests Wave 1 Other info requests Wave 2 Aggregate s sent s bounced back Duplicate s Total unique s Surveys opened Surveys completed Figure 1. Breakdown of Respondents (n=624) Non-visitor 7% Future visitor 15% Visitor 78% 0% 20% 40% 60% 80% 100% The majority of survey respondents (78%) had visited Springfield, Illinois since January 1, 2010, with non-visitors making up the remainder 22% of respondents (Figure 1). Of those non-visitors, 15% reported having the intention of visiting Springfield, while 7% of nonvisitors were not planning a visit in the near future.
7 7 SECTION 1: PROFILE OF VISITORS A. Demographic Information of Visitors The vast majority of survey respondents (75%) visiting Springfield in the last six years were over 46 years old. In addition, 62% of respondents were female, and 38% were male. Furthermore, Caucasians represented 86% of visitors, with African Americans making up 3% of visitors, Latinos 2%, and Asian Americans representing 2% of visitors. Figure 2. Demographic Profile of Springfield, Illinois Visitors AGE 6% 6% 12% 27% 20% 29% over 75 GENDER 62% Female 38% Male
8 8 ETHNICITY Caucasian 425 Declined to respond 21 African American 16 Latino 9 Asian 8 Native American 3 Others* *Others include: American (1), Asian/Caucasian (1), Bi-racial (1), European (1), Indian (1), Puerto Rican (1), and Southerner (1).
9 9 Two thirds of respondents who reported visiting Springfield, Illinois have a degree from a fouryear higher education institution, with almost one third having completed a postgraduate degree. In addition, over 40% of respondents reported having a household income of over $55,000 (Table 2). Table 2. Socio-Economic Profile of Springfield, Illinois Visitors Respondents Percent Education Level (n=477) High school or less % Some college/technical school % College graduate % Post graduate degree % Household Income (n=468) under $25, % $25,000 to 34, % $35,000 to 44, % $45,000 to 54, % $55,000 to 64, % $65,000 to 74, % $75,000 to 84, % $85,000 to 94, % $95,000 to 104, % $105,000 to 114, % $115,000 to 124, % over $125, % prefer not to say %
10 10 According to survey results, the majority of respondents who reported visiting Springfield, Illinois are married (75%). Over two-thirds of those live in two adult households, with a similar number of respondents without children under the age of 18 living at home (Table 3). Table 3. Household Composition Number of adults (18+) in the household (n=472) Respondents Percent % % % % % % more than % Number of children under 18 in the household (n=465) % % % % % % more than %
11 11 B. Motivation of Visitors According to survey results, Springfield, Illinois visitors are driven by a variety of reasons (Figure 3). Respondents cited visiting historical sites and attractions as the primary purpose for their most recent trip to Springfield (n=200, 4.65%). The second most popular response being for general vacation (n=72, 14.63%), closely followed by a weekend getaway (n=66, 13.41%). Figure 3. The Purpose of Most Recent Trip to Springfield, Illinois Visit historical sites and attractions 200 General vacation Weekend getaway Visit friends and/or family Stopped on the way to Special event Meeting or convention Other * (please specify) Group tour Business Visit wineries 1 *Others (n=18) included 150th Anniversary of Lincoln's Funeral (2), Hospital/doctors (2), multi-purpose travel (4), Shopping (4), Personal Reasons (2), Golfing at the Rail (1), Isaacs & Obed (1), Springfield Marathon (1), and History Fair (1).
12 12 According to survey results, special events accounted for the main attraction/reason for 24 visitors to Springfield, Illinois. Over one third of participants attracted by a special event, chose to visit a Lincoln-related event. Other events drawing multiple visitors to Springfield included historical events (21%) and festivals/fairs (17%). Figure 4. Events Attracting Visitors to Springfield, Illinois (n=24) Lincoln-related event 8 Historical event 5 Festival or fair 4 Childrens event 2 Agricultural or animal event 2 Holiday event 1 Educational event 1 Automobile event 1 Some specific names of events provided are: Illinois Association of State Fairs Convention, Dog Show, Lincoln Tour of Sites, State Fair, 150th Anniversary of Abraham Lincoln's funeral, 150th Anniversary reenactment of Lincoln s funeral, Lincoln Funeral Reenactment, Lincoln Funeral Train, wedding, Girl Scout outing, Science Fair. Several visitors (6.6%) stopped off at Springfield, Illinois on their way to another destination, with the majority of those respondents Chicago bound (6). Other respondents final destinations included Missouri (5), Florida (2) and Wisconsin (2).
13 13 C. Travel Behavior Patterns of Visitors Most Springfield, Illinois visitors responding to the survey were first timers (65.0%), as shown in Table 4. Of those that were repeat visitors to Springfield, more than 20% had visited six times or more, thus showing Springfield, Illinois has the ability to attract return visitors. Additionally, the decision to travel to Springfield is typically a decision made over a month in advance (72.8%). Table 4. Visitation History and Decision-Making Timeframe Respondents Percent Visitation history to Springfield (n=492) First-time visitors % Repeated visitors % Number of previous visitation to Springfield (n=172) * Two times % Three times % Four times % Five times % Six times or more % Visitation decision making timeframe (n=491) less than 1 month % 1 to 2 months % 2 to 4 months % more than 4 months % * This only included repeated visitors (n=172, 35.0%).
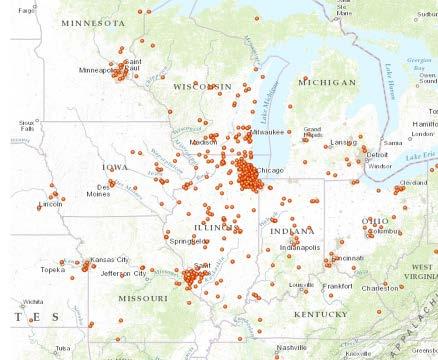
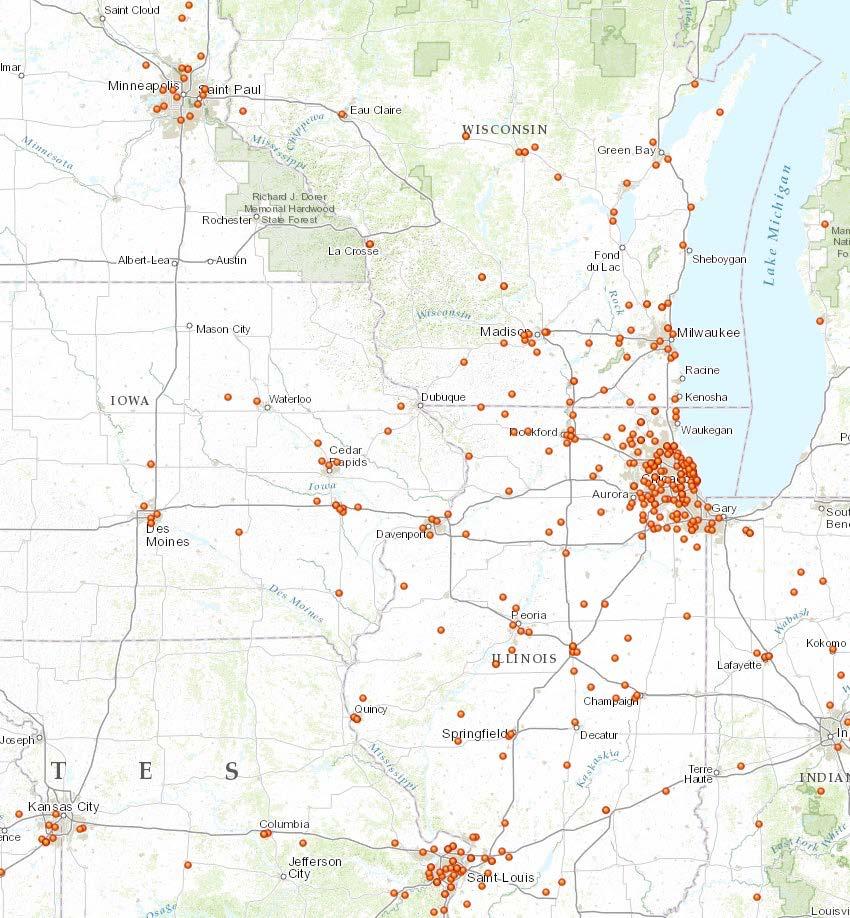
14 14 The vast majority of respondents traveled with someone when visiting Springfield (93.9%). Results show that the majority of visitors came with their spouse or significant other (72.2%), children (28.7%), or relatives (13.6%), as shown in Table 5. A relatively small proportion (9.1%) of visitors came to Springfield, Illinois accompanied by their friends. In addition, the vast majority of respondents (78.37%) drove less than 500 miles each way to visit Springfield, Illinois and based on the residential zip-codes provided by respondents, over two-thirds of visitors (63.21%) came from a city outside of Illinois. For a visual representation of visitors trip origin, please see Appendix C. Table 5. Party Composition, Distance Traveled and Residence Location Respondents Percent Party Composition (n=492)* Spouse or significant others % Children % Relatives % Friends % Traveled alone % Business associates/colleagues % Part of a tour % One-way Driving Distance (n=490) less than 100 miles % 100 to 250 miles % 250 to 500 miles % 500 to 1000 miles % more than 1000 miles % Residence Location (n=492) Within Illinois % Outside Illinois % * Percentages do not sum to 100% because respondents could provide multiple responses.
15 15 According to survey results, the most popular months to visit Springfield, Illinois are in the summer months of June, July and August. Very few visitors chose to travel to Springfield in the winter months; there is, however, a spike in visitation during the month of October (Figure 5). Figure 5. Months of Most Recent Visit to Springfield, Illinois (n=492) JAN FEB MAR APR MAY JUN JUL AUG SEP OCT NOV DEC Figure 6. Transportation to Springfield (n=487) Car 91.4% Train 3.4% Air 2.4% Other 2.4% 0.0% 20.0% 40.0% 60.0% 80.0% 100.0% The majority of visitors (91%) traveled by car to Springfield, Illinois. While a very small percentage traveled by means of air or rail. Other methods of transport included bus (n=5), tour bus (n=1), motorcycle (n=1), motor home (n=2), a combination (n=1, once bike, 2 times by car), and RV (n=1).
16 16 Table 6. Type of Accommodation (n=488) Respondents Hotel/Motel 375 Private Home 28 Camping/RV 24 Bed & Breakfast 7 Rental home 2 Other (please specify)* 52 Percent Results from the survey show 76.85% of respondents preferred choice of stay was that of a hotel/motel (Table 6). *Other included day trips (40), passing through (3), stayed in other area (6), Airbnb (1), and train (1). The vast majority of respondents (87.8%) reported that they spent at least one night in Springfield, Illinois (Figure 7). In addition, there are more people who spent three nights or more in Springfield than those that visited for just the day; suggesting that Springfield, Illinois is perceived as providing numerous attractions and entertainment opportunities. Figure 7. Length of Stay 10 or more * day trip only *10 or more: 15 nights (n=1), 16 nights (n=2), countless (n=1)
17 17 D. Spending On average, survey respondents reported that they spent $ (per person) while staying in Springfield, Illinois (not including transportation costs). A closer look at the types of spending reveals that visitors spent the highest proportion of money on lodging/accommodation (average = $125.92), followed by money spent shopping (average= $79.23). A significant amount of money was also spent on dining while in Springfield, Illinois (average= $65.37). Table 7. Amount of Money Spent in Springfield, Illinois (n=397)* Number of Respondents ** Average ($) Range of Spending Min ($) Max ($) Lodging/Accommodation ,150 Shopping other than food ,000 Meals/Restaurants Attractions Events ,000 Entertainment Transportation in Springfield (including gas) Recreation Other ,000 * It excluded respondents who did not answer at all. ** It does not include respondents who responded $0, or did not answer.
18 18 E. Activity Profiles Overall, Springfield visitors reported being very satisfied with the activities on offer during their stay in Springfield, Illinois. Respondents were asked to rate 19 activity types available in Springfield (Table 8). Satisfaction with each activity type was measured on a six-point scale ranging from 1 (very unhappy) to 6 (very happy); all activities rated above 4 (somewhat happy), with most rated near the top of the top of the scale (between happy and very happy). The vast majority of visitors reported exploring sites and attractions related to Abraham Lincoln (83.54%), visiting historic sites (80.70%) and museums or memorials (78.25%). Visitors were very satisfied with these three activities when compared to other activities. This suggests that Springfield, Illinois continues to be chosen as an historical tourism destination centering largely on Abraham Lincoln. In addition, respondents who had not engaged in a particular activity could also indicate that they would have participated if they had known the activity was available. Visiting a wildlife park or sanctuary, exploring Route 66, visiting an art gallery, winery or microbrewery, or taking in a show were the most popular of the unknown activities. This suggests that there may be a latent interest in these activities that could be better publicized, perhaps by cross-promotions with historical attractions.
19 19 Table 8. Activities Visitors Participated in During Visits Activities Explored sites and attractions related to Abraham Lincoln Participated in activity (%) Satisfaction with activity Would have participated in activity if aware 411 (83.54%) Ate out at a restaurant 406 (82.52%) Visited historic sites 397 (80.69%) Went to a museum or memorial 385 (78.25%) Took a tour 224 (45.53%) Went shopping 152 (30.89%) Visited a bar or pub 142 (28.86%) Explored Route (25.61%) Visited a park or wildlife sanctuary 91 (18.50%) Went antiquing 51 (10.37%) Went to a winery or microbrewery 50 (10.16%) Visited art galleries 33 (6.71%) Attended a show or concert 32 (6.50%) Went biking or hiking 26 (5.28%) Visited the lake for water activities 23 (4.67%) Attended a sport event 14 (2.85%) Played mini-golf 13 (2.64%) Went golfing 11 (2.24%) Went bowling 6 (1.22%) Other* 9 (1.83%) *Others included BBQ & Blues Fest, cave, cemeteries (2), drive inn, egg celebration, festival, State Fair (2), toured the state capital, visit 93 old Aunt in nursing home, Frank Lloyd Wright House (2), Henson Robinson Zoo, Lincoln Memorial Tomb, movie theater/premiere, etc.
20 20 F. Visitor Experience Among 492 respondents who had visited Springfield, Illinois approximately one fifth (n=102, 20.73%) picked Springfield as one of the top three destinations (ranked as the favorite = 33, second best = 37, third = 32) they have visited since January 1, When asked the likelihood that they would visit Springfield again in the next two years, the majority of visitors (59.96%) reported that it was at least somewhat likely that they would return to Springfield in the next two years. Furthermore, more than 90% of participants were willing to advise friends or family to visit Springfield, Illinois (Table 9). Table 9. Visitors Future Intentions to Visit and Recommend Springfield, Illinois Scale Intention to visit within the next 2 years Respondents Percent 1 Very unlikely % 2 Unlikely % 3 Somewhat unlikely % 4 Somewhat likely % 5 Likely % 6 Very likely % 0 Undecided % Scale Recommend Springfield to others Respondents Percent 1 Very unlikely % 2 Unlikely % 3 Somewhat unlikely % 4 Somewhat likely % 5 Likely % 6 Very likely % 0 Undecided %
 mentioned something related to Lincoln, such as the Lincoln Museum, Lincoln sites, Lincoln s house, Lincoln s tomb, etc.")
21 21 Visitors were also asked to indicate the most memorable part of their most recent trip to Springfield, Illinois. According to a frequency analysis for 3506 words, over half (56.09%) mentioned something related to Lincoln, such as the Lincoln Museum, Lincoln sites, Lincoln s house, Lincoln s tomb, etc. The other words that frequently appeared were museum (137 times), historic, and history (57 times). The word cloud below (Figure 8) provides a visual summary of the words used to describe their experiences. The more frequently a word was used, the larger and more prominent it appears in the word cloud. Figure 8. The Most Memorable Part of Recent Trip to Springfield
22 22 SECTION 2: NON-VISITOR COMPARISON with VISITORS A. Demographic Information There were no significant differences in the demographic profiles of visitors and non-visitors responding to the survey. Therefore, it is not possible to suggest that demographics impacted the decision to visit Springfield, Illinois. Below is a breakdown of the demographic information for both visitors to Springfield and non-visitors. Table 10. Socio-Economic Profile of Non-Visitors Compared To Visitors Non-Visitors Visitors Gender Male 26.4% 37.5% Female 73.6% 62.5% Age % 0.2% % 5.9% % 11.9% % 19.7% % 28.7% % 27.3% Over % 6.4% Marital Status Married 74.4% 75.5% Not Married 22.5% 19.6% Do not wish to answer 3.1% 4.9% Ethnicity African American 7.0% 3.4% Caucasian, White 86.7% 89.7% Asian American 0.8% 1.7% Latino/Latina 1.6% 1.9% Native American 0.8% 0.6% Other 3.1% 2.7% Education High school or less 12.4% 7.13% Some college/technical school 21.7% 26.83% College graduate 41.1% 36.69% Post graduate degree 24.8% 29.35% Household Income under $25, % 1.92%
23 $25,000 to 34, % 6.41% $35,000 to 44, % 4.27% $45,000 to 54, % 10.26% $55,000 to 64, % 9.62% $65,000 to 74, % 5.98% $75,000 to 84, % 6.84% $85,000 to 94, % 3.63% $95,000 to 104, % 6.41% $105,000 to 114, % 2.99% $115,000 to 124, % 3.85% over $125, % 9.19% prefer not to say 33.9% 28.63% 23
24 24 B. Travel Intentions of Non-Visitors On a scale ranging from 1 (very unlikely) to 6 (very likely), a mean response of 4.27 indicated that the majority of non-visitors intend to travel to Springfield within the next two years. Furthermore, an overwhelming majority (85%) would be somewhat likely to recommend visiting Springfield, Illinois to others. This suggests a positive image of Springfield, even without direct experience of the destination. Table 11. Non-Visitors Intentions to Visit Springfield, Illinois Scale Intention to visit within the next 2 years Respondents Percent 1 Very unlikely 5 3.8% 2 Unlikely 4 3.1% 3 Somewhat unlikely 3 2.3% 4 Somewhat likely % 5 Likely % 6 Very likely % 0 Undecided % Scale Recommend to others Respondents Percent 1 Very unlikely 4 3.9% 2 Unlikely 3 1.5% 3 Somewhat unlikely 6 1.6% 4 Somewhat likely % 5 Likely % 6 Very likely % 0 Undecided %
25 25 Table 12 illustrates that over 34% of non-visitors plan on visiting Springfield, Illinois. Almost 25% of respondents attributed a lack of time as the principal reason for not visiting to date. The second most common response given was due to various financial reasons (12.95%). In addition, the distance from their residence (2.07%), the lack of travel information about Springfield (1.04%) and high prices of travelling (1.04%) were less frequently mentioned reasons for not traveling to Springfield, Illinois. Table 12. Reasons for not Visiting Springfield Respondents Percent I'm planning to go to Springfield, Illinois in the future % Lacking time for a trip % Could not afford a trip/other financial reasons % Visited another location instead of Springfield, Illinois* % I've been there before and wanted to go somewhere new % Springfield, Illinois is not attractive or interesting % Cost of air travel is too expensive % Springfield, Illinois is too far away % Did not receive information about Springfield, Illinois % A vacation in Springfield, Illinois is too expensive % People are not friendly in Springfield, Illinois 0 0.0% I am a resident of Springfield 0 0.0% Other reason (please specify) % * Another location includes: Chicago; Door County, WI; Indianapolis; Marion, IN; Outer Banks and Hilton Head; St. Louis; Starved Rock; Tombstone, Arizona; Toronto; Vail; England; Scotland; and Wales.
26 26 Other reasons provided: Did not want to board our dog this year due to the dog flu Bad storms and flooding so had to take a different route, not near Springfield Baseball tournament for son. He got injured so we could not go Busy with work, but want to come in near future Death in family. Didn't work out to make the trip Emergency situations, messing up travel plans Family commitments. Had a trip planned, but cancelled due to illness Husband got deployed so we postponed our trip I am waiting so my adult daughter can join me I had planned to go last summer, but ended up with my 93 year old mother along and she has a hard time walking around for very long. She gets too tired. Too old for travelling like I would like, am 83 years old and aging Visit planned for 10/16 for Fire Mark Circle meeting Weather, went for convention, worked for the summer. Will visit summer of 2016 for 4 days with grandchildren
 to 3 (very important). They were also asked to indicate whether or not they felt that Springfield had each of the attributes.")


27 27 C. Non-Visitors Perceptions of Springfield, Illinois Non-visitors were asked to rate the importance of 22 destination attributes when choosing a destination, using a scale ranging from 1 (not important) to 3 (very important). They were also asked to indicate whether or not they felt that Springfield had each of the attributes. As Figure 9 shows, over 80% of non-visitors believe Springfield to be affordable, beautiful, comfortable, convenient, easily accessible, family friendly, friendly, fun, healthy, historic, interesting, relaxing, safe, and unique. However, fewer non-visitors associate Springfield with attributes such as adventurous, artsy, exciting, modern, and outdoorsy. Therefore, the data suggests that respondents did not perceive Springfield, Illinois to be a destination with good amentities for the active/dynamic visitor. Figure 9 maps the importance of each attribute to the perception that Springfield repesents each attribute. If an attribute is important to visitors, then it is problematic for Springfield to be perceived to be lacking that attribute. A gap between the importance of an attribute and the perception that Springfield represents that attribute is cause for concern. Figure 9 shows only four of these gaps: adventurous, exciting, outdoorsy, and scenic. Each of these is perceived to be important; yet a significant portion of non-visitors perceive Springfield to lack these attributes. Figure 9. The Image of Springfield for Non-Visitors Springfield is... Yes No how important 100% 90% 80% 70% 60% 50% 40% 30% 20% 10% 0% active adventurous affordable artsy beautiful comfortable convenient easy to get to exciting family friendly friendly fun healthy historic interesting modern outdoorsy quaint relaxing safe scenic unique

28 Both visitors and non-visitors were asked to provide three words to describe Springfield, Illinois. Figure 10 represents non-visitors images of Springfield. Figure 11 represents visitors images of Springfield. It is interesting to note that visitors images of the destination suggest a broader and more nuanced understanding of the destination. Nonvisitors images are more focused on the history, Lincoln-related elements of the destination. Figure 10. Non-Visitors Image of Springfield

29 Figure 11. Visitors Image of Springfield 29
30 30 SECTION 3: EVALUATION OF INFORMATION A. Information The majority of visitors (n=428, 87.0%) received the information they requested, while a small percentage (2.8%) stated that they did not receive it. Other responses included: I don t remember (n=48, 9.8%). The vast majority of non-visitors (78.5%) also received the information they requested. Other responses included: No, did not receive (5.4%), I do not remember (16.2%). Figure 12. People Who Received the Information They Requested 100.0% 90.0% 80.0% 70.0% 60.0% 50.0% 40.0% 30.0% 20.0% 10.0% 0.0% 87% 78.50% 16.20% 10% 3% 5.40% Yes No don't remember visitors non-visitors
31 31 On a scale from 1 (not helpful) to 3 (helpful), the information visitors and non-visitors received was deemed moderately helpful (average response ranging from ). Among the specific aspects of the information, visitors reported that the most helpful information was that concerning what to see and do, with an average value of 2.95, while information regarding where to stay was perceived as least helpful, with an average value of 2.56 (Table 13). Similarly, non-visitors also felt that information on what to see and do was most useful. Non-visitors reported that materials received were more useful than visitors, especially in regards to special events or performances and accomodation. Since visitors would have a more accurate understanding of the usefulness of the information provided, this is not particulary surprising. However, it is important to note that visitors were quite positive in their evaluation of the usefulness of the materials. Table 13. Usefulness of the Travel Information Visitors (n=400) Non-visitors (n=93) What to see and do Getting around in Springfield Where to eat Special events or performances Where to stay On a scale from 1 (extremely negatively) to 5 (extremely positively), visitors reported that they believed the information they received positively affected their decision to travel to Springfield, Illinois with an average of 4.15 out of 5.
32 32 Among respondents who received the information, the majority (n=323) responded that the information they received had no effect on whether they stayed longer in Springfield, Illinois. Conversely, 101 respondents stated that that the information motivated them to extend their stay. Among those that responded yes, approximately 20% reported that the information they had received prompted them to extend their stay by one or two nights. Figure 13. Number of Nights the Information Extended Stay (n=492) No or or 4 5 or Not specific*
33 33 In addition to the information they requested, visitors obtained further information from a number of other sources to help plan their most recent trip to Springfield. The majority of respondents (73%) utilized the Springfield, Illinois Visitors Guide. Over half of all respondents also accessed the Springfield, Illinois website as a source of information for their upcoming trip. Results also show that just 17% looked to the Illinois Travel Guide to retrieve information, with even fewer (10%) using the Illinois Tourist Information Center. Figure 14. Sources of Information to Plan Travel to Springfield Springfield, Illinois Visitors Guide Springfield, Illinois Website Other* Springfield, Illinois Calendar of Events Illinois Travel Guide Illinois Tourist Information Centers * Other sources included AAA (19), website related Lincoln heritage (6), other website (11), from friend (6) or family (6), Trip Advisor (3), Google (3), Convention Planner (2), don t remember (2), knew area by growing up or working there (2) newspaper (1), library (1).
34 34 The majority of visitors (71%) used travel-related websites when organizing their trip to Springfield, Illinois. Furthermore, almost two thirds of non-visitors reported that they typically visited travel-related websites to help plan upcoming trips. Figure 15. Use of Travel-Related Websites yes no visitors non-visitors Respondents who said they use travel websites to retrieve information were asked to list the top three travel-related websites they typically use for planning their travels (Table 14). Table 14 shows all the travel-related websites that were reported by at least ten respondents. The most frequented travel-related websites in this survey were Trip Advisor, followed by Expedia and Travelocity. Table 14. Travel Related Websites Commonly Used (n=434) Website Respondents % Trip Advisor Expedia Travelocity Google AAA Hotels.com Kayak Priceline Orbitz Yelp Hotwire Booking.com
35 35 Results show that visitors are more likely to use travel apps than non-visitors, although app use is not common for either group. Figure 16. Use of Travel Apps % 80.00% 60.00% 40.00% 20.00% 0.00% 21.60% 14.10% Yes visitors 78.40% 85.90% No non-visitors Respondents who use travel apps were asked to list the top three travel apps they typically use for travel planning purposes (Table 15). Table 15. Specific Travel Apps Used (n=123) Website Respondents % Trip Advisor Google Expedia Yelp AAA Travelocity Hotels.com Kayak Hotwire
36 36 B. Advertising and Promotion The majority of respondents (70%) did not recall seeing any advertising or promotion for Springfield, Illinois prior to requesting information (Figure 17). Figure 17. Assessment of Advertising or Promotion Yes visitors No non-visitors
37 37 Respondents that had heard or seen advertising or promotions for Springfield, Illinois were asked to indicate the sources of that advertising or promotion (Figure 18). The most frequently accessed type of channel for advertising or promotion reported by both visitors and non-visitors was magazines, newspaper, and other print ads (58.92% of total respondents recalling an ad or promotion), followed by TV (42.16%) and travel websites (32.43%). Figure 18. Source of Advertising or Promotion magazines, newspaper, other print ads tv travel website 9 51 friends, co-workers, relatives or e-newsletter 9 32 website banner or other website ad 7 23 facebook 2 19 radio instagram twitter other social media site
38 38 SECTION 4: DESTINATION CHOICE Almost two-third of visitors (63%) were only considering Springfield, Illinois as a destination when they requested information. On the other hand, more than half of non-visitors (54.7%) were considering other destinations to travel to besides Springfield when they requested information. Table 16. Consideration of Other Destinations Consideration of other destinations when requesting information Visitor Non-visitor Total Yes 179 (36.6%) 70 (54.6%) 249 (40.4%) No 310 (63.4%) 58 (45.3%) 368 (59.6%) Total
39 39 Respondents who indicated that they were considering other destinations to travel to when requesting information were also asked to specify what three other destinations they considered instead of Springfield. Table 17 shows destinations that were listed by 10 or more respondents. Table 17. Other Destinations Considered City State Visitor Non-visitor Total % St. Louis MO Chicago IL Hannibal MO Galena IL Indianapolis IN Peoria IL Nashville TN Florida* FL Orlando FL St. Petersburg FL Ormond beach FL Wisconsin* WI Iowa* IO Branson MO Door county WI * No city specified
40 40 Most visitors (91.2%) and the vast majority of non-visitors (80.5%) reported visiting destinations other than Springfield, Illinois since January 1, Table 18. Visitation to Other Destinations Visitation to destinations other than Springfield, Illinois since January 1, 2010 Visitor Non-visitor Total Yes 444 (91.2%) 103 (80.5%) 547 (88.9%) No 43 (8.8%) 25 (19.5%) 68 (11.1%) Total
41 41 Respondents who said that they had visited other destinations since January, 2010 were asked to specify the three best destinations that they recalled visiting. Table 19 shows all destinations that were listed by 10 or more respondents. Interestingly, the most frequently mentioned destination was Springfield, Illinois (20.66%), followed by Chicago (7.86%), and St. Louis, Missouri (6.40%). Table 19. Three Best Destinations Visited Since 2010 City State/Country Visitors Non-visitors Total % Springfield IL Chicago IL St. Louis MO Hawaii HI Branson MO Alaska AK Galena IL Florida FL Disney World FL Daytona Beach FL Clearwater Beach FL Orlando FL Fort Myers FL Las Vegas NV Kansas City MO Gettysburg PA Charleston SC Yellowstone WY Colorado CO Washington DC Italy EU Door County WI Arizona AZ Grand Canyon AZ Denver CO Boston MA
42 42 SECTION 5: CONVERSION RATE In this study, the majority (80.75%) of those who recalled receiving the information they requested from Springfield, Illinois actually visited Springfield for a gross conversation rate of 80.75% (Table 20). It is important to note that this rate is a function of the subset of individuals who responded to the survey. It is most likely higher than the conversation rate of all individuals who have inquired about Springfield since January 1, Table 20. Conversion Rate Did you receive the information you requested from Springfield, Illinois? Visitor Non-visitor Total Yes 428 (80.75%) 102 (19.25%) 530 (100%) No 14 (16.66%) 7 (33.33%) 21 (100%) Don t remember 48 (69.56%) 21 (30.43%) 69 (100%) The average spending per visitor who received information about Springfield totaled $ (Table 21). Furthermore, the average dollar amount spent per travel party, by those that received information, totaled $ (Table 21). Table 21. Average Spending Per person Per travel party Received information $ $ Did not receive information* $ $ *This includes those who did not receive information from Springfield, and those who did not remember receiving it.
")
43 APPENDIX A: Origin of Travelers (by ZIP code) 43
44 44
45 45
46 46 APPENDIX B: Reasons For Multiple Visitation (#Times, Comments) 6 State Fair, concerts or shows, mostly shopping 6 Sharing history with my children 6 I got a job here. 6 We enjoyed returning, we found lots to do 6 Shopping and events 6 Luv Lincoln, Dana Thomas house, so many sites are FREE (or sm. donation) 6 I believe we should see our state FIRST before traveling to another. 6 Various reasons...seeing specialty doctors, shopping, state fair. 6 I enjoy the various historical sites and the changing exhibits at the museums 6 Lincoln places 6 Love the historic sights and come frequently when our Janesville Jets play your Springfield Junior Blues during hockey season. Have taken our great nieces and nephews to see the Presidential Museum and to say they were impressed, is mild. They devoured every display and asked why they didn't know any of this stuff from school... seems our school system educators need to spend some time there. Many places to eat gives us a wide selection for dining and our accommodations at the Choice Hotels are always a pleasure. Toured the cemetery as well as Lincolns burial site, very inspiring. Plan on making many more trips to Springfield in the future... a great long weekend getaway and have many more nieces and nephews that need educating about our history. 6 Daughter lives there. And some friends. Downtown festivals. Lincoln attractions. 6 Yearly vacations takes us to the area and then on to other areas. 6 Job prospects 6 Vicki Clemons 6 Prairie Weavers Guild, Lincoln Elementary School where I volunteer, IL state fair 6 Conventions Lincoln's Birthday 6 Relatives 6 I had three work trips and three vacation trips 6 Shopping, conventions, museums, Dining, medical 6 City tour. Loved the history behind it regarding Lincoln, etc 6 Lincoln Attractions, Henson-Robinson Zoo, Old State Capital, The State Fair, and to simply get away from Chicago to a fun locale, Springfield offers a lot. 6 Site seeing and eating. 6 Shopping, Visit the Abraham Lincoln Presidential Museum, Dinning, Meeting 6 We homeschool, plus family, and just educational 6 Just another town to go too. Had items that needed picked up 6 convention, visiting a local business, shopping, buy a car
47 6 State fair 6 family-state fair 6 Services, restaurants, shopping & movie Theater. 5 It's a beautiful place to be. 5 Family and friends 5 to visit the historical places and learn about the history 5 I work in the travel industry and have been assigned to escort motor coach groups on a tour called "Land of Lincoln." But I enjoyed the area so much that I also vacationed there with my husband in the spring of Everyone we encountered were knowledgeable and helpful with our students and staff. 5 Visiting Family 5 It is always a great vacation spot for our family. Love the history of the City as well as the shopping in the area. 5 Family lives there 5 Business and pleasure 5 Annual event, state fair, historical interest 5 I have friends and property there 4 Family stays there 4 Well my uncle lives there but also we love to eat at Darcy's Pint!!! 4 visiting Chicago & St Louis, pay my respects to Pres Lincoln 4 just love the area, history, walking the Lincoln area, food great, stores, state house inn 4 Family that lives there 4 Family 4 2 5th grade School field trips, history fair, science fair 4 We loved the historical sites. Our son is a big history buff. 4 I am a "Lincoln Freak". I have visited with 2 group tours, with a girl friend, with my family...and that is within the last years. I plan on returning again this year. I still have a lot more places to see. 4 Work and long weekend. 3 The Lincoln sites, military history (IL State Military Museum, Oak Ridge and Camp Butler cemeteries, Korean War Museum), the State Fair. 3 Abe Lincoln historical sites and museum. Love them! 3 Business 3 Abe Lincoln museum 3 Loved Springfield went to see Lincoln house and Lincoln tomb all three times we visited. It was like being back in time and chilled us to the bone. Also took in the Lincoln Presidential museum, Dana Thomas house, Capitol, Governor's mansion and took a tip to New Salem. 3 to tour things we had not done on first trip and then to re-visit some sites 3 Visit family 47
48 3 Several different events 3 Interest in our state history 3 The Abraham Lincoln Presidential Museum 3 For pleasure I love history. One of our favorite places to visit is the Lincoln Museum. Also, the State Museum. It is too bad that the Governor is playing politics with the State Museum. We had planned on visiting Springfield a few months back to visit the museums but because of the governor's action decided not to Besides visiting historical sites I also enjoy taking photos 3 The city itself, Lincoln and other museums, activities at New Salem Park. Hotel and restaurants options. 3 Different shopping and eateries than what we have locally. 3 Business and pleasure 3 Mother road Route 66 tour. Awesome! 3 friends 3 Brought s group of MG families to visit with our annual Wine, Cheese, and Beer tour. The name of the club is the Chicagoland MG club. 3 like it 3 Traveling to MO and wanted to stop by for dinner or lunch. 3 like it there 3 Event 3 Research 3 Events and programs about Abraham Lincoln 3 Business 3 Good golfing. Great place to stay. A few nice restaurants. 3 twice by car just daily trips, going to other locations also, once by motorcycle with group, needed more time to see the wright house, tour hours and amounts of people on tours did not fit our schedule. 3 New attractions/exhibits 3 Lincoln history 3 Work conference, see family, and event planning 3 Camped near there last summer and went to Springfield to several tourist attractions during the week. 3 I used to live there before moving to Oklahoma City and still have many friends who live in Springfield. 3 Came to Conference & when to see sights. 3 We were staying at Lincolns New Salem and come to Springfield to eat at Smokey Bones and for the week of "when history comes alive" 3 State Fair 3 We are very interested in the history of Abraham Lincoln and were so fascinated by the information in Springfield. We wanted to learn more. We also loved History alive and followed the whole program. We then were involved in the Lincoln funeral Reenactment. 48
49 3 I have family 3 History, Lincoln, Car Club travel, Rt 66 3 Brought friends 3 Traveling through and Lincoln Museum 2 Springfield is where I was born. I still have relatives there. 2 Historical sites. 2 Lincoln stuff and his funeral reenactment 2 Conference 2 The Lincoln Museum. 2 The first trip was to arrange a trip for 22 people and check out the places and highways. 2 Went with family members 2 Lincoln library 2 My husband and I enjoyed if the first time we visited, so we felt it would be a good place to take the grown children and grandchildren when they were here from out of state. 2 The Lincoln Museum 2 First trip was just a stop for lunch and visiting a church. Second trip was for vacation and to tour the Lincoln sites. 2 The awesome history, & the Lincoln memorial garden... it was definitely one of the best highlights of my trip 2 Attend a convention. 2 The desire to show my grandchildren all of the Lincoln sites 2 Did not have enough time to see everything the first time. 2 Going to Branson 2 Lulu's Diner. Good food. Great people. 2 Lincoln museum 2 We wanted to see more of the Lincoln historical sites. 2 I have family that lives there. 2 A conference 2 Meetings 2 Fun weekend trip 2 Our Church Senior Group tours and we plan different venues each time. 2 I am an alumni of Sangamon State University, have friends who reside in the city, attend celebrations. 2 wanted to take the whole family 2 Once by myself, once with family 2 The Lincoln Funeral recreation 2 Came through on my way to Florida 2 One trip was for a convention. The second trip was part of vacation travel. 2 For a longer stay 2 visit family 49
50 2 We had so much fun the first time, we brought friends and stayed for three days. 2 More things I wanted to see and do 2 Taking grandkids. 2 Like the area and went with family from out of state 2 Grew up there 2 Capital and Lincoln history 2 Enjoyed the state fair and wanted to return 2 Springfield is one of our favorite places to visit. Everything is conveniently located to each other and it's easy to get around. My daughter and I are history buffs and really enjoy the historic sites. 2 Presidential Museum 2 Wanted to see more Lincoln sites that I hadn't seen the first trip. 2 First trip on retreat at the monastery.. Second trip to visit Lincoln sites with my husband. 2 Lincoln Museum and other historical sights 2 Different events. 2 I love the history, the fair, the downtown. 2 NGS National Convention 2 Revisiting the sites/area with my wife onetime and my son the first time. 2 State Fair 2 Family 2 Business trip. 2 to be able to spend more time at the Lincoln Museum 2 Fritz Klein as Lincoln!! 2 We have relatives there. 2 events, driving distance 2 to see the new Lincoln museum 2 Attended Lincoln Funeral Reenactment. 2 I wanted to bring my son who is also a history buff. 2 To further explore Abraham Lincoln 2 We loved the history and how you put the money into making that history come to life! 50
51 51 APPENDIX C: Most Memorable Part of Visit To Springfield, Illinois - Abe Lincoln - Abe Lincoln Museum - Abe Lincoln sites - Abe Lincoln sites and route 66 - Abraham Lincoln - Abraham Lincoln Attractions - Abraham Lincoln exhibits - Abraham Lincoln history - Abraham Lincoln house and the horse competition - Abraham Lincoln Museum and Library - Abraham Lincoln sites - Abraham Lincoln house - All sites/museums related to President Lincoln. - All the history that was unknown to me and my kids - All things Lincoln! It was the main reason for our trip, and we enjoyed ourselves tremendously!!! - Although it rained hard, we still were still able to visit quite a few attractions. Unfortunately wound up bringing home bed bugs from the hotel we stayed in. - Anniversary celebration of the Abraham Lincoln Museum and Library - Anything related to Lincoln. - Ate at a lovely place. - Aunt in Nursing home - Beautiful city. - Being given free parking because we stopped at the visitor center. And seeing the home where Lincoln lived. - Being with family - Being with friends at the Lincoln Museum and eating out - Being with my cousin I hadn't seen over 20 years - Big trucks and Lots of Racing Tires - Biking - Charging our room at a motel and having them run the bill through two times, basically cheating us. - Eating at Cozy Dog - Eating at Darcy s - Eating at Issac & Obed's and the Tomb of Lincoln. - Enjoyed all of the historical venues. - Enjoying all the Lincoln events for the special weekend - Every location historical and connected to Lincoln.
2013 IRVING HOTEL GUEST SURVEY Final Project Report
 2013 IRVING HOTEL GUEST SURVEY Final Project Report Research prepared for the Irving Convention & Visitors Bureau by Destination Analysts, Inc. Table of Contents SECTION 1 Introduction 2 SECTION 2 Executive
2015 IRVING HOTEL GUEST SURVEY Final Project Report
 2015 IRVING HOTEL GUEST SURVEY Final Project Report Research prepared for the Irving Convention & Visitors Bureau by Destination Analysts, Inc. Table of Contents S E C T I O N 1 Introduction 2 S E C T
Irish Fair of Minnesota: 2017 Attendee Profile
 TOURISM CENTER Irish Fair of Minnesota: 2017 Attendee Profile Authored by Xinyi Qian, Ph.D. Irish Fair of Minnesota: 2017 Attendee Profile November 13, 2017 Authored by Xinyi (Lisa) Qian, Ph.D., University
2006 RENO-SPARKS VISITOR PROFILE STUDY
 2006 RENO-SPARKS VISITOR PROFILE STUDY PREPARED FOR RENO-SPARKS CONVENTION & VISITOR AUTHORITY Study Conducted and Reported by 475 Hill Street, Suite 2 Reno, Nevada 89501 (775) 323-7677 www.infosearchintl.com
Cedar Rapids Area Convention and Visitors Bureau Visitor Study
 Cedar Rapids Area Convention and Visitors Bureau Visitor Study 2003-2004 University of Northern Iowa Sustainable Tourism & The Environment Program www.uni.edu/step Project Directors: Sam Lankford, Ph.D.
April 2011 Visitor Profile
 RESEARCH DATA SERVICES, INC. 777 SOUTH HARBOUR ISLAND BOULEVARD SUITE 260 TAMPA, FLORIDA 33602 TEL (813) 254-2975 FAX (813) 223-2986 Visit St. Petersburg/Clearwater April 2011 Visitor Profile Prepared
March 2011 Visitor Profile
 RESEARCH DATA SERVICES, INC. 777 SOUTH HARBOUR ISLAND BOULEVARD SUITE 260 TAMPA, FLORIDA 33602 TEL (813) 254-2975 FAX (813) 254-2986 Naples, Marco Island, Everglades Convention and Visitors Bureau March
Visit South Walton. Visitor Tracking & ADR Study Fall 2017
 Visit South Walton Visitor Tracking & ADR Study Fall 2017 Phillip Downs, Ph.D. Joseph St. Germain, Ph.D. Rachael Anglin Hope Wiggins Downs & St. Germain Research Study Objectives Profile travel parties
March 2011 Visitor Profile
 RESEARCH DATA SERVICES, INC. 777 SOUTH HARBOUR ISLAND BOULEVARD SUITE 260 TAMPA, FLORIDA 33602 TEL (813) 254-2975 FAX (813) 223-2986 Visit St. Petersburg/Clearwater March 2011 Visitor Profile Prepared
2011 Visitor Profile Survey
 2011 Visitor Profile Survey Prepared for RSCVA February 23, 2012 Executive Summary for RSCVA Board of Directors 436 14th Street, Suite 820 Oakland, CA 94612 (510) 844-0680 Research goals 2 Survey a representative
2014 North Carolina Image & Advertising Accountability Research
 2014 North Carolina Image & Advertising Accountability Research January 2015 Table of Contents Introduction........ 3 Purpose.. 4 Methodology.. 5 Destination Past Visitation and Interest.......... 7 Travel
2014 West Virginia Image & Advertising Accountability Research
 2014 West Virginia Image & Advertising Accountability Research November 2014 Table of Contents Introduction....... 3 Purpose... 4 Methodology.. 5 Executive Summary...... 7 Conclusions and Recommendations.....
March 2012 Visitor Profile
 RESEARCH DATA SERVICES, INC. 777 SOUTH HARBOUR ISLAND BOULEVARD SUITE 260 TAMPA, FLORIDA 33602 TEL (813) 254-2975 FAX (813) 223-2986 Naples, Marco Island, Everglades Convention and Visitors Bureau March
AARP Travel Research: Solo Travel
 AARP Travel Research: Solo Travel August 2014 Contact Allison Kulwicki, akulwicki@aarp.org, for more information https://doi.org/10.26419/res.00093.001 Table of Contents Solo Travel Objectives/Executive
Myrtle Beach AAU Wave , April
 Myrtle Beach AAU Wave 2 2014, April Prepared for: April 15-19, 2014 Objectives: To provide the Myrtle Beach Area Chamber of Commerce with core tracking measures to monitor attitudes and travel preferences
Myrtle Beach AAU Wave , February
 Myrtle Beach AAU Wave 1 2014, February Prepared for: February 19-21, 2014 Objectives: To provide the Myrtle Beach Area Chamber of Commerce with core tracking measures to monitor attitudes and travel preferences
2009 North Carolina Visitor Profile
 2009 Visitor Profile A publication of the Division of Tourism, Film & Sports Development August 2010 Division of Tourism, Film and Sports Development 2009 Visitor Profile 2009 Visitor Profile The Division
Visit South Walton Visitor Tracking Study: Summer Phillip Downs, Ph.D. Joseph St. Germain, Ph.D. Rachael Anglin Downs & St.
 Visit South Walton Visitor Tracking Study: Summer 2016 Phillip Downs, Ph.D. Joseph St. Germain, Ph.D. Rachael Anglin Downs & St. Germain Research Study Objectives Profile travel parties to South Walton
Florida State Park Visitors Park Visiting Party Size
 Party size is roughly the same across all regions. State Park Visitors Park Visiting Party Size Total Central Northeast Northwest Southeast Southwest (n=3972) (n=798) (n=792) (n=782) (n=796) (n=804) Avg.
Indiana Office of Tourism Development. Product Development Research
 Indiana Office of Tourism Development Product Development Research October 2006 TABLE OF CONTENTS TABLE OF CONTENTS...1 BACKGROUND & OBJECTIVES... 2 METHODOLOGY... 3 TRIP MOTIVATORS & TYPES... 4 TRAVEL
Visitor Market Research. The Journey Through Hallowed Ground Partnership 1
 Visitor Market Research The Journey Through Hallowed Ground Partnership 1 Background 12/06: Destination Marketing Organization Committee RFP issued March 2007 Destination Analysts selected June 2008 Project
An Evaluation of Oregon s Fall 2012/Spring 2013 Advertising Campaigns. Final Report May 2014
 An Evaluation of Oregon s Fall 2012/Spring 2013 Advertising Campaigns Final Report May 2014 Table of Contents Background.. 3 Research Objectives.. 4 Research Method... 5 Executive Summary... 7 Travel Motivators
2013 Visitor Profile Study of Lake Lure & the Blue Ridge Foothills in North Carolina
 2013 Visitor Profile Study of Lake Lure & the Blue Ridge Foothills in North Carolina This presentation reflects the aggregated data collected from April to November for the Visitor Study Profile in Rutherford
Duluth, MN 2015 Visitor Report
 Duluth, MN 015 Visitor Report Table of Contents Introduction...... Methodology.. Key Findings. 5 Size & Structure of the U.S. Travel Market.. 9 Size & Structure of Duluth s Travel Market 1 Overnight Trip
Salt Lake Downtown Alliance. June 2018
 Salt Lake Downtown Alliance June 2018 2 SURVEY DETAILS Short telephone survey updating previous benchmark data around key topics 609 respondents ±4% margin of error Trending is provided for all questions
Myrtle Beach 2010 Conversion Study April Prepared by
 Myrtle Beach 2010 Conversion Study April 2011 Prepared by Myrtle Beach Area 2010 Conversion Study Objectives: Determine the conversion rate for those exposed to Myrtle Beach marketing efforts How effective
June 2009 Visitor Profile
 RESEARCH DATA SERVICES, INC. 3825 HENDERSON BOULEVARD SUITE 300 TAMPA, FLORIDA 33629 TEL (813) 254-2975 FAX (813) 254-2986 Naples, Marco Island, Everglades Convention and Visitors Bureau June 2009 Visitor
2007 RENO-TAHOE VISITOR PROFILE STUDY
 2007 RENO-TAHOE VISITOR PROFILE STUDY PREPARED FOR RENO-SPARKS CONVENTION & VISITORS AUTHORITY Study Conducted and Reported by 475 Hill Street, Suite 2 Reno, Nevada 89501 (775) 323-7677 www.infosearchintl.com
Myrtle Beach 2017 Economic Impact Study May Prepared by
 Myrtle Beach 2017 Economic Impact Study May 2018 Prepared by Myrtle Beach Area 2017 Economic Impact Study Objectives: Determine the conversion rate for those exposed to Myrtle Beach marketing efforts How
Tampa Bay 2014 Visitor Report
 Tampa Bay 2014 Visitor Report Table of Contents Introduction...... Research Objectives 4 Methodology. 5 Size & Structure of the U.S. Travel Market.. 6 Size & Structure of Tampa Bay s Domestic Travel Market..
Maine Office of Tourism Visitor Tracking Research 2015 Calendar Year Annual Report Regional Insights: Greater Portland & Casco Bay
 Maine Office of Tourism Visitor Tracking Research 2015 Calendar Year Annual Report Regional Insights: Prepared by April 2016 1 1 Table of Contents Research Objectives and Methodology 3 Overnight Visitors:
Myrtle Beach 2015 Economic Impact Study May Prepared by
 Myrtle Beach 2015 Economic Impact Study May 2016 Prepared by Myrtle Beach Area 2015 Economic Impact Study Objectives: Determine the conversion rate for those exposed to Myrtle Beach marketing efforts How
WAVE II JUNE travelhorizons TM WAVE II 2014 PREPARED AND PUBLISHED BY: MMGY Global
 WAVE II June 14 travelhorizons TM WAVE II 14 PREPARED AND PUBLISHED BY: WAVE II JUNE 14 MMGY Global 423 South Keller Road, Suite 1 Orlando, FL 3281, 7-875-1111 MMGYGlobal.com 14 MMGY Global. All rights
2011 North Carolina Visitor Profile
 2011 North Carolina Visitor Profile A publication of the North Carolina Division of Tourism, Film & Sports Development May 2012 North Carolina Division of Tourism, Film and Sports Development 2011 North
Charlotte County Fourth Quarter 2016 Tourism. Presented to: Charlotte Harbor Visitor and Convention Bureau
 Charlotte County Fourth Quarter 2016 Tourism Presented to: Charlotte Harbor Visitor and Convention Bureau Research Data Services, Inc. March 2017 A. Key Visitor Metrics (Overnight Visitors Staying in Charlotte
October 2011 Visitor Profile
 RESEARCH DATA SERVICES, INC. 777 SOUTH HARBOUR ISLAND BOULEVARD SUITE 260 TAMPA, FLORIDA 33602 TEL (813) 254-2975 FAX (813) 223-2986 Naples, Marco Island, Everglades Convention and Visitors Bureau October
First Quarter 2014 Visitor Profile (January March) Amelia Island Tourist Development Council
 Amelia Island Tourist Development Council") RESEARCH DATA SERVICES, INC. 777 SOUTH HARBOUR ISLAND BOULEVARD SUITE 260 TAMPA, FLORIDA 33602 TEL (813) 254-2975 FAX (813) 223-2986 First Quarter 2014 Visitor Profile (January March) Amelia Island Tourist
RESEARCH DATA SERVICES, INC. 777 SOUTH HARBOUR ISLAND BOULEVARD SUITE 260 TAMPA, FLORIDA 33602 TEL (813) 254-2975 FAX (813) 223-2986 First Quarter 2014 Visitor Profile (January March) Amelia Island Tourist
Recreationists on the Gifford Pinchot National Forest: A Survey of User Characteristics, Behaviors, and Attitudes
 Recreationists on the Gifford Pinchot National Forest: A Survey of User Characteristics, Behaviors, and Attitudes by Alan R. Graefe The Pennsylvania State University Robert C. Burns University of Florida
Maine Office of Tourism Visitor Tracking Research 2015 Calendar Year Annual Report Canadian Visitors
 Maine Office of Tourism Visitor Tracking Research 2015 Calendar Year Annual Report Prepared by May 2016 1 1 Table of Contents Research Objectives and Methodology 4 Canadian Overnight Visitors: Traveler
A TYPOLOGY OF CULTURAL HERITAGE ATTRACTION VISITORS
 University of Massachusetts Amherst ScholarWorks@UMass Amherst Tourism Travel and Research Association: Advancing Tourism Research Globally 2007 ttra International Conference A TYPOLOGY OF CULTURAL HERITAGE
Tampa/Hillsborough County Visitor Report
 Tampa/Hillsborough County 015 Visitor Report Table of Contents Introduction.. Research Objectives.... Methodology... 5 Key Findings 6 Size & Structure of the U.S. Travel Market.... 10 Size & Structure
DAYTONA BEACH VISITOR PROFILE
 DAYTONA BEACH VISITOR PROFILE February Prepared for The Halifax Area Advertising Authority By: Table of Contents OUT OF STATE VISITORS... 1 February, Daytona Beach Visitor Profile... 1 Satisfaction with
September 2016 Visitor Profile
 RESEARCH DATA SERVICES, INC. 777 SOUTH HARBOUR ISLAND BOULEVARD SUITE 26 TAMPA, FLORIDA 3362 TEL (813) 254-2975 FAX (813) 223-2986 Visit St. Petersburg/Clearwater September 216 Visitor Profile Prepared
RESEARCH AND PLANNING FORT STEELE HERITAGE TOWN VISITOR STUDY 2007 RESULTS. May 2008
 RESEARCH AND PLANNING FORT STEELE HERITAGE TOWN VISITOR STUDY 2007 RESULTS May 2008 Research and Planning Tourism British Columbia 300-1803 Douglas St. Box 9830 Stn. Prov. Gov t. Victoria, BC V8W 9W5 Web:
West Virginia 2009 Visitor Report December, 2010
 West Virginia 009 Visitor Report December, 010 Table of Contents Introduction...... Methodology.. 4 Travel Market Size & Structure... 6 Overnight Expenditures.. 1 Overnight Trip Characteristics... 16 Demographic
Minnesota 2014 Visitor Report June 2015
 Minnesota 04 Visitor Report June 0 Table of Contents Introduction Methodology 4 U.S. Travel Market Trends Size and Structure of Minnesota s Travel Market 9 Overnight Trip Detail 6 Overnight Trip Characteristics
April 2012 Visitor Profile
 RESEARCH DATA SERVICES, INC. 777 SOUTH HARBOUR ISLAND BOULEVARD SUITE 260 TAMPA, FLORIDA 33602 TEL (813) 254-2975 FAX (813) 223-2986 Naples, Marco Island, Everglades Convention and Visitors Bureau April
Papua New Guinea International Visitor Survey. January December 2017 Simon Milne
 Papua New Guinea International Visitor Survey January December 2017 Simon Milne Papua New Guinea Tourism Project Project Objectives Introduction 2 Objective 1: Grow tourism arrivals to PNG by working with
Fourth Quarter 2013 Visitor Profile (October December) Amelia Island Tourist Development Council
 Amelia Island Tourist Development Council") RESEARCH DATA SERVICES, INC. 777 SOUTH HARBOUR ISLAND BOULEVARD SUITE 260 TAMPA, FLORIDA 33602 TEL (813) 254-2975 FAX (813) 223-2986 Fourth Quarter 2013 Visitor Profile (October December) Amelia Island
RESEARCH DATA SERVICES, INC. 777 SOUTH HARBOUR ISLAND BOULEVARD SUITE 260 TAMPA, FLORIDA 33602 TEL (813) 254-2975 FAX (813) 223-2986 Fourth Quarter 2013 Visitor Profile (October December) Amelia Island
Naples, Marco Island, Everglades Convention and Visitors Bureau January 2013 Visitor Profile
 RESEARCH DATA SERVICES, INC. 777 SOUTH HARBOUR ISLAND BOULEVARD SUITE 260 TAMPA, FLORIDA 33602 TEL (813) 254-2975 FAX (813) 223-2986 Naples, Marco Island, Everglades Convention and Visitors Bureau January
Comparative report on Oversea Travel Behavior Study in Thailand, Indonesia and Vietnam in October 2015
 Comparative report on Oversea Travel Behavior Study in Thailand, Indonesia and Vietnam in 2015 October 2015 Table of content A. Research Design (P.3) B. Respondent profile (P.4) C. Summary (P.5) D. Detail
AVSP 7 Summer Section 9: Summary Profiles - Fly/Drive, Highway, Ferry, and Campground Users
 AVSP 7 Summer 2016 Section 9: Summary Profiles - Fly/Drive, Highway, Ferry, and Summary Profile: Highway, Ferry, and This chapter profiles the highway, ferry, and campground user markets. Definitions and
West Virginia 2011 Overnight Visitor Final Report
 West Virginia 011 Overnight Visitor Final Report June, 01 Table of Contents Introduction...... Methodology.. Travel Market Size & Structure... 5 Overnight Expenditures.. 11 Overnight Trip Characteristics...
Williamsburg 2017 Brand Health Study Executive Summary October 2017
 Williamsburg 2017 Brand Health Study Executive Summary October 2017 Survey Background Brand Health research respondents Fielded July 6 17, 2017 1,500 respondents, 50/50 mix of HH w/kids and HH w/o kids,
Naples, Marco Island, Everglades Convention and Visitors Bureau September 2013 Visitor Profile
 RESEARCH DATA SERVICES, INC. 777 SOUTH HARBOUR ISLAND BOULEVARD SUITE 260 TAMPA, FLORIDA 33602 TEL (813) 254-2975 FAX (813) 223-2986 Naples, Marco Island, Everglades Convention and Visitors Bureau September
1987 SUMMER USE SURVEY OF MINNESOTA STATE PARK VISITORS
 This document is made available electronically by the Minnesota Legislative Reference Library as part of an ongoing digital archiving project. http://www.leg.state.mn.us/lrl/lrl.asp (Funding for document
NEWCASTLE VISITOR PROFILE AND SATISFACTION REPORT. Summary of results OCTOBER Image: Newcastle Marina, courtesy of Newcastle Tourism
 NEWCASTLE VISITOR PROFILE AND SATISFACTION REPORT Summary of results OCTOBER 2013 Image: Newcastle Marina, courtesy of Newcastle Tourism 3 NEWCASTLE VISITOR PROFILE AND SATISFACTION REPORT: SUMMARY OF
St. Petersburg/Clearwater Area Convention and Visitors Bureau. September 2006 Visitor Profile
 RESEARCH DATA SERVICES, INC. 405 NORTH REO STREET SUITE 100 TAMPA, FLORIDA 33609 TEL (813) 254-2975 FAX (813) 254-2986 St. Petersburg/Clearwater Area Convention and Visitors Bureau September 2006 Visitor
Second Quarter 2015 Visitor Profile (April-June) Amelia Island Tourist Development Council
 Amelia Island Tourist Development Council") RESEARCH DATA SERVICES, INC. 777 SOUTH HARBOUR ISLAND BOULEVARD SUITE 26 TAMPA, FLORIDA 3362 TEL (813) 254-2975 FAX (813) 223-2986 Second Quarter 215 Visitor Profile (April-June) Amelia Island Tourist
RESEARCH DATA SERVICES, INC. 777 SOUTH HARBOUR ISLAND BOULEVARD SUITE 26 TAMPA, FLORIDA 3362 TEL (813) 254-2975 FAX (813) 223-2986 Second Quarter 215 Visitor Profile (April-June) Amelia Island Tourist
Naples, Marco Island, Everglades Convention and Visitors Bureau February 2013 Visitor Profile
 RESEARCH DATA SERVICES, INC. 777 SOUTH HARBOUR ISLAND BOULEVARD SUITE 260 TAMPA, FLORIDA 33602 TEL (813) 254-2975 FAX (813) 223-2986 Naples, Marco Island, Everglades Convention and Visitors Bureau February
DAYTONA BEACH VISITOR PROFILE
 DAYTONA BEACH VISITOR PROFILE January Prepared for The Halifax Area Advertising Authority By: Table of Contents OUT OF STATE VISITORS... 1 January, Daytona Beach Visitor Profile... 1 Satisfaction with
Second Quarter 2014 Visitor Profile (April June) Amelia Island Tourist Development Council
 Amelia Island Tourist Development Council") RESEARCH DATA SERVICES, INC. 777 SOUTH HARBOUR ISLAND BOULEVARD SUITE 260 TAMPA, FLORIDA 33602 TEL (813) 254-2975 FAX (813) 223-2986 Second Quarter 2014 Visitor Profile (April June) Amelia Island Tourist
RESEARCH DATA SERVICES, INC. 777 SOUTH HARBOUR ISLAND BOULEVARD SUITE 260 TAMPA, FLORIDA 33602 TEL (813) 254-2975 FAX (813) 223-2986 Second Quarter 2014 Visitor Profile (April June) Amelia Island Tourist
DAYTONA BEACH VISITOR PROFILE
 DAYTONA BEACH VISITOR PROFILE January Prepared for The Halifax Area Advertising Authority By: Table of Contents OUT OF STATE VISITORS... 1 January, Daytona Beach Visitor Profile... 1 Satisfaction with
Outdoor Adventures Department of Recreational Sports Spring 2017
 Outdoor Adventures Department of Recreational Sports Spring 2017 Background The Department of Recreational Sports maintains a more than 400,000 square foot facility visited by thousands of students, faculty,
Naples, Marco Island, Everglades Convention and Visitors Bureau November 2012 Visitor Profile
 RESEARCH DATA SERVICES, INC. 777 SOUTH HARBOUR ISLAND BOULEVARD SUITE 260 TAMPA, FLORIDA 33602 TEL (813) 254-2975 FAX (813) 223-2986 Naples, Marco Island, Everglades Convention and Visitors Bureau November
Naples, Marco Island, Everglades Convention and Visitors Bureau January 2016 Visitor Profile
 RESEARCH DATA SERVICES, INC. 777 SOUTH HARBOUR ISLAND BOULEVARD SUITE 260 TAMPA, FLORIDA 33602 TEL (813) 254-2975 FAX (813) 223-2986 Naples, Marco Island, Everglades Convention and Visitors Bureau January
Papua New Guinea International Visitor Survey. January December 2017 Simon Milne
 Papua New Guinea International Visitor Survey January December 2017 Simon Milne Summary of the Key Findings Total Direct Economic Impact for Jan-Dec 2017 Figures exclude employment and cruise visitors
Charlotte County 2016 Summer Tourism. Presented to: Charlotte Harbor Visitor and Convention Bureau
 Charlotte County 2016 Summer Tourism Presented to: Charlotte Harbor Visitor and Convention Bureau Research Data Services, Inc. December 2016 Economic Indicators Research Data Services, Inc. 12.08.16 2
Events Tasmania Research Program Hobart Baroque Festival
 Events Tasmania Research Program Hobart Baroque Festival Research Report 2014 Prepared by This report has been prepared by Enterprise Marketing and Research Services Pty. Ltd. 60 Main Road, Moonah, 7009
May 2009 Visitor Profile
 RESEARCH DATA SERVICES, INC. 3825 HENDERSON BOULEVARD SUITE 300 TAMPA, FLORIDA 33629 TEL (813) 254-2975 FAX (813) 254-2986 Visit St. Petersburg/Clearwater May 2009 Visitor Profile Prepared for: Pinellas
2012 In-Market Research Report. Kootenay Rockies
 2012 In-Market Research Report Kootenay Rockies Executive Summary This report summarizes key highlights for the Kootenay Rockies (KR) region taken from the British Columbia In-Market study conducted in
Finger Lakes Visitors Connection
 Finger Lakes Visitors Connection Comprehensive Destination Research Tourism Market Analysis Marketing Recommendations Study Period: December, 2011 September, 2012 Young Strategies, Inc., a Charlotte, NC
DAYTONA BEACH VISITOR PROFILE
 DAYTONA BEACH VISITOR PROFILE SEPTEMBER Prepared for The Halifax Area Advertising Authority By: Table of Contents OUT OF STATE VISITORS... 1 SEPTEMBER, Daytona Beach Visitor Profile... 1 Satisfaction with
DAYTONA BEACH VISITOR PROFILE
 DAYTONA BEACH VISITOR PROFILE June 26 Prepared for The Halifax Area Advertising Authority By: Table of Contents OUT OF STATE VISITORS... June, 26 Daytona Beach Visitor Profile... Satisfaction with Daytona
AVSP 7 Summer Section 12: Summary Profiles - Southeast Region and Communities
 AVSP 7 Summer 2016 Section 12: Summary Profiles - Southeast Region and Communities Summary Profiles: Southeast Region and Communities This chapter profiles the Southeast visitor market and visitors to
2015/16 Mammoth Lakes Visitor Volume
 BOARD PRESENTATION 2015/16 Mammoth Lakes Visitor Volume TOT receipts based on monthly amounts reported to Mammoth Lakes Tourism by area lodging venues SMARInsights' Visitor Profile research, 2016 Metric
DAYTONA BEACH VISITOR PROFILE
 DAYTONA BEACH VISITOR PROFILE AUGUST Prepared for The Halifax Area Advertising Authority By: Table of Contents OUT OF STATE VISITORS... 1 AUGUST, Daytona Beach Visitor Profile... 1 Satisfaction with Daytona
Visitor Profile - Central Island Region
 TOURISM LABOUR MARKET RESEARCH PROJECT 2003 The Project The Tourism Labour Market Research Project, was designed to study the tourism labour market throughout the Vancouver Island region. The Visitor Survey
T H E VILLAGE OF P h i l m o n t, N Y
 T H E VILLAGE OF P h i l m o n t, N Y Summit Reservoir Area Plan November 17, 2014 Executive Steering Committee Meeting 2 Agenda 1:00 1. Welcome 2. Housekeeping & updates i. Committee contact list review
2009 North Carolina Regional Travel Summary
 2009 North Carolina Regional Travel Summary A publication of the North Carolina Division of Tourism, Film & Sports Development July 2010 July 2010 Division of Tourism, Film and Sports Development 2009
TRAVEL HABITS OF THE BAY AREA MILLENNIAL
 TRAVEL HABITS OF THE BAY AREA MILLENNIAL It s no surprise San Francisco International Airport is one of the busiest airports in the world since the Bay Area is home to some of the most prolific travelers
Naples, Marco Island, Everglades Convention and Visitors Bureau April 2014 Visitor Profile
 RESEARCH DATA SERVICES, INC. 777 SOUTH HARBOUR ISLAND BOULEVARD SUITE 260 TAMPA, FLORIDA 33602 TEL (813) 254-2975 FAX (813) 223-2986 Naples, Marco Island, Everglades Convention and Visitors Bureau April
DAYTONA BEACH VISITOR PROFILE
 DAYTONA BEACH VISITOR PROFILE March Prepared for The Halifax Area Advertising Authority By: Table of Contents OUT OF STATE VISITORS... 1 March, Daytona Beach Visitor Profile... 1 Satisfaction with Daytona
Naples, Marco Island, Everglades Convention and Visitors Bureau February 2017 Visitor Profile
 RESEARCH DATA SERVICES, INC. 777 SOUTH HARBOUR ISLAND BOULEVARD SUITE 260 TAMPA, FLORIDA 33602 TEL (813) 254-2975 FAX (813) 223-2986 Naples, Marco Island, Everglades Convention and Visitors Bureau February
Naples, Marco Island, Everglades Convention and Visitors Bureau December 2017 Visitor Profile
 RESEARCH DATA SERVICES, INC. 777 SOUTH HARBOUR ISLAND BOULEVARD SUITE 260 TAMPA, FLORIDA 33602 TEL (813) 254-2975 FAX (813) 223-2986 Naples, Marco Island, Everglades Convention and Visitors Bureau December
Naples, Marco Island, Everglades Convention and Visitors Bureau March 2018 Visitor Profile
 RESEARCH DATA SERVICES, INC. 777 SOUTH HARBOUR ISLAND BOULEVARD SUITE 2 TAMPA, FLORIDA 332 TEL (813) 254-2975 FAX (813) 223-2986 Naples, Marco Island, Everglades Convention and Visitors Bureau March 2018
Naples, Marco Island, Everglades Convention and Visitors Bureau June 2018 Visitor Profile
 RESEARCH DATA SERVICES, INC. 777 SOUTH HARBOUR ISLAND BOULEVARD SUITE 260 TAMPA, FLORIDA 33602 TEL (813) 254-2975 FAX (813) 223-2986 Naples, Marco Island, Everglades Convention and Visitors Bureau June
Maine Office of Tourism Visitor Tracking Research 2016 Calendar Year Annual Report Regional Insights: Maine Lakes & Mountains.
 Maine Office of Tourism Visitor Tracking Research 2016 Calendar Year Annual Report Regional Insights: Prepared by April 2017 Table of Contents Research Objectives and Methodology 3 Overnight Visitors:
Naples, Marco Island, Everglades Convention and Visitors Bureau January 2018 Visitor Profile
 RESEARCH DATA SERVICES, INC. 777 SOUTH HARBOUR ISLAND BOULEVARD SUITE 260 TAMPA, FLORIDA 33602 TEL (813) 254-2975 FAX (813) 223-2986 Naples, Marco Island, Everglades Convention and Visitors Bureau January
November 2011 Visitor Profile
 RESEARCH DATA SERVICES, INC. 777 SOUTH HARBOUR ISLAND BOULEVARD SUITE 260 TAMPA, FLORIDA 33602 TEL (813) 254-2975 FAX (813) 223-2986 Naples, Marco Island, Everglades Convention and Visitors Bureau November
Visit South Walton Visitor Tracking Study: Summer Phillip Downs, Ph.D. Joseph St. Germain, Ph.D. Rachael Powell Kerr & Downs Research
 Visit South Walton Visitor Tracking Study: Summer 2014 Phillip Downs, Ph.D. Joseph St. Germain, Ph.D. Rachael Powell Kerr & Downs Research Study Objectives Profile travel parties to South Walton Size,
Naples, Marco Island, Everglades Convention and Visitors Bureau March 2013 Visitor Profile
 RESEARCH DATA SERVICES, INC. 777 SOUTH HARBOUR ISLAND BOULEVARD SUITE 260 TAMPA, FLORIDA 33602 TEL (813) 254-2975 FAX (813) 223-2986 Naples, Marco Island, Everglades Convention and Visitors Bureau March
Charlotte County 2017 Summer Tourism. Presented to: Charlotte Harbor Visitor and Convention Bureau
 Charlotte County 2017 Summer Tourism Presented to: Charlotte Harbor Visitor and Convention Bureau Research Data Services, Inc. November 2017 Summer Season April September 2017 Research Data Services, Inc.
Isles of Scilly Online Visitor Survey Final report. Produced for and on behalf of the Islands Partnership. May 2016
 Isles of Scilly Online Visitor Survey 2015 Final report Produced for and on behalf of the Islands Partnership by The South West Research Company Ltd. May 2016 Contents Page Summary 3 Introduction 7 Visitor
Naples, Marco Island, Everglades Convention and Visitors Bureau August 2018 Visitor Profile
 RESEARCH DATA SERVICES, INC. 777 SOUTH HARBOUR ISLAND BOULEVARD SUITE 260 TAMPA, FLORIDA 33602 TEL (813) 254-2975 FAX (813) 223-2986 Naples, Marco Island, Everglades Convention and Visitors Bureau August
FALKLAND ISLANDS International Tourism Statistics Report 2012
 FALKLAND ISLANDS International Tourism Statistics Report 2012 2 Falkland Islands Tourism 2012 Land-Based Tourism Number of tourist arrivals All tourists: Leisure tourists: 7,791 17% compared to 2011 1,937
Laurel Highlands Visitors Bureau. Tourism Promotional Outlook
 Laurel Highlands Visitors Bureau Tourism Promotional Outlook Our Mission To promote and support tourism, tourism development, and the interests of the travel and hospitality industries in Pennsylvania's
Maine Office of Tourism Visitor Tracking Research Winter 2017 Seasonal Topline. Prepared by
 Maine Office of Tourism Visitor Tracking Research Winter 2017 Seasonal Topline Prepared by June 2017 Research Objectives and Methodology 2 Research Objectives Three distinct online surveys are used to
Lord Howe Island Visitor Survey 2017
 INTRODUCTION Lord Howe Island Visitor Survey 2017 Lord Howe Island is one of Australia s premier holiday destinations, part of a World Heritage-listed island group that is known for its outstanding natural
Tourism Kelowna Visitor Intercept Survey Findings FINAL DRAFT REPORT
 Tourism Kelowna Visitor Intercept Survey Findings FINAL DRAFT REPORT January 17, 2017 1 Table of Contents Executive Summary... 3 Methodology.. 7 Visitor Intercept Survey Findings.. 9 Visitor Profile. 9