Hersheypark would like to extend a thank you to the following individuals:
|
|
|
- Ernest Francis
- 6 years ago
- Views:
Transcription

1 Welcome to Hersheypark, a proud supporter of STEM education initiatives. Hersheypark offers laboratory manuals focusing on Math and Physics. Both of the manuals are designed to give students the opportunity to apply their content knowledge in a hands-on environment while enjoying the day at one of the country s favorite amusement parks. Hersheypark provides this Math Lab Manual that correlates directly to the Common Core State Standards while continuing to adhere to the Pennsylvania State Standards and the NCTM Standards. Students may want to download a graphing calculator App. Our educational guides are designed to be a resource as you and your students plan your Hersheypark adventure. Feel free to choose the activities that best fit your students and reproduce the worksheets as needed. You will find activities that are appropriate for a variety of ages, grade levels, and curriculums. Hersheypark would like to recognize several individuals who have contributed their time and talents to updating the current Math Lab Manual. These individuals are continuing the tradition of educational enrichment within Hersheypark. Mike Long Ed.D., Shippensburg University of Pennsylvania Robert Newara, Cumberland Valley SD Amanda Paveglio, Lancaster-Lebanon Intermediate Unit 13 Becky Piscitella, Richland School District Timothy Seiber, Cumberland Valley SD Alan Friedrich, Hersheypark Groups Hersheypark would like to extend a thank you to the following individuals: Don Scheuer, Consultant Amy Lena, Cumberland Valley SD Carolyn Marchetti, Berks County IU14 Hersheypark will gladly accept any additional problems, experiments, or corrections to our educational guides. Please feel free to Hersheypark Group Sales, with your comments or questions to HersheyparkGroups@HersheyPA.com. 1
2 Tips for a Successful Math Day Identify the labs you want the students to complete. Use the Day Planner to coordinate your day. Consider making a time and place to meet during the day. Students may want to download the following Apps to their smart phones ahead of time: Graphing Calculator App Accelerometer App Smart phones allow students to carry fewer items; however, we highly recommend wearing clothing that can secure your phone on rides. Pockets that zipper will help prevent your phone from being lost, broken, or stolen. Please note that the measuring devices, phones and cameras are not permitted on the following rides: Skyrush, Storm Runner, Fahrenheit, Laff Trakk and the Hershey Triple Towers. Hersheypark has the right to add additional rides to this list at any time. All riders must follow the directions of the ride operators at all times. Wear comfortable shoes that are strapped to your feet. Check the weather ahead of time and dress appropriately. Dress in layers to accommodate temperature changes throughout the day. Don t forget the sunscreen. List any other items you want to suggest to your students : 2
3 3
4 Time Place or Activity Math Day Planner Notes 4
5 Lab Name: Ride(s) involved: Bigger Coaster = More Riders? Coasters throughout the Park Key Question: Student Tech Requirements: Stop Watch Activity Directions: Using the following tables, you are going to collect data about the coasters at Hersheypark. As a train leaves the station or passes a particular point of reference, start the stopwatch. Record the cumulative time in seconds (do not stop the watch) as the next six trains dispatch or pass the particular point of reference. The number of trains will be the independent variable. The dependent variable will be the cumulative number of passengers that have left the station. So in addition to keeping the time, you will need to count the number of people riding in each train to keep a running total of the number of people that have ridden the coaster. Comet sooperdooperlooper Great Bear Total Time Cumulative # of Passengers Total Time Cumulative # of Passengers Total Time Cumulative # of Passengers 5
6 Trailblazer Storm Runner Fahrenheit Total Time Cumulative # of Passengers Total Time Cumulative # of Passengers Total Time Cumulative # of Passengers Sidewinder The Wildcat Lightning Racer Total Time Cumulative # of Passengers Total Time Cumulative # of Passengers Total Time Cumulative # of Passengers 6
7 1. Now that you have collected some data, make scatterplots or one scatterplot of your data. You may choose to use some form of technology for this or you may choose do it by hand. 2. Next, determine the line of best fit for each of the individual data sets. 3. What does the rate of change of each of the lines of best fit tell you? 4. Use the line of best fit to predict the number of people that would ride the coaster in one hour. 5. Compare the predicted riders per hour to the theoretical by making of a ratio. 7
8 Lab Name: Ride(s) involved: Key Question: Student Tech Requirements: Carrousel Carrousel Does every rider on the carrousel experience the same ride? Smart phone or stopwatch and calculator Activity Directions: Part 1: Observe the ride and answer the following questions: 1. How many horses are there on the carrousel? 2. How many of the horses move up and down? 3. If you got on a horse without looking up to see if it could move, what is the probability that you would be on a moving horse? 4. What are the odds that you would be on a moving horse? Part 2: Complete the chart according to the list of directions and then answer the questions that follow. Use the data in the back of the book or scan the QR code at the ride entrance. 1. List the radius of each horse s circular path. 2. Calculate the circumference of each horse s path. C=2 r 3. If the ride time is 2 minutes and a single rotation is 11 seconds, how many revolutions will each horse make during one complete ride? 4. Calculate the distance each horse travels during one complete ride. Distance = circumference number of revolutions 5. Now calculate the average speed for each horse. Average speed = d / t Circular Path Radius of each path Circumference of each path Revolutions per ride Distance per ride Average speed Inner Horse Middle Horse Outer Horse 8
9 6. Are all the paths on the carrousel the same distance? 7. If you decided to ride a horse, which path would you choose and why? 8. If an inner horse rider rides 4 times, about how many times will an outer horse rider need to ride to cover approximately the same distance? 9. Does every rider on the carrousel experience the same ride? Defend your response. Ride data /elements: CARROUSEL ENGLISH METRIC Radii m Inner horse m Middle horse m Outer m Total ride time 2 minutes 2 minutes Single rotation time 11 seconds 11 seconds Lab Name: Carrousel 2 Ride(s) involved: Key Question: Student Tech Requirements: Carrousel What is tangential velocity? Smart phone, stopwatch 9
10 Activity Directions: Use your smart phone to retrieve the following information: Radius of outer ring: Ride radius: Height of platform: 1. Measure the period of rotation. T = 2. Calculate the tangential speed v t for the outer ring. Useful formulas: s r= θ, v t = dt ds 3. Would the tangential velocity increase or decrease for riders riding on the inner ring? Explain. 4. Suppose an outer ring rider s shoe flew off their foot. How far will the shoe fly before reaching the ground? Assume a reasonable value for the height above the platform of the rider s foot. 5. What is the distance from the platform that the shoe is now located? Ride data /elements: CARROUSEL ENGLISH METRIC Ride Radius m Radius of outer ring m Height of platform m 10
11 Lab Name: Ride(s) involved: Carrousel vs. Great Bear Carrousel, Great Bear Key Question: Student Tech Requirements: Activity Directions: Problem 1: The diameter of the carrousel varies depending on whether you are riding a horse on the inner row, 17.5 feet, the middle row, 20.5 feet, and the outer row 23.5 feet. Determine the total distance that a rider travels during one revolution. Then use this to find the total distance that a rider travels during one complete ride. Make your science teacher happy by remembering to use units! Inner Row: Middle Row: Outer Row: Problem 2: Determine the average linear speed inner row, middle row, and outer row of the horses on the carrousel during one complete ride. Use appropriate units. time x speed = distance Inner Row: Middle Row: Outer Row: Problem 3: Determine the number of degrees that a rider in each row travels during one complete ride on the carrousel. Then determine the angular speed for each row. Inner Row: Middle Row: Outer Row: 11
12 Problem 4: Determine the area of the circle made by the horses of the carrousel as the ride rotates. Again remember the units. Inner Row: Middle Row: Outer Row: Problem 5: If the length of the Great Bear is 2,800 feet, how many revolutions does the carrousel have to make so that a ride travels the same distance as a rider on the Great Bear? Inner Row: Middle Row: Outer Row: Problem 6: In the space below, sketch a distance versus time graph for each row of the carrousel. Lab Name: Chocolate Probability Ride(s) involved: Key Question: Student Tech Requirements: Fahrenheit, Skyrush SM What is the probability? Smart phone or calculator Activity Directions: 1. Review the ride data of the following rides then answer the following questions. npr = n! ncr = n! (n r)! (n r)! r! 12
13 2. If a group of 12 friends wants to ride Fahrenheit, how many different groups can be seated on one ride? 3. If the same group of 12 friends wants to ride Fahrenheit together, how many times will they need to ride to make sure everyone sits in a different seat each time? 4. If you were seated at random on Fahrenheit, what is the probability that you would be seated in the first car? What are the odds in favor of this? 5. If you were seated at random on Skyrush, what is the probability that you would be seated in the first car? What are the odds in favor of this? 6. If you were seated at random on Skyrush two times, what is the probability that you would be seated in the same seat both times? 7. If you were seated at random on Fahrenheit two times, what is the probability that you would be seated in the same seat both times? 8. If you put your hand in a bag that contains 5 Hershey s Milk Chocolate Bars with Almonds, 7 Hershey s Milk Chocolate Bars, 13 Reese s Peanut Butter Cups, and 10 Twizzlers, and randomly picked out 2 items to eat, what is the probability that both items would be chocolate? Ride data /elements: Fahrenheit Skyrush Lab Name: 4 seats per car, 3 cars, 12 total riders 4 seats per car, 8 cars, 32 total riders Circular Function Machines Ride(s) involved: Entire Park Key Question: Student Tech Requirements: Excel 13
14 Activity Directions: This activity requires that you make some observations at different circular rides as you roam Hersheypark. As you approach each of the rides listed, you need to count the number of arms, which are holding seats, and then determine the number of degrees between each of the arms or the measure of the angle between arms which are side by side. The rides which you are to observe (or ride) are listed: The Howler Number of Arms: Degrees Between Each Arm: Scrambler Number of Large Arms: Degrees Between Each Arm: Dinosaurs Number of Arms: Degrees Between Each Arm: Music Express Number of Arms: Degrees Between Each Arm: Flying Falcon Number of Small Arms: Degrees Between Each Arm: Frontier Flier Number of Arms: Degrees Between Each Arm: Starship America Number of Arms: Degrees Between Each Arm: Granny Bugs Number of Arms: Degrees Between Each Arm: After you finish collecting the information, make a display of your data using a graphing calculator or spreadsheet. (You may choose to use graph paper.) The number of arms for the rides should be on the independent variable and the corresponding number of degrees between the arms on the dependent variable. Be sure to use a scale on both axes so that the graph will fit in the window (or paper). Put the ride names that you collected data for beside the number of arms. Now that you have collected some data, make scatterplots or one scatterplot of your data. You may choose to use some form of technology for this or you may choose do it by hand. 14
15 Next, determine the line of best fit for each of the individual data sets. Again, you may choose to use some form of technology for this. What can you say about the number of degrees between the arms as the number of arms increases? CHALLENGE: What would the rate of change of the function be and what would it tell you? Lab Name: Ride(s) involved: Coaster Hypothesis Tests Entire Park Key Question: Student Tech Requirements: Excel Activity Directions: This activity requires that you make some observations at different coasters as you roam Hersheypark. As you approach each of the coasters listed, you need to count the number of empty seats for at least five dispatches of the train. Tables for the data you are to collect are provided below. 15
16 Comet (wood) The Wildcat (wood) Lightning Racer Red (wood) Train Number # of Empty Seats Train Number # of Empty Seats Train Number # of Empty Seats Lightning Racer Green (wood) Great Bear sooperdooperlooper Train Number # of Empty Seats Train Number # of Empty Seats Train Number # of Empty Seats
17 Trailblazer Storm Runner Sid ewinder Train Number # of Empty Seats Train Number # of Empty Seats Train Number # of Empty Seats After you finish collecting the information: 1. Choose two of the wood coasters. Determine an interval where the difference between the population mean number of empty seats for the two coasters lies and interpret the results. 2. Choose two of the wood coasters. Test a claim that the population mean number of empty seats for the one coaster you chose is different from the second. 3. Choose three of the wood coasters. Test a claim that the population mean number of empty seats for at least one of the wood coasters you chose is different. 4. Choose any two coasters. Determine an interval where the difference between the population proportion of empty seats for the two coasters lies and interpret the results. 5. Choose any two coasters. Test a claim that the population proportion of empty seats for the one coaster you chose is different from the second. 17
18 Lab Name: Ride(s) involved: Conquering Starship America! Starship America in Founder s Circle Key Question: Student Tech Requirements: Pasco or Vernier data collection device with and an altimeter Activity Directions: Conquering Starship America Can you ride the Starship America (located in Founder s Circle), while wearing a data collection device, and create a height versus time (altitude) graph to match the one below. Figure out what you need to do with a partner and then ride. Please describe: the graph shown above 18
19 Lab Name: Ride(s) involved: Key Question: Correlating at Hersheypark Multiple coasters Is there a correlation between Hersheypark visitors ages and number of times they ride on roller coasters in a day? Student Tech Requirements: None for data collection at the park. For data analysis: software to graph data points, OR graph paper Activity Directions: 1. In the middle of the afternoon or as you leave the Park, ask at least 30 people how many times they rode on roller coasters today. Try to ask a variety of age groups. a. Why might it be important to ask at least 30 people? b. Why might it be important to do this activity in the afternoon? c. Is there a difference between asking how many coasters did you ride today? and how many times did you ride on roller coasters today? 2. Ask each person their age and the number of coaster rides they had. If they rode the same coaster more than once today, count each ride separately. Record your data in the table below. Age Number of Rides Age Number of Rides Age Number of Rides 19
20 3. Make a scatterplot with your results. Plot age on the x-axis and number of coaster rides on the y-axis. (You may want to scale the graph by 2, 4, 6, 8, etc.) 20
21 4. Is there a positive, negative, or no correlation represented? What does that mean? 5. If there is a correlation, would you consider it a strong or weak correlation? 6. Do you think that your results would be similar or different if you had asked fewer people? What about more people? 7. Partner with a classmate who also did this activity. Combine your results together and make a new scatter plot. Is your combined graph different than your first graph? Was it what you expected? Post-Activity: Look in a newspaper or magazine for an article about a poll or a scientific study. Does the article talk about correlation (or the relationship between two variables)? What question was the poll/study trying to answer? What are the variables? Does the article describe how big the sample size was? Does it describe how the sample was chosen? What questions do you have about the poll/study s results? 21
22 Lab Name: Ride(s) involved: Key Question: Fast Faster Fastest! Multiple coasters Is the fastest coaster your favorite? Student Tech Requirements: Smart phone or stopwatch and calculator Activity Directions: 1. From the chart, obtain the ride rating, track length, and maximum speed. 2. Time each coaster and record the data below. 3. Use the formula R = d / t to find the average speed of each ride in ft/s.. 4. Convert the average speed to mph. (1 mile = 5280 ft) Coaster Ride Rating Track length in feet Time of Ride Average Speed (ft/s) Average Speed (mph) Maximum Speed mph Comet Fahrenheit Great Bear Lightning Racer Cocoa Cruiser Sidewinder Skyrush sooperdooperlooper Storm Runner Trailblazer Wildcat Wild Mouse
23 5. Compare the average speeds. a. Which coaster has the fastest average speed? Coaster Ride Rating b. Which coaster has the fastest maximum speed? Coaster Ride Rating c. Which coaster has the slowest average speed? Coaster Ride Rating d. Which coaster has the slowest maximum speed? Coaster Ride Rating e. Which is your favorite coaster? Why? 23
24 Lab Name: Filling the Carrousel Ride(s) involved: Carrousel Key Question: What is the volume of the carrousel? What other ways can we think about volume? Student Tech Requirements: Calculator Pre-Activity: You may need any of the following formulas to complete this activity: Volume of a cylinder: V = π r 2 h Volume of a rectangular prism: V = l w h π r 2 h Volume of a cone: V = Volume of a sphere: V = 4 π r 3 3 Area of a circle: A = 2π r Use your smart phone to scan the Carrousel QR code and get the dimensions of the Carrousel. Activity Directions: 1) The Carrousel has a complex shape. Can you break it up into simpler shapes? Draw a sketch of the carrousel. What type of geometric figure does the tent sit on? What type of geometric figure is the tent? 2) Use the given dimensions to find the volume of the carrousel. a) Find the volume of the bottom section of the carrousel. b) Find the volume of the tent of the carrousel. c) Find the total volume of the carrousel. 24
25 3) Imagine that all of the horses, seats, etc. are taken out of the Carrousel and riders must stand if they want to ride. For safety, Hersheypark puts a railing inside the Carrousel 3 feet away from the edge of the rotating deck. If each rider stands on the deck in a circle with a 1-foot radius, approximately how many people can ride the standing room only Carrousel if it is full? 4) Image that you want to fill the entire Carrousel both the bottom section and the tent section with 1-scoop ice cream cones. If a regular-size ice cream scoop has a radius of 2 inches, and a regular-size cone has a radius of 1 inch and a height of 4 inches, what is the volume of a regular-size ice cream cone? How many ice cream cones can fit inside the Carrousel? (Don t forget about unit conversion!) Ride data / elements: CARROUSEL ENGLISH METRIC Circumference of Carrousel m Radius m Distance from ground to ceiling riding area m Distance from ground to peak of the tent m 25
26 Mini-Geocaching inside Hersheypark You will need a longitude/latitude app or a GPS reader. Due to the variety of apps, all waypoints have been recorded both as degrees ( ) minutes ( ) seconds ( ), and degrees ( ) minutes ( ) with decimals. See the end of this activity if you wish to learn how to convert seconds into decimal minutes. Note: mini-geocaching requires precise measurements with little change in the degree and minute units of measure. Our first stop is to ride a horse while following the path of a conic section. Record your waypoint location: Record your location: N W Now it is off to a little game of cat and mouse. Travel NE to: N ( ) W ( ) Look due EAST and upward. What two water rides do see listed on the same sign? It s not far to the next stop. Go east to the far entrance of the Rube Goldberg water machine. Record your waypoint location: Record your location: N W Back up the hill for a restful ride. Your ride over the park will take you outside the park to the eastern most point of the ride. Be attentive, the ride does not stop at this location. There was a time, many years ago, when visitors to this building were treated to the smell of chocolate mixing in very large vats. Record your location: N W 26
27 Over the river and through the valley to our next stop we go. Here live the live residents of Hersheypark. Travel to: N ( ) W ( ) How do you measure up? Take a photo with the sign. Our final stop leads us to the entrance of an attraction that Chicken Little may never ride. Is the sky really falling or does it just feel that way on the ride? Record your location: N W Name the ride. Well done! We hope your trip around the Park was enjoyable Degrees, minutes and seconds are similar to hours, minutes and seconds. A minute is one sixtieth of a degree. A second is one sixtieth of a minute. For this activity, to convert a second to a decimal part of a minute divide the seconds by 60. To convert the decimal part of a minute to a second multiply by
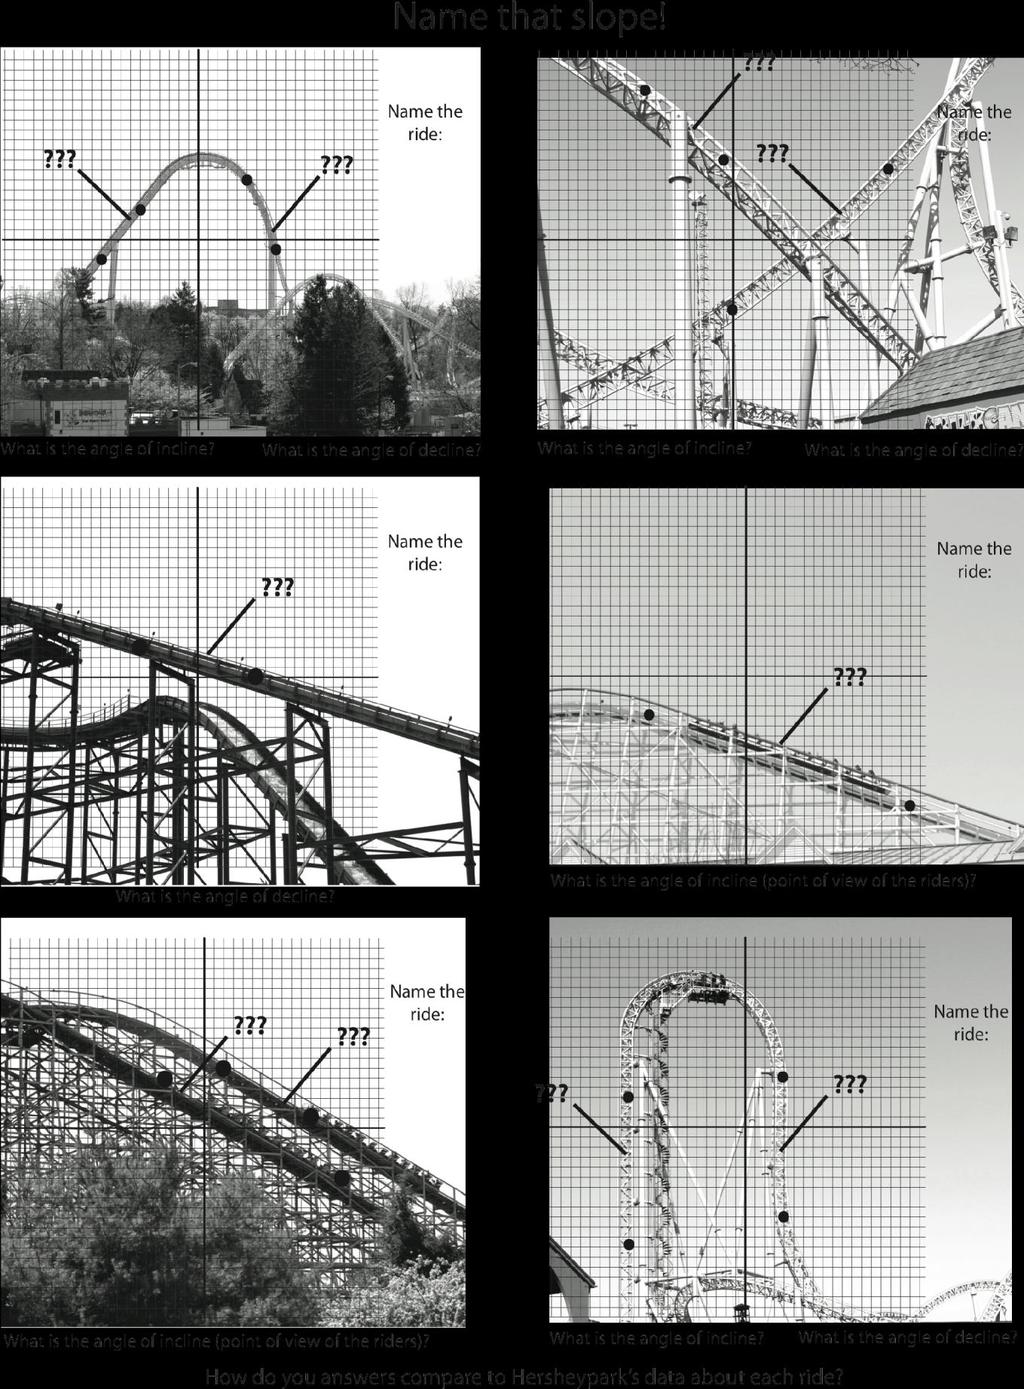
28 Lab Name: Ride(s) involved: Geometry Scavenger Hunt Entire Park Key Question: Student Tech Requirements: Camera, photo enhancement software (MS Paint or other), printer, or publishing software Activity Directions: This activity requires that you take some photos as you roam Hersheypark. Look for the geometric structures in the list below. Take a photo of the structure. When you return to class, upload the pictures into Microsoft Paint and highlight the structure using the drawing features. Also, label the structure. Then, at the direction of your teacher, print out the photos in an appropriate format or create a MixBook of them. Segment Scalene Triangle Trapezoid Right Angle Acute Angle Obtuse Angle Complementary Angles Supplementary Angles Vertical Angles Parallel Lines Perpendicular Lines Acute Triangle Right Triangle Obtuse Triangle Equilateral Triangle Isosceles Triangle Ray Parallelogram Rectangle Rhombus Square Hexagon Octagon Pentagon Congruent Angles Similar triangles Mirror symmetry Rotational symmetry Ellipse Hyperbola 28
29 Lab Name: Ride(s) involved: Graphical Scavenger Hunt Entire Park Key Question: Student Tech Requirements: Activity Directions: Can you identify the ride that has the height vs. time graph shown? Please write the associated ride name under each graph. 29
30 30
31 31
32 32
33 33
34 Lab Name: Ride(s) involved: Key Question: Student Tech Requirements: Hersheypark Number Hunt Entire Park 34
35 Activity Directions: As you roam Hersheypark, write a mathematical expression for the situation and then find the answers to the mathematical expressions. 1. There are 4 wheels on each of the antique cars on the Turnpike and the wheels each have the same number of spokes. How many total spokes are there on every car? 2. If 1 train on the Trailblazer leaves and every other seat, starting with the first, has 2 people in it and the remaining seats have 1 person, how many people are riding in the train? 3. If every seat on The Howler has 3 people in it, how many people will be riding on The Howler? 4. What percent of the horses on the Carrousel are occupied if only the horses on the outside row are occupied? 5. On Lightning Racer, the odd seats in the trains have 1 person and the evens have 2 (i.e. the first seat has 1 person, the second has 2, the third has 1 person, etc.). How many people are riding the Lightning Racer? 6. If 80% of the seats on the Music Express are filled and all have 3 riders each, how many riders are on the Music Express? 7. If each seat on the Pirate can hold 5 people, what is the maximum number of people that can ride the Pirate at 1 time with 1 seat completely empty? 8. If only the outside seats of each cluster on The Claw are occupied, what fraction of the seats are occupied? 35
36 9. If 7/8 of the seats on the sooperdooperlooper are full when it dispatches, how many riders are there in that train? 10. The seats on The Claw are in groups of 4. If one of the middle seats of every cluster is empty, what percent of the seats are occupied? 11. The seats on The Whip seat up to 3 people. If 44% of the booths have 3 people and the remaining have 2 people, how many people are riding? Lab Name: Ride(s) involved: Key Question: Student Tech Requirements: Scrambler The Scrambler How do you calculate arc length? Smart phone, stopwatch Activity Directions: Use your smart phone to retrieve the following information: Radius of gondola arm: Rate of gondola arm: Radius of center arm: Rate of center arm: 1. Measure the time of the operation of the ride. t = 2. Estimate the distance a rider travels during the operation of the ride using circumference. 3. Estimate the distance a rider travels during the operation of the ride using arc length. You may want to use a graphing calculator. 36
37 4. Which estimation do you think is more accurate? Explain your reasoning. Ride data / elements: The Scrambler ENGLISH METRIC Length of center arm m Rotation rate of center arm 11.4 rpm 11.4 rpm Length of gondola arm m Rotation rate of gondola arm 14.3 rpm 14.3 rpm Alternate Activity Directions: Use your smart phone to retrieve the following information: Radius of gondola arm: Rate of gondola arm: Radius of center arm: Rate of center arm: 1. Measure the time of the operation of the ride. t = 2. Estimate the distance a rider travels during the operation of the ride using circumference. 3. Estimate the distance a rider travels during the operation of the ride using arc length. a) Parameterize the path swept out by both the center and gondola arms and write each as a vector-valued function. Keep in mind that the rates at which the arms rotate are not equal so you will need a coefficient for the angles for one of the paths. You can experiment with ratios of the rates for this coefficient. Useful formulas: x = rcost, y = rsint, r t( ) = x t i( ) + y t j( ) 37
 Use your calculator to determine the period of the function.")
 Use to calculator to find the arc length of one period.")
 Estimate the distance a rider travels during the operation of the")
38 b) Add the paths together to write as a single vector-valued function. c) Use your calculator to determine the period of the function. Estimate in terms of π. d) Use to calculator to find the arc length of one period. e) Estimate how many times the path is traced during the operation of the ride. f) Estimate the distance a rider travels during the operation of the ride. 4. Which estimation to you think is more accurate? Explain your reasoning. 38

39 39
40 Lab Name: Ride(s) involved: Key Question: Student Tech Requirements: sooperdooperlooper sooperdooperlooper What is the relationship between position and velocity? Smart phone, stopwatch Pre-Activity: Discuss how to determine the speed at the top, about half-way down, and at the bottom. Activity Directions: Use your smart phone to retrieve the following information: Length of train: Mass of loaded train: Height of first hill: 1. Determine the speed at the top, about half-way down, and the bottom of the first hill. To do this, pick a place in space that the train will pass through. As the train enters that space, start the stopwatch; as the train leaves that space, stop the stopwatch. Simply d take the length of the train and divide by the time to get a value for speed (r = ). t Time for the train to pass through a place in space at the top = Time for the train to pass through a place in space half-way down = Time for the train to pass through a place in space at the bottom = 40
41 2. Measure the time it takes for the train to get half-way down and all the way down the first hill. t top = 0 s t half way = t bottom = 3. Use the above speeds and their respective times to create an exponential equation that models the train s velocity. This can be achieved through the STAT menu of a TI graphing calculator. 4. Use your model to find the instantaneous velocity of the train when it is 8 m down the first hill. Ride data / elements: sooperdooperlooper ENGLISH METRIC Length of train m Mass of the loaded train 9400 lbs kg Height of the first hill m Lab Name: Ride(s) involved: Key Question: Student Tech Requirements: Storm Runner Storm Runner What is the relationship between velocity and acceleration? Smart phone, stopwatch 41
42 Pre-Activity: Since the concept of work is not directly a part of the AP curriculum, it is an application of integration. It would be good to talk about work in order to get a feel for what it is and if the answer to the question below makes sense. How much is a Joule? How much work is required to lift a book from the floor to a desk? How much work is required to lift a loaded elevator up 2 stories? Activity Directions: Use your smart phone to retrieve the following information: Mass of train: Number of passengers: 1. Measure the time for the train to accelerate from rest to the point just prior to its ascent (when the train achieves its maximum velocity). t = 2. At t = 0, the train has an acceleration of 3.5 g s (34.3 m 2 ). At the time you found above, the train is moving at 1.5 g s (14.7 m 2 ). Use this information to create an exponential s equation that models the train s acceleration. This can be achieved through the STAT menu of a TI graphing calculator. s 3. Use your acceleration equation to create a velocity equation. Maximum velocity = m s. Useful formula: a du = a +C. lna u 1 u 4. Use your velocity equation to create a position equation. Distance during the timed acceleration = 46 m. 5. During the acceleration, how much work is done on the train? Assume the average mass of the passengers to be 86 kg. Useful formulas: F ma=, W = F x dx( ). 42
43 Ride data / elements: Storm Runner ENGLISH METRIC Mass of loaded train 23,501 lbs 10,659 kg Number of passengers Lab Name: Ride(s) involved: Key Question: Student Tech Requirements: Turnpike Twin Turnpike Sunoco Speedway & Sunoco Classic Cars How do we calculate velocity and use it to solve problems? stopwatch Activity Directions: 1. Find out how much time it takes to go around the Classic Cars track and the Speedway track. a. Either ride both tracks yourself or work with a friend (each of you ride one track). b. Use a stopwatch to time your rides. Start the stopwatch as soon as the car starts to move, and stop the stopwatch when the car comes to a complete stop. Record the time, in seconds, for each ride in the table below. Track Time around / lap time (seconds) Classic Cars Speedway 43
44 2. Velocity is another word for speed. When you calculate velocity, you are answering the question How far did I go, and how long did it take me to get there? The formula to calculate velocity is V = d or Velocity = distance t time Write your lap times in the table below. The distance for each track is provided. Use this information to calculate your velocity for each track. Track Classic Cars Speedway Time around / lap time Length of Track Velocity (feet/second) 1,167 feet 1,076 feet 3. For cars in the United States, velocity is usually described in miles/hour (or mph). For the Classic Cars track and Speedway track, convert your feet/second velocity to miles/hour on your own or following these steps below. Classic Cars Velocity (ft/sec) 1 second feet 60 seconds 60 minutes 1 mile miles x 1 minute x 1 hour x feet = hour 5,280 44
45 Speedway Velocity (ft/sec) 1 second x 1 minute x 1 mile 5,286 1 hour x feet = hour feet 60 seconds 60 minutes miles 4. How many miles is it to Hersheypark from your school? 5. If you drove as fast as the Speedway car, how many hours would it take you to get back to school? How many minutes? 6. Would it take more, less, or about the same amount of time if you drove as fast as the classic car? 7. If you had to get back to your school in 30 minutes, how fast (in miles/hour) would you have to drive? Post-Activity: Graph your velocity information from the Speedway track. Time (in seconds) on x axis, distance (in feet) on y axis. Do you think this graph tells a true story of your trip on the speedway? Why or why not? **Hersheypark graph of the speedway s velocity (will be provided in next update to this guide) Ride data / elements: actual graph of speed vs. time for 1 lap of each of the Classic and Speedway tracks Discuss the similarities and differences you see. What reasons might exist for the differences? 45
46 Real-Life Racing: The final race of the 2011 NASCAR Sprint Cup Series was run at Homestead-Miami Speedway on Nov. 20, In that race, the fastest lap was run by Carl Edwards, with a speed of mph. Convert this speed from miles/hour to feet/second. If one lap of the Speedway is 1.5 miles long, how many seconds did it take Carl to complete the fastest lap of the race? NASCAR teams and officials measure lap times to the 1000 th of a second, and speeds to the 1000 th of mph. Why do you think this might be? Lab Name: Ride(s) involved: Wave Swinger Wave Swinger Key Question: Student Tech Requirements: Smart phone, stopwatch, altimeter Pre-Activity: Discuss how to use an altimeter. Activity Directions: Use your smart phone to retrieve the following information: Radius of the outer ring: 1. Measure the period of rotation. T = 46
47 2. Calculate the tangential speed v t for the outer ring. ds Useful formulas: s r= θ, v t = dt 3. Use an altimeter to measure the angle from the ground to one of the seats on the outer ring. θ = 4. Calculate the height of the seat using the above angle. Estimate both the horizontal distance on the ground from the seat to your position and the height at which you are holding the altimeter. 5. Suppose an outer ring rider s shoe fell off their foot. Find the velocity with which the shoe hits the ground. Ride data / elements: Wave Swinger ENGLISH METRIC Radius of outer ring m 47
48 Lab Name: Ride(s) involved: When Will It Happen? Entire Park Key Question: Student Tech Requirements: Activity Directions: Determine the number of people described in each situation Problem 1: If each seat on the Tidal Force seats 4 people and each seat is half full every time a boat leaves. How many boats will have dispatched before boat with the 48 th person feels the force? Problem 2: If you are standing in line for Fahrenheit and there are 42 people in front of you. How many FULL trains will leave BEFORE the train with you in it leaves? Problem 3: You enter the line for the Wave Swinger just as a group of people are exiting. You notice there are 100 people in front of you. How many times will the ride start, and be completely full, BEFORE you get on the ride? Problem 4: You notice that the line for the Whip is not too long, only 24 people. You do not get on the ride because all of the seats are occupied, but none by more than 2 people. Determine how many of the seats are filled with 2 people and how many with just 1 person. 48
49 Lab Name: Ride(s) involved: ZooAmerica Animals in their Habitats ZooAmerica various habitats Key Question: Student Tech Requirements: Activity Directions: There are 5 habitats in ZooAmerica: Northlands, Big Sky Country, Eastern Woodlands, The Great Southwest, and Southern Swamps. 1) Visit at least 3 habitats, and count the number of different types of animals you see in each of the following categories. Then convert each count into a percent of that habitat s total. Northlands Big Sky Country Animal Category # of different types % of total Animal Category # of different types % of total Birds Birds Reptiles Reptiles Mammals Mammals Fish Fish Other Other TOTAL TOTAL 49
50 Eastern Woodlands Animal Category Birds # of different types % of total Reptiles Mammals Fish Other TOTAL The Great Southwest Southern Swamps Animal Category # of different types % of total Animal Category # of different types % of total Birds Birds Reptiles Reptiles Mammals Mammals Fish Fish Other Other TOTAL TOTAL 50
51 2) Using the percentages you calculated, make a pie chart for each habitat. 3) Which habitat has the highest percentage of reptiles? Which habitat has the highest percentage of birds? Which habitat has the highest percentage of mammals? 4) Is the habitat with the highest number of different types of reptiles also the habitat with the highest percentage of reptiles? If not, explain what causes the difference. 5) Which habitat(s) have no reptiles at all? Why do you think that might be? 2017 Hershey Entertainment & Resorts Company. All words, designs, and phrases appearing with the symbol, SM, or TM are trademarks used under license or with permission. 12HP
Math 110 Passports to Fun Journeys At Kennywood
 Conceived and Created by: Mike Long, Ed. D. (Math Ed.) Assistant Professor of Mathematics, Shippensburg University of PA With the Assistance of Teachers: Tina Cool, Preston High School, Kingwood WV Jodi
Physics Is Fun. At Waldameer Park! Erie, PA
 Physics Is Fun At Waldameer Park! Erie, PA THINGS TO BRING: Amusement Park Physics Bring a pencil Bring a calculator Don t forget to bring this assignment packet Bring a stop watch, a digital watch, or
Thrill U. THE PHYSICS AND MATHEMATICS OF AMUSEMENT PARK RIDES. Middle School
 Thrill U. THE PHYSICS AND MATHEMATICS OF AMUSEMENT PARK RIDES Middle School Copyrighted by Dr. Joseph S. Elias. This material is based upon work supported by the National Science Foundation under Grant
ACADEMIC ADVENTURES SCIENCE AND MATHEMATICS MIDDLE SCHOOL / HIGH SCHOOL
 ACADEMIC ADVENTURES SCIENCE AND MATHEMATICS MIDDLE SCHOOL / HIGH SCHOOL INDEX WELCOME PAGE 3 INTRODUCTION PAGE 4 HELPGFUL TERMS AND FORMULAS PAGE 5 Activity One: Potential and Kinetic Energy PAGE 6 Kingda
Math in Motion Idlewild & SoakZone Copyright
 STUDENT PACKET MATH IN MOTION Your visit to Idlewild & SoakZone is an opportunity to not only have fun, but learn about math and the use of technology throughout the park. Use our Outdoor Classroom to
ABSTRACT TIES TO CURRICULUM TIME REQUIREMENT
 ABSTRACT This lesson uses the thrill of amusement park attractions to teach students how to analyze principles of motion. The Calculator Based Laboratory helps students record and analyze acceleration
MATH & SCIENCE DAYS STUDENT MANUAL
 MATH & SCIENCE DAYS STUDENT MANUAL CONSCIOUS COMMUTING As you ride to Six Flags Great America be conscious of some of the PHYSICS on the way. A. STARTING UP THINGS TO MEASURE: As the bus pulls away from
Xcalibur. b. Where are the riders torsos nearly vertical with heads down? c. Where are the riders torsos nearly horizontal relative to the ground?
 QUALITATIVE QUESTIONS: 1. Watch the ride to see how the orientation of the riders changes. Use the pictures on this page to help you name and describe the positions of riders oriented in the following
Thinking With Mathematical Models Invs. 4.3, Correlation Coefficients & Outliers. HW ACE #4 (6-9) starts on page 96
 starts on page 96") Thinking With Mathematical Models Invs. 4.3, Correlation Coefficients & Outliers HW ACE #4 (6-9) starts on page 96 Roller coasters are popular rides at amusement parks. A recent survey counted 1,797 roller
Thinking With Mathematical Models Invs. 4.3, Correlation Coefficients & Outliers HW ACE #4 (6-9) starts on page 96 Roller coasters are popular rides at amusement parks. A recent survey counted 1,797 roller
Names of Lab Team Members. Scorpion Worksheet
 PRE-IB PHYSICS GROUP # Name: DEVIL PHYSICS Period: Date: BADDEST CLASS ON CAMPUS PHYSICS DAY AT BUSCH GARDENS General Guidelines: 1. Data collection is a group effort among your lab team. Completion of
Math in Motion Idlewild & SoakZone Copyright
 STUDENT PACKET MATH IN MOTION Your visit to Idlewild & SoakZone is an opportunity to not only have fun, but learn about math and the use of technology throughout the park. Use our Outdoor Classroom to
Year 9 Mathematics Examination SEMESTER
 STUDENT NAME: TEACHER: DATE: Year 9 Mathematics Examination SEMESTER 2 2016 QUESTION AND ANSWER BOOKLET TIME ALLOWED FOR THIS PAPER Reading time before commencing work: 10 minutes Working time for this
Seventh Grade 2003 pg. 4
 Seventh Grade 2003 pg. 4 MARS Tasks - Grade 7 Page 3 Seventh Grade 2003 pg. 14 MARS Tasks - Grade 7 Page 6 Seventh Grade 2003 pg. 15 MARS Tasks - Grade 7 Page 7 Seventh Grade 2003 pg. 30 MARS Tasks - Grade
SIX FLAGS GREAT ADVENTURE PHYSICS DAY REVIEW & SAMPLES
 DIRECTIONS: SIX FLAGS GREAT ADVENTURE PHYSICS DAY REVIEW & SAMPLES For your assignment you will answer Multiple Choice questions and Open Ended Questions. All students must do the Great American Scream
Table of Contents School Information 2 Note Page 3 Words of Physics 4 Gut Feelings at the Park 5 Helpful Formulas 6 Fun Facts 7 Heart Rate 8 Inverter
 Table of Contents School Information 2 Note Page 3 Words of Physics 4 Gut Feelings at the Park 5 Helpful Formulas 6 Fun Facts 7 Heart Rate 8 Inverter 9 Canyon Blaster 10-11 Extreme Ride Theater 12 BC Bus
Six Flags Great America (30 pts)
") Six Flags Great America (30 pts) Purpose: Procedure: (Be specific!) Data Tables: Remember that ALL measurements and calculations must be in METRIC units. You may choose to collect measurements and answer
Six Flags Great America (30 pts) Purpose: Procedure: (Be specific!) Data Tables: Remember that ALL measurements and calculations must be in METRIC units. You may choose to collect measurements and answer
Some of the numbered sections of the track are described to the right. The times correspond to a graph found on page 58.
 QUALITATIVE QUESTIONS If the track were stretch out so that it were entirely in a single plane, the profile would look like the diagram below. Some of the numbered sections of the track are described to
MIDDLE SCHOOL STEM ADVENTURES
 MIDDLE SCHOOL STEM ADVENTURES IN PARTNERSHIP WITH: 2017 EDITION WRITTEN BY: TOM PATERSON NJSPECIALEVENTS@SIXFLAGS.COM FOLLOW US - @SFGRADVENTURE JOIN THE CONVERSATION: #PHYSICSDAY1 SIX FLAGS GREAT ADVENTURE
State Fair Field Trip
 State Fair Field Trip Each student must complete this and three of the other activities at the fair to receive credit. Student Name Teacher Key Questions - Quantitative As you ride to the fair grounds
4. Compare the tangential speed of a car to the tangential speed of the middle of a spoke. Explain!
 QUALTATVE QUESTONS Highland Fling 1. Observe the Highland Fling as it is just starting to spin. How are the rider s bodies oriented relative to the spokes of the ride? 2. Continue to watch the ride as
Use It! Don t Lose It! MATH. Daily Skills Practice. Grade 5. by Pat Alvord
 Use It! Don t Lose It! MATH Daily Skills Practice Grade 5 by Pat Alvord Illustrated by Kathleen Bullock Cover by Geoffrey Brittingham Edited by Marjorie Frank and Jill Norris Copy edited by Steve Carlon
Spring accelerometers
 Spring accelerometers A spring accelerometer is a transparent plexiglass tube containing a small mass connected to two identical springs fixed to either end of the tube, with which we can measure the forces
Pre-Calculus AB: Topics and Assignments Weeks 1 and 2
 Weeks 1 and 2 Monday 7/30 NO SCHOOL! Tuesday 7/31 NO SCHOOL! Wednesday 8/1 Start of School Thursday 8/2 Class Policy and Expectations Lesson 5 Exponents and Radicals Complex Numbers Areas of Similar Geometric
Year 10 Mathematics Examination SEMESTER
 STUDENT NAME: TEACHER: DATE: Year 10 Mathematics Examination SEMESTER 2 2016 QUESTION AND ANSWER BOOKLET TIME ALLOWED FOR THIS PAPER Reading time before commencing work: 10 minutes Working time for this
Mr. Freeze. as viewed from the top of the ferris wheel:
 QUALITATIVE QUESTIONS Many of the questions that follow refer to the graphs of data collected when riding with high tech data collection vests. With your I.D., you can borrow a vest without charge just
MAT 115: Precalculus Mathematics Homework Exercises Textbook: A Graphical Approach to Precalculus with Limits: A Unit Circle Approach, Sixth Edition
 MAT 115: Precalculus Mathematics Homework Exercises Textbook: A Graphical Approach to Precalculus with Limits: A Unit Circle Approach, Sixth Edition Section R.1, Page 923: Review of Exponents and Polynomials
Amusement Park Physics. Amusement Park PHYSICS. PHYSICS and SCIENCE DAY 2013 Science 10
 Amusement Park PHYSICS PHYSICS and SCIENCE DAY 2013 Science 10 These educational materials were created by Science Plus. Illustrations, typesetting and layout by Robert Browne Graphics. For more information
5. Compare the tangential speed of a car to the tangential speed of the middle of a spoke. Explain!
 Name: QUALTATVE QUESTONS Partner: 1. As riders sit in the stationary Highland Fling, at what angle are the rider s bodies oriented relative to the spokes of the ride? (A diagram might help) Teacher: Highland
The Niagara SkyWheel Teacher Resource Guide Grades 9-12
 The Niagara SkyWheel Teacher Resource Guide Grades 9-12 Welcome to The Niagara SkyWheel! Arrival and Entry Please allow ample time for parking and obtaining tickets. Safety To have the best adventure possible,
Thrill U. THE PHYSICS AND MATH OF AMUSEMENT PARK RIDES. Algebra
 Thrill U. THE PHYSICS AND MATH OF AMUSEMENT PARK RIDES Algebra Copyrighted by Dr. Joseph S. Elias. This material is based upon work supported by the National Science Foundation under Grant No. 9986753.
The Case of the Stolen CD Players
 Detective Curious got a lead on some missing compact CD players she was investigating. The informer hinted that the stolen CD players (and maybe even the culprit) could be found in an abandoned warehouse
Pre-lab questions: Physics 1AL CONSERVATION OF MOMENTUM Spring Introduction
 Introduction You have a summer job at Amtrak with a group examining the crash between two trains. Your supervisor wants you to calculate the results of two different cases. The first is a perfectly inelastic
GRAAD 12 NATIONAL SENIOR CERTIFICATE GRADE 12
 GRAAD 12 NATIONAL SENIOR CERTIFICATE GRADE 12 MATHEMATICAL LITERACY P2 NOVEMBER 2012 MARKS: 150 TIME: 3 hours This question paper consists of 15 pages and 3 annexures. Mathematical Literacy/P2 2 DBE/November
Polynomial Roller Coaster
 Math Objectives Students will determine and analyze a polynomial model for a section of roller coaster track. Students will utilize translations to adjust their model to fit various criteria. Students
Real World Performance Tasks
 Real World Performance Tasks Real World Real Life, Real Data, Real- Time - These activities put students into real life scenarios where they use real- time, real data to solve problems. In the Coaster
IMPETUS: Engineering Workbook Model Roller Coaster Competition
 IMPETUS: Engineering Workbook Model Roller Coaster Competition School and Team Information This information can be completed at any time before the roller coaster competition School Name: Coach s Name:
Physics Activity Guide
 Physics Activity Guide 2 TABLE OF CONTENTS Earthbound Astronauts 3 Mechanics of Motion 4 Angles and Arcs 5 Angles and Arcs II 6 Viking Voyager 7 Bamboozler 8 Zulu 9 Finnish Fling 10 Autobahn 11 Scrambler
Egg-streme Parachuting Flinn STEM Design Challenge
 Egg-streme Parachuting Flinn STEM Design Challenge 6 07, Flinn Scientific, Inc. All Rights Reserved. Reproduced for one-time use with permission from Flinn Scientific, Inc. Batavia, Illinois, U.S.A. No
Math at the Amusement Park
 Your Assignment: Math at the Amusement Park Your math teacher has decided to sponsor a class field trip to an amusement park. Your task is to research information about the prices and other amenities that
Motion 2. 1 Purpose. 2 Theory
 Motion 2 Equipment Capstone, motion sensor, meter stick, air track+ 2 gliders, 2 blocks, and index cards. Air Tracks In this experiment you will be using an air track. This is a long straight triangular
SLOPE CALCULATION. Wilderness Trekking School 1
 SLOPE CALCULATION By Joe Griffith, February 2014 Objectives Upon completion of this chapter, you will be able to: Read the rise-over-run from a topographic map. Convert the rise-over-run into a slope angle
ROLLER COASTER POLYNOMIALS
 Math 3 Honors ROLLER COASTER POLYNOMIALS (PART 1: Application problems small group in class) (PART 2: Individual roller coaster design) Purpose: In real life, polynomial functions are used to design roller
Physics Fun: THE INVESTIGATIONS! The Study of Mechanics, Energy, Force & Motion
 Physics Fun: THE INVESTIGATIONS! The Study of Mechanics, Energy, Force & Motion Investigation #1: Zoomerang Coaster Mass of each car = 1500 pounds or 680 kg Number of cars = 7 Maximum Height = 36.91 meters
Six Flags Great Adventure Physics Packet
 Great Adventure Packet 1 Six Flags Great Adventure Physics Packet Groups Members with Physics teacher s name: Great Adventure Packet 2 Equations Kinematics v = d/t v f = v i + at d = v i t + ½ at 2 v f
o " tar get v moving moving &
 Introduction You have a summer job at Amtrak with a group examining the crash between two trains. Your supervisor wants you to calculate the results of two different cases. The first is a perfectly inelastic
CHAPTER 4: PERFORMANCE
 CHAPTER 4: PERFORMANCE Soaring is all about performance. When you are flying an aircraft without an engine, efficiency counts! In this chapter, you will learn about the factors that affect your glider
4. Compare the tangential speed of a car to the tangential speed of the middle of a spoke. Explain!
 QUALTATE QUESTONS Highland Fling 1. Observe the Highland Fling as it is just starting to spin. How are the rider s bodies oriented relative to the spokes of the ride? 2. Continue to watch the ride as it
Six Flags. Great. Adventure. Physics. Packet
 Great Adventure Packet 0 Six Flags Great Adventure Physics Packet Groups Members - Physics teacher s name: Great Adventure Packet 1 MAKING MEASUREMENTS AND CALCULATING ANSWERS Most measurements can be
Six Flags. Great. Adventure. Physics. Packet
 Great Adventure Packet 0 Six Flags Great Adventure Physics Packet Groups Members - Physics teacher s name: Great Adventure Packet 1 Equations Kinematics v = d/t v f = v i + at d = v i t + ½ at 2 v f 2
MiSP Topographic Maps Worksheet #1a SLOPE AND TOPOGRAPHIC CONTOURS
 MiSP Topographic Maps Worksheet #1a Name Date Introduction: SLOPE AND TOPOGRAPHIC CONTOURS Topographic contours are shown by lines of different widths. Each contour is a line of equal elevation; therefore,
5.2 Angular Motion. Motion and Force. Objective. Materials. Introduction /// TEACHER ALERT /// Directed Instruction. Content
 5.2 Angular Motion Motion and Force Objective Students will define angular motion and distinguish between rotational and periodic motion. Materials Blackline Master 5.2A Discover: Amusement Parks Blackline
Physics and Astronomy Night At Elitch Gardens
 Physics and Astronomy Night At Elitch Gardens This curriculum book is developed by: Accelerate into your future in science! www.du.edu/physastron Welcome to Physics and Astronomy Night at Elitch Gardens!
Aim: What is the Height and Co-Height functions of a Ferris Wheel?
 Do Now: Suppose a Ferris wheel has a radius of 50 feet. We will measure the height of a passenger car that starts in the 3 o clock position with respect to the horizontal line through the center of the
MEASUREMENT OF ACCELERATION Pre-Lab. Name: Roster#
 MEASUREMENT OF ACCELERATION Pre-Lab Name: Roster# Date: 1. A tree is 15.0 m high and cast a shadow along the ground that is 30.0 m long. Draw a triangle that represents this situation. What angle does
Table of Contents. page 4. Student Resources. page 6. Park Map. Ride Packet Student Worksheets. pages Group Activities.
 10:10 AM L O O H C S E L D MID K O O B K R O TW STUDEN 5 19, 26 1, 2 1, 5 Y A,M APRIL 28 Table of Contents page 4 Student Resources page 6 Park Map pages 7 38 pages 39 43 Group Activities pages 44 45 Rainy
Grade 6 Sample Items
 Grade 6 Sample Items 1. Which ordered pair is a solution of y = x + 4? A. (0, 0) B. (5, 54) C. (7, 28) D. (9, 13) 2. Which of the following is equivalent to? A. 40% B. 0.8 C. 0.4 D. 8% 3. Tony ate dinner
Amusement Park Physics. Amusement Park. Physics. PHYSICS and SCIENCE DAY 2010 Physics 11/12
 Amusement Park Physics PHYSICS and SCIENCE DAY 2010 Physics 11/12 These educational materials were created by Science Plus. Illustrations, typesetting and layout by Robert Browne Graphics. For more information
K/U T/I RevIew Knowledge For each question, select the best answer from the four alternatives. K/U K/U
 CHAPTER 3 Review K/U Knowledge/Understanding T/I Thinking/Investigation C Communication A Application Knowledge For each question, select the best answer from the four alternatives. 1. Which of the following
by Judith A. Muschla and Gary Robert Muschla
 by Judith A. Muschla and Gary Robert Muschla New York Toronto London Auckland Sydney Mexico City New Delhi Hong Kong Buenos Aires Dedication For Erin Scholastic Inc. grants teachers permission to photocopy
Students will make a brochure for their own amusement park. They create rides and complete tasks on the inequalities they have learned about.
 Inequalities is a new topic to grade 6 because of the new common core. Test your students knowledge of inequalities using this creative summative performance assessment. Use it as an inequality test or
MiSP Topographic Maps Worksheet #1a L2
 MiSP Topographic Maps Worksheet #1a L2 Name Date SLOPE AND TOPOGRAPHIC CONTOURS Introduction: Topographic contours are shown by lines of different widths. Each contour is a line of equal elevation; therefore,
Table of Contents. page 4. Student Resources. page 6. Park Map. Ride Packet Student Worksheets. pages Group Activities.
 10:10 AM L HIGH SCHOO K O O B K R O TW STUDEN 5 19, 26 1, 2 1, 5 Y A,M APRIL 28 Table of Contents page 4 Student Resources page 6 Park Map pages 7 45 pages 46 49 Group Activities pages 50 52 Rainy Day
University of Colorado, Colorado Springs Mechanical & Aerospace Engineering Department. MAE 4415/5415 Project #1 Glider Design. Due: March 11, 2008
 University of Colorado, Colorado Springs Mechanical & Aerospace Engineering Department MAE 4415/5415 Project #1 Glider Design Due: March 11, 2008 MATERIALS Each student glider must be able to be made from
2. In terms of forces, explain why Batman The Ride uses a long shallow climb up the first incline instead of a short steep one.
 QUALITATIVE QUESTIONS Batman The Ride 1. When you enter Batman The Ride, you walk the first 7.2 meters vertically to get on. What is the advantage to Six Flags St. Louis of having you do this? 2. In terms
NARAM-52 R&D Project July By Allison Van Milligan NAR # A-Division
 Comparison Of The Number Of Parachutes Versus Descent Rate NARAM-52 R&D Project July 2010 By Allison Van Milligan NAR # 88840 A-Division Page 1 Summary In this Project I compared the number of parachutes
Test Booklet. Subject: MA, Grade: 06 ISTEP Math Grade 6. Student name:
 Test Booklet Subject: MA, Grade: 06 Student name: Author: Indiana District: Indiana Released Tests Printed: Friday June 29, 2012 1 Which ordered pair is a solution of y = x + 4? A (0, 0) B (5, 54) C (7,
Math 3 Polynomials Project
 Math 3 Polynomials Project ROLLER COASTER POLYNOMIALS Application Problems and Roller Coaster Design due NO LATER THAN FRIDAY, JAN 13. Projects handed in after this date will receive a 0. Purpose: In real
Amusement Park Physics. Amusement Park PHYSICS. PHYSICS and SCIENCE DAY 2018 Physics 11/12
 Amusement Park PHYSICS PHYSICS and SCIENCE DAY 2018 Physics 11/12 These educational materials were created by Science Plus. Illustrations, typesetting and layout by Robert Browne Graphics. For more information
 Section 2 Gravitational Potential Energy and Kinetic Energy 40,000 J. This is because that was the total mechanical energy at the beginning. Mechanical energy in this case is the sum of GPE and KE. When
Volume Kuta Download or Read Online ebook volume kuta in PDF Format From The Best User Guide Database
 Volume Kuta Free PDF ebook Download: Volume Kuta Download or Read Online ebook volume kuta in PDF Format From The Best User Guide Database Worksheet by Kuta LLC Volume of Pyramids. Name. Find the volume
ALLOMETRY: DETERMING IF DOLPHINS ARE SMARTER THAN HUMANS?
 Biology 131 Laboratory Spring 2012 Name Lab Partners ALLOMETRY: DETERMING IF DOLPHINS ARE SMARTER THAN HUMANS? NOTE: Next week hand in this completed worksheet and the assignments as described. Objectives
Tool: Overbooking Ratio Step by Step
 Tool: Overbooking Ratio Step by Step Use this guide to find the overbooking ratio for your hotel and to create an overbooking policy. 1. Calculate the overbooking ratio Collect the following data: ADR
ROLLER COASTER POLYNOMIALS Due: Thursday, March 30th
 ROLLER COASTER POLYNOMIALS Due: Thursday, March 30th Purpose: In real life, polynomial functions are used to design roller coaster rides. In this project, you will apply skills acquired in Unit 3 to analyze
Physics FUN Day Sponsored by Knott's Berry Farm, Edwards Airforce Base, and Physics Teachers. Schedule of Events Thursday, February 24, 2005
 Schedule of Events Thursday, February 24, 2005 Paper Power Tower 9:00a Boardwalk Ballroo Liited to 30 teas of 1-3 students Paper Airplanes for Accuracy 10:00a Boardwalk Ballroo Liited to 60 students Edwards
Advisory Circular AC61-3 Revision 11 SUPERSEDED Define and identify, on a diagram of the earth, and explain the meaning of the following:
 Subject No 6 Air Navigation and Flight Planning Each subject has been given a subject number and each topic within that subject a topic number. These reference numbers will be used on knowledge deficiency
STEM FUTURES. Air Travel STEM. Works! Using Maths Tasks. About the Industry. About Your Task
 STEM FUTURES Using Maths Tasks STEM Works! Air Travel In these activities, you work in the aviation industry. You will need to use your mathematical skills to help your team solve some problems. About
Nickelodeon Universe Ride Science
 Nickelodeon Universe Ride Science ACTIVITY PACKET TABLE OF CONTENTS Learning Goals and Objectives p. 2 Guide Book to Ride Science Activities @ Nickelodeon Universe p. 3 Avatar AirBender activities/questions
LAB 5-2 ENERGY CONSERVATION
 NAME: PERIOD: LAB 5-2 ENERGY CONSERVATION QUESTION: What is energy and how does it behave? In this investigation, you will: 1. Discover the relationship between speed and height on a roller coaster. 2.
Table Of Contents. Copyright Canobie Lake Park
 Table Of Contents Fun Facts Page 3 Park Map Page 6 Formulas & Conversions Page 7 Energized Page 8 Loop the Loop Page 10 Spinning Out of Control Page 12 How Far Is That Again Page 15 Inanimate Animation
INVENT IT! George Washington Gale Ferris invented THE FIRST FERRIS WHEEL INVENT IT!
 INVENT IT! Grade level: Late elementary Estimated time: Seven class periods Topic: The Ferris wheel of the World s Columbian Exhibition of 1893 Subtopic: Number conversions from English to the Metric system
27th ANNUAL AMUSEMENT PARK PHYSICS TEST. Wednesday, May 14, and. Tuesday, May 20, 2014
 27th ANNUAL AMUSEMENT PARK PHYSICS TEST Wednesday, May 14, 2014 and Tuesday, May 20, 2014 at ED HENKE PHYSICS TEACHER-RETIRED PITTSBURGH PUBLIC SCHOOLS 2013 KENNYWOOD PHYSICS TEST ED HENKE 2013 PAGE 1
GRADE 11 PHYSICS TABLE OF CONTENTS. In-School Preparation page 2. Amusement Ride Activities - Graphing page 22
 GRADE 11 PHYSICS TABLE OF CONTENTS In-School Preparation page 2 Amusement Ride Activities - Graphing page 22 Amusement Ride Activities Energy page 71 Other Activities page 107 Answer Key page 112 CANADA
Scale Drawing of Roller Coaster
 Scale Drawing of Roller Coaster Worksheet #4 Name Directions: Below is a scale drawing of a portion of the Millennium Force, a roller coaster located in Cedar Point Amusement Park in Ohio. Answer the questions
MATH & SCIENCE OUTDOOR CLASSROOM WORKBOOK
 MATH & SCIENCE OUTDOOR CLASSROOM WORKBOOK QUESTIONS FOR GRADES 6-12 1 To the Teacher The Outdoor Classroom can be an exciting and educational time for students. Make the most of the instructional opportunities
Using Cuisenaire Rods. Geometry & Measurement
 Using Cuisenaire Rods Geometry & Measurement Table of Contents Introduction Exploring ith Cuisenaire Rods 2 Ho Lessons Are Organized 4 Using the Activities 6 Lessons Cover the Camel Counting, Area, Spatial
Wingsuit Design and Basic Aerodynamics 2
 WINGSUIT DESIGN AND BASIC AERODYNAMICS 2 In this article I would like to expand on the basic aerodynamics principles I covered in my first article (Wingsuit Flying Aerodynamics 1) and to explain the challenges
THE THRILL SEEKER S GUIDE TO EDUCATION
 KENTUCKY KINGDOM / EDUCATION IN MOTION 2 THE THRILL SEEKER S GUIDE TO EDUCATION If you ve been searching for the fastest, the biggest, and the most enlightening educational experience around, your quest
Safety Analysis of the Winch Launch
 Safety Analysis of the Winch Launch Trevor Hills British Gliding Association and Lasham Gliding Society ts.hills@talk21.com Presented at the XXVIII OSTIV Congress, Eskilstuna, Sweden, 8-15 June 26 Abstract
GRADE 7 & 8 SCIENCE TABLE OF CONTENTS. Amusement Ride Activities page 22. Park Exploration page 71. Consumer Survey page 71
 GRADE 7 & 8 SCIENCE TABLE OF CONTENTS In-School Preparation (includes Curriculum Correlations) page 2 Amusement Ride Activities page 22 Park Exploration page 71 Consumer Survey page 71 Building Project
[ROLE PLAYING: OPTIMIZATION] ( A WORKSHEET ON SECTION 4.6 ) (Due Friday 3/11)
![[ROLE PLAYING: OPTIMIZATION] ( A WORKSHEET ON SECTION 4.6 ) (Due Friday 3/11)](/thumbs/81/84516536.jpg "[ROLE PLAYING: OPTIMIZATION] ( A WORKSHEET ON SECTION 4.6 ) (Due Friday 3/11)") [ROLE PLAYING: OPTIMIZATION] ( A WORKSHEET ON SECTION 4.6 ) (Due Friday 3/11) SCENARIO I Role: Adventurer/Rancher/Hero of time Problem: You want to enclose a rectangular plot of land so that your horse,
[ROLE PLAYING: OPTIMIZATION] ( A WORKSHEET ON SECTION 4.6 ) (Due Friday 3/11) SCENARIO I Role: Adventurer/Rancher/Hero of time Problem: You want to enclose a rectangular plot of land so that your horse,
Authentic Assessment in Algebra NCCTM Undersea Treasure. Jeffrey Williams. Wake Forest University.
 Undersea Treasure Jeffrey Williams Wake Forest University Willjd9@wfu.edu INTRODUCTION: Everyone wants to find a treasure in their life, especially when it deals with money. Many movies come out each year
Outdoor Education Worksheets
 Outdoor Education Worksheets OUTDOORS You will need: First Aid Kit Appropriate clothing for whole group (sunny/wet weather) Charged mobile phones and appropriate numbers of adult helpers in case of group
DO NOT DRAW A PIE CHART.
 GENERAL Time allowed 55 minutes 2004 aper 2 CALCULATOR ALLOWED 1 100 grams of wholemeal bread contain the following: rotein Carbohydrates Fibre Fat Other 10 grams 55 grams 9 grams 3 grams 23 grams A pie
According to FAA Advisory Circular 150/5060-5, Airport Capacity and Delay, the elements that affect airfield capacity include:
 4.1 INTRODUCTION The previous chapters have described the existing facilities and provided planning guidelines as well as a forecast of demand for aviation activity at North Perry Airport. The demand/capacity
Roller Coasters! PRE READING TASK. Physics Gr11A
 Name: Class: Date: Roller Coasters! Grade 11A Science Related Reading/Physics Physics Gr11A A cat jumps over a fence. How does the dog s potential energy change on the way up? How does the dog s potential
Outdoor Education Days Student Workbook
 Outdoor Education Days Student Workbook Name: School: Class: Teacher: Date: 1 P age Wild Waves Theme & Water Park Word Search R E V I R Y Z A L F D M C O A W L T Z U I T A O B S Z K N R U M L C I E S H
A Rope, a Goat, a Shed, and a Silo
 A Rope, a Goat, a Shed, and a Silo by: Joshua Wood Problem: Grazing area. Farmer Jones had a goat on a tether. He tied the end of the tether not attached to the goat to a stake in a field. Over what area
Kuta Software Percent Of Change Answer Key
 Kuta Percent Of Change Answer Key Free PDF ebook Download: Kuta Percent Of Change Answer Key Download or Read Online ebook kuta software percent of change answer key in PDF Format From The Best User Guide
Natural Selection and Ring Gliders
 Natural Selection and s Introduction: The purpose this lab is to use paper aircraft to model the process natural selection. A basic understanding aircraft design is not necessary to complete this lab but
Geomorphology. Glacial Flow and Reconstruction
 Geomorphology Glacial Flow and Reconstruction We will use simple mathematical models to understand ice dynamics, recreate a profile of the Laurentide ice sheet, and determine the climate change of the