GEOGRAPHY OF THE UNITED STATES & CANADA. By Brett Lucas
|
|
|
- Gervase Blankenship
- 6 years ago
- Views:
Transcription


1 GEOGRAPHY OF THE UNITED STATES & CANADA By Brett Lucas
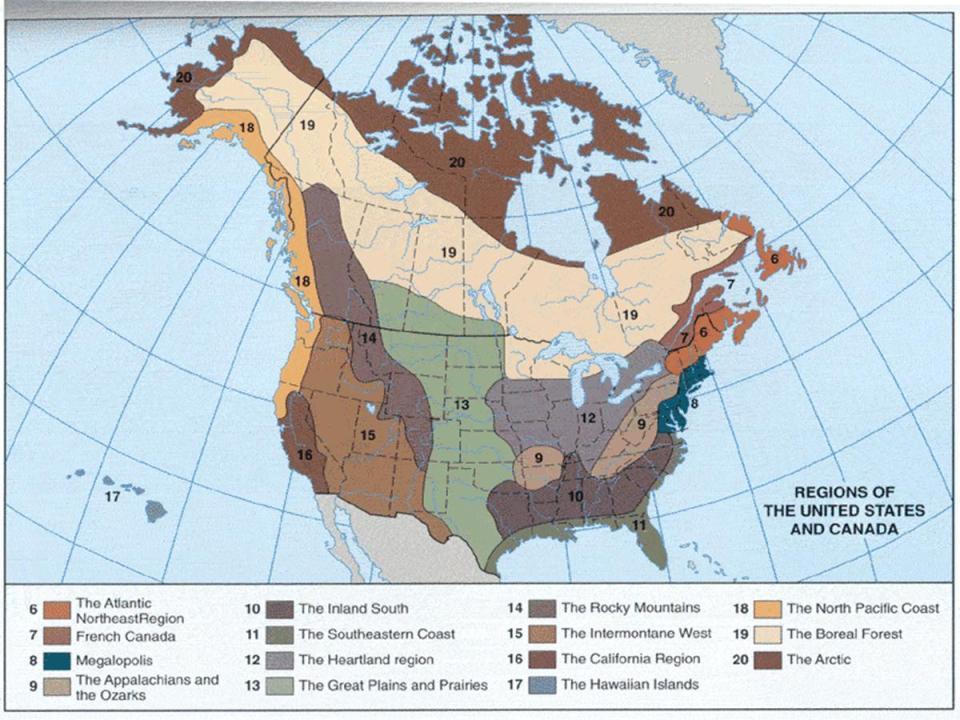
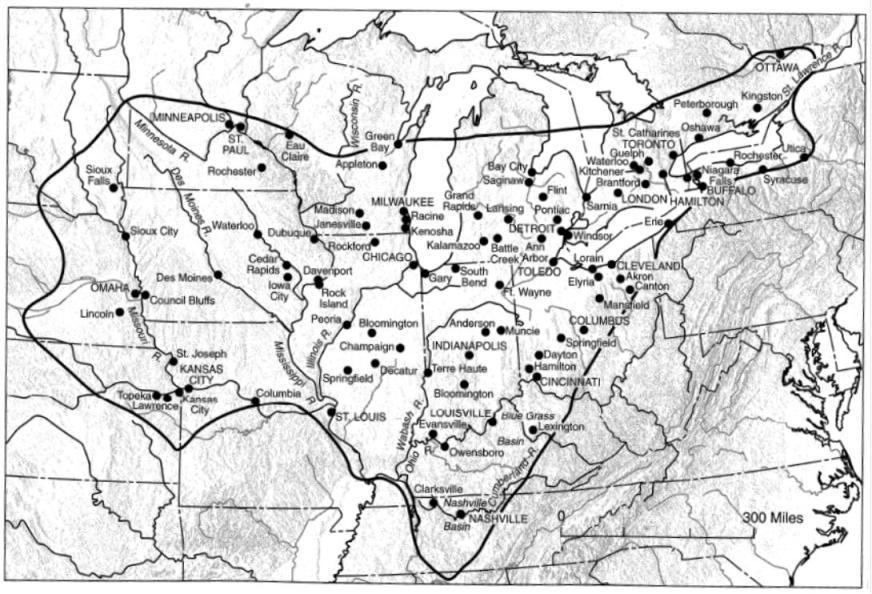
2 THE HEARTLAND REGION
3
4 Setting the Boundaries What states and provinces are part of the region? Parts of SD, NE, KS, MN, WI, MI, Ontario, NY, KY, TN, and MO. All of IA, IL, IN, and most of OH What regions does it border? Great Plains, Inland South, and Appalachians / Ozarks, Boreal Forest, French Canada, Atlantic Northeast
5
6 Overview Relatively flat area Most populated region Generally culturally homogeneous: average North American Agricultural and industrial core areas

7
8 Physical Geography

9 Physical Setting Flat to and undulating (rise and fall) landscape. Some bluffs. Differentiated between glaciated and unglaciated landscapes. Glaciers dramatically smoothed landscape, improved soil.

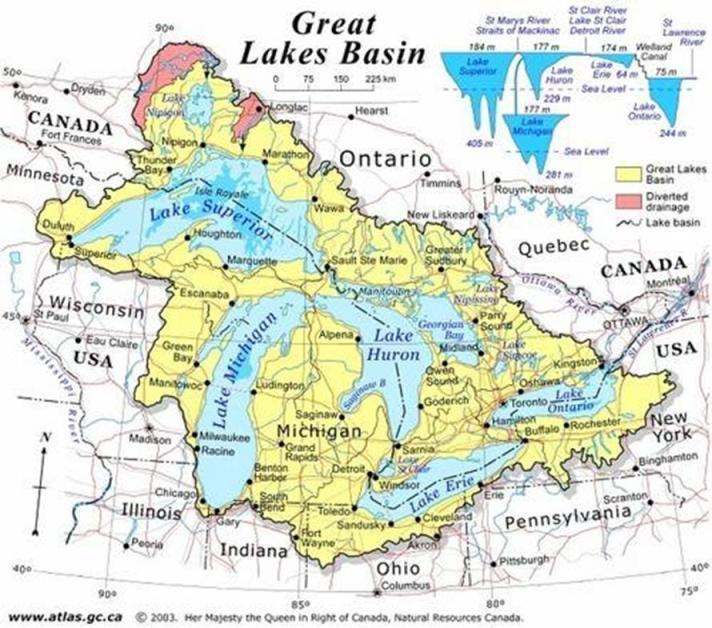
10 Great Lakes (1) Large and small lakes Evidence of glaciation.
11 Till Plains(3,4) Flat areas with significant glacial sediment deposits More time passed since last glacial retreat, so better drained (fewer lakes)
12 Unglaciated areas (2,5,6) Driftless Area (2) Rough terrain Osage Plateau (5) Very flat sedimentary rock Interior low plateaus (6) Rolling hills River valleys
13
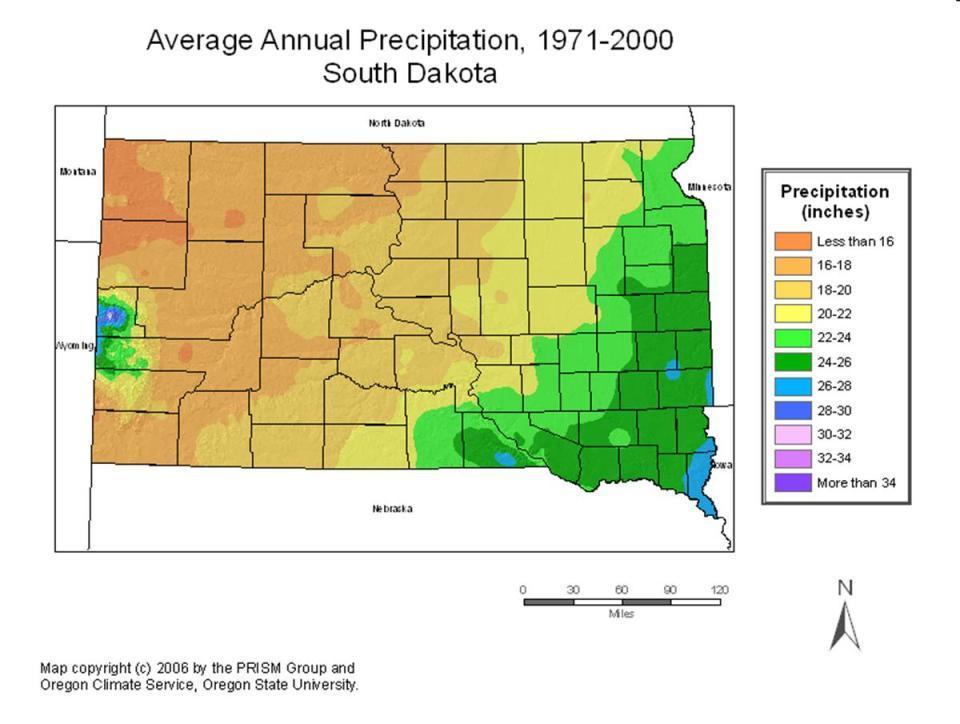
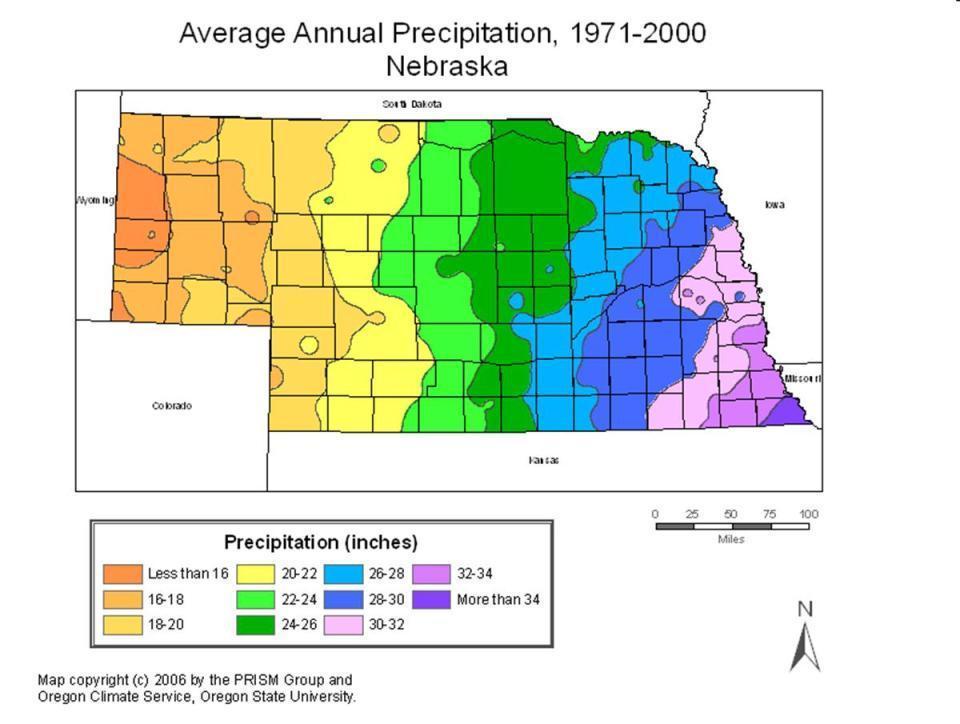
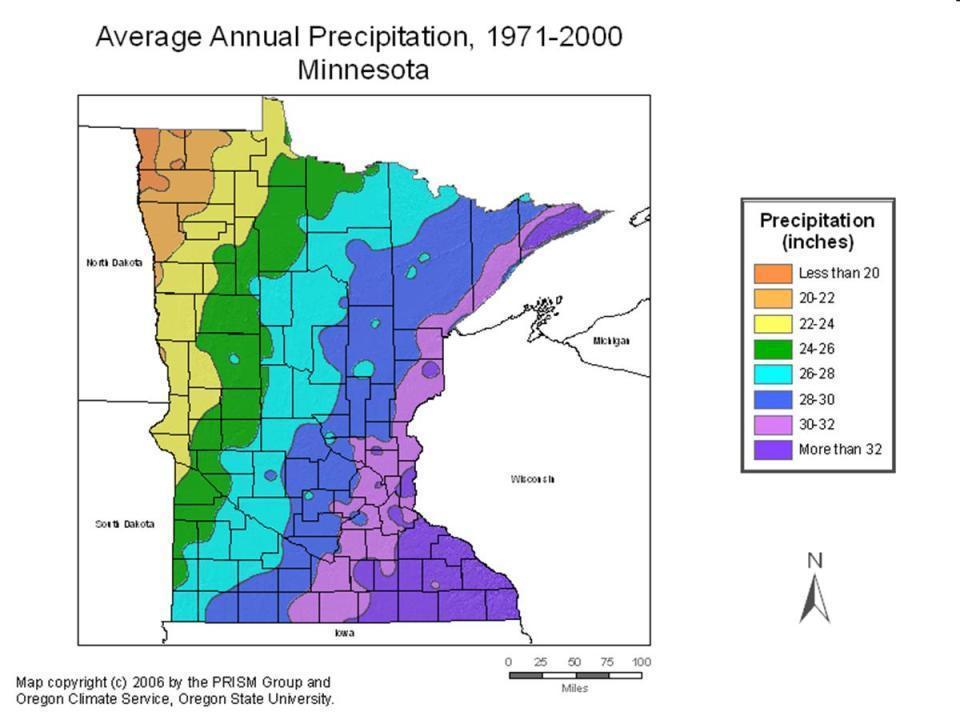
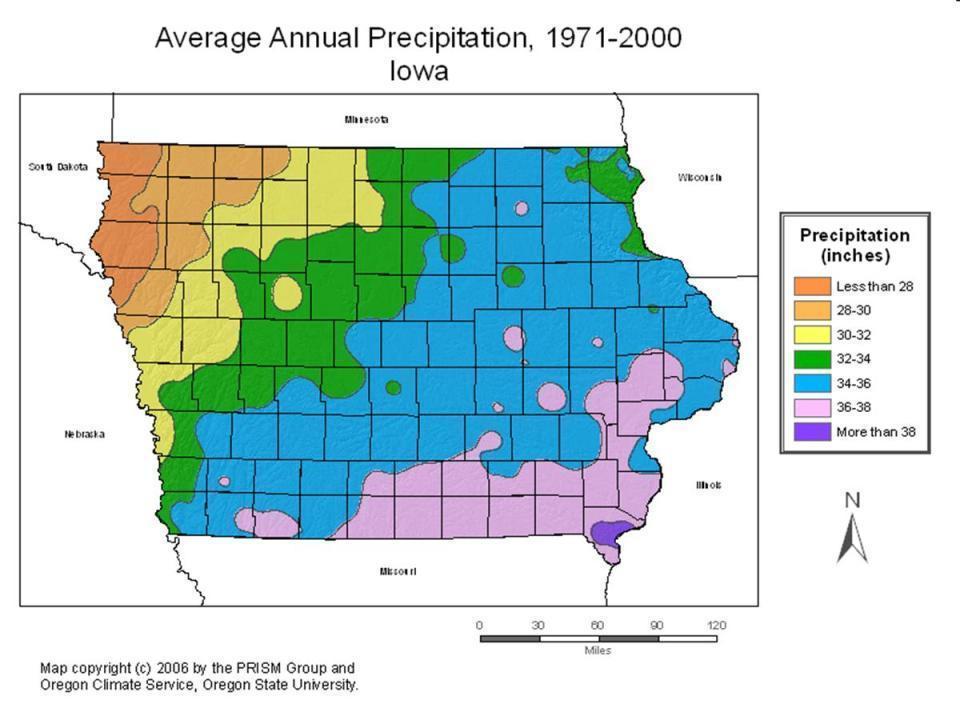
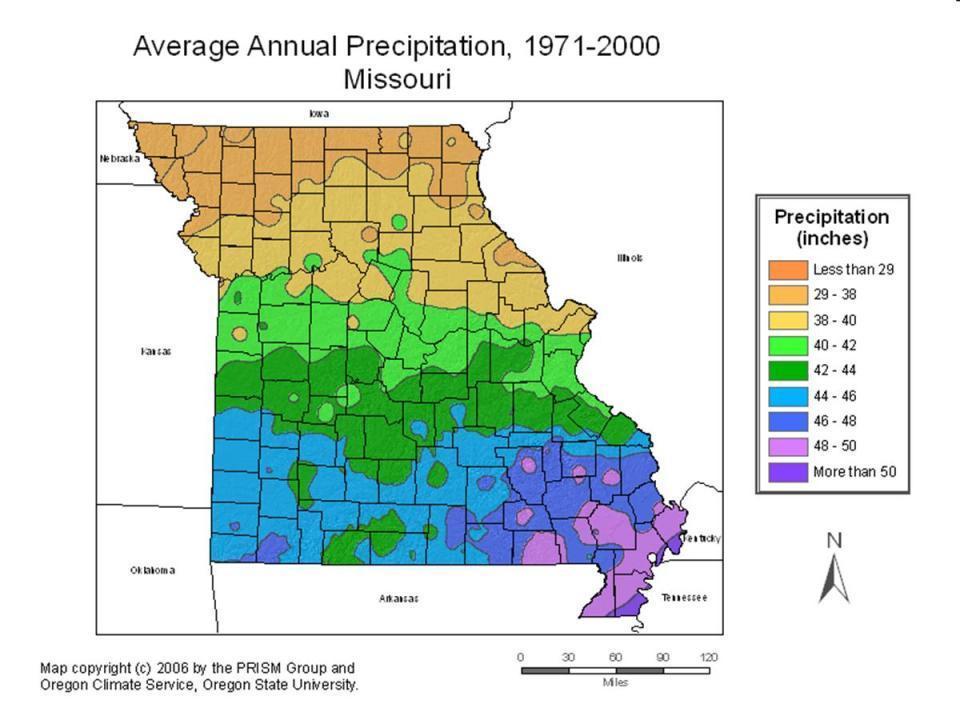
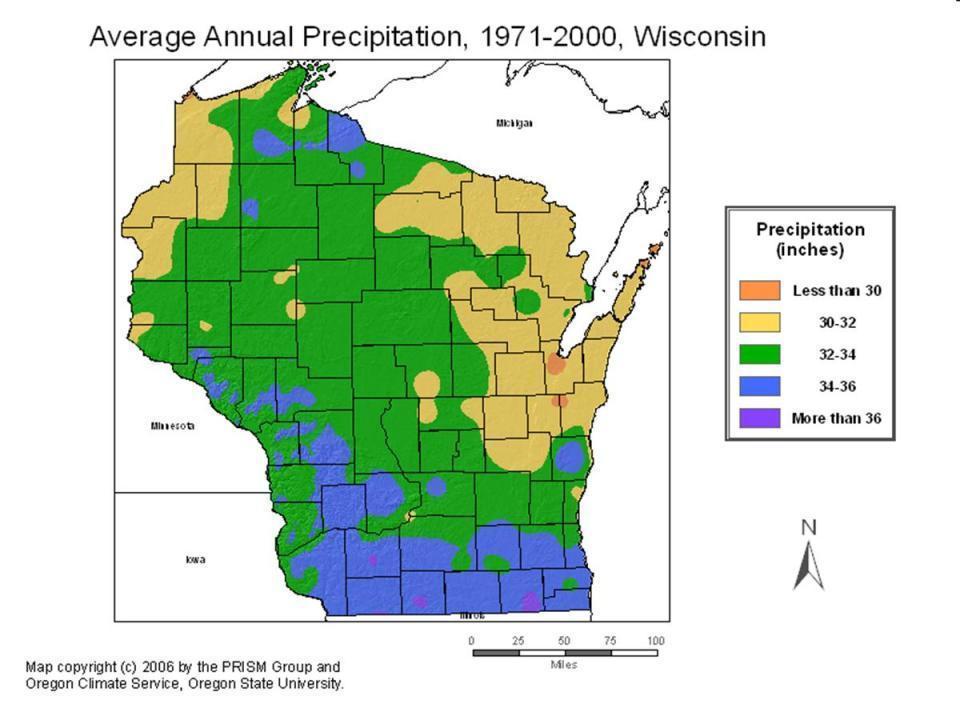
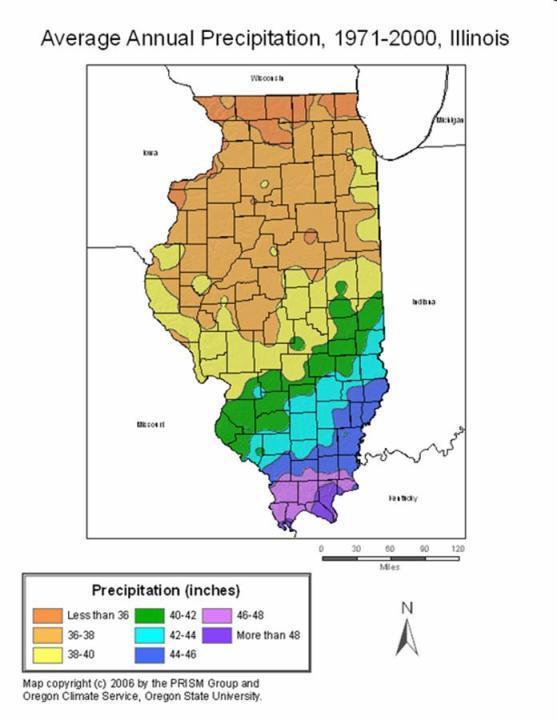
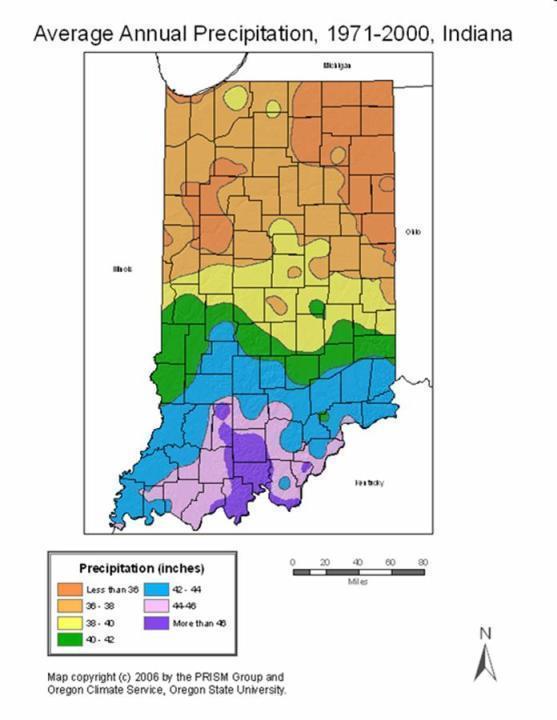
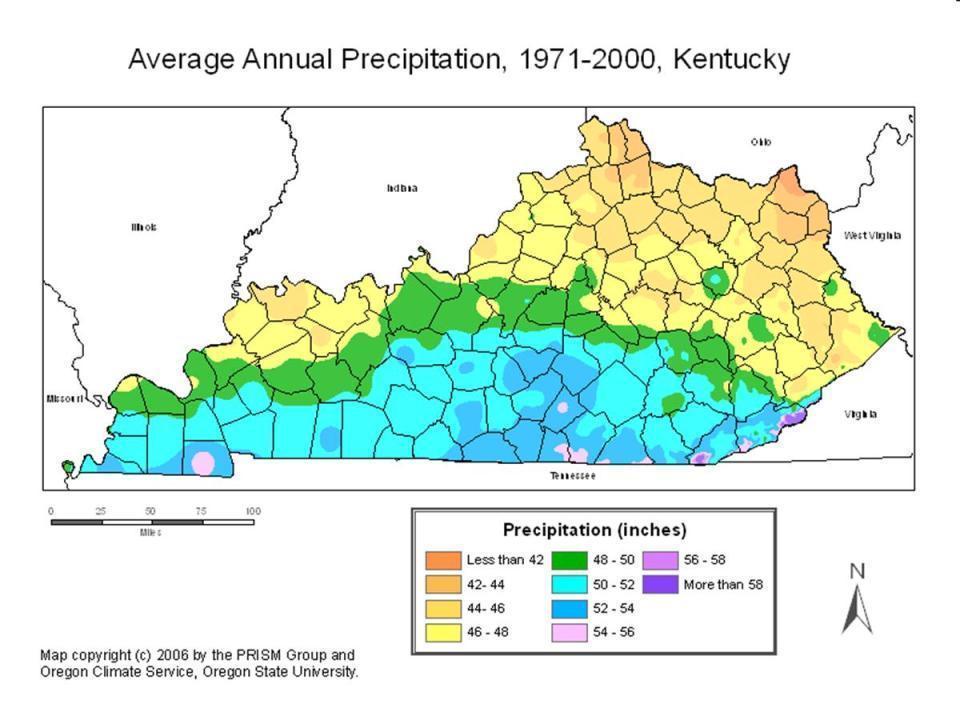
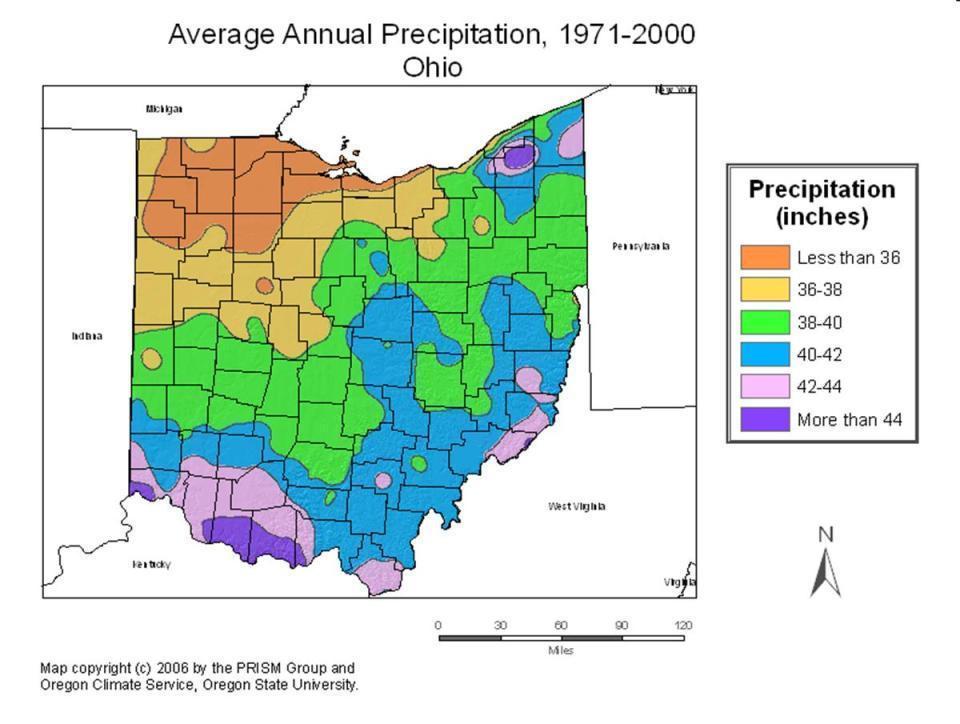
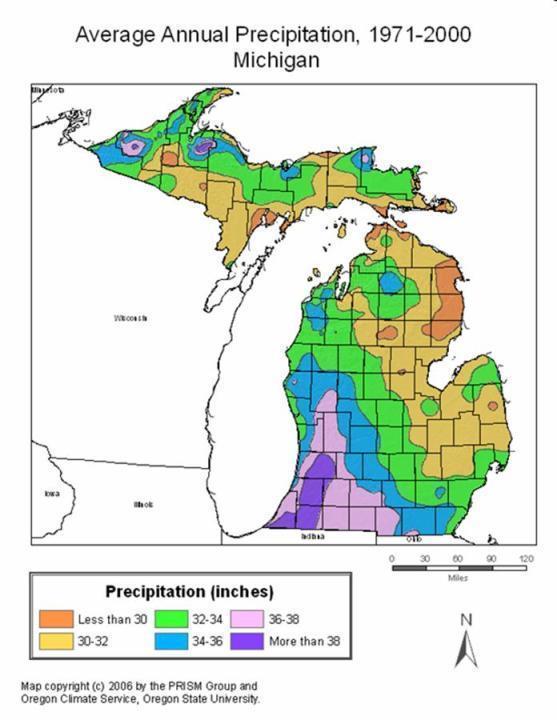
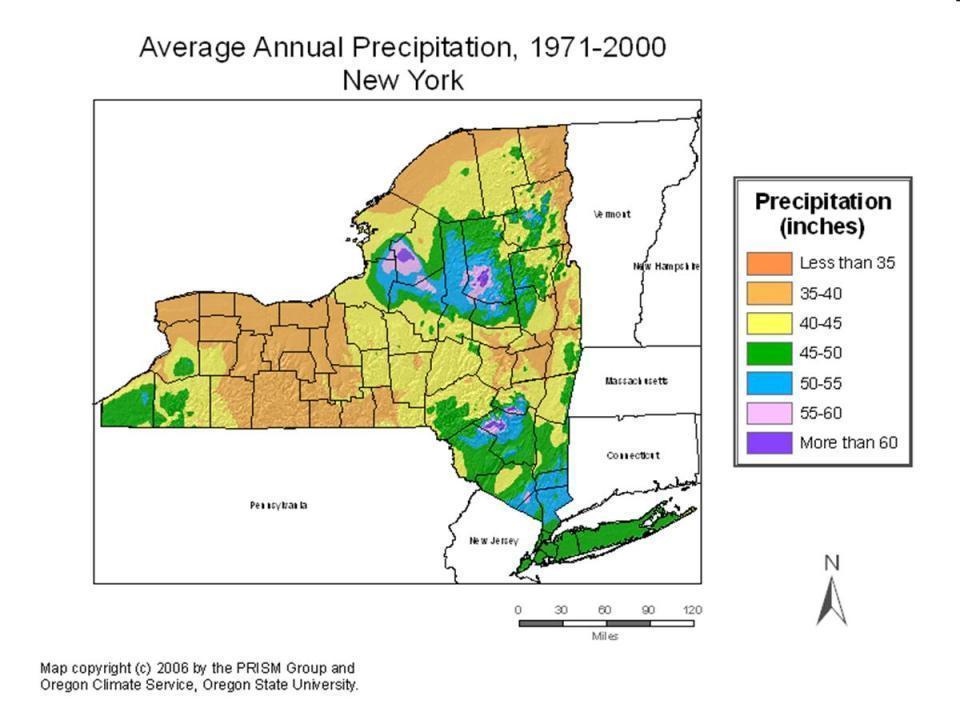
14 Climate Significant seasonal shifts Wetter west, drier east Snow common, especially north Flooding common, especially Mississippi River Valley Severe weather, especially in spring
15
16 Climograph Sioux Falls, SD
17
18 Climograph Lincoln, NE
19
20 Climograph Minneapolis, MN
21
22 Climograph Des Moines, IA
23
24 Climograph Kansas City, MO
25 Climograph St. Louis, MO
26
27 Climograph Green Bay, WI
28 Climograph Madison, WI
29
30 Climograph Chicago, IL
31 Climograph Springfield, IL
32
33 Climograph Indianapolis, IN
34

35 Climograph Louisville, KY
36 Climograph Lexington, KY
37
38 Climograph Columbus, OH
39
40 Climograph Muskegon, MI
41 Climograph Detroit, MI
42
43 Climograph Buffalo, NY

44 Lake Effect Snow Lake-effect snow is produced in the winter when cold, Arctic winds move across long expanses of warmer lake water, providing energy and picking up water vapor which freezes and is deposited on the lee shores.
45 Climate Comparison Spokane WA Buffalo NY Minneapolis MN Louisville KY Jan Temp (F) 33 / / / 2 41 / 24 Jul Temp (F) 82 / / / / 68 Rainfall 16.5 in. 38 in. 26 in. 44 in. Snowfall 49 in. 92 in. 49 in. 17 in.
46 Landscape Prairie originally from Illinois westward Mostly grasses, some smaller trees Forests elsewhere Conifers near the northern edge Hardwoods elsewhere
47 Population & Settlement

48 Early Settlement Native presence 10,000 years Fairly spread out, mostly somewhat sedentary Mound Builders
49 French Exploration Sought fur trade Colonized through St. Lawrence and Mississippi Rivers Early settlement around 1700, near Detroit and in Illinois St. Louis (1764)
50 British / American Original Native reserve Late 1780 s: American settlement began in earnest
51 Westward Expansion Following the War of 1812, most natives sent west of the Mississippi River. Cleveland: 1796, Chicago: 1817, Milwaukee: 1840, Kansas City: Once Great Plains settled, westward migration focused there and much of the boom in this region subsided.
52 Direct Migration To Heartland increased after around 1880 Many northern and eastern Europeans Minnesota: Scandinavians, Norwegians Milwaukee, Germans Cleveland: Germans, Slovenians
53 Present Population Some urban areas experiencing decent growth Minneapolis/St. Paul (17%), Madison (16%), Indianapolis (16%), Nashville (25%) Others not St. Louis (4%), Cleveland (3%), Detroit (5%), Toledo (0%) Very rapid growth in Canada Especially around Toronto and Ottawa
54 Population Numbers State/Metro area 2000 (1,000 s) 1990 (1,000 s) Change Ohio 11,353 10,847 +5% Michigan 9,923 9,295 +7% Indiana 6,080 5, % Illinois 12,419 11,430 +9% Iowa 2,926 2,776 +5% Kentucky 4,041 3, % Missouri 5,595 5,117 +9% Wisconsin 5,363 4, % Minnesota 4,919 4, % Toronto 2,481 2,275 +9% US & Canada 312, , %

55 Population Density SD

56 Population Density NE

57 Population Density MN

58 Population Density IA

59 Population Density MO

60 Population Density WI

61 Population Density IL

62 Population Density IN

63 Population Density KY

64 Population Density OH

65 Population Density MI

66 Population Density NY
67 Human & Economic Geography
68 Agriculture #1 producer of crops on continent Half of US agricultural employment is in the Heartland Farm size increasing, farm population decreasing
69
70 Corn Half of the world s output Perfect conditions Productivity increased over time Genetic and technological improvements means crop rotation not necessary
71
72 Soybeans Almost identical region to corn High yield per acre Increased dramatically in 20th century US now produces 50% of world crop All Canadian soybeans are grown north of Lake Erie
73
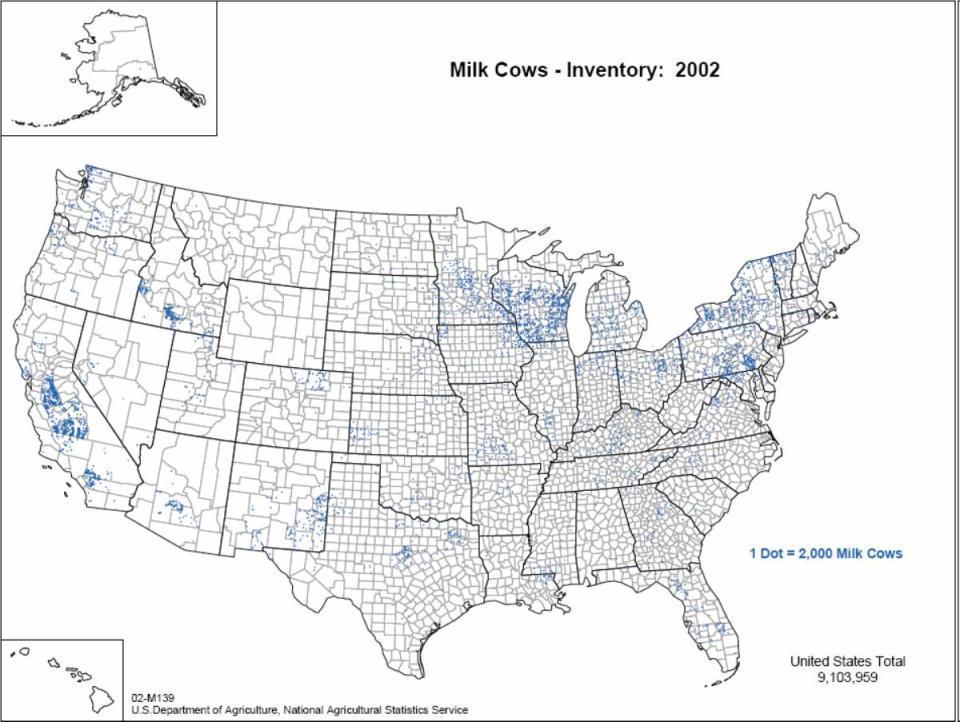
74 Livestock Beef Cattle More in western Heartland, older prairie Dairy Cattle Wisconsin, Minnesota, western New York Areas less suited for agriculture Hogs Losing importance to southern states
75
76
77
78 Mineral Industries Relatively lesser importance Some coal, natural gas, oil Illinois, Kentucky, S. Indiana, parts of Ohio 10% of US coal output Limestone Indiana
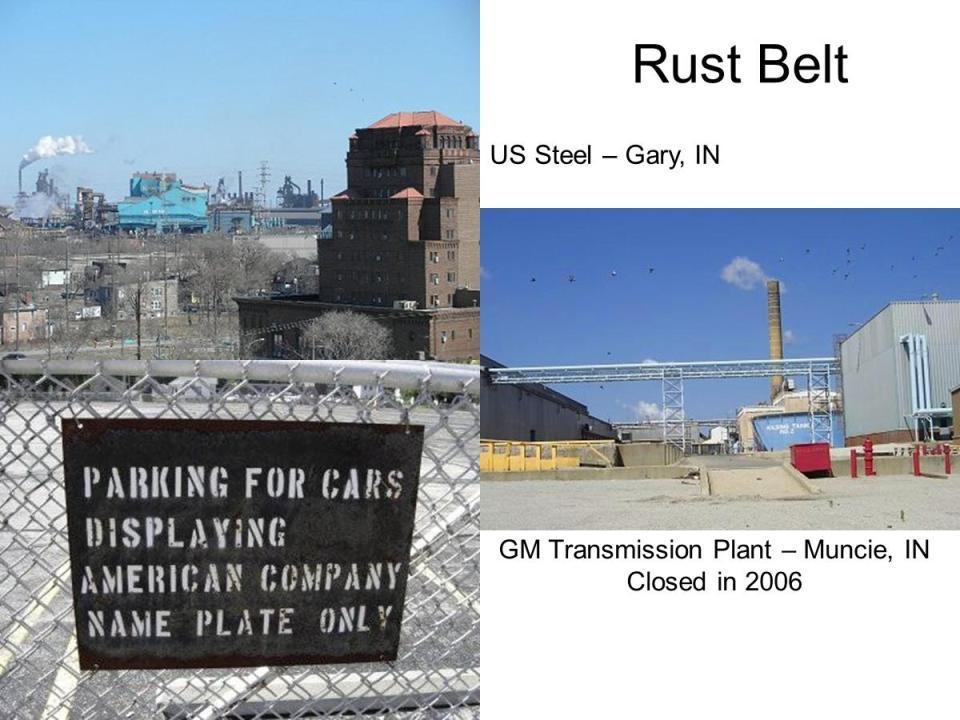
79 Manufacturing Next to agriculture, mainstay of Heartland In severe decline across Midwest Most cities with some specialization Cars in Detroit Rubber in Akron Beer in Milwaukee

80
81 Auto Industry Largest employer in the Heartland 22% of Michigan's workforce (44.7B in wages) 11% of Ohio s workforce 10% of Kentucky s workforce All top-10 states are in this region, except California, though many jobs moved south 90% of Canadian auto jobs are in Ontario (Windsor #1)
82

83 Steel Industry 4 of top states: IL, IN, OH and MI Hamilton, Ontario, main steel center Significant decline due to foreign competition
84

85 Rubber/Plastics Industry Ohio #1 state (100,000 workers) 1/3rd of nations rubber/plastics machinery Michigan #3, Illinois #4 Shift over time from tire manufacturing to specialized rubber / plastics products

86 Transportation Important in original settlement Great Lakes/St. Lawrence Ohio/Missouri/Mississip pi Rivers Flat terrain makes transportation easy Strategic location near center of country and population base makes region vital

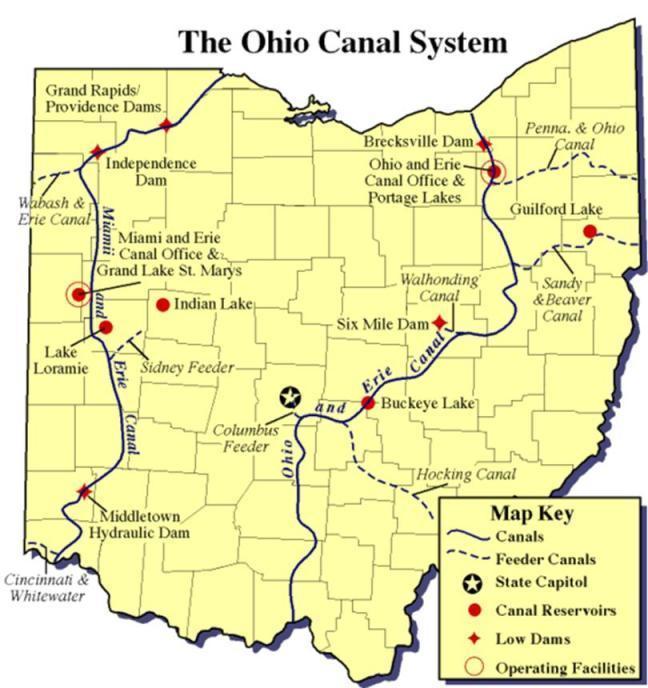
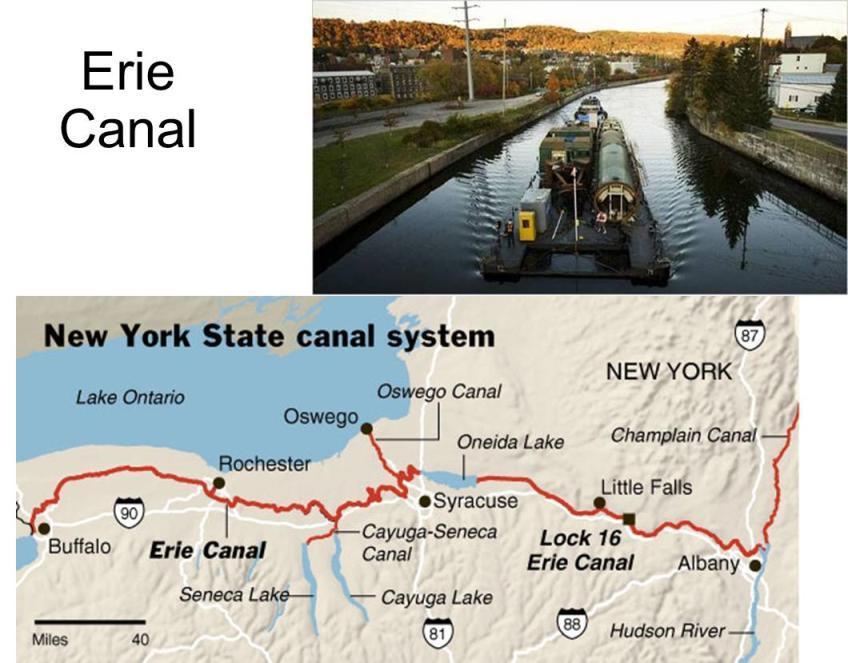
87 Waterways Rivers Made much more navigable with dams/locks. All major cities developed along these rives. Canals Built in 19th century as connectors between rivers. Ohio and Erie canal dramatically transformed Ohio s economy. Erie Canal in NY, is the world s most used inland canal.
88
89

90 Transportation Rails Originally connected waterways Took over prominence after Civil War Recent consolidation: mostly for bulk materials (agricultural products, building materials)

91 Transportation Roads Took over for the rails after mid 1900 s Earliest Toll Roads in Penn, Ohio, Indiana
92 Cities Many major metropolitan areas 16 with over a million people Anchored by Chicago and Toronto Second tier of cities that are more regional centers i.e. Cleveland, Detroit, Cincinnati, St. Louis, Kansas City, Minneapolis, Indianapolis Third tier cities i.e. Akron, Rochester

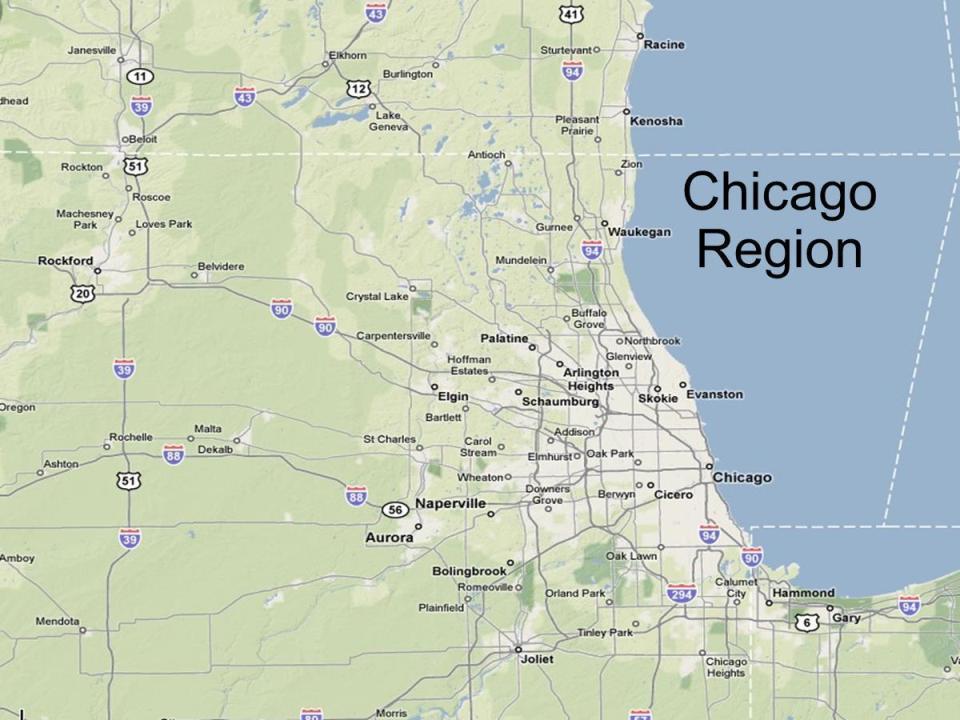
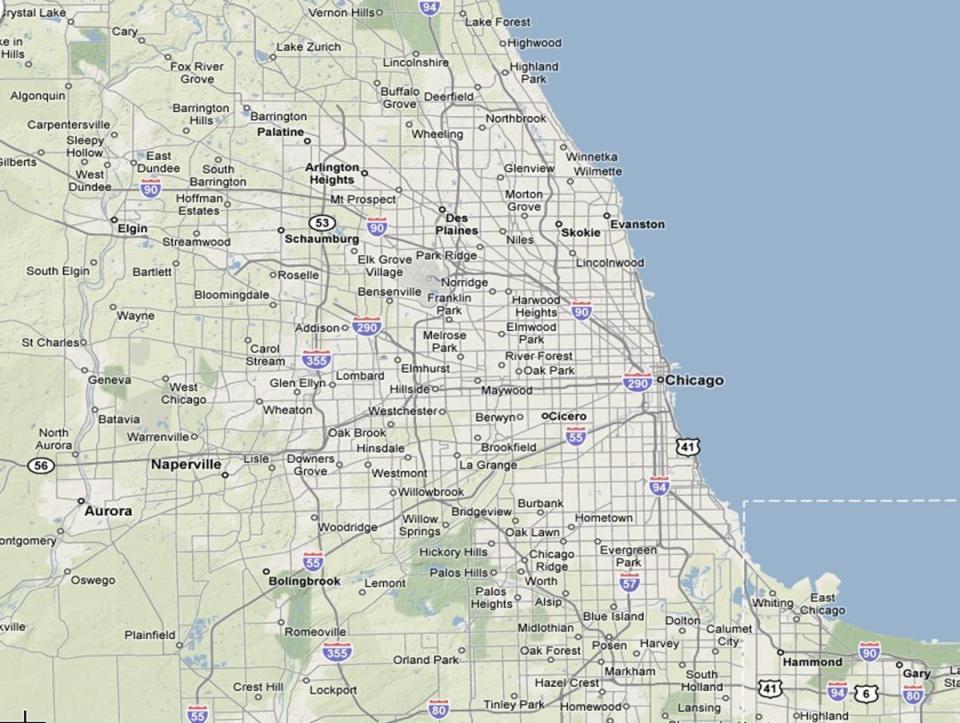
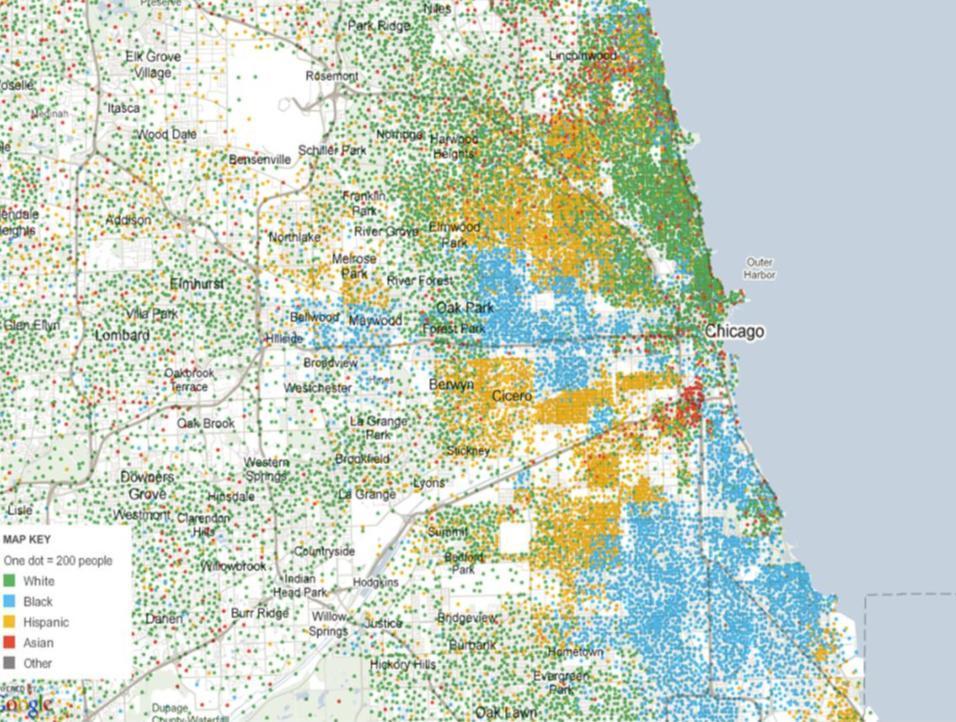
93 Chicago Second City Metro area 8 million Incorporated in 1833 Transportation hub Second largest manufacturing center, heavy machinery and industry

94 Chicago Stockyards Set up to facilitate transfers between east and west First, live animals Later refrigerated meat 475 acres, 130 miles of track In 1900, processed 82% of US meat Key immigrant job
95
96
97
.")
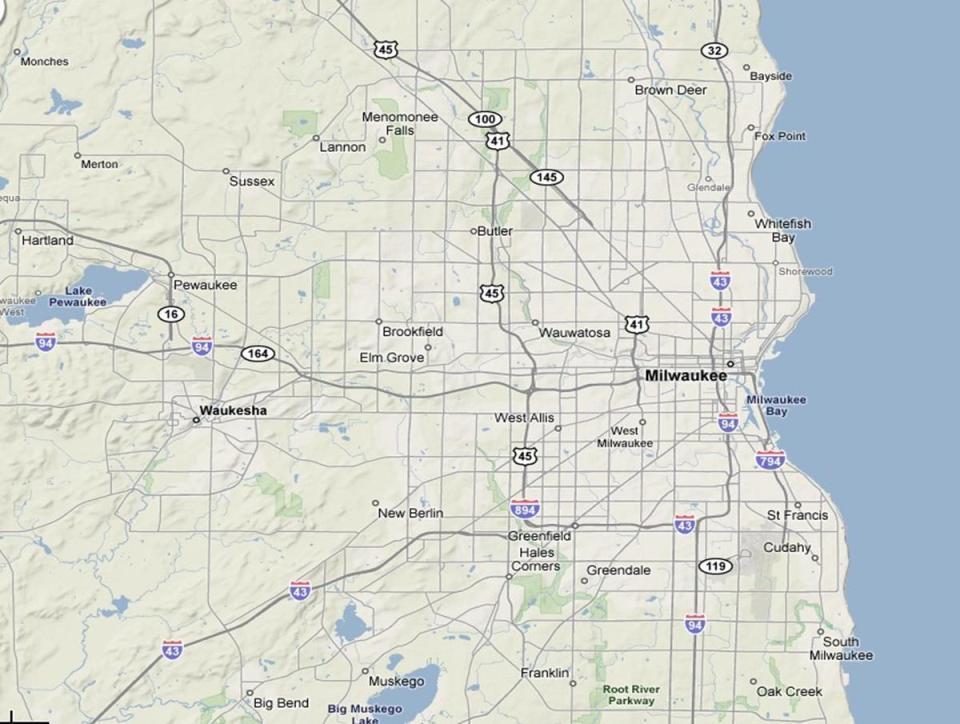
98 Milwaukee The largest city in Wisconsin, and the cultural center for SE Wisconsin. Located within Chicago's sphere of influence. German &Polish population. Milwaukee was once the home to four of the world's largest breweries (Schlitz, Blatz, Pabst, and Miller). Health care is the largest growing sector of the economy.
99

100
 Very diversified economy Major center within Canada migration and international")
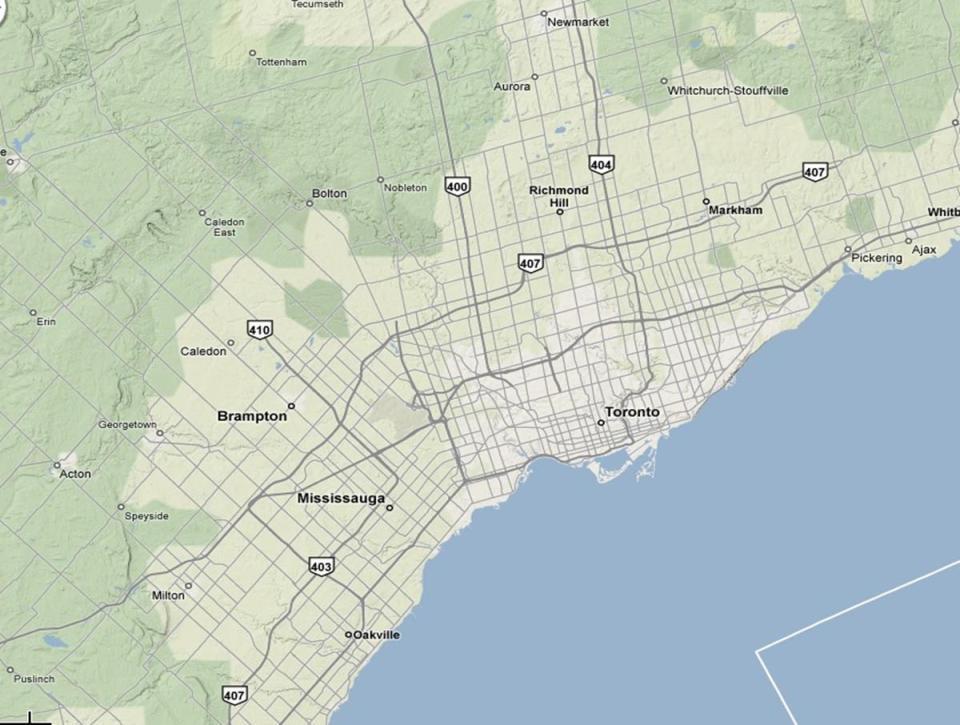
101 Toronto French settlement 1615 Torched by US in 1813 Premier financial and corporate center of Canada Over 4.5 million people (15% of Canada) Very diversified economy Major center within Canada migration and international migration
102

103 Ottawa Capital of Canada Ottawa is the second largest city in Ontario It was the only settlement of any significant size located right on the border of Canada East and Canada West making it a compromise between the two The War of 1812 at the time, surrounded by a dense forest far from the border The gov t owned a parcel of land overlooking the Ottawa River
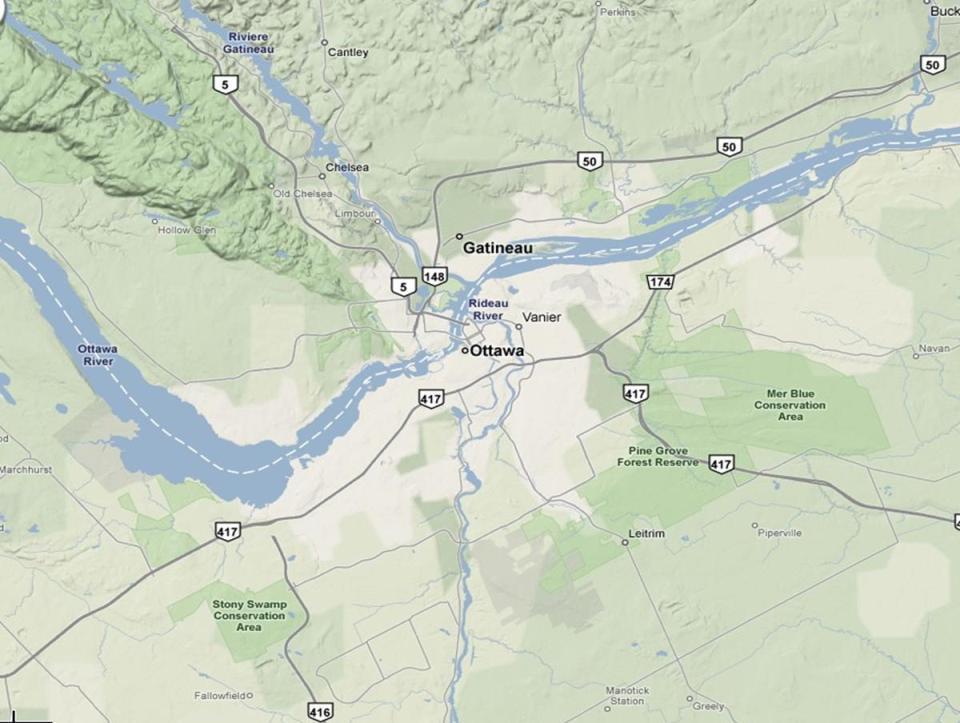
104

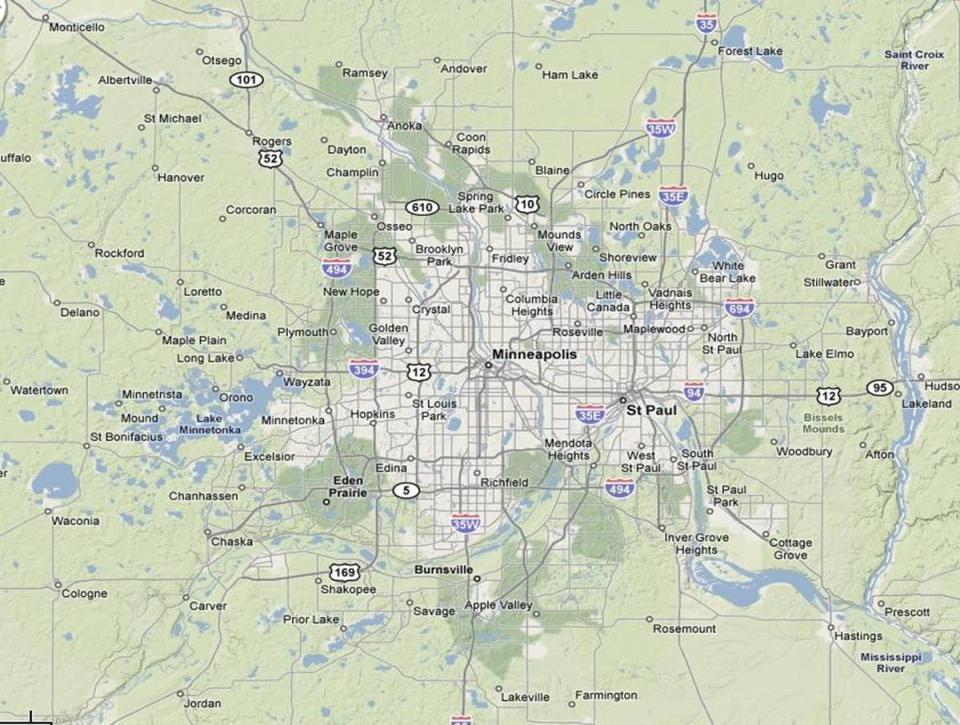
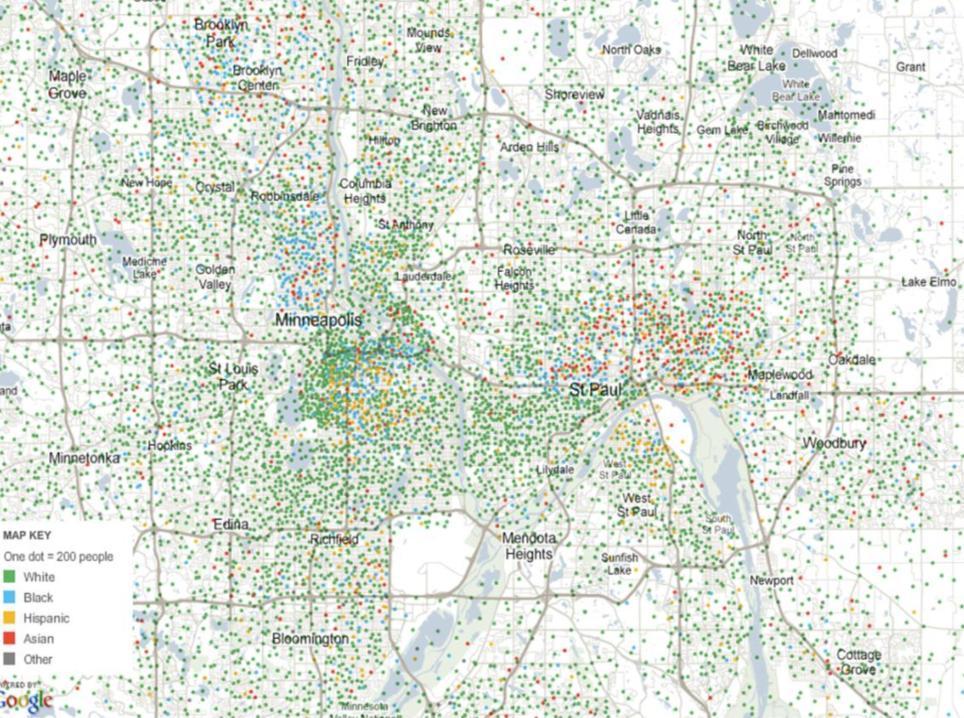
105 Minneapolis - St. Paul The Twin Cities Diverse cities St. Paul: eastern, historic Minneapolis: western, grid based Diversified employment Food: General Mills, Pillsbury Retail: Target, Best Buy, Mall of America Hi-Tech: 3M One of the fastest growing regions Low unemployment rate
106
107

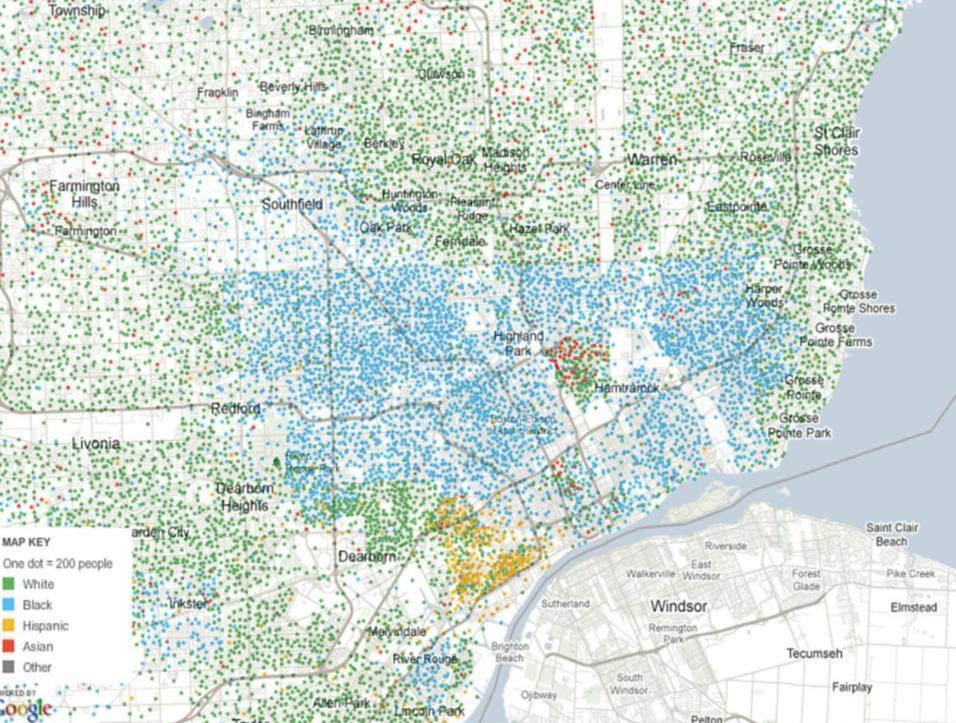
108 Detroit 3 rd largest manufacturing center in the US Auto industry Top 3 employers Ford over 60,000 people Largest Arab-American community City center in decline has lost over 1 million people Metro area over 4 million people
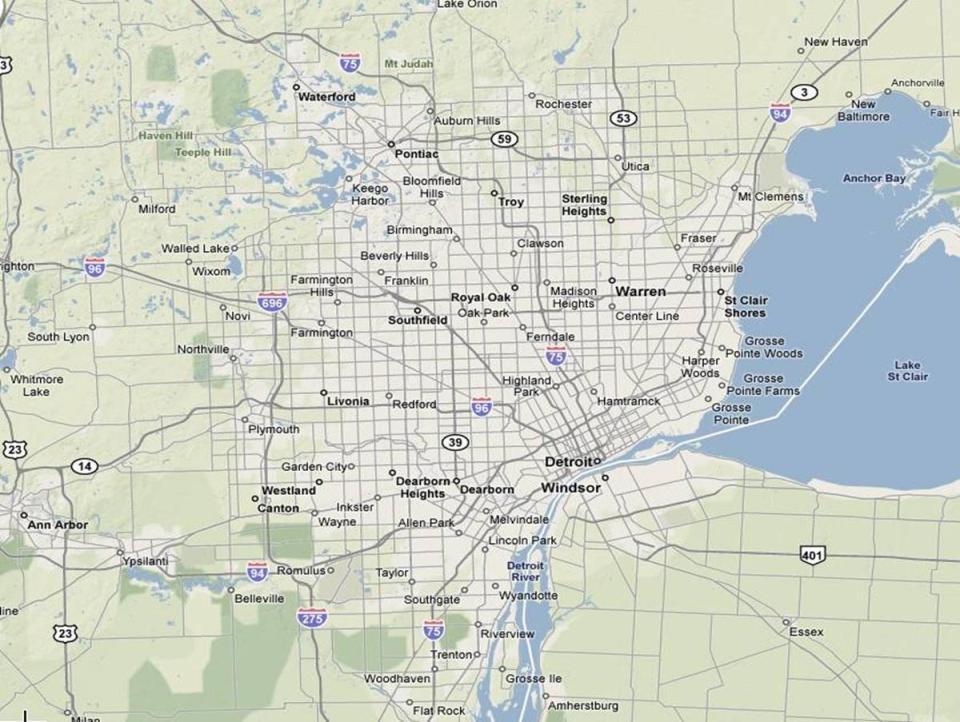
109
110

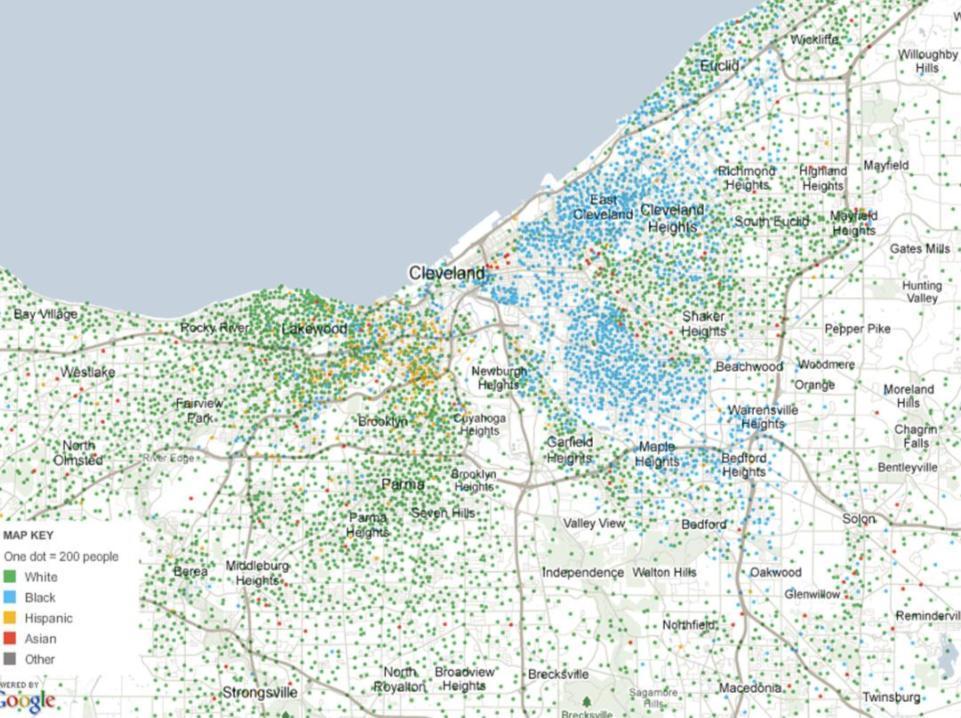
111 Cleveland 2 nd largest city in Ohio (Columbus #1) It was founded in 1796 near the mouth of the Cuyahoga River Became a manufacturing center do to its proximity of canals and railroad lines Cleveland is an emerging area for biotechnology and fuel cell research
112
113

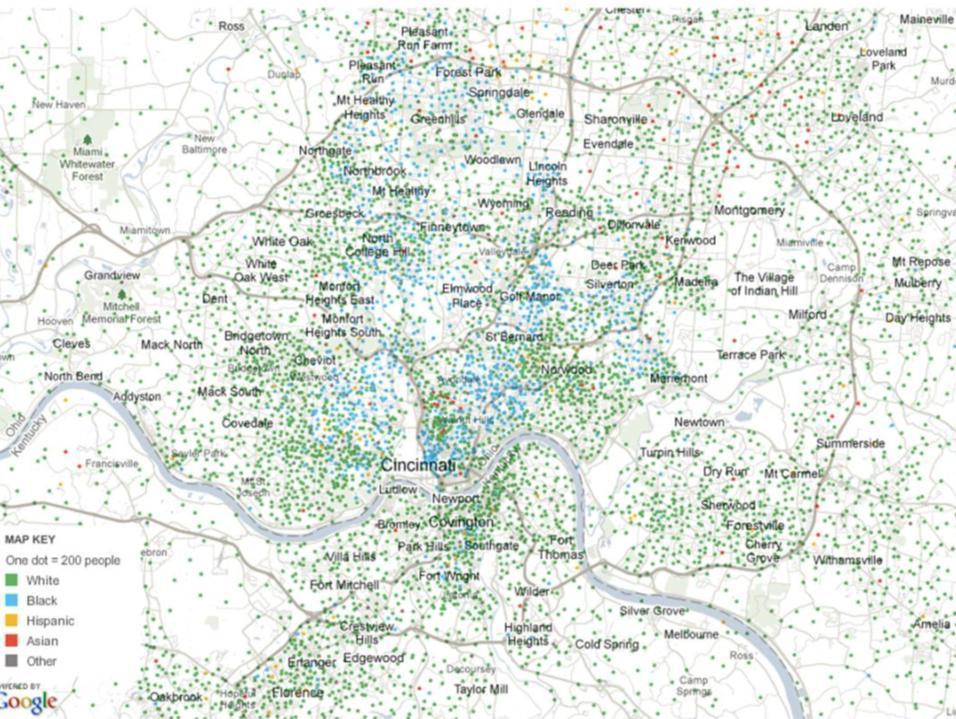
114 Cincinnati 3 rd largest city in Ohio Cincinnati is considered to have been the first major American boomtown Before the Civil War, Cincinnati was a border town between the slave and non-slave states Cincinnati is home to major corporations such as Procter & Gamble and Kroger
115
116

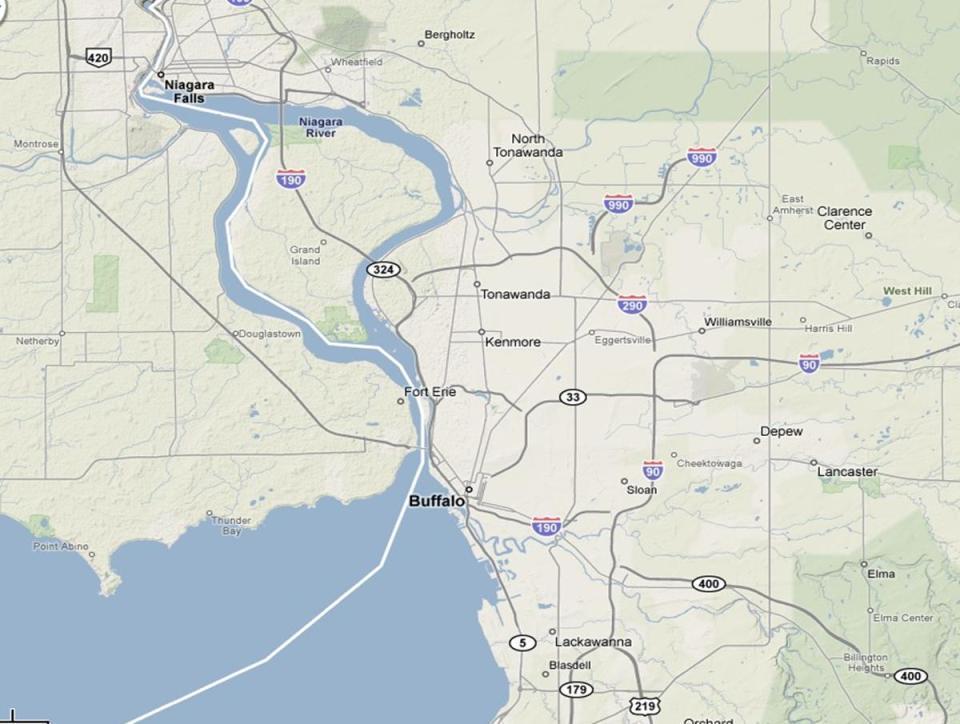
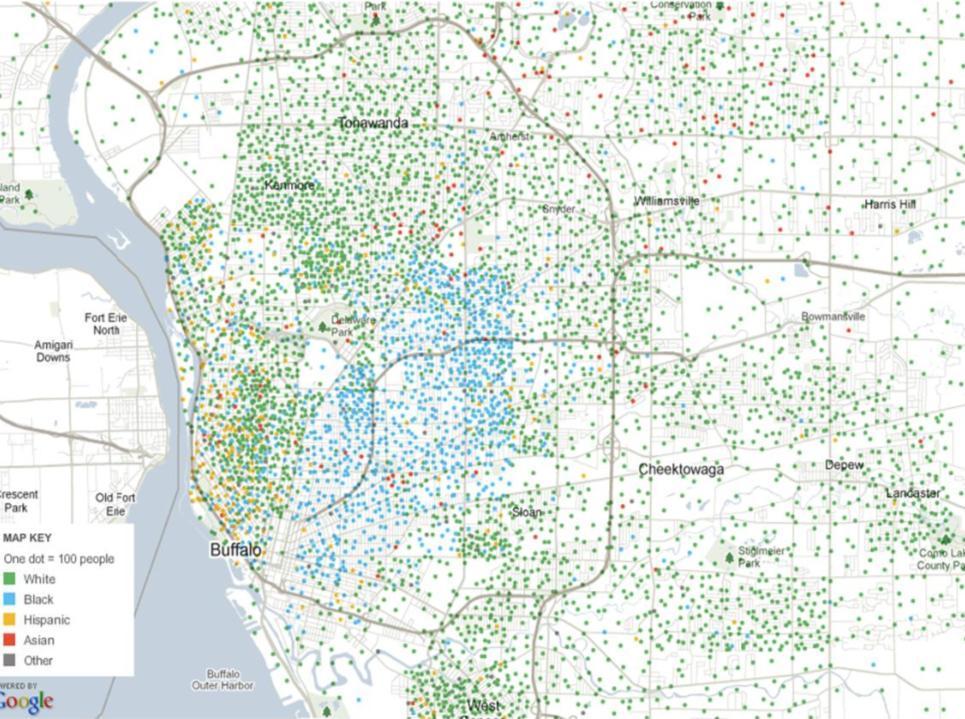
117 Buffalo 2 nd largest city in New York State Originating around 1789, Buffalo grew quickly around 1825 after the opening of the Erie Canal The rerouting of shipping by the St. Lawrence Seaway, and the closing of many steel mills and other heavy industries have also contributed to the decline
118
119
 Today - much more diversified economy, including education, healthcare, and finance. Popular destination for tourists.")
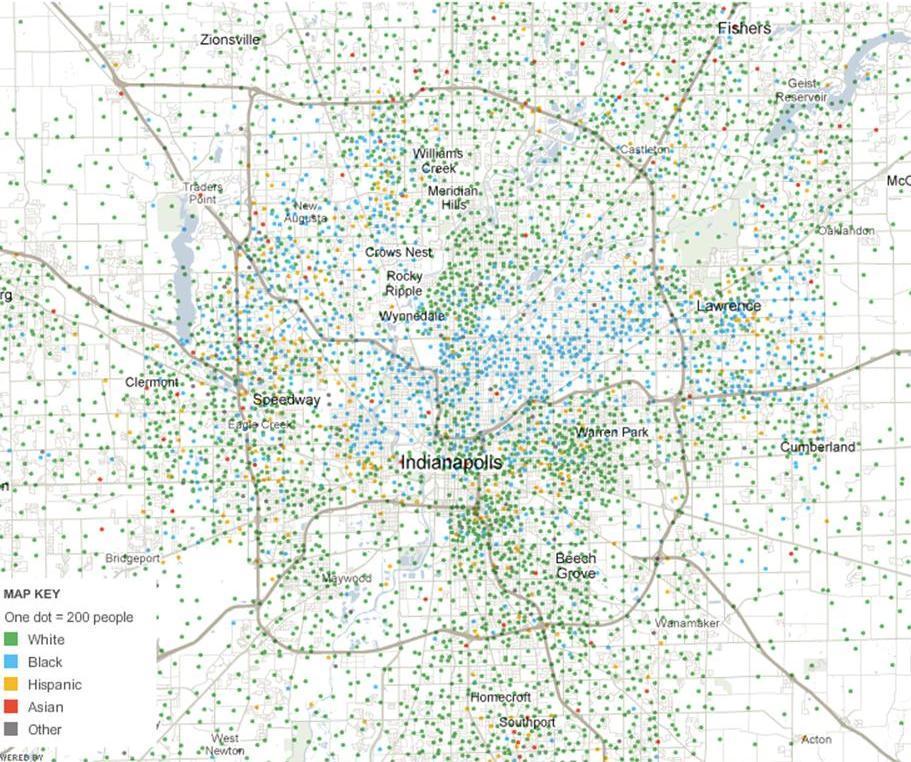
120 Indianapolis Capital and largest city in Indiana Historically - oriented around government and industry (automobile production and manufacturing) Today - much more diversified economy, including education, healthcare, and finance. Popular destination for tourists. Home of the Indy 500
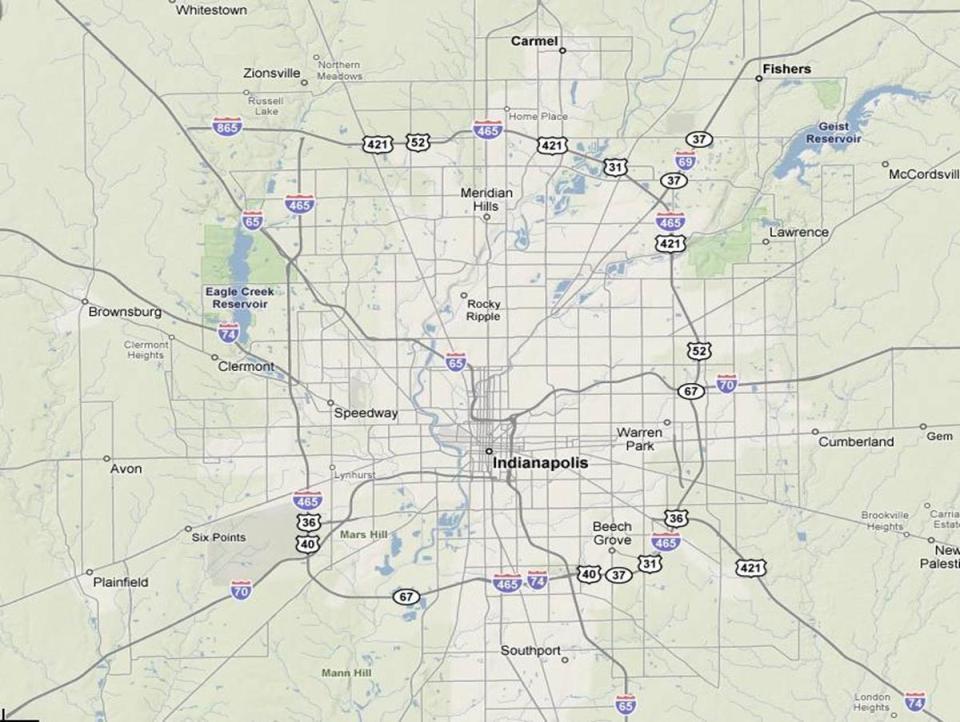
121
122
 and home to the second largest rail")
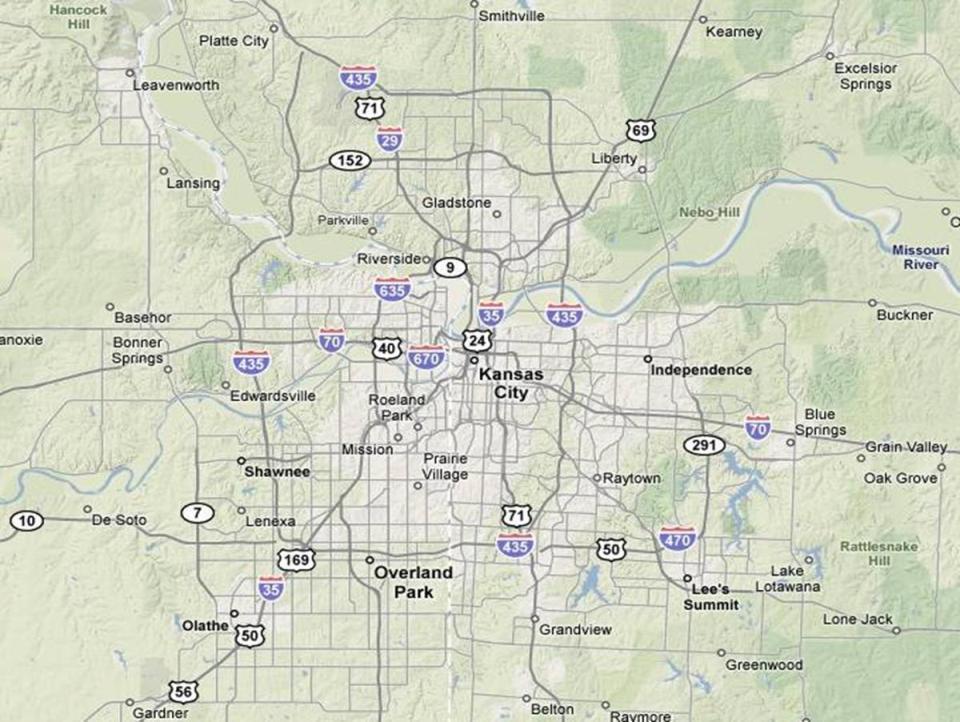
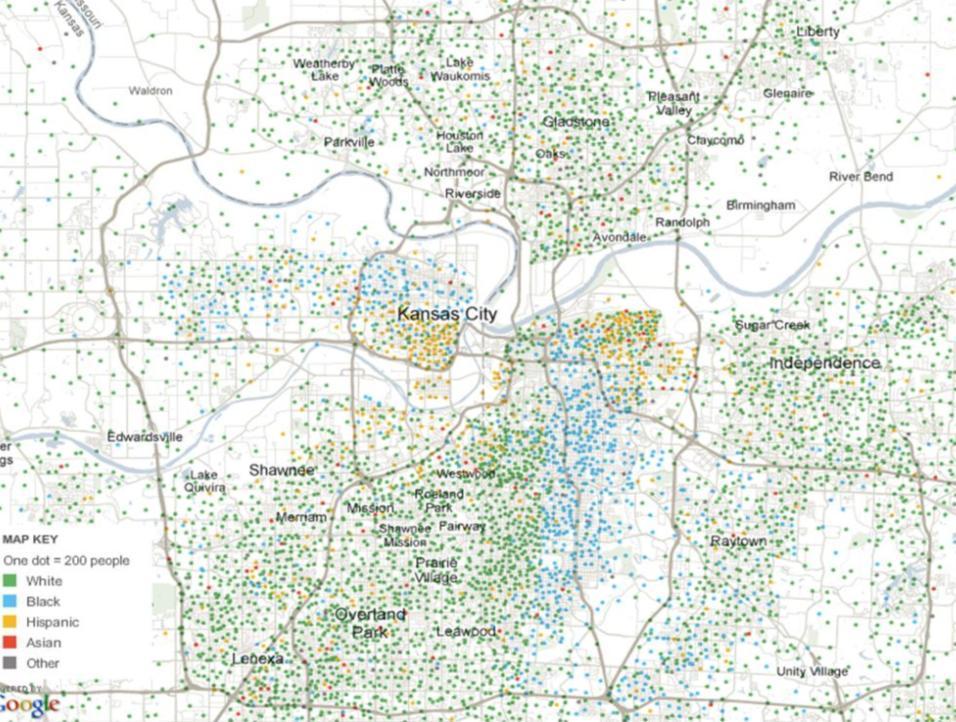
123 Kansas City Largest city in Missouri Confluence of the Missouri and Kansas rivers. Historically, Kansas City has been the third largest beef capital in the US (behind Chicago and Cincinnati) and home to the second largest rail network. Kansas City is most famous for its steak and barbecue.
124
125

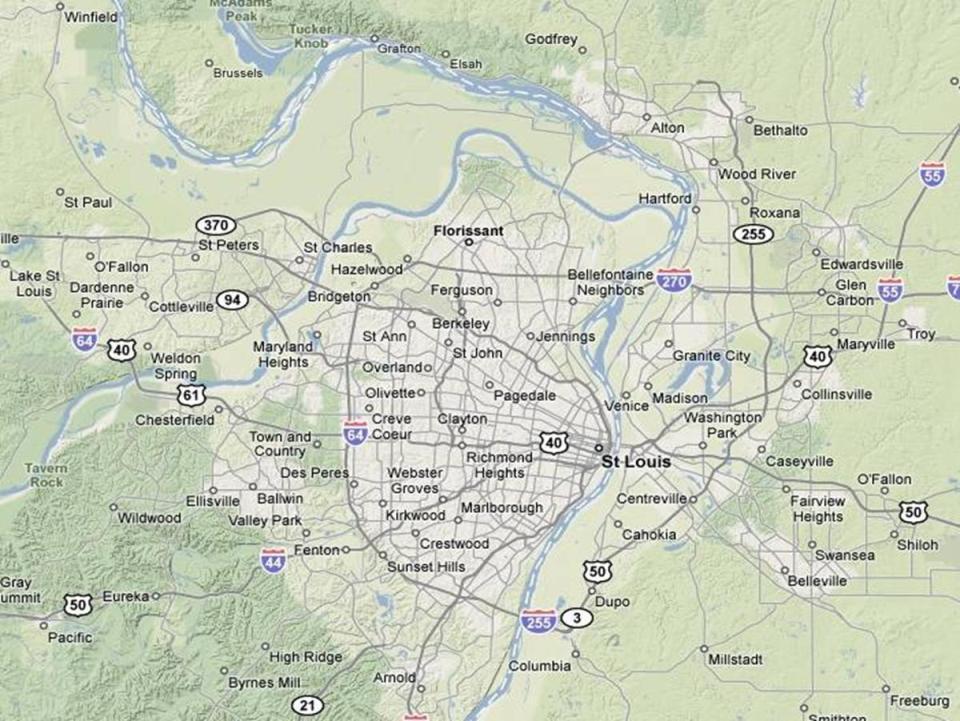
126 St. Louis Confluence of the Missouri and Mississippi rivers Home of the 1904 World's Fair and 1904 Olympic Games Home to the worldrenowned Saint Louis Symphony Orchestra, founded in 1880, 2nd oldest orchestra in the nation. Home of Anheuser-Busch Breweries
127
128
129 Other metro areas over 500,000 Industrial and financial centers Des Moines, Grand Rapids, Lexington, Louisville, Nashville, Rochester, Sioux Falls, Omaha
130 Outlook Important to the nations Major economic area of Canada Major agricultural and industrial area of the US Corporate agriculture Fewer employed in this sector Growth in urban areas Some cities flourishing more than others (i.e. Cleveland and Kansas City)
GEOGRAPHY OF THE UNITED STATES & CANADA. By Brett Lucas
 GEOGRAPHY OF THE UNITED STATES & CANADA By Brett Lucas MEGALOPOLIS Setting the Boundaries What states and provinces are part of the region? Primarily the east coast between Norfolk, VA and Boston, MA,
4th Grade Third 9 Weeks Test
 4th Grade Third 9 Weeks Test Multiple Choice Identify the choice that best completes the statement or answers the question. 1 A waterway for ships that is dug across land is called a. A port C river B
INDUSTRIAL REAL ESTATE INVESTMENT OPPORTUNITY GATEWAY BOULEVARD HEBRON, KENTUCKY
 INDUSTRIAL REAL ESTATE INVESTMENT OPPORTUNITY GATEWAY BOULEVARD HEBRON, KENTUCKY GROUNDBREAKING OPPORTUNITIES Dear Investors, Brokers and Developers, Corporex Companies is very pleased to present a Groundbreaking
Correlations with National Standards... v. How to use this thematic unit... vii. Suggestions for Teachers... viii SAMPLE. Midwest Region...
 Contents Correlations with National Standards................. v How to use this thematic unit...................... vii Suggestions for Teachers......................... viii reproducible student section
Welcome to the Midwest!
 Welcome to the Midwest! Why do we call the Midwest "America's Heartland"? 5 9 7 4 2 Farm State 6 8 1 St. Louis 3 St. Louis, Missouri "Gateway to the West" Frontier: the beginning of unexplored land Pioneers:
International migration. Total net migration. Domestic migration
 Indicator Direction Comparables a. Net population migration b. Crime rate (city) c. Housing costs d. Cost-of-living index N.A. e. State & local tax intensity f. Performing arts groups g. Air quality index
Geography: Unit 2. Map. Rivers. Major Physical Features. Slide 1. Slide 2. Slide 3. Slide 4. North America United States and Canada.
 Mississippi River Slide 1 Slide 2 Slide 3 Slide 4 Geography: Unit 2 North America United States Map Major Physical Features Mountain Ranges Brooks Range Mackenzie Mountains Coast Mountains Cascades Sierra
GEOGRAPHY OF THE UNITED STATES & CANADA. By Brett Lucas
 GEOGRAPHY OF THE UNITED STATES & CANADA By Brett Lucas THE CALIFORNIA REGION Setting the Boundaries What states and provinces are part of the region? Parts of CA and NV. What regions does it border? N.
OPPORTUNITY LAND OF. Wisconsin: Open for Business. The Premier Development Sites in the Chicago/Milwaukee Region
 LAND OF OPPORTUNITY Wisconsin: Open for Business The Premier Development Sites in the Chicago/Milwaukee Region Eric Fischer 773 425 9818 eric.fischer@avisonyoung.com Kelly Disser 630 317 0721 kdisser@hiffman.com
Geography: Unit 2. Map. Major Physical Features. Rivers. Mississippi River Missouri River Ohio River Rio Grande. Mackenzie. Colorado River Green River
 1 2 3 4 Geography: Unit 2 North America United States and Canada Map Major Physical Features Mountain Ranges Brooks Range Mackenzie Mountains Coast Mountains Cascades Sierra Nevada Rocky Mountains Appalachian
GEOGRAPHY OF THE UNITED STATES & CANADA. By Brett Lucas
 GEOGRAPHY OF THE UNITED STATES & CANADA By Brett Lucas THE SOUTHEASTERN COAST Setting the Boundaries What states and provinces are part of the region? Southeastern TX, southern LA, southern MS, southern
Student Reading 13.10: The Regions of Ohio
 Student Reading 13.10: The Regions of Ohio Ohio has five natural regions which formed more than 10,000 years ago. A natural region is an area that shares the same natural features. These places have similar
Chapter 1 Test A (1 of 5)
") Chapter 1 Test A (1 of 5) Vocabulary Match the descriptions with the correct terms. (8 points) Column I 1. a natural feature of Earth s surface 2. something in the environment that people use 3. the pattern
Chapter 1 Test A (1 of 5) Vocabulary Match the descriptions with the correct terms. (8 points) Column I 1. a natural feature of Earth s surface 2. something in the environment that people use 3. the pattern
INDUSTRY REPORT MANUFACTURING IN WEST MICHIGAN
 INDUSTRY REPORT MANUFACTURING IN WEST MICHIGAN AIR GERALD R. FORD INTERNATIONAL AIRPORT (GRR) General Information The airport operates three runways: Main East/West runway 150 ft. wide x 10,000-ft. long
Canada s National Core
 Regional Landscape Studies Regional Landscapes of the United States and Canada Canada s National Core Prof. Anthony Grande AFG 2016 NORTHLANDS NORTHEAST COAST MEGALOPOLIS CANADA S NAT L CORE AMERICA S
Spotlight on the U.S. Market. Kentucky
 Market Analysis By AmCham s Research Department Spotlight on the U.S. Market Kentucky With a strong manufacturing base, Kentucky has achieved sustained economic growth in excess of 5% and offers many export
Census Affects Children in Poverty by Professors Donald Hernandez and Nancy Denton State University of New York, Albany
 Phone: (301) 457-9900 4700 Silver Hill Road, Suite 1250-3, Suitland, MD 20746 Fax: (301) 457-9901 Census Affects in Poverty by Professors Donald Hernandez and Nancy Denton State University of New York,
Indoor Waterpark Resorts Expand Nationwide
 Indoor Waterpark Resorts Expand Nationwide by: David J. Sangree, MAI, CPA, ISHC The indoor waterpark resort concept is demonstrating its strength as a segment of the travel industry, expanding outside
Norwegian's Free Airfare Promotion
 Norwegian's Free Airfare Promotion Start planning your next vacation with 200+ cruises to incredible destinations, including Alaska, Bahamas & Florida, Bermuda, Canada & New England, Caribbean, Mexican
Location, Location, Location. 19 th Annual NIC Conference NIC MAP Data & Analysis Service
 Location, Location, Location 19 th Annual NIC Conference NIC MAP Data & Analysis Service The Great Occupancy Decline 94% Occupancy Trends Majority Nursing Seniors Housing 93% 92% 91% 92.8% 91.0% 90% 89%
FBI Drug Demand Reduction Coordinators
 FBI Drug Demand Reduction Coordinators Alabama 2121 Building, Room 1400 Birmingham, AL 35203 (205) 252 7705 One St. Louis Centre One St. Louis Street Mobile, AL 36602 (334) 438 3674 Alaska 222 West Seventh
Curriculum Pacing Guide Grade/Course 5 Th Grade Geography Grading Period 1 st Nine Weeks
 2013-2014 Curriculum Pacing Guide Grade/Course 5 Th Grade Grading Period 1 st Nine Weeks Time Frame Unit/ photographs, pictures, and tables to Locate and identify: Continents and Oceans -North America
Available Land For Sale or BTS Lease Evansville, Indiana
 Available Land For Sale or BTS Lease Evansville, Indiana Lot 13 Lot 15 Lot 6 Lot 5 VANDERBURGH INDUSTRIAL PARK ± 9-34 acres Available for Sale or BTS Lease SITE SITE Possible 10 yr Tax Phase-in (for qualifying
Lower Income Journey to Work Market Share From American Community Survey
 Lower Income Journey to Work Market Share From American Community Survey 2006-2010 Table 1: Overall National Data Table 2: Car, Truck or Van Table 3: Transit Table 4: Metrics Table 1 Work Trip Market Share:
Rank Place State Native Hawaiian and Pacific Islander population (alone or in combination
 TABLE 2a: 100 Largest Places Ranked by Number of s (race alone or in *) Living in Hard-to- Census Rank Place State (alone or in 1 Honolulu (CDP) HI 64,196 11,130 17.3 2 New York City NY 14,981 8,211 54.8
 RUSSIA OR CA WA AK NV CANADA ID UT AZ MT WY CO NM MEXICO HI ND SD NE KS TX MN OK CANADA IA WI LA IL MI IN OH WV VA FL ME VT NH MA NY CT NJ PA MO KY NC TN SC AR AL GA MS MD BAHAMAS CUBA RI DE 3 RUSSIA 1
 Snakes & Lattes is currently composed of three corporate owned and operated board game cafes in Toronto, ON. Over the last 7 years these have become renowned as Toronto's premiere board game cafe destinations.
PUBLIC TRANSPORTATION INTRODUCTION
 PUBLIC TRANSPORTATION INTRODUCTION 1 OUTLINE Current Status and Recent Trends Significant Influences A Critical Assessment Arguments Supporting Public Transport Future Influences Ingredients for Future
International Convention Badges
 Images may not be the actual size. (Reduced the image sizes to save white space in the catalog) Images provided by Lion Verle Malik Created 07/24/2015. 1923 1924 1925 7th Annual Convention June 26-29,
A COMPARISON OF THE MILWAUKEE METROPOLITAN AREA TO ITS PEERS
 KRY/WJS/EDL #222377 (PDF: #223479) 1/30/15 PRELIMINARY DRAFT Memorandum Report A COMPARISON OF THE MILWAUKEE METROPOLITAN AREA TO ITS PEERS EXECUTIVE SUMMARY This memorandum report provides a statistical
Monthly Employment Watch: Milwaukee and the Nation's Largest Cities
 Monthly Employment Watch: Milwaukee and the Nation's Largest Cities A monthly report on employment trends in the nation s largest cities Prepared by: The University of Wisconsin-Milwaukee Center for Economic
Human Geography of Canada
 Human Geography of Canada History and Government of Canada Like the United States, people migrated across Beringia into Canada, these people were the ancestors of the Inuit (Eskimos) 16 th and 17 th centuries,
The Economic Impact of Tourism in Missouri. Fiscal Year 2016 Summary December 2016
 The Economic Impact of Tourism in Missouri Fiscal Year 2016 Summary December 2016 Introduction and definitions This study measures the economic impact of tourism in Missouri in FY2016. Visitors included
The 156 Arts & Economic Prosperity III Study Regions
 Full-Time Resident Local NATIONAL ESTIMATES OF ECONOMIC IMPACT $63,053,399,000 $103,145,088,000 $166,198,487,000 5,695,361 $104,234,116,000 $7,936,383,000 $9,140,633,000 AK City of Homer A 5,364 $1,248,208
Buffalo and New York City Since the Great Recession
 Buffalo and New York City Since the Great Recession for the Workshop on Economic Restructuring in the Rust Belt, Buffalo New York Cornell University Worker Institute James A. Parrott, Dir., Economic &
Non-stop Scheduled Passenger Service at Fargo as of October Top 20 Domestic O&D Passenger Markets at Fargo Twelve Months Ended June 2006
 0 5000 10000 15000 20000 25000 30000 35000 40000 45000 50000 Airport Traffic Quarterly Non-stop Scheduled Passenger Service at Fargo as of October 2006 Top 20 Domestic O&D Passenger Markets at Fargo Twelve
Hector International Airport Fargo, North Dakota
 Hector International Airport Fargo, North Dakota Volume 072 Twelve Months Ended June 2007 November 2007 Airlines Serving Fargo Carried 830 Onboard Passengers Per Day for the Twelve Months Ended June 2007,
Economy 3. This region s economy was based on agriculture. 4. This region produced items such as textiles, iron, and ships in great quantities. For th
 Geography 1. This region has a climate of warm summers and snowy cold winters. 2. This region has a climate that is generally warm and sunny, with long, hot, humid summers, and mild winters, and heavy
Major Metropolitan Area Sales Tax Rates
 August 19, 2010 No. 239 FISCAL FACT Major Metropolitan Area Sales Tax Rates By Lawrence Summers Introduction General sales taxes levied by state, county and city governments in the United States vary greatly,
INDIANA INTERSTATE AND INTRASTATE LOCAL REDUCED CITY-PAIR FARES
 The following section contains city-pair fares that are lower than walkup mileage-based fares. Although shown in only one direction, the fares in this section apply in both directions, unless otherwise
Hector International Airport Fargo, North Dakota
 Hector International Airport Fargo, North Dakota Volume 081 Twelve Months Ended March 2008 July 2008 Airlines Serving Fargo Carried 838 Onboard Passengers Per Day for the Twelve Months Ended March 2008,
District Match Data Availability
 District Match Data Availability National & State Data Location Available National Data Australia Parliament, Provincial and Territory Assemblies Canada Parliament, Provincial Legislative Assemblies New
CCM Chicago 04 Elite Division Schedule Div A
 Div A 1 11/02 - Fri. 7:30AM Edge W A3. Chicago Fury, IL 5 2 A1. Milwaukee Jr. Admirals, 3 11/02 - Fri. 7:40AM Edge E A4. Pittsburgh Vengeance, PA 1 5 A2. Minnetonka Skippers, MN 17 11/02 - Fri. 2:10PM
The Land Photo Source: The Atlas of Canada, The Red River, Manatoba, Canada land/physio_red_ri
 The Land The United States and Canada An Overview of the Region The United States and Canada are the two largest countries in North America. The Rio Grande is part of the southwest border of the United
USA/Canada Lions. Leadership Forum Pins
 USA/Canada Lions Leadership Forum Pins USA/Canada Lions Leadership Pins CONTENTS USA/Canada Lions Leadership Loca ons USA/Canada Lions Leadership Theme Pins USA/Canada Lions Leadership Anniversary Pins
614 E. Jefferson Street. Powered by CLIFT MARKETING INC.
 614 E. Jefferson Street Broker Contact Information *Please contact local Broker Tracy Eastman, CCIM 6277 E. Riverside Rockford, IL 61114 Office: Mobile: 815.979.4926 Email: tracye@dickersonnieman. com
INTRODUCTION 250,000
 INTRODUCTION The United States of America has over 250,000 rivers, with a total of about 3,500,000 miles of rivers. The main stems of 38 rivers in the United States are at least 500 miles (800 km) long.
Sheltered Reality SUMMARY SCHEDULE
 Sat 7/23/6 SSDB Mega Practice Sun 7/24/6 7th Annual Sizzlin' Summer Drummer Bash Sat 7/3/6 Minneapolis-St. Paul MN Practice Mon 8//6 Tue 8/2/6 Granite City Summer Reading Program National Night Out National
ILLINOIS INTERSTATE AND INTRASTATE LOCAL REDUCED CITY-PAIR FARES
 The following section contains city-pair fares that are lower than walkup mileage-based fares. Although shown in only one direction, the fares in this section apply in both directions, unless otherwise
National Electric Rate Study
 National Electric Rate Study Ranking of typical residential, commercial and industrial electric bills 2017 Study 1040 O Street, P.O. Box 80869 Lincoln, NE 68501-0869 p: 402.475.4211 www.les.com Lincoln
CIM & Associates 2479 Murfreesboro Road Nashville, TN Tel: Fax:
 Alabama AL Arkansas AR Arizona AZ California CA (Northern) CA (Southern) Paine & Murray, Inc. 13300 Violet Lane Euless, TX 76040 Tel: 817-868-9584 Fax: 817-545-1312 Email: bruce@painemurray.com Intrex
MapInfo Routing J Server. United States Data Information
 MapInfo Routing J Server United States Data Information Information in this document is subject to change without notice and does not represent a commitment on the part of MapInfo or its representatives.
Hector International Airport Fargo, North Dakota
 Hector International Airport Fargo, North Dakota Volume 073 Twelve Months Ended September 2007 January 2008 Airlines Serving Fargo Carried 831 Onboard Passengers Per Day for the Twelve Months Ended September
RANKING OF THE 100 MOST POPULOUS U.S. CITIES 12/7/ /31/2016
 OVERVIEW OF THE DATA The following information is based on incoming communication to the National Human Trafficking Hotline via phone, email, and online tip report from December 7, 2007 December 31, 2016
Monthly Employment Watch: Milwaukee and the Nation's Largest Cities
 Monthly Employment Watch: Milwaukee and the Nation's Largest Cities A monthly report on employment trends in the nation s largest cities Prepared by: The University of Wisconsin-Milwaukee Center for Economic
Contact Orion at if you are not able to locate your agent.
 Alabama Alaska Arizona Arkansas California Colorado Connecticut Delaware District of Columbia Florida Georgia Idaho Illinois Indiana Iowa Kansas Kentucky Louisiana Maine Maryland Massachusetts Michigan
Fort Lauderdale August 8, 2017
 Fort Lauderdale August 8, 2017 8/10/2017 TAP Software Analytics Division Brian Finucane TAP Reports Jeff Eastman TAP Hotel Reports Jeanne Eastman TAP Data Source Jeff Eastman Cloud Database Numerous Data
Ontario Tourism Facts & Figures
 IN THIS ISSUE Economic Outlook Ontario and Canada Tourism Statistics International Border Crossings International Travel Account Accommodations Tourism Related Employment Visitor Inquiries Travel Price
A COMPARISON OF THE MILWAUKEE METROPOLITAN AREA TO ITS PEERS
 KRY/WJS/EDL #222377 v4 (PDF: #223479v2) 4/1/15 APPENDIX D REVISED DRAFT Memorandum Report A COMPARISON OF THE MILWAUKEE METROPOLITAN AREA TO ITS PEERS EXECUTIVE SUMMARY This report provides a statistical
ALN Apartment Data, Inc. (Continued on next page)
") AK - Anchorage 93.0% 90.9% -210-2.2% $1,035 $1,018-1.7% 93.0% 90.9% -210-2.2% $1,035 $1,018-1.7% AK - Misc. AK 90.3% 86.8% -350-3.8% $1,218 $1,245 2.3% 90.3% 86.8% -350-3.8% $1,218 $1,245 2.3% Alaska Average
AK - Anchorage 93.0% 90.9% -210-2.2% $1,035 $1,018-1.7% 93.0% 90.9% -210-2.2% $1,035 $1,018-1.7% AK - Misc. AK 90.3% 86.8% -350-3.8% $1,218 $1,245 2.3% 90.3% 86.8% -350-3.8% $1,218 $1,245 2.3% Alaska Average
 Chapter Name Albuquerque Ann Arbor Augusta Baton Rouge Bayou Oncology (C'est Bon) Big Sky Bluegrass Blue Ridge of Virginia Bluewater International Boston Broward Florida Bucks Montgomery Counties California
Oct-17 Oct-18 bps %CHG Oct-17 Oct-18 %CHG Oct-17 Oct-18 bps %CHG Oct-17 Oct-18 %CHG
 AK - Anchorage 92.6% 89.9% -270-2.9% $1,023 $1,011-1.2% 92.6% 89.9% -270-2.9% $1,023 $1,011-1.2% AK - Misc. AK 89.9% 85.8% -410-4.6% $1,227 $1,230 0.2% 89.9% 85.8% -410-4.6% $1,227 $1,230 0.2% Alaska Average
4th Grade Social Studies 2nd Nine Weeks Test
 4th Grade Social Studies 2nd Nine Weeks Test Multiple Choice Identify the choice that best completes the statement or answers the question. 1 Which is the largest city in the United States? A Philadelphia,
Chicago, Rock Island and Pacific Railway, The 7/1/1911 7/1/1931 Chicago, Saint Paul, Minneapolis and Omaha Railway 10/1/1912 9/30/1932 Cincinnati,
 Pullman Company PULLMAN, INCORPORATED........................................................... Inc. in DE, no date listed Controls 99.98% of Pullman Company stock, as of December 31, 1931 Re-evaluation
Innovation Clusters in the Decade of the 1990s
 Innovation Clusters in the Decade of the 1990s TARGET MISSOURI January 2002 Additional information is available on-line at: http://www.missourieconomy.org Innovation Clusters in the Decade of the 1990s
4/28/17. Clicker Question. Clicker Question. #37 Floods IV (Case Histories-Mississippi River Flood, 1993; Red River of North Flood, 1997)
") GEOL 118 Final Exam Format similar to exams 1 and 2 Covers Lectures #27 40 (Global Climate Change I - Meteorite Impacts III) Web Exercise #6 - Due by 1 pm, Monday (5/1) 8:00 AM, Thursday, May 11 th Location
GEOL 118 Final Exam Format similar to exams 1 and 2 Covers Lectures #27 40 (Global Climate Change I - Meteorite Impacts III) Web Exercise #6 - Due by 1 pm, Monday (5/1) 8:00 AM, Thursday, May 11 th Location
OUR U.S. FULL SERVICE OFFICES:
 HOW TO NAME US AS YOUR REGISTERED AGENT Listing the correct name and address of your Registered Agent on filings is critically important. To make sure you have the most current address for COGENCY GLOBAL
Agency 35 ft. Over Artic. Trolley 2012 Total and 35 ft. under. 1 1 MTA New York City Transit 0 3, ,344 New York City
 Capital Metro-No. 40 Courtesy Capital Metro 1 1 MTA New York City Transit 0 3,704 640 0 4,344 New York City 2 3 New Jersey Transit Corp. 47 2,263 85 0 2,395 Newark, N.J. 3 2 Metro 50 1,956 378 0 2,384
THE USA. The capital of USA is Washington D.C., in the District of Columbia.
 THE USA The United States of America is the richest and one of the biggest countries in the world. It has a population of about 295 million people. It is divided into 50 states; two of them, Alaska and
Population Estimates for U.S. Cities Report 1: Fastest Growing Cities Based on Numeric Increase,
 ulation s for U.S. Cities Report 1: Fastest Growing Cities Based on Numeric Increase, 2015-2015 1 Phoenix AZ 32,113 2.0 1,582,904 1,615,017 167,393 11.6 2 Los Angeles CA 27,173 0.7 3,949,149 3,976,322
Monthly Employment Watch: Milwaukee and the Nation's Largest Cities
 Monthly Employment Watch: Milwaukee and the Nation's Largest Cities A monthly report on employment trends in the nation s largest cities Prepared by: The University of Wisconsin-Milwaukee Center for Economic
840 PHASE I AVAILABLE
 PHASE I AVAILABLE PHASE I - SPEEDWAY BUILDING I - 689,4 SF EXPANDABLE to 1,500,000 SF Class A Distribution Center Under Construction LEBANON MT. JULIET NASHVILLE Nashville International Airport WILSON
Snowbelt to Sunbelt The Migration of America s s Voters
 Snowbelt to Sunbelt The Migration of America s s Voters William H. Frey The Brookings Institution & University of Michigan www.frey-demographer.org State Projected Growth, 2000-2030 2030 Projected Growth,
Location, Climate, & Natural Resources
 Location, Climate, & Natural Resources UK is a country of islands off the coast of mainland Europe. It consists of England, Northern Ireland, Scotland, & Wales. UK s location makes it a HUB for trade.
3. Proposed Midwest Regional Rail System
 3. Proposed Midwest Regional Rail System 3.1 Introduction The proposed Midwest Regional Rail System (MWRRS) will operate in nine states, encompass approximately 3,000 route miles and operate on eight corridors.
Vacant Restaurant Redevelopment Site
 Vacant Restaurant Redevelopment Site Call For Offers Deadline November 15 th Representative Photo 8466 Gratiot Avenue Saginaw, Michigan, 48609 Offering Price: $300,000 Rolling Bid Process That Will Conclude
REPLACEMENT PARTS LIST
 FLAV-R-SAVOR Heat & Humidity Merchandising Cabinets FSD & FSDT Series FSD-1 FSD-1X FSD-2 FSD-2X FSDT-1 FSDT-1X FSDT-2 FSDT-2X REPLACEMENT PARTS LIST HATCO FLAV-R-SAVOR MERCHANDISING CABINETS FSD & FSDT
Access Across America: Transit 2014
 Access Across America: Transit 2014 Final Report CTS 14-11 Prepared by: Andrew Owen David Levinson Accessibility Observatory Department of Civil, Environmental, and Geo- Engineering University of Minnesota
FILED: NEW YORK COUNTY CLERK 10/14/ :25 PM INDEX NO / /4/2016 Office locations in US states: PwC
 FILED: NEW YORK COUNTY CLERK 10/14/2016 02:25 PM INDEX NO. 451962/2016 10/4/2016 Office locations in US states: PwC NYSCEF DOC. NO. 9 RECEIVED NYSCEF: 10/14/2016 PwC office locations in (by state) Below
Appendix D: Aggregation Error for New England Metro Areas and for Places
 Appendix D: for New England Metro Areas and for Places D-1 Appendix D: s Figure D-1: New England Metro Areas - Summary of Tract s (2000) Metro ID (msapma99) Metro Area Name Census NCDB 1120 Boston, MA-NH
Physical Regions of the U.S.
 Physical Regions of the U.S. Quickly use this map to label the map on your paper Pacific Coast The coast from southern California to Alaska The region of the Pacific Northwest has a long history that was
US Cities Over 100,000 Population in 1998 & 1990
 US Cities Over 100,000 Population in 1998 & 1990 Population Ranking Alphabetical Listing Population Change Ranking Percentage Population Change Ranking DEMOGRAPHIA An undertaking of Wendell Cox Consultancy
Westbrook Station. Transit Oriented Development Opportunity
 DEVELOPM Westbrook Station Transit Oriented Development Opportunity OPPOR Table of Contents Prime Real Estate Development Opportunity page 1 Calgary City of Opportunity page 3 What is Transit Oriented
MANGO MARKET DEVELOPMENT INDEX REPORT
 MANGO MARKET DEVELOPMENT INDEX REPORT 2015-2016 UNDERSTANDING THE MARKET INDEX The Mango Market Development Index is designed to measure and compare mango sales volume relative to population by region
Who Sprawls the Most?
 SPRAWL AMERICAN STYLE Who Sprawls the Most? Jackie Cutsinger Research Assistant, Center for Urban Studies Wayne State University Measuring Sprawl in Major Metros Regionally stratified, nationally representative
Alabama Y Y Birmingham-Hoover, AL Y Y. Alaska N/A. Arizona N Y Phoenix-Mesa-Scottsdale, AZ N Y Tucson, AZ N Y
 - requires bidders to obtain out of state Alabama Y Y Birmingham-Hoover, AL Y Y Alaska Arizona N Y Phoenix-Mesa-Scottsdale, AZ N Y Tucson, AZ N Y Arkansas Y N Little Rock-North Little Rock, AR Y N Memphis,
Indoor Waterpark Resorts Continue Impressive Growth in 05
 Indoor Waterpark Resorts Continue Impressive Growth in 05 by: David J. Sangree, MAI, CPA, ISHC and Laurel A. Keller It s official. The indoor waterpark resort has established itself as a viable segment
Meeting guide. Enhanced Care PPO (ECP) for non-medicare UAW Trust members All states. New
 for non-medicare UAW Trust members All states. New") Meeting guide Enhanced Care PPO (ECP) for non-medicare UAW Trust members All states New for 2019 1 great plan. 3 ways to learn about it. We want to help you get familiar with your new Blue Cross Blue Shield
Meeting guide Enhanced Care PPO (ECP) for non-medicare UAW Trust members All states New for 2019 1 great plan. 3 ways to learn about it. We want to help you get familiar with your new Blue Cross Blue Shield
Charleston, WV 18 Juneau, AK Peoria, IL Jefferson City,
 2004 Ranking Diocese Catholics Diocesan Seminarians 2004 Ratio (Catholics / Seminarians) 2003 Ranking 1 Lincoln, NE 89431 35 2555 2 2 Yakima, WA 68561 20 3428 5 3 Savannah, GA 75987 22 3454 13 4 Cheyenne,
MAMA Risk Summary Data as of 2008 Q4
 MAMA Risk Summary Data as of 2008 Q4 Table of Contents Contents. 2 Largest 25 Metro Areas based on HMDA originations.. 3 Lowest Risk 25 Metro Areas 4 Highest Risk 25 Metro Areas... 5 Largest 25 States
Gifts of the Glaciers
 Gifts of the Glaciers Gifts of the Glaciers Moving ice of glacier was responsible for water, landforms, and soil characteristics and patterns of today Sculpturing of bedrock materials Glacial Landforms
Higher Education in America s Metropolitan Areas A Statistical Profile
 Higher Education in America s Metropolitan Areas A Statistical Profile MSA Study No.2 Higher Education in America s Metropolitan Areas A Statistical Profile CONTENTS Why Metro Areas? 1 Executive Summary
MID-AMERICA ECONOMIC DEVELOPMENT COUNCIL (MAEDC) ANNOUNCES 2008 ANNUAL ECONOMIC DEVELOPMENT AWARD WINNERS
 ANNOUNCES 2008 ANNUAL ECONOMIC DEVELOPMENT AWARD WINNERS") Mid-America Economic Development Council 17 South High Street, Suite 200 Columbus, OH 43215 Phone: 800.439.9172 Fax: 614-221-1989 Email: tracey@assnoffices.com www.maedc.net Press Release Contact: Tracey
Mid-America Economic Development Council 17 South High Street, Suite 200 Columbus, OH 43215 Phone: 800.439.9172 Fax: 614-221-1989 Email: tracey@assnoffices.com www.maedc.net Press Release Contact: Tracey
TOP 100 Bus Fleets Agency 35 ft. and Over Artic under 35 ft. Total. 18 < metro magazine SEPTEMBER/OCTOBER 2018 metro-magazine.
 1 1 MTA New York City Transit/MTA Bus Co. 0 4,860 951 5,811 New York City 2 3 New Jersey Transit Corp. 418 2,879 85 3,382 Newark, N.J. 3 2 Los Angeles County Metropolitan Transportation Authority 50 1,882
TOP 100. Transit Bus Fleets Agency 35 ft. Over Artic and 35 ft. Total +/- under 0 3, ,426 82
 L.A. Metro-No. 3 1 1 MTA New York City Transit New York City 2 2 New Jersey Transit Corp. Newark, N.J. 3 3 Metro Los Angeles 4 5 Toronto Transit Commission Toronto 5 10 Chicago Transit Authority Chicago
Match the names below with their locations on the map by writing the correct letter in the blank.
 P r e v i e w Match the names below with their locations on the map by writing the correct letter in the blank. Physical Features of Canada 60ºN 70ºN 80ºN A R C T I C O C E A N 130ºW 120ºW 110ºW 90ºW 70ºW
Largest cities in the United States by population by decade
 1 of 17 11/15/2008 7:30 AM Largest cities in the United States by population by decade From Wikipedia, the free encyclopedia This entry tracks and ranks the population of the largest cities in the United
Weekly Disaster Stats Update
 Weekly Disaster Stats Update The Weekly Disaster Stats Update is published every week on Tuesday. The product is meant to provide a snapshot of major disaster statistics throughout the calendar year to-date,
Finding Locations on a Map
 Name Date Class Finding Locations on a Map Identify each place described below. Use the map of the Mississippi in your textbook to find the answers. 1. This state is bordered on the north by Missouri and
MARKETBEAT U.S. Office
 MARKETBEAT U.S. Office Q4 2018 U.S. OFFICE Employment Indicators Market Indicators (Overall) Office: Net Absorption/Asking Rent 4Q TRAILING AVERAGE Office: Overall Vacancy Q4 17 Q4 18 Total Nonfarm Employment