For the January to April 2011 period, TREB
|
|
|
- Milton Riley
- 5 years ago
- Views:
Transcription
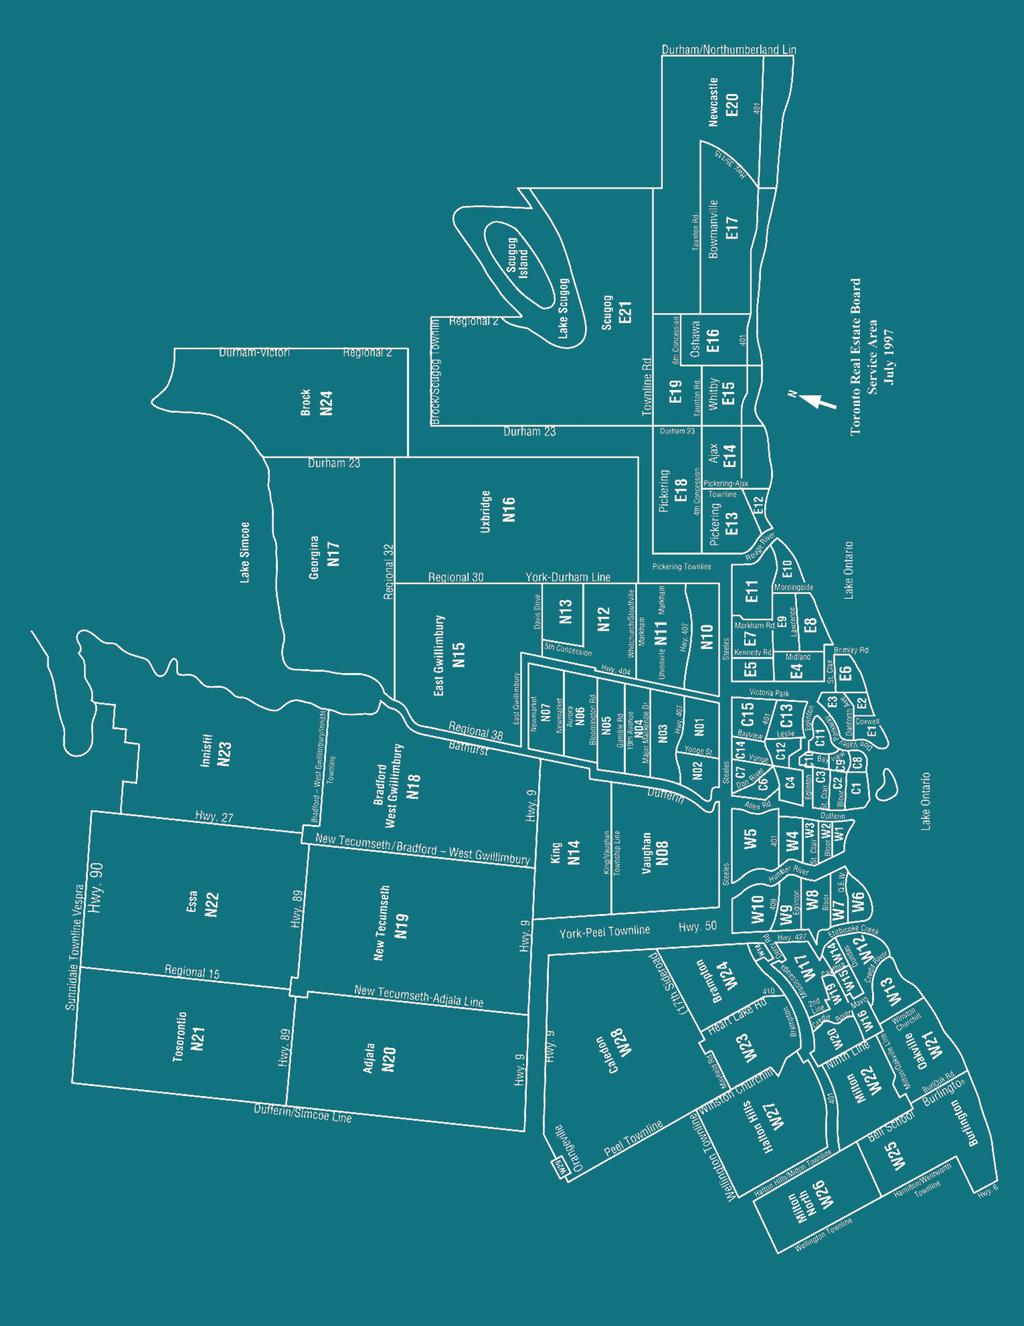
1 An Analysis of January 1, April 30, 2011 For All Media Inquiries: (416) For All TREB Member Inquiries: (416) Rental Transactions Up 18 Per Cent For the January to April 2011 period, TREB Members reported 5,079 lease transactions for condominium apartments and townhomes. This result was up 18 per cent from 4,319 lease transactions reported during the same time-period in The number of rental units listed on the TorontoMLS rose 10 per cent to 9,374 units. The increase in listings reflects the high level of condominium apartment completions over the past year. Some investors chose to lease their units upon completion. With the number of transactions rising at a greater rate than the number of units available for rent, rental market conditions tightened. Average rental rates were up in comparison to last year. One-bedroom apartments rented for an average of $1,485 per month, up 1.5 per cent year-over-year. Two-bedroom apartment units rented for an average of $1,958 per month up 2.5 per cent compared to the first four months of See page 2 minium Apartment / Townhouse minium Apartment / Townhouse Bedroom Rentals Bedroom Average Rents 1, , $1,909 $1,703 $1,958 $1, Apt Townhouse Apt Townhouse 0 Apt 2010 Townhouse Apt 2011 Townhouse
2 Rental Transactions From page 1 Central Area In TREB s Central districts, Members reported lease transactions for 1,846 one-bedroom and 1,166 twobedroom apartments. One-bedroom apartments leased for an average of $1,547 per month, representing a 1.2 per cent increase compared to last year. Two-bedroom apartments leased for an average of $2,188 per month up 1.9 percent from There were 74 townhouse rentals in the Central districts. The most popular rentals were two-bedroom units that rented for an average of $2,028 per month an 8.4 per cent decrease from North Area Most condominium apartments leased in TREB s North districts were one-bedroom and two-bedroom units (189 and 173 units respectfuly). One- bedroom apartments rented for an average of $1,336 per month up 1.1 per cent from Two-bedroom apartments rented for an average of $1,708 per month up 0.6 per cent compared to There were 39 townhouse rentals in TREB s North districts. The majority (32) of these transactions involved three-bedroom units, which rented for an average of $1,796 per month, unchanged from last year. East Area In TREB s East districts, Members reported rental transactions for 129 one-bedroom apartments and 128 two-bedroom apartments. The one-bedroom units rented for an average of $1,253 per month up 1.4 per cent from last year. Two-bedroom apartments rented for an average of $1,455 per month down 1.0 per cent from There were 23 townhouses leased in TREB s East districts during the reporting period. Of these, 19 were three-bedroom units, which rented for an average of $1,447 per month down 2.0 per cent from West Area In TREB s West districts, 974 condominium apartments were rented during the first four months of Of these, 416 were one-bedroom units, which rented for an average of $1,351 per month up 3.9 per cent over last year. There were 518 two-bedroom apartment rentals, which leased for an average of $1,648 per month up 0.4 per cent compared to TREB s West districts accounted for the largest share of townhouse rentals during the reporting period, with 144 transactions in total. Of these, 102 were threebedroom units, which rented for an average of $1,693 per month up 7.2 per cent from last year. Total Apt Listed Rented Bachelor Avg Monthly 1-Bed Avg Monthly 2-Bed Avg Monthly 3-Bed Avg Monthly 8,694 4, $1,227 2,580 $1,485 1,985 $1, $2,347 Total Townhouse Listed Rented Bachelor Avg Monthly 1-Bed Avg Monthly 2-Bed Avg Monthly 3-Bed Avg Monthly $1, $1, $1,825 Grand Total: 9,374 5, $1,226 2,608 $1,484 2,062 $1, $2,026 2
3 Apt C01 2,803 1, $1,246 1,031 $1, $2, $3,343 C $1, $2, $3,902 2 $5,075 C $1,882 8 $2,347 9 $3,036 C $1,310 8 $2,323 1 $1,750 C $1,352 9 $1,586 2 $1,600 C $1, $1,764 8 $2,350 C $1, $1, $2,151 2 $5,100 C $1, $2,452 1 $4,800 C $1, $2,537 2 $3,850 C $1,158 1 $1, C $825 1 $1,600 9 $2, C $1, $1,730 1 $1,625 C $1, $1, $1, $2,494 C $1, $1, $2,106 2 $2,240 Total: 5,442 3, $1,237 1,846 $1,547 1,166 $2, $2,993 Townhouse C $1, $1,985 6 $3,167 C $2, C C $2, C $1,900 C $1, C $1,783 1 $1, C C C C $2,867 C $1,400 C $1, $1,922 8 $2,538 C $1,550 3 $3,517 Total: $1, $2, $2,80 Central Total: 5,624 3, $1,237 1,863 $1,547 1,201 $2, $2,941 3
4 Apt E $1, E $1,900 4 $2, E $1,250 6 $1,621 3 $1,358 E $1, $1,323 1 $1,750 E $1, $1,570 4 $1,688 E E $1, $1, E $1,275 5 $1, E $ $1, $1,484 6 $1,873 E $1,125 2 $1, E $1, $1,319 1 $1,600 E E $1,217 2 $1,400 2 $1,338 E $1,450 E $1,288 3 $1, E $ E $1,013 2 $1, E E E $1,050 1 $1, E Total: $ $1, $1, $1,641 Townhouse E $1, E E E $1, $1,450 E $1,508 E E $1,600 E E $1, E $1,400 E $1,375 E $1,400 E $1,400 E $1,300 E $1,550 E $1,025 E E E E $1,750 E Total: $1,150 3 $1, $1,447 East Total: $ $1, $1, $1,541 4
5 Apt N $1,788 4 $1,938 N $1, $1, N $1, $1, $1,680 4 $2,088 N $2, N N $1,375 4 $1, N N $1, $1,648 1 $1,675 N $1,293 4 $1,125 1 $1,400 N $1, $1,738 2 $1,925 N N N N N N N N $1, N N N N N Total: $1, $1, $1, $1,919 Townhouse N $1,374 4 $2,008 N $1, $1,921 N $1,821 N $1,975 N N N $1,350 N N N $1, $1,659 N N N N N N N N N N N N N Total: $1,433 4 $1, $1,796 North Total: $1, $1, $1, $1,829 5
6 Apt W $1, $1, $1, W $1,098 5 $1,880 1 $2,200 W $1,450 1 $1,600 W $1,075 1 $1, W $1,263 9 $1, W $1, $2,005 2 $4,298 W $1,440 9 $1,806 1 $1,500 W $1, $1, $1,829 2 $1,625 W $1,359 1 $1,600 W $1, $1,352 2 $1,388 W $1, $1,973 2 $1,725 W $1,350 4 $1,469 1 $1,250 W $1,225 5 $1, W $1, $1, $1, $1,998 W $1,338 8 $1, W W $1,175 1 $1,300 W $1, $1,792 2 $1,275 W $1, $1, W $1,290 9 $2,025 1 $1,425 W $1,300 1 $1,450 W $1, $1,425 1 $1,600 W $1, $1,321 5 $1,385 W $1,117 3 $1, W W $1, W W $1, Total: 2, $1, $1, $1, $1,807 Townhouse W $1,650 1 $1,950 W $1,525 2 $1,700 W W $1,250 1 $1,375 W $1,000 5 $1,258 1 $1,600 W $1,748 4 $2,900 W W W $1, W $1, W $2,250 W $2,300 W $1,450 W $1,050 1 $1,350 4 $1,908 W $1,400 3 $1,567 W W $1,460 W $1, $1,540 W $1, $1, $1,629 W $1,375 2 $1, $1,719 W W $1, $1,467 W $1,417 W W W W W Total: $1, $1, $1,693 West Total: 6 2,393 1,118 6 $1, $1, $1, $1,722
7 7
8 1400 Don Mills Road Toronto, Ontario, Canada M3B 3N1
Sales & Average Price By Major Home Type 1,7 November 2013 Average Price Total Total
 November 2013 Economic Indicators Real GDP Growth i Q3 2013 t 2.7% Toronto Employment Growth ii October 2013 t 3.5% Toronto Unemployment Rate October 2013 t 8.0% Inflation (Yr./Yr. CPI Growth) ii October
Strong Sales/Price Growth Continue in 2012
 For All TREB Member Inquiries: (416) 4438152 January 2012 Economic Indicators Real GDP Growth i Q3 2011 t 3.5% Toronto Employment Growth ii December 2011 u 0.6% Toronto Unemployment Rate December 2011
Sales & Average Price By Major Home Type 1,7 August 2014 Average Price Total Total
 August 2014 Economic Indicators Real GDP Growth i Q2 2014 t 3.1% Toronto Employment Growth ii July 2014 u 0.6% Toronto Unemployment Rate July 2014 t 8.2% Inflation (Yr./Yr. CPI Growth) ii July 2014 u 2.1%
Sales & Average Price By Major Home Type 1,7 April 2013 Average Price Total Total
 Market Watch April 2013 Economic Indicators Real GDP Growth i Q4 2012 t 0.6% Toronto Employment Growth ii March 2013 t 4.1% Toronto Unemployment Rate March 2013 q 8.4% Inflation (Yr./Yr. CPI Growth) ii
Strong Average Price Growth in September
 September 2012 Economic Indicators Real GDP Growth i Q2 2012 t 1.8% Toronto Employment Growth ii August 2012 t 1.6% Toronto Unemployment Rate August 2012 q 8.5% Inflation (Yr./Yr. CPI Growth) ii August
Sales & Average Price By Major Home Type 1,7 October 2013 Average Price Total Total
 October 2013 Economic Indicators Real GDP Growth i Q2 2013 t 1.7% Toronto Employment Growth ii September 2013 t 4.2% Toronto Unemployment Rate September 2013 t 7.9% Inflation (Yr./Yr. CPI Growth) ii September
Sales & Average Price By Major Home Type 1,7 December 2014 Average Price Total Total
 December 2014 Economic Indicators Real GDP Growth i Q3 2014 t 2.8% Toronto Employment Growth ii November 2014 u 1.0% Toronto Unemployment Rate November 2014 u 7.8% Inflation (Yr./Yr. CPI Growth) ii November
Low-Rise Home Types Drive June Price Growth
 June 2012 Economic Indicators Real GDP Growth i Q1 2012 t 1.9% Toronto Employment Growth ii May 2012 t 1.6% Toronto Unemployment Rate May 2012 t 8.6% Inflation (Yr./Yr. CPI Growth) ii May 2012 u 1.2% Bank
Sales & Average Price By Major Home Type 1,7 April 2014 Average Price Total Total
 April 2014 Economic Indicators Real GDP Growth i Q4 2013 t 2.9% Toronto Employment Growth ii March 2014 t 2.1% Toronto Unemployment Rate March 2014 u 8.0% Inflation (Yr./Yr. CPI Growth) ii March 2014 t
Sales & Average Price By Major Home Type 1,7 August 2013 Average Price Total Total
 Market Watch August 2013 Economic Indicators Real GDP Growth i Q2 2013 t 1.7% Toronto Employment Growth ii July 2013 t 4.7% Toronto Unemployment Rate July 2013 q 7.8% Inflation (Yr./Yr. CPI Growth) ii
Sales & Average Price By Major Home Type 1,7 June 2014 Average Price Total Total
 June 2014 Economic Indicators Real GDP Growth i Q1 2014 t 1.2% Toronto Employment Growth ii May 2014 t 1.7% Toronto Unemployment Rate May 2014 t 7.6% Inflation (Yr./Yr. CPI Growth) ii May 2014 t 2.3% Bank
Tight Market Drives Double-Digit Price Growth
 March 2012 Economic Indicators Real GDP Growth i Q4 2011 t 1.8% Toronto Employment Growth ii February 2012 u 1.3% Toronto Unemployment Rate February2012 q 8.6% Inflation (Yr./Yr. CPI Growth) ii February
Average Home Price Up Strongly in 2012
 December 2012 Economic Indicators Real GDP Growth i Q3 2012 t 0.6% Toronto Employment Growth ii November 2012 t 4.1% Toronto Unemployment Rate November 2012 u 8.4% Inflation (Yr./Yr. CPI Growth) ii November
Detached 1,050 3,421 4,471 $1,042,405 $709,116 $787,388 Yr./Yr. % Change 4.3% 17.3% 14.0% 15.9% 10.0% 10.9%
 March 2015 Economic Indicators Real GDP Growth i Q4 2014 t 2.4% Toronto Employment Growth ii February 2015 u 1.0% Toronto Unemployment Rate February 2015 u 7.6% Inflation (Yr./Yr. CPI Growth) ii February
Average Price up in March and First Quarter
 March 2013 Economic Indicators Real GDP Growth i Q4 2012 t 0.6% Toronto Employment Growth ii February 2013 t 4.6% Toronto Unemployment Rate February 2013 t 8.4% Inflation (Yr./Yr. CPI Growth) ii February
Sales & Average Price By Major Home Type 1,7 January 2015 Average Price Total Total
 January 2015 Economic Indicators Real GDP Growth i Q3 2014 t 2.8% Toronto Employment Growth ii December 2014 u 0.2% Toronto Unemployment Rate December 2014 q 7.8% Inflation (Yr./Yr. CPI Growth) ii December
Sales & Average Price By Major Home Type 1,7 January 2014 Average Price Total Total
 January 2014 Economic Indicators Real GDP Growth i Q3 2013 t 2.7% Toronto Employment Growth ii December 2013 t 1.7% Toronto Unemployment Rate December 2013 t 8.4% Inflation (Yr./Yr. CPI Growth) ii December
Sales & Average Price By Major Home Type 1,7 February 2014 Average Price Total Total
 February 2014 Economic Indicators Real GDP Growth i Q4 2013 t 2.9% Toronto Employment Growth ii January 2014 t 1.6% Toronto Unemployment Rate January 2014 q 8.4% Inflation (Yr./Yr. CPI Growth) ii January
Sales & Average Price By Major Home Type 1,7 March 2014 Average Price Total Total
 March 2014 Economic Indicators Real GDP Growth i Q4 2013 t 2.9% Toronto Employment Growth ii February 2014 t 1.8% Toronto Unemployment Rate February 2014 u 8.3% Inflation (Yr./Yr. CPI Growth) ii February
Note: the Rent Review Guideline mandates an increase of 2.6% for 2000, and 2.9% for Sales 2, Dwelling Type Single Detached Semi Detached
 November 2000 4,880 Houses Change Hands in Remarkable November Toronto Friday, December 1, 2000 In November, TREB recorded 4,880 houses sold through its MLS system, President Marilyn Baubie reported today.
February Price Growth Continues in February. Economic Indicators. TorontoMLS Sales Activity 1,7. TorontoMLS Average Price 1,7 $510,580 $500,249
 February 2013 Economic Indicators Real GDP Growth i Q4 2012 t 0.6% Toronto Employment Growth ii January 2013 t 4.6% Toronto Unemployment Rate January 2013 u 8.2% Inflation (Yr./Yr. CPI Growth) ii January
Sales & Average Price By Major Home Type 1,7 July 2012 Average Price Total Total
 July 2012 Economic Indicators Real GDP Growth i Q1 2012 t 1.9% Toronto Employment Growth ii June 2012 t 0.2% Toronto Unemployment Rate June 2012 q 8.6% Inflation (Yr./Yr. CPI Growth) ii June 2012 t 1.5%
Sales & Average Price By Major Home Type. Metrics Sales Average Price Total Total
 Market Watch February 2016 Economic Indicators i Real GDP Growth Q4 2015 0.8% Toronto Employment Growth ii January 2016 Month Mortgage Rates February 2016 2016 1 Year -- 3 Year -- 5 Year -- 4.8% Toronto
Metrics Sales Average Price Total Total
 Market Watch August 2018 Economic Indicators i Real GDP Growth Q2 2018 2.9% For All TREB Member Inquiries: (416) 443-8152 For All Media/Public Inquiries: GTA REALTORS Release August Stats TORONTO, ONTARIO,
Sales & Average Price By Major Home Type November 2015 Metrics Sales Average Price Total Total
 Market Watch November 2015 Economic Indicators i Real GDP Growth Q3 2015 2.3% Toronto Employment Growth ii October 2015 Month Mortgage Rates November 2015 1 Year 3 Year 5 Year -- -- 4.5% Toronto Unemployment
Sales & Average Price By Major Home Type 1,7 February 2012 Average Price Total Total
 February 2012 Economic Indicators Real GDP Growth i Q4 2011 t 1.8% Toronto Employment Growth ii January 2012 u 0.9% Toronto Unemployment Rate January 2012 q 8.6% Inflation (Yr./Yr. CPI Growth) ii January
Sales & Average Price By Major Home Type. Metrics Sales Average Price Total Total
 Market Watch January 2016 Economic Indicators i Real GDP Growth Q3 2015 2.3% Toronto Employment Growth ii December 2015 4.5% Toronto Unemployment Rate December 2015 -- 7.0% Strong Start to 2016 For All
Detached 986 3,143 4,129 $793,842 $597,404 $644,313 Yr./Yr. % Change 20.7% 19.6% 19.8% 6.5% 8.0% 7.6%
 July 2013 Economic Indicators Real GDP Growth i Q1 2013 t 2.5% Toronto Employment Growth ii June 2013 t 5.1% Toronto Unemployment Rate June 2013 u 7.8% Inflation (Yr./Yr. CPI Growth) ii June 2013 t 1.2%
Sales & Average Price By Major Home Type December 2015 Metrics Sales Average Price Total Total
 Market Watch December 2015 Economic Indicators i Real GDP Growth Q3 2015 2.3% Toronto Employment Growth ii November 2015 Month Mortgage Rates December 2015 1 Year -- 3 Year -- 5 Year -- 4.1% Toronto Unemployment
Real Estate Indicators Summary
 real estate 110 Real Estate Indicators Summary Housing Starts Date Value Change/Rate (%) Year-to-Date Year-Over-Year C hange; YTD September 2018 Geography 8,919 6.3% Calgary CMA Total Monthly Value of
Real Estate Indicators Summary
 real estate 103 Real Estate Indicators Summary Housing Starts Date Value Change/Rate (%) Year-to-Date Year-Over-Year C hange October 2017 Geography 9,347 24.2% Calgary CMA Total Value of Building Permits
Market Watch. The Toronto Real Estate Board
 For Further Information: 443-8152 September, 1997 The Toronto Real Estate Board 7000 6000 5000 4000 3000 2000 1000 25000 20000 15000 10000 0 Jan 5000 0 Number of MLS Sales S.F.D P.O.T. Feb Mar Apr May
2017 Asheville and Buncombe County Real Estate Market Analysis
 2017 Asheville and Buncombe County Real Estate Market Analysis Summary This report examines the Asheville and Buncombe County residential real estate market for 2017 and compares the current real estate
Number of New MLS Listings Single-Family Residential Breakdown 21.8%
 For Further Information: 443-8152 November, 1998 The Toronto Real Estate Board 7000 6000 5000 4000 3000 2000 1000 0 Jan Feb Mar Number of MLS Sales S.F.D P.O.T. Apr May June July Aug Sept Oct Nov Dec TREB
The Toronto Real Estate Board. Single-Family Residential Breakdown
 May, 1996 The Toronto Real Estate Board 7000 6000 5000 4000 3000 2000 1000 0 Jan Number of MLS Sales S.F.D P.O.T. Feb Mar Apr May June July Aug Sept Oct Nov Dec Number of New MLS Listings May sales mark
Hawai i Timeshare Quarterly April - June 2018
 Statewide Timeshare Performance & es During the second quarter of 2018, Hawai i s timeshare industry achieved an 91.5% occupancy rate, an increase of 1.6 percentage points compared with the same period
Strong market sustained in April
 The Toronto Real Estate Board April, 1996 Strong market sustained in April 7000 6000 5000 4000 3000 2000 1000 0 Jan Feb Mar Number of MLS Sales S.F.D P.O.T. Apr May June July Aug Sept Oct Nov Dec TORONTO
Hawai i Timeshare Quarterly July - September 2018
 Statewide Timeshare Performance & es During the third quarter of 2018, Hawai i s timeshare industry achieved an 90.1% occupancy rate, unchanged compared with the same period during 2017. The statewide
Increase in CBD demand causes asking rates to rise
 MARKETVIEW Norfolk Office, Q4 16 Increase in CBD demand causes asking rates to rise Rate.2% CBD Rate.1% Asking Rate $18.85 PSF FS (10,707) SF 190,080 SF *Arrows indicate change from previous quarter. Figure
Market Watch. 1997: Best year for the decade! The Toronto Real Estate Board
 For Further Information: 443-8151 December, 1997 The Toronto Real Estate Board 7000 6000 5000 4000 3000 2000 1000 25000 20000 15000 10000 0 Jan 5000 0 Number of MLS Sales S.F.D P.O.T. Feb Mar Apr May June
Market Watch. Hot market continues through June. The Toronto Real Estate Board. Single-Family Residential Breakdown
 For Further Information: 443-8151 June, 1997 The Toronto Real Estate Board 7000 6000 5000 4000 3000 2000 1000 25000 20000 15000 10000 0 Jan 5000 0 30000 Number of MLS Sales S.F.D P.O.T. Feb Mar Apr May
Prices Stable, Sales Ease in June
 June 2002 Prices Stable, Sales Ease in June TORONTO Thursday, July 4, 2002. Average prices climbed moderately in June, to $278,638 from May's $278,323, President Ann Bosley announced today. "As the summer
Neighbourhood Corner Kingsway
 July 2001 July is Another Record Month TORONTO Thursday, August 2, 2001. July 2001 was another record month, with 5807 sales passing through TREB s MLS system, TREB President David Pearce reported today.
McMaster University. Kitchener-Waterloo and Area Family Medicine Residency Program
 McMaster University Kitchener-Waterloo and Area Family Medicine Residency Program Living in Kitchener-Waterloo City of Kitchener City of Waterloo City of Kitchener Formerly known as the City of Berlin,
Thanksgiving Holiday Period Traffic Fatality Estimate, 2017
 Thanksgiving Holiday Period Traffic Fatality Estimate, 2017 Prepared by Research and Statistics Department National Safety Council November 13, 2017 Holiday period definition Thanksgiving is observed on
Gold Coast Residential Market and Commonwealth Games st Half 2018 Update
 Gold Coast Residential Market and Commonwealth Games 2018 1st Half 2018 Update Residential Market Agenda Gold Coast property market in figures Gold Coast market comparison Which are the top performing
Dufferin County Housing Market Update Orangeville November 24, 2015
 Dufferin County Housing Market Update Orangeville November 24, 2015 Housing market intelligence you can count on Dufferin County Core Housing Need 25% 2006 2011 20% 19.8% 20.1% 18.1% 15% 15.2% 10% 10.5%
UNITED KINGDOM BIRMINGHAM OFFICES QUARTER
 UNITED KINGDOM OFFICES QUARTER 4 2 TAKE-UP 753,329 SQ FT 113,713 KEY DEAL 118,240 SQ FT TO BCU AT BELMONT WORKS, EASTSIDE CITY CENTRE SERVICED OFFICES SQ FT HEADLINE RENT 33 PSF Take-up > Annual take-up
METROPOLITAN BOSTON DECEMBER Boston Area Roundup
 33 Arch Street, 28 th Floor Boston, Massachusetts 02110 +1 212 984 7125 Office METROPOLITAN BOSTON DECEMBER 2015 Boston Area Roundup The greater Boston area hotels reported increases in RevPAR for December
* plus a top up at rent review
 CENTRAL LONDON OFFICE MARKET - Q2 2015 WEST END CENTRAL LONDON OFFICE MARKET - Q2 2015 CITY Office rents and vacancy rates Quarterly take-up levels increased by 13% in Q2 2015 to reach 757,150 sq ft. This
December Release Date February 2015 Hotel Price Index
 December 2014 Release Date February 2015 1 Introduction The Emirate of Abu Dhabi is one of the most attractive tourist destinations in the Middle East because of the developed infrastructure and quality
2016 Commercial Real Estate. Review and Forecast
 2016 Commercial Real Estate Review and Forecast February 4, 2016 Colliers International Saskatchewan Economic Overview Real GDP Growth 6.0% 2014 2015 2016f 5.0% 4.0% 3.0% 2.0% 1.0% 0.0% -1.0% Vancouver
Key Stats. Of 11 peer cities assessed, Calgary has the second highest level of economic power comparing GDP per capita
 economy 20 Key Stats Of 11 peer cities assessed, Calgary has the second highest level of economic power comparing GDP per capita - Deloitte, Benchmarking Calgary s Competitiveness, 2015 Of 11 peer cities
TECHNOLOGY QUALITY OF LIFE CAREER CHOICES INNOVATION GTA RAPID TRANSIT URBAN LIVING TOP RANKED SCHOOLS FUN HOUSING OPTIONS ARTS NATURE STYLE CULTURE
 CAREER CHOICES INNOVATION QUALITY OF LIFE TECHNOLOGY HOUSING OPTIONS ARTS CULTURE URBAN LIVING GTA RAPID TRANSIT TOP RANKED SCHOOLS FUN NATURE STYLE DIVERSITY MARKHAM VAUGHAN RICHMOND HILL NEWMARKET AURORA
PKF Consulting Canada
 PKF Consulting Canada July 27, 2015 Carol Caputo Executive Director Ontario s Algoma Country 334 Bay Street Sault Ste. Marie, ON P6A 1X1 Via e mail: carol@algomacountry.com RE: ALGOMA COUNTRY ACCOMMODATION
Nichewaug Inn & Academy Property
 Nichewaug Inn & Academy Property Petersham, MA Public Information Meeting #3 Concord Square Planning & Development, Inc. Albert, Righter & Tittmann Architects, Inc. Bonz & Company Douglas MacLeay September
Portfolio. income at ANZ income was up. With. first-half. share
 NZX and media announcement 19 February 2013 Precinct announces improvedi result and positive outlook Performance for six months to 31 December 2012 Financial Performance Net profit after tax: $23.6 millionn
1 st and 2 nd Quarters 2018 Asheville and Buncombe County Real Estate Market Analysis
 1 st and 2 nd Quarters 2018 Asheville and Buncombe County Real Estate Market Analysis Summary The housing market in Asheville and Buncombe County had fewer home sales in the 2 nd quarter of 2018 compared
Total expenditure by international tourists visiting Spain in March rose by 10.0% compared with the same month last year 1
 5 May 2016 Tourist Expenditure Survey March 2016. Provisional data Total expenditure by international tourists visiting Spain in March rose by 10.0% compared with the same month last year 1 Average expenditure
Ontario Tourism Facts & Figures
 Winter 2006 Vol. 5, No. 4 Ontario Tourism Facts & Figures In This Issue Economic Outlook Canada and Ontario Tourism Statistics International Travel Account International Border Crossings Accommodations
95 KING STREET EAST, TORONTO
 95 KING STREET EAST, TORONTO OFFICE FOR LEASE LOCATED ON KING STREET EAST, AT CHURCH STREET FOR MORE INFORMATION PLEASE CONTACT ASHLAR URBAN REALTY INC. Real Estate Brokerage 166 Pearl Street, Suite 300
Industry Update. ACI-NA Winter Board of Directors Meeting February 7, 2018 Palm Beach Gardens, FL
 Industry Update ACI-NA Winter Board of Directors Meeting February 7, 2018 Palm Beach Gardens, FL 1Q2007 2Q2007 3Q2007 4Q2007 1Q2008 2Q2008 3Q2008 4Q2008 1Q2009 2Q2009 3Q2009 4Q2009 1Q2010 2Q2010 3Q2010
95 KING STREET EAST, TORONTO
 95 KING STREET EAST, TORONTO OFFICE FOR LEASE LOCATED ON KING STREET EAST, AT CHURCH STREET FOR MORE INFORMATION PLEASE CONTACT ASHLAR URBAN REALTY INC. Real Estate Brokerage 166 Pearl Street, Suite 300
JETNET Releases December 2017 and the Year 2017 Pre-Owned Business Jet, Business Turboprop, Helicopter, and Commercial Airliner Market Information
 PRESS RELEASE For Immediate Release JETNET Releases December 2017 and the Year 2017 Pre-Owned Business Jet, Business UTICA, NY JETNET LLC, the leading provider of aviation market information, has released
December 2012 Passenger and Cargo Traffic Statistics Reno-Tahoe International Airport
 December 2012 Passenger and Cargo Traffic Statistics Reno-Tahoe International Airport January 29, 2013 U.S. DOMESTIC INDUSTRY OVERVIEW FOR DECEMBER 2012 All RNO Carriers Systemwide year over year comparison
Hawai i Hotels Statewide Set New Annual Records in 2017 for Revenue Per Available Room and Average Daily Rate
 For Immediate Release: January 25, 2018 HTA Release (18-11) Hawai i Hotels Statewide Set New Annual Records in 2017 for Revenue Per Available Room and Average Daily Rate Statewide Average Daily Rate Rose
PARK PLAZA M O T E L / D E V E L O P M E N T
 PARK PLAZA MOTEL/DEVELOPMENT QUEEN ANNE WALLINGFORD FREMONT PARK PLAZA MOTEL/DEVELOPMENT OFFERING The property offers an investor or developer the opportunity to own a 13,000+ square foot rectangular lot
3rd QUARTER STATISTICAL REPORT
 3rd QUARTER STATISTICAL REPORT RESEARCH DEPARTMENT 2015 OVERVIEW OF SOURCE MARKETS For the 3rd Quarter of 2015, some 129,050 tourists visited the shores of Barbados. This represented a 14.9% increase or
Type Room Address Comments Price Contact Room Niagara Falls Room available in new house, laundry, kitchen
 Available Housing List May 17, 2017 Project SHARE Regular Office Hours: Monday to Friday- 8:30am to 4:30pm Shelters *after hours contact 211 for emergency shelter referrals Southridge Shelter (co-ed) 201
Lodging Outlook. Canadian August What Does a Franchise Cost? computers and reservation personnel.
 Canadian August 2005 Lodging Outlook SMITH TRAVEL RESEARCH What Does a Franchise Cost? By: Stephen Rushmore, MAI, CHA - HVS International - New York T he selection of an appropriate hotel franchise affiliation
2016 CENSUS BULLETIN #1 POPULATION & DWELLING COUNTS
 CENSUS BULLETIN #1 POPULATION & DWELLING COUNTS February 8 th, 2017 Bulletin Highlights: Brampton s : Brampton is 9 th largest City in Canada Brampton is 4 th largest City in Ontario Brampton is 3 rd largest
RESEARCH INDUSTRIAL SNAPSHOT
 RESEARCH INDUSTRIAL SNAPSHOT GREATER LONDON AND WESTERN HOME COUNTIES H2 2017 GREATER LONDON & WESTERN HOME COUNTIES LOGISTICS & INDUSTRIAL RESEARCH Introduction As the UK economy continues to grow so
NUNAVIK'S LABOUR MARKET AND EDUCATIONAL ATTAINMENT PARADOX
 NUNAVIK'S LABOUR MARKET AND EDUCATIONAL ATTAINMENT PARADOX Andrew Sharpe and Jasmin Thomas Presentation prepared for Mapping the Road Together to Sustainable Employment; Celebrating 25 Years. Katittavik
2009 Muskoka Airport Economic Impact Study
 2009 Muskoka Airport Economic Impact Study November 4, 2009 Prepared by The District of Muskoka Planning and Economic Development Department BACKGROUND The Muskoka Airport is situated at the north end
ALL ADS ARE PULLED FROM KIJIJI.CA UNLESS OTHERWISE STATED
 Available Housing List June 28, 2018 ALL ADS ARE PULLED FROM KIJIJI.CA UNLESS OTHERWISE STATED Project SHARE Regular Office Hours: Monday to Friday- 8:30am to 4:30pm Shelters *after hours contact 211 for
RESEARCH INDUSTRIAL SNAPSHOT
 RESEARCH INDUSTRIAL SNAPSHOT GREATER LONDON AND WESTERN HOME COUNTIES H1 2017 GREATER LONDON & WESTERN HOME COUNTIES LOGISTICS & INDUSTRIAL RESEARCH Introduction Our report provides an insight into the
Winnipeg Market Report
 Winnipeg Market Report New hotel development in Winnipeg is picking up again By Bryce Witherspoon, Stevenson Advisors The opening of the Mere Hotel on Waterfront Drive (2013), the Homewood Suites by Hilton
LIVERPOOL CITY CENTRE. Commercial Office Market Review 2005
 LIVERPOOL CITY CENTRE Commercial Office Market Review 2005 SUMMARY Liverpool s office market is changing beyond recognition, with newly-built offices, increasing demand from professional and financial
BRANTFORD AIRPORT BOARD MINUTES MONDAY OCTOBER 19, :15 P.M. - BRANTFORD MUNICIPAL AIRPORT
 BRANTFORD AIRPORT BOARD MINUTES MONDAY OCTOBER 19, 2015 12:15 P.M. - BRANTFORD MUNICIPAL AIRPORT Bob Coyne in the Chair 12:20 p.m. Brantford Municipal Airport Flight Training Room 1. ROLL CALL PRESENT:
1450 DON MILLS ROAD FOR LEASE > YORK MILLS VALLEY CENTRE. Building Features. Building Details TORONTO, ONTARIO
 FOR LEASE > YORK MILLS VALLEY CENTRE 450 DON MILLS ROAD TORONTO, ONTARIO Building Features > Market leading floorplate size, all floors are divisible > Centre atrium providing natural light throughout
Hotel. Price Index. November Released Date: January Hotel Price Index
 Hotel Price Index November 2015 1 Released Date: January 2016 Introduction The Emirate of Abu Dhabi is one of the most attractive tourist destinations in the Middle East because of the developed infrastructure
HOTEL PARKING ARE YOU MAKING THE MOST OUT OF THIS REVENUE SOURCE?
 CANADIAN MONTHLY LODGING OUTLOOK SEPTEMBER 2012 HOTEL PARKING ARE YOU MAKING THE MOST OUT OF THIS REVENUE SOURCE? www.hvs.com HVS IN CANADA 6 Victoria Street, Toronto, ON M5E 1L4, CANADA Suite 400 145
Investing in Brampton s downtown
 Investing in Brampton s downtown 1 REVITALIZING DOWNTOWN BRAMPTON The Next Chapter Public Information Session November 2, 2011, 7 9 pm AGENDA Welcome and opening remarks: City of Brampton Southwest Quadrant
DISCLAIMER. Please contact with any questions. Altus Group Limited altusgroup.com/datasolutions
 DISCLAIMER This presentation, or any part thereof, may not be reproduced or transmitted in any form by any means, without the express written permission of Altus Group in each instance. The material in
Copa Holdings Reports Net Income of $49.9 million and EPS of $1.18 for the Second Quarter of 2018
 Copa Holdings Reports Net Income of $49.9 million and EPS of $1.18 for the Second Quarter of 2018 Panama City, Panama --- Aug 8, 2018. Copa Holdings, S.A. (NYSE: CPA), today announced financial results
Type Room Address Comments Price Contact Room
 Available Housing List October 23, 2017 Project SHARE Regular Office Hours: Monday to Friday- 8:30am to 4:30pm Shelters *after hours contact 211 for emergency shelter referrals Southridge Shelter (co-ed)
DOWNTOWN, CHARLOTTE AMALIE
 TOTAL VISITOR ARRIVALS TO THE USVI : DECEMBER YEAR TO DATE DECEMBER TOTAL VISITOR ARRIVALS 2,85, 2,8, 2,814,257 2,75, 2,7, 2,65, 2,6, 2,642,118 2,71,542 2,648,5 2,55, 212 213 214 215 Visitor arrivals ended
PIZZA HUT & WINGSTREET
 PIZZA HUT & WINGSTREET NNN Investment 257 South Marschall Road Shakopee, Minnesota 55379 7486 La Jolla Boulevard, Suite 173 La Jolla, California 92037 EXECUTIVE SUMMARY PROPERTY Pizza Hut & WingStreet
QUARTERLY UPDATE 31 MARCH 2017
 AUSTRALIAN PROPERTY OPPORTUNITIES FUND QUARTERLY UPDATE 31 MARCH 2017 The Australian Property Opportunities Fund (APOF I or the Fund) is pleased to provide this update for the March quarter 2017 (Q1 2017)
Introduction. Hotel Price Index
 1 Introduction The tourism sector in the United Arab Emirates became one of the most important sectors that have evolved remarkably in recent years. The Emirate of Abu Dhabi is one of the most attractive
PEAK DOWNTURN UPSWING TROUGH RECOVERY
 MARKET OUTLOOK PROPERTY CYCLE UPSWING PEAK TROUGH DOWNTURN RECOVERY TEN CYCLES SINCE 1880 AVERAGE 8 YEARS 5 YEARS UPSWING @ 11% pa 3 YEARS DOWNTURN @ - 5% pa PAST CYCLES AVG 8.5% PA PROPERTY CYCLE? 1.
Class A Lents Town Center Retail
 FOR LEASE Stunning Mixed-Use Project with 7,435 SF Retail High Visibility Corner with Excellent Traffic Counts Delivers Q1 2018 Features PROJECT INFORMATION Since the formation of the Lents Urban Renewal
Copa Holdings Reports Net Income of $136.5 million and EPS of $3.22 for the First Quarter of 2018
 Copa Holdings Reports Net Income of $136.5 million and EPS of $3.22 for the First Quarter of 2018 May 9, 2018 PANAMA CITY, May 9, 2018 /PRNewswire/ -- Copa Holdings, S.A. (NYSE: CPA), today announced financial
AIR CANADA REPORTS IMPROVED FOURTH QUARTER 2006 AND FULL YEAR 2006 RESULTS
 AIR CANADA REPORTS IMPROVED FOURTH QUARTER 2006 AND FULL YEAR 2006 RESULTS In accordance with Canadian GAAP Accounting Guideline No. 15 Air Canada is required to consolidate the financial statements of
GRANT THORNTON BANKERS BOOT CAMP
 GRANT THORNTON BANKERS BOOT CAMP Where are we in the cycle? Yield compression slowing, rents growing Yields bottoming but the bottom could last till 2020 The end of yield compression brings income return
Moderator: Greg Guatto, President & CEO, Aspen Properties
 Session C2 2:10pm ONE SIZE DOES NOT FIT ALL: UNDERSTANDING THE FACTS & FALLACIES BETWEEN EDMONTON & CALGARY AND HOW THEY ARE PERFORMING IN TODAY S ECONOMY Moderator: Greg Guatto, President & CEO, Aspen
YEAR-END REVIEW INDUSTRIAL MARKET REPORT GREATER MONTREAL AREA 2017 YEAR-END REVIEW INDUSTRIAL MARKET REPORT GREATER MONTREAL
 YEAR-END PAGE 1 YEAR-END GREATER MONTREAL YEAR-END Trends are slowly shifting in the Montreal industrial market. With the strong absorption observed over the past year, reaching nearly 1.7 million square
THE PARK AT CANYON RIDGE
 THE PARK AT CANYON RIDGE 272 UNITS NEAR DTC & FITZSIMONS DENVER, COLORADO EXECUTIVE SUMMARY HFF is pleased to present the opportunity to acquire The Park at Canyon Ridge ( Property ), a 272-unit, garden-style
MAPLEWOOD VILLAGE CENTRE AND INNOVATION DISTRICT IMPLEMENTATION PLAN & DESIGN GUIDELINES. November 6, 2017 Regular Meeting of Council
 MAPLEWOOD VILLAGE CENTRE AND INNOVATION DISTRICT IMPLEMENTATION PLAN & DESIGN GUIDELINES November 6, 2017 Regular Meeting of Council Recommendation THAT Council: Approve the Maplewood Village Centre and
TRANSIT WINDSOR REPORT
 TRANSIT WINDSOR REPORT MISSION STATEMENT: PROVIDING SAFE, RELIABLE AND AFFORDABLE PUBLIC TRANSIT FOR THE COMMUNITY THROUGH CONTINUOUS IMPROVEMENT IN CUSTOMER CARE, ENVIRONMENTAL STEWARDSHIP AND EMPLOYEE