Visitor Attraction Trends in England Full Report
|
|
|
- Merry Parks
- 5 years ago
- Views:
Transcription


1 Visitor Attraction Trends in England 011 Full Report
2 Acknowledgements VisitEngland would like to thank all representatives and operators in the attraction sector who provided information for the national survey on which this report is based. For a number of attractions, data has been included with kind permission of ALVA (Association of Leading Visitor Attractions), English Heritage, Arts Council England and The National Trust as well as several Destination Management Organisations. Where relevant this has been referenced in the report. No part of this publication may be reproduced for commercial purposes without previous written consent of VisitEngland. Extracts may be quoted if the source is acknowledged. Statistics in this report are given in good faith on the basis of information provided by proprietors of attractions. VisitEngland regrets it cannot guarantee the accuracy of the information contained in this report nor accept responsibility for error or misrepresentation. Published by VisitEngland (incorporated under the 199 Development of Tourism Act as the British Tourist Authority) 01 British Tourist Authority (trading as VisitBritain). VisitEngland is grateful to English Heritage for their financial support for the 011 survey. July 01 1
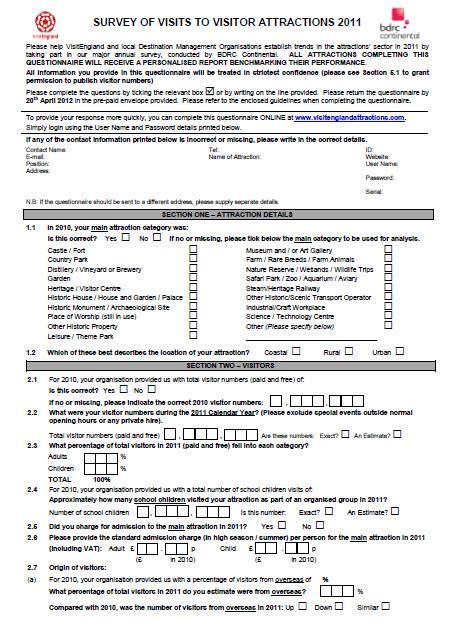
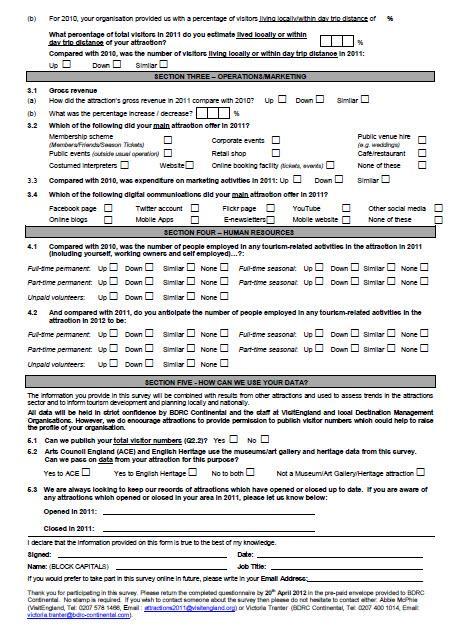
3 Introduction This report presents the findings of the Survey of Visits to Visitor Attractions undertaken in England by VisitEngland. The report provides a comprehensive England-wide analysis of trends plus visits data for individual attractions. Objectives To monitor trends in the visitor attraction sector in England and to improve understanding of the dynamics of the sector. Findings contribute to estimates of the economic impact of tourism and inform development and planning work. Results allow operators to benchmark their operation within their category, within their region and across the sector as a whole. Survey Method Attractions have the option of either online or postal survey completion. All attractions for whom contacts are held are sent an invitation with a link to their attraction s online questionnaire. Attractions not responding are subsequently sent a postal questionnaire alongside attractions with no or only generic contacts. A copy of the questionnaire is appended. BDRC Continental holds the contract for the survey in England and is responsible for the preparation of this report. It is important to highlight that major individual attractions can have a significant impact upon the proportion of visits within each region and attraction category. Their participation or nonparticipation in the survey year-on-year can result in significant fluctuations in the data within each region and attraction category. Visitor Attraction Definition an attraction where it is feasible to charge admission for the sole purpose of sightseeing. The attraction must be a permanently established excursion destination, a primary purpose of which is to allow access for entertainment, interest, or education and can include places of worship (but excludes small parish churches); rather than being primarily a retail outlet or a venue for sporting, theatrical, or film performances. It must be open to the public, without prior booking, for published periods each year, and should be capable of attracting day visitors or tourists as well as local residents. In addition, the attraction must be a single business, under a single management, so that it is capable of answering the economic questions on revenue, employment etc.
4 Response by attraction category Category Number of attractions that provided data Country Parks 7 Farms Gardens 109 Historic properties 0 Leisure / theme parks Museums / art galleries Steam / heritage railways 7 Sample and Response 7,9 English visitor attractions were invited to take part in the 011 survey. 1,9 English visitor attractions provided visits figures for the year completed online 8 completed by post 1 provided data through umbrella organisations 1,809 attractions provided admissions for both 011 and 010 and these attractions form the basis of this report s trend evaluation. Visitor / heritage centres 87 Wildlife attractions / zoos 8 Workplaces Places of worship 10 Other 187 Total 1,9
5 Headlines (1) 011 remembered for a warm Spring and Autumn, contrasting with an indifferent Summer Attractions reported a +% annual increase in total visits in 011 Child visits also increased by +% Schoolchildren visits increased by +%. Outdoor attractions reported the strongest increases in visits in 011, particularly gardens and wildlife attractions Attractions charging admissions (+%) reported stronger increases in visits than free attractions (+1%) The smallest attractions with 0,000 or fewer visits per annum continue to struggle to keep pace with larger attractions, visits increasing by less than 0.% among this group Adult entry charges to paid attractions increased by +% in 011, with child charges increasing by +7% Gross revenue for attractions increased by an average of +% in 011 Fewer attractions are increasing their marketing spend (19%) now than five years ago (%) Two-thirds (%) of attractions offered some form of digital communications in has seen a major shift in the nature of employment within attractions: towards the voluntary sector (% are employing more) and away from full-time permanent staff (1% are employing fewer)
6 Headlines () Services offered by attractions in 011: 77% website 8% retail shop % public events 0% membership scheme % café/restaurant % venue hire % corporate events 18% online booking 1% costumed interpretation
7 011 Weather Summary (source: Met Office) The year 011 will be remembered for a warm Spring and Autumn, contrasting with an indifferent Summer. Sunshine was % above average, mean temperatures 1ºC higher than average and rainfall 1% below average for the year. Winter 010/11: Whilst less cold than 009/10 this was still the second coldest Winter for 1 years, with December particularly cold (although much drier and sunnier than normal). February was much warmer and wetter than average. Spring 011: Summer 011: Autumn 011: The warmest Spring for 100 years, with mean temperatures ºC above normal, sunshine 7% higher and rainfall less than half what would usually be expected. April was particularly warm and sunny. Characterised by much cooler than average temperatures (being the coolest since 199), slightly below average sunshine (-7% on normal) and above average rainfall (+1% on normal). England was generally wetter than 010 but not as wet as Summers. August was particularly lacking in sunshine. The second warmest in the last 100 years, with late September / early October setting new temperature records and November also well above average. Sunshine was 8% above average and rainfall only around two-thirds of normal (although higher in the North West).
8 Visitor admission trends
9 Visitor admission trends 8 Annual % change in visits Attractions reported a +% annual increase in total visits in 011 (adults and children). Child visits also increased by +% and schoolchildren visits by +%. Attractions are likely to have benefited from a +% increase in domestic overnight holiday trips in England in 011 (source: GBTS), with increases particularly strong in the second half of the year. 1 -* There was also a +% uplift in holiday visits to England from abroad (source: IPS) After two years of strong declines in outbound trips away from the UK, visits abroad increased slightly in 011 (by +1%). However, visits have not returned to any where near the levels of 009, implying potential for domestic day trips among those who might ordinarily be holidaying abroad. Base: All attractions providing visits data for current and previous year (1,809 in 011). 8
10 Visitor admission trends 011 by attraction category Country parks Farms Gardens Historic houses / castles Other historic properties Leisure / theme parks All attractions average (%) /10 change (%) was a positive year for outdoor attractions, especially gardens and wildlife attractions. This perhaps reflects the unusually warm, dry weather in the shoulder periods which had the effect of extending the season for many. Outdoor attractions bounced back from a generally challenging year in 010 when the Summer period was characterised by dull weather. Conversely, museums / art galleries experienced a challenging year with visits down -1% overall, following a positive year in 010. Museums / art galleries Steam / heritage railways Visitor / heritage centres Places of worship experienced another positive year, following strong increases in visits of +%, +% and +% in each of the three previous years. Wildlife attractions / zoos 9 - Workplaces -* + Places of worship 7 + Other + Base: All attractions providing visits data in both 010 and 011 (1,809) 9
11 Index of visits to attractions sectors outperforming market 0 0 TOTAL ENGLAND ATTRACTIONS Country parks Workplaces Gardens Museums/art galleries Visitor/heritage centres Farms
12 Index of visits to attractions sectors outperforming market Index Calculation The charts presented on slides 9 and 11 show the indexed visits trend for each attraction category. The base year for the index is 1989, with the index set at 100 for that year. Annual percentage changes in visits are subsequently applied to this index e.g. visits to museums / art galleries increased +% between 1989 and 1990, increasing the index for 1990 to 10. Because the number of attractions responding each year differs, the percentage change between any two years is applied each time to the previous year s index to take account of varying sample sizes each year. Operators are asked in each survey year to provide the number of visits for both the survey year and previous year. This enables the trend between any two years to be calculated based on the same attractions. The chart shows the attraction categories which have shown above average annual visit increases since Across England attractions as a whole, visits have increased 7% in that time. Farms have seen the greatest increase in visits, particularly in the last ten years, since the Foot and Mouth outbreak of 001. Visitor / heritage centres and gardens have also seen very strong increases overall. The popularity of workplaces peaked in the mid 000s and is now declining once again. Visits to museums / art galleries overall are now over 0% higher than they were on the introduction of free entry to national museums in 001. Recent DCMS data on visits to former charging sponsored museums indicate that this increase has been primarily driven by visits to these museums. These figures state that visits to former charging sponsored London museums were up by +11% in the past ten years and those outside London by +18%. 11
13 Index of visits to attractions sectors under performing against market 0 0 TOTAL ENGLAND ATTRACTIONS Leisure / theme parks Wildlife attractions / zoos Historic properties Steam / heritage railways
14 Index of visits to attractions sectors under performing against market Although underperforming against the rest of the sector, visitors to historic properties (including places of worship) have shown some signs of strong visit increases since 008. Visits are now 0% higher than in 008, having been tracking at below 1989 levels for many years. Visits to wildlife attractions / zoos have also shown some encouraging signs of growth in recent years. Visits to leisure / theme parks have rather stagnated over the past six years, although it should be noted that attractions operated by Merlin Entertainments are not included in this survey. 1
15 Visitor admission trends 011 by admission charge, geographic location and size Free All attractions average (%) 1 009/10 change (%) + The challenging year for museums / art galleries is reflected by the lower than average visit increases experienced by free attractions, many of which are museums / art galleries. Paid Coastal 1-1 -* Conversely, there is a preponderance of charging attractions within the attraction categories which have see large visit increases, particularly gardens, historic houses / castles and wildlife attractions. Rural Urban 0,000 visits or less * Rural attractions have also benefited from their attractions profile, with their higher proportion of historic houses / castles and gardens in particular. Urban attractions, with their high proportion of museums / art galleries have performed less well in ,001-0,000 visits 0,001-00,000 visits Over 00,000 visits -* +* + As has been the consistent case in recent years, the larger attractions with 0,000+ visits per annum have outperformed the smaller attractions with fewer than 0,000 visits, with visits to the very smallest attractions with fewer than 10,000 visits again declining by -1%, following a -% decline the year before. Base: All attractions providing visits data in both 010 and 011 (1,809) 1
16 Visitor admission trends 011 paid and free attractions ALL FREE ATTRACTIONS (7) Country parks () Farms (17) Gardens (10) Historic houses / castles () Other historic properties () Leisure / theme parks (7) Museums / art galleries (7) Steam / heritage railways () Visitor / heritage centres (0) Wildlife attractions/zoos () Workplaces () Places of worship (8) Free Attractions Other () -7 -* / 10 change (%) ALL PAID ATTRACTIONS (1,07) Country parks (11) Farms () Gardens (91) Historic houses / castles (19) Other historic properties (8) Leisure / theme parks () Museums / art galleries (0) Steam / heritage railways (1) Visitor / heritage centres (1) Wildlife attractions/zoos (8) Workplaces () Places of worship (9) Other (1) Paid Attractions / 10 change (%) * +1 -* +* * +1 Free attractions reported only a modest increase in visitor admissions in 011 (+1%). This was suppressed by a -1% decline in visits to free museums / art galleries which account for around half of all free attractions. The significant increase in visits to other historic properties was driven, as in 010, by a small number of large attractions. Paid attractions reported a stronger +% increase in visits for 011. This was driven by strong performances of outdoor attractions such as gardens and wildlife attractions / zoos and the revival of visits to historic houses / castles. Many of these bounced back from experiencing declines in 010. Paid museums / art galleries out-performed their free counterparts, seeing visits increase by +% in 011. Steam / heritage railways was the only category to decline within the paid attractions sector. Base: All attractions providing visits data in both 010 and 011 N.B. Figures in brackets represent sample sizes of attractions upon which data is based. 1
17 Visitor admission trends by region All attractions average (%) 009/10 change (%) North West North East Attractions in the East and South East performed most positively in 011. These regions benefited from the driest, sunniest weather during the year for their outdoor attractions and a return to the domestic staycation trends of 009. Yorks / Humber East Midlands West Midlands East * * London s attractions reported a more challenging year, reflecting its proliferation of indoor attractions, especially the major free national museums. Many of these experienced declines in visits in 011 following a strong performance the previous year. Perhaps a sign that budget cuts are beginning to bite in the sector, not helped by being the only region to experience a decline in domestic overnight stays in 011. London South East + + Only the North East attractions reported a decline overall, this following a similar decline in 010. This despite domestic overnight visits to the area increasing strongly in 011. South West +1 Base: All attractions providing visits data in both 010 and 011 (1,809) 1
18 Visitor admission trends 011 by attraction category within region % change 010 / 011 Region NW NE Y+H EM WM EAST LON SE SW Country parks n/a + + Farms Gardens Historic houses / castles Other historic properties Leisure / theme parks -7 n/a Museums / art galleries -* * - + Steam / heritage railways n/a +11 n/a + n/a + - Visitor / heritage centres * n/a - - Wildlife attractions / zoos Workplaces +* n/a * -9 n/a + +1 Places of worship +* Other N.B. Figures in grey represent data where there is less than attractions in the group. Results should therefore be treated with caution Base: All attractions providing visits data in both 010 and 011 (1,809) 17
19 Visitor admission trends 011 other regional dimensions % change 010 / 011 Free Paid Coastal Rural Urban North West 1 - North East Yorks / Humber -1 8 East Midlands West Midlands - n/a -1 East 9 10 London * 8 n/a 1 South East * South West All attractions +1% +% +1% +% +1% Base: All attractions providing visits data in both 010 and 011 (1,809) 18
20 Visitor admission trends 011 child visits summary Attractions with 0% or less children Over 0% children 0% or less schoolchildren All attractions average (%) 009/10 % change Attractions with over 0% of their visits accounted for by children (perhaps described as family attractions) experienced a +% increase in visits in 011, not dissimilar to the market overall. As in 010, attractions that were reliant on school visits found 011 more challenging, perhaps not surprising given that many of these are the free museums. Attractions with more than 0% of their visits accounted for by schoolchildren saw their total visits decline in 011. This was also the case in 010. Over 0% schoolchildren -1 - However, both child (+%) and schoolchildren (+%) visits did increase in 011 at a similar rate to total visits. Child admissions 010/11 % change As with total visits, attractions where there is a child admission charge (child visits up by +%) outperformed attractions where children go free (child visits up +1%) Schoolchildren admissions Schoolchildren visits increased by +% at attractions where children visit free versus +% among paid attractions. Base: All attractions providing visits data in both 010 and 011 (1,809) 19
21 Visitor admission trends 011 by visitor origin Overseas visitors Up Similar Down Compared with 010 (%) % in visits Attractions reported overseas visitors up by +% in 011, with twice as many attractions reporting an increase as a decrease. Over half (%) of overseas visits are accounted for by London attractions, with overseas visitors up by +% here. Attractions reported local visitors within day trip distance up by +% in 011, with the proportions reporting an increase also significantly outstripping those reporting a decrease. Local / day trippers Compared with 010 (%) Up 18 Similar Down 8 7 % in visits The implication is that visits made by domestic residents staying away from home have not increased by as much as these two markets. With almost a third (9%) of all visits accounted for by London attractions and GBTS data reporting a -% decline in domestic overnight trips to London, it is likely to be London which is driving the lower performance of this market. Base: All attractions responding ( c.1,00) 0
22 Visitor admission trends 011 overseas visitors by attraction category and region Attraction Category: overseas visitors % down % up Country parks Farms Gardens Historic houses / castles Other historic properties Leisure / theme parks Museums / art galleries Steam / heritage railways Visitor / heritage centres Wildlife attractions / zoos Workplaces Places of worship Other /11 % change % 9% 1% 10% 18% % % 1% 1% 1% % 9% % Region: overseas visitors % down % up North West North East Yorks / Humber East Midlands West Midlands East London South East South West /11 % change % 8% 11% 1% % % % 7% 8% Gardens, historic properties and wildlife attractions / zoos reported the largest increases in overseas visitors in 011, in line with increases in visits overall. Base: All attractions responding ( c.1,00) All regions experienced an increase in overseas visitors, with over a third of London attractions reporting a rise. The challenging year for London attractions therefore does not appear to have been driven by a lack of overseas visitors. 1
23 Visitor admission trends 011 overseas visitors by size and admission charge Admission Charge: overseas visitors % down % up 9 9 Free Paid /11 % change 1% 11% The increase in overseas visitors was driven primarily by paid admission attractions. Overseas visits increased by +11% among paid attractions, but just +1% among free attractions. Size: overseas visitors % down % up Up to 0k p.a. 0k 0k p.a. 0k 00k p.a % 1% 7% Overseas visitors were up across the board, with small as well as large attractions experiencing notable increases. Over 00k p.a. % Base: All attractions responding ( c.1,00)
24 Visitor admission trends 011 local / day trip visitors by attraction category and region Attraction Category: local visitors % down % up 0 Country parks Farms Gardens Historic houses / castles Other historic properties Leisure / theme parks Museums / art galleries Steam / heritage railways Visitor / heritage centres Wildlife attractions / zoos Workplaces Places of worship Other /11 % change Historic properties and wildlife attractions / zoos reported the largest increases in local visits in 011, in line with increases in visits overall. % % % 11% 1% 1% 1% % % 7% *% 1% 7% Region: local visitors % down % up North West North East Yorks / Humber East Midlands West Midlands East London South East South West /11 % change All regions experienced an increase in local visitors except London attractions which reported a -% decline. This decline in local visitors may be at least partly responsible for the lower than average performance of London attractions. % 8% 11% % 1% % % % % Base: All attractions responding ( c.1,00)
25 Visitor admission trends 011 local / day trip visitors by size and admission charge Admission Charge: local visitors 010/11 % change % down % up 8 Free 18 7 Paid 18 % % The increase in local visitors was driven primarily by paid admission attractions. Local visits increased by +% among paid attractions, but just +% among free attractions. Size: local visitors % down Up to 0k p.a. 0k 0k p.a. 0k 00k p.a. Over 00k p.a. % up % % 7% % Local visitors were up across the board, with small as well as with a large attractions experiencing notable increases. Base: All attractions responding ( c.1,00)
26 Admission charge and revenue trends
27 Adult admission charges 011 % Over Almost half (%) of attractions charging admission, charge or less for admission. Museums/art galleries (%) and other historic properties are the most likely attraction categories to charge or less for admission % of attractions in the North East also charge or less. Conversely, % of London attractions charge over for admission compared with % among attractions as a whole or less % of the very smallest attractions with 10,000 visits or fewer visitors per annum charge or less. Conversely, 8% of attractions with over 100,000 visitors charge over for admission. Not stated Base: Attractions charging for admission in 011 (1,1)
28 Adult admission charge trends 011 by attraction category ALL ATTRACTIONS Country parks Farms Gardens % increase in adult charge versus 010 Average 011 charge /10 change (%) The past four years have seen adult admission charges increase by % (011), % (010), % (009) and % (008). As in recent years, increases were not dissimilar across attraction categories. Historic houses / castles Other historic properties Leisure / theme parks Increases were lower among the very smallest attractions with fewer than 10,000 visitors per annum (+%). Museums / art galleries Steam / heritage railways Visitor / heritage centres Average child admission charges increased by an average of 7% in 011, slightly narrowing the gap between adult and child charges. Wildlife attractions / zoos Workplaces. +10 Places of worship Other Base: Attractions providing admission charge data for both 010 and 011 (8) 7
29 Adult admission charge trends 011 by region % change in adult admission charge All attractions average (+%) Average 011 charge 009/10 change (%) North West North East Yorks / Humber East Midlands Increases in adult admission charges were similar across all regions. Following admission increases of only +% in 010, London attractions saw similar average increases compared with the rest of England in 011. West Midlands East London London s attractions remain the most expensive, followed by the South East and North West. Attractions in the North East remain the least expensive to enter for adults. South East South West 7. + Base: All attractions providing admission charge data for both 010 and 011 (8) 8
30 Adult admission charge trends 011 by attraction size % change in adult admission charge Annual visits 10,000 or less p.a. 10,001 0,000 p.a. 0,001 0,000 p.a. 0, ,000 p.a. All attractions average (+%) 7 Average 011 charge /10 change (%) Smaller attractions with fewer than 0,000 visits p.a. appear to be responding to their more limited growth in visitor admissions by holding admission charges at a lower level. Admission charges among these smallest attractions increased by only +% in ,001 00,000 p.a. Over 00,000 p.a As in 010, attractions with between 0,001 and 0,000 visitors p.a. seem most bullish with their pricing. Once again, average admission charges in this category are higher than within the 0, ,000 visits p.a. category. Base: All attractions providing admission charge data for both 010 and 011 (8) 9
31 Adult admission charge trends 011 by geographic location and child admissions Coastal Rural Urban All attractions average (+%) Average 011 charge /10 change (%) There remains little difference in admission charges between attractions in different geographic locations, with average admission charges between 7 and 8 in each of coastal, rural and urban locations. Attractions with 0% or less child visits Over 0% child visits Family attractions appear to have been more bullish with pricing than non-family attractions in 011, increasing their admission charges by +7% on the previous year. Base: All attractions providing admission charge data for both 010 and 011 (8) 0
32 Gross revenue trend % change in gross revenue 8 Increases in gross revenue in 011 (+%) once again increased in line with increases in admission charges. Overall, 9% of attractions reported an increase compared with 19% reporting a decrease in gross revenue By way of comparison, the Consumer Price Index measure of inflation ran at an average of.1% for 011. North West North East Yorks / Humber - Despite seeing lower than average visit increases (+%), London attractions reported the highest increase in gross revenue, finding it easier to generate revenue than admissions this year. East Mids West Mids East 7 The North East was not only the single region to experience declines in visits, but also the only region to report a decline in gross revenue for its attractions. London South East South West 7 8 As with visitor admissions, gross revenue increases are stronger among the larger attractions with over 00,000 visits per annum (+7%) than the smaller attractions with fewer than 0,000 visits per annum (+%). Base: All attractions responding (1,) 1
33 Gross revenue trend 011 by attraction category Country parks Farms Gardens All attractions (+%) /10 % change In line with strong increases in visitor admissions, both gardens and farms have seen corresponding strong increases in gross revenue in 011. Historic houses / castles Other historic properties Leisure / theme parks Museums / art galleries Steam / heritage railways However, the strongest increase in gross revenue was reserved for steam / heritage railways, with an increase of +1% - despite decreasing visitor admissions. Information on secondary spend and events indicates that these attractions are much more likely to generate revenue in these other ways than many other attraction categories, perhaps explaining this strong increase. Visitor / heritage centres Wildlife attractions / zoos Workplaces Country parks and places of worship both saw gross revenue increasing below the average rate in 011. Places of worship 1 + Other 8 + Base: All attractions responding (1,)
34 Gross revenue trend 011 by admission charge and visit volume Admission Charge Free Paid All attractions (+%) 009/10 % change + + As has been the case in recent years, it is paid attractions that contribute most strongly towards increasing gross revenue. Annual visit volume Up to 0k p.a. 0k 0k p.a. 0k 00k p.a. Over 00k p.a. 7 Reflecting the more positive performance in terms of visitor admissions, larger attractions also outperform the smaller attractions in terms of gross revenue although perhaps not by as much as one might expect. Base: All attractions responding (1,)
35 Gross revenue trend 011 by geographical location and child visits Geographic location All attractions (+%) 009/10 % change Coastal Rural Urban Child visits There was very little difference in gross revenue trends between coastal, rural and urban attractions in 011. All increased their gross revenue by an average of +%. Similarly, those attractions with a significant proportion of child visitors were no more likely to have increased their gross revenue than those with fewer child visitors. Attractions with. 0% or less child visits + Over 0% child visits + Base: All attractions responding (1,)
36 Marketing and communications trends
37 Marketing expenditure trend % down % up Over the past seven years, the proportion of attractions reporting increases in marketing expenditure has been in gradual decline. Conversely, the proportions reporting decreases in marketing has slowly risen Nevertheless, the number of attractions reporting increased marketing spend still outstrips those reporting declines. 011 % down % up Marketing spend shows more volatility among larger attractions, particularly those with over 00,000 visitors per annum ,000 visits or less 0,001-0,000 visits 0,001-00,000 visits Over 00,000 visits 17 1 Base: Attractions answering marketing question (1,)
38 Marketing expenditure trends 011 by attraction category % down % up Country parks Farms Gardens Historic houses / castles Other historic properties Leisure / theme parks Museums / art galleries Steam / heritage railways Visitor / heritage centres Wildlife attractions / zoos Workplaces Places of worship Other Leisure / theme parks were most likely to report increases in marketing spend in 011. Steam / heritage railways and workplaces were also more likely than average to have increased their spend in this area. For the first time in many years, museums / art galleries were more likely to have decreased than increased their marketing spend, perhaps a reflection of budget cuts in recent times. Base: Attractions answering marketing question (1,) 7
39 Marketing expenditure trends 011 by region and admission charge % down % up North West North East Yorks / Humber East Midlands West Midlands East London South East South West There was little variation in marketing expenditure trends by region in 011. Spend in London attractions seems to have held up well. As reported in recent years, paid attractions continue to be more likely to increase their marketing expenditure than free attractions. % down % up 1 1 Free Paid 1 Base: Attractions answering marketing question (1,) 8
40 Impact of marketing expenditure - summary Marketing spend in / 11 change in Up Down Total visitor admissions +8% +% Children admissions +1% -1% Local visits +11% +% Overseas visits +18% +1% Gross revenue +17% -*% Those attractions increasing their marketing expenditure in 011 reported some very strong increases in visits and gross revenue. Visitor admissions increased by +8% among those increasing their marketing spend compared with just +% among those decreasing their spend. Perhaps evidence of the potential return on marketing investment: indeed, gross revenue fell very slightly among those reducing their marketing spend. 9
41 Digital communications offered % offered in 011 ANY DIGITAL COMMUNICATIONS Facebook page Twitter account E-newsletter Online blogs Mobile website Two-thirds (%) of all attractions offered some form of digital communications in 011. This ranged from 90% among the largest attractions with over 100,000 visitors per annum to just 9% among the smallest attractions with fewer than 10,000 visitors per annum. YouTube Flickr page Mobile apps Other social media Whilst Facebook pages are reasonably common across attractions, regardless of size, other forms of digital communications are primarily the domain of the largest attractions with over 100,000 visitors per annum. Number of visits p.a % offered 0k or less 0k-100k Over 100k ANY DIGITAL COMMUNICATIONS 7 90 Facebook page 78 Twitter account 1 0 E-newsletter 1 1 Online blogs 1 Mobile website YouTube 1 0 Flickr page 11 7 Mobile apps 9 1 Other social media 7 1 Base: All answering digital communications question (1,08) 0
42 Digital communications offered in 011 by attraction category % offering Country Parks Farms Gardens Historic houses / castles Other historic properties Leisure / theme parks Museums / art galleries Steam / heritage railways Visitor / heritage centres Wildlife / zoos Workplaces Places of Worship Other Facebook Twitter account E-newsletter Online blogs Mobile website YouTube Flickr page Mobile apps Other social media ANY Attractions geared toward the family audience tend to be more deeply involved with digital communications almost 90% of farms, leisure / theme parks and wildlife attractions / zoos offer some form of digital communication. Indeed, three-quarters (7%) of attractions who have over 0% of their visitors consisting of children offered digital communications compared with just % among attractions with fewer than 0% of their visitors being children. Country parks, places of worship and other historic properties are somewhat behind the digital communications curve. Base: All answering digital communications question (1,08) 1
43 Impact of digital communications - summary Offer any digital communications? 010 / 11 change in Yes No Total visitor admissions +% +% Children admissions +% +% Local visits +% +% Overseas visits +% +% Gross revenue +7% +% Those attractions offering some form of digital communications platform in 011 reported stronger increases in gross revenue. Gross revenue increased by +7% among those offering digital communications compared with just +% among those not offering. The impact of offering digital communications was lower in terms of visitor admissions, although those offering digital communications reported slightly stronger increases in visits. The impact of digital communications perhaps has more of a positive impact upon revenue outside the sphere of visitor admissions.
44 Provision of services trends
45 Provision of services trends % offering online / events % offering facilities Website Public events Venue hire Corporate events Online booking Retail shop Member scheme Café / restaurant Costumed interpretation Attractions are asked about the services that they offered across five dimensions: Online Facilities Interpretation Events Membership There has been little change in the proportions of attractions offering each service in 011. N.B. Although provision appears to have dipped slightly for most categories, there are many more smaller attractions who responded to this question in 011 (who are less likely to offer these services). Base: Any answering services question in 011 (1,)
46 Provision of services trends 011 events provision by attraction category Country parks Farms Gardens Historic houses / castles Other historic properties Leisure / theme parks Museums / art galleries Steam / heritage railways Visitor / heritage centres Wildlife attractions / zoos Workplaces Places of worship Other Public events (outside usual operations) Public venue hire Corporate events Country parks, historic houses / castles, steam / heritage railways, visitor / heritage centres and museums / art galleries lead the way in terms of public event provision (outside usual operations). Country parks are also leading the way on public venue hire, with places of worship also with strong provision in this area. Provision by museums / art galleries is below average. Provision of corporate events is lead by leisure / theme parks. Both historic houses / castles and museums / art galleries are behind the curve is there more that these two categories can do in the area of corporate events? Base: Any answering services question in 011 (1,)
47 Provision of services trends 011 online provision by attraction category Country parks Farms Gardens Historic houses / castles Other historic properties Leisure / theme parks Museums / art galleries Steam / heritage railways The majority of attractions (77%) now offer a website, although this remains a little lower among workplaces and places of worship. Steam / heritage railways lead the way in terms of provision of online booking facilities, with leisure / theme parks and wildlife attractions / zoos also strong in this area. Less than a quarter of attractions within all other attractions categories offer online booking. Visitor / heritage centres Wildlife attractions / zoos Workplaces Places of worship Other Website Online booking Base: Any answering services question in 011 (1,)
48 Provision of services trends 011 facilities provision by attraction category Country parks Farms Gardens Historic houses / castles Other historic properties Leisure / theme parks Museums / art galleries Steam / heritage railways Visitor / heritage centres Wildlife attractions / zoos Whilst half of attractions now offer some form of membership scheme, this varies significantly from over three quarters of wildlife attractions / zoos and steam / heritage railways to less then a quarter of workplaces and places of worship. There are also less than half of museums / art galleries that offer such a scheme. Two-thirds of all attractions provide a retail shop, although again this is much lower among country parks, gardens and places of worship. Cafés / restaurants were offered by around half of attractions, although this varies enormously by attraction category. Provision is much lower at museums / art galleries. Workplaces Places of worship Costumed interpretation Other Member scheme Café / restaurant Retail shop Costumed interpretation remains primarily the domain of the heritage sector, although there are notable minorities of country parks, museums / art galleries and visitor / heritage centres that provide this facility Base: Any answering services question in 011 (1,) 7
49 Provision of services trends 011 by visitor volume % offering Online Under 10k 10k- 0k Visit Volume 0k- 0k 0k- 100k Over 100k Presence of a website is high among attractions with over 10,000 visitors per annum, although there are still a notable minority with no website presence. Events Website Online booking Public events Venue hire 17 8 Facilities Corporate events Retail shop Member scheme Café / restaurant Costumed interpretation A third of attractions with less than 10,000 visitors per annum still have no website. Online booking only really becomes prevalent among the largest attractions with over 100,000 visitors per annum. Online booking remains the exception rather than the norm among smaller attractions. Corporate events also only really become reasonably commonplace among attractions of this size. Provision of the majority of other facilities tends to increase fairly steadily as visitor numbers increase Base: Any answering services question in 011 (1,) 8
50 Provision of services trends 011 by admission charge % OFFERING Online Free attractions Paid attractions Website Online booking Paid attractions are more likely to offer each of the services. However the gap tends to be larger for member schemes, cafés / restaurants and online booking. Events Public events Free attractions are almost as likely as paid attractions to put on events for the public. Venue hire 1 Corporate events 8 Facilities Retail shop 7 Member scheme Café / restaurant 0 Costumed interpretation Base: Any answering services question in 011 (1,) 9
51 Provision of services trends 011 by child / overseas visitors % OFFERING Online 0% or less of total visits Child Visits Over 0% of total visits 0% or less of total visits Overseas Visits Over 0% of total visits Website Online booking Events Public events Venue hire 0 1 Corporate events 9 9 Facilities Retail shop Member scheme Café / restaurant 7 Costumed interpretation Base: Any answering services question in 011 (1,) 0
52 Impact of public events - summary Hold public events? 010 / 11 change in Yes No Total visitor admissions +% +% Gross revenue +% +% Those attractions that hold public events reported stronger increases in gross revenue in 011. Gross revenue increased by +% among those holding public events compared with just +% among those holding such events. There was little evidence that holding public events helps to increase visitor admissions during regular opening hours. Those attractions holding public events reported visitor admissions increasing by +% compared with +% among those not holding public events. 1
53 Employment trends
54 Employment trends Change in employees since 010 % down % up 1 10 Full-time permanent Full-time seasonal Part-time permanent Part-time seasonal Unpaid volunteers Proportions of attractions employing any of the following employees in 011: 78% full-time permanent 0% full-time seasonal 77% part-time permanent % part-time seasonal 80% unpaid volunteers Anticipated change in employees in 01 % down % up In the current challenging financial climate there has been a major shift towards employees from the voluntary sector. Attractions predict this to continue during Full-time permanent Full-time seasonal Part-time permanent 8 Conversely, there has been a decline in full time permanent employees within the sector in the past year, although this decline is predicted to be arrested in 01. Part-time seasonal 9 Unpaid volunteers 0 Base: All answering employment questions
55 Employment trends unpaid volunteers summary (010 to 011) % down 010 to 011 % up % down 0 0 Country parks Farms Gardens Historic houses / castles Other historic properties Leisure / theme parks Museums / art galleries Steam / heritage railways Visitor / heritage centres Wildlife attractions / zoos Workplaces Places of worship Other Free Paid % up % any volunteers in % any volunteers in % down 010 to 011 % up 1 Under 0k visits 0k-0k visits 0k-00k visits Over 00k visits % any volunteers in 011 Whilst unpaid volunteers are up across the board, they are most likely to have increased at the larger attractions. Volunteering is just as likely to have increased at paid attractions as at those which are free admission. Wildlife attractions / zoos, gardens, farms and country parks are among the attraction categories most likely to have reported increases in volunteers in Base: All answering employment questions
56 Employment trends unpaid volunteers summary (01 predictions) % down 01 predictions % up 1 % down Country parks Farms Gardens Historic houses / castles Other historic properties Leisure / theme parks Museums / art galleries Steam / heritage railways Visitor / heritage centres Wildlife attractions / zoos Workplaces Places of worship Other Free Paid 0 % up % any volunteers in % any volunteers in % down 01 predictions % up * 1 Under 0k visits 0k-0k visits 0k-00k visits Over 00k visits 17 1 % any volunteers in 01 The trend towards unpaid volunteers is predicted to continue in 01, with larger attractions still driving this increase. However, perhaps the rate of increase will slow slightly with only 0% of attractions predicting unpaid volunteers to rise compared with % in 011. Farms, country parks, wildlife attractions / zoos and steam / heritage railways are the attraction categories most likely to predict the number of volunteers to increase in Base: All answering employment questions
57 Employment trends full time permanent employees summary ( ) % down 010 to 011 % up % any FT perm in 011 % down 010 to 011 % up % any FT perm in % down 1 1 Country parks Farms Gardens Historic houses / castles Other historic properties Leisure / theme parks Museums / art galleries Steam / heritage railways Visitor / heritage centres Wildlife attractions / zoos Workplaces Places of worship Other Free Paid % up % any FT perm in Under 0k visits 0k-0k visits 0k-00k visits Over 00k visits 1 1 Attractions with over 0,000 visitors per annum are the most likely to have shed full time permanent employees in 011. Cuts are also most likely to have been made at historic properties and country parks. Conversely, the attraction categories which have performed well in 011 have been more likely to increase than decrease their full time permanent employees farms, gardens and wildlife attractions / zoos. Both free and paid attractions are more likely to have shed than taken on additional fulltime permanent staff Base: All answering employment questions
58 1 1 1 Employment trends full time permanent employees summary (01 predictions) % down 01 predictions % up % down 9 0 Country parks Farms Gardens Historic houses / castles Other historic properties Leisure / theme parks Museums / art galleries Steam / heritage railways Visitor / heritage centres Wildlife attractions / zoos Workplaces Places of worship Other Free Paid % up % any FT perm in % any FT perm In % down 01 predictions % up Under 0k visits 0k-0k visits 0k-00k visits Over 00k visits Attractions with over 0,000 visitors per annum are also the most likely to predict further shedding of full time permanent employees in 01. % any FT perm in 01 Country parks also appear likely to predict further cuts in full time permanent employees in 01, although the decrease for historic properties is predicted to be arrested. Conversely, some of the attraction categories which have performed well in 011 are also more likely to predict an increase in their full time permanent employees for 01 gardens and wildlife attractions / zoos Base: All answering employment questions 7
59 Abbreviations Abbreviation Category Description CP Country Parks Country parks and forest parks F Farms Farms, rare breeds, shire horse centres and farm animals G Gardens Gardens, arboretums and botanical gardens HH Historic houses/castles Historic houses, historic houses and gardens, palaces, castles, forts OHP Other historic properties Historic monuments, archaeological sites, historic ships, windmills, watermills and other historic properties LTP Leisure/Theme Parks Leisure parks and theme parks MAG Museums/Art Galleries Museums and/or art galleries and science centres R Steam/Heritage Railways Steam railways and heritage railways VC Visitor/Heritage Centres Visitor centres and heritage centres WI Wildlife Attractions Nature reserves, wetlands, wildlife trips, safari parks, zoos, aquariums and aviaries WP Workplaces Distilleries, vineyards, breweries and industrial or craft premises WO Places of Worship Cathedrals, churches and other places of worship O Other Attractions that do not fit into any of the categories outlined above 8
60 Abbreviations Abbreviation Government Office Region Counties/unitary authorities within region EAST East Counties: Bedfordshire, Cambridgeshire, Essex, Hertfordshire, Norfolk, Suffolk UAs: Luton, Peterborough, Southend-on-Sea, Thurrock EM East Midlands Counties: Derbyshire, Leicestershire, Lincolnshire, Northamptonshire, Nottinghamshire UAs: Derby, Leicester, Nottingham, Rutland LON London All Greater London boroughs NE North East Counties: County Durham, Northumberland UAs: Darlington, Hartlepool, Middlesborough, Redcar & Cleveland, Stockton-on-Tees Former Met.: Tyne and Wear (Gateshead, Newcastle, N Tyneside, S Tyneside, Sunderland) NW North West Counties: Cheshire, Cumbria, Lancashire UAs: Blackburn with Darwen, Blackpool, Halton, Warrington Former Met.: Greater Manchester (Bolton, Bury, Manchester, Oldham, Rochdale, Salford, Stockport, Tameside, Trafford, Wigan), Merseyside (Liverpool, Knowsley, Sefton, St Helens, Wirral) SE South East Counties: Buckinghamshire, East Sussex, Hampshire, Kent, Oxfordshire, Surrey, West Sussex UAs: Bracknell Forest, Brighton & Hove, Isle of Wight, Medway, Milton Keynes, Portsmouth, Reading, Slough, Southampton W. Berkshire, Windsor & Maidenhead, Wokingham SW South West Counties: Cornwall, Devon, Dorset, Gloucestershire, Somerset, Wiltshire, Isles of Scilly UAs: Bath & NE Somerset, Bournemouth, Bristol, N Somerset, Plymouth, Poole, Swindon, Torbay, S Gloucestershire WM West Midlands Counties: Shropshire, Staffordshire, Warwickshire, Worcestershire UAs: Herefordshire, Stoke-on-Trent, Telford & Wrekin Former Met.: West Midlands (Birmingham, Coventry, Dudley, Sandwell, Solihull, Walsall, Wolverhampton) Y&H Yorkshire/ The Humber Counties: North Yorkshire UAs: East Riding of Yorkshire, Kingston-upon-Hull, NE Lincolnshire, N Lincolnshire, York Former Met.: South Yorkshire (Barnsley, Doncaster, Rotherham, Sheffield) West Yorkshire (Bradford, Calderdale, Kirklees, Leeds, Wakefield) 9
61 Questionnaire 0
Visitor Attractions Trends in England 2017
 Visitor Attractions Trends in England 2017 Annual Report for Heritage Counts Prepared for Historic England Report Contents 1. Introduction and Background 2 1.1 Visitor Attraction Definition 2 1.2 Research
Visitor Attractions Trends in England 2014
 Visitor Attractions Trends in England 2014 Annual Report for Heritage Counts Prepared for Historic England 1. Introduction and Background This report presents key tables from the historic properties element
Visitor Attractions Trends in England 2016
 Visitor Attractions Trends in England 2016 Annual Report for Heritage Counts Prepared for England 1. Introduction and Background This report presents key tables from the properties element of the Survey
School improvement monitoring and brokering grant provisional allocations for illustrative purposes
 School improvement monitoring and brokering grant provisional allocations for illustrative purposes The school improvement monitoring and brokering grant was announced on 30 November 2016. This grant of
Healthwatch is the independent champion for people who use health and social care services.
 B R I E F I N G State of Support Local Healthwatch Funding 2017/18 30 November 2017 Overview Healthwatch is the independent champion for people who use health and social care services. Across the country
Planned Expenditure by Local Authorities: Services for Young People
 Planned Expenditure by Local Authorities: Services for Young People Section 251 Under Section 251 of the Apprenticeships, Skills, Children and Learning Act 2009, local authorities are required to submit
S31 Grant determination for a high needs strategic planning fund in : DCLG ref 31/2916
 S31 Grant determination for a high needs strategic planning fund in 2016-17: DCLG ref 31/2916 Purpose of the fund Local authorities can use this fund to carry out a strategic review of their high needs
Numbers achieving 3 A grades in specific A-Level combinations by school type and LEA
 Numbers achieving 3 A grades in specific A-Level combinations by school type and LEA Statistics Report Series No. 9 Joanne L. Emery February 2009 Research Division Statistics Group Assessment, Research
Visitor Attraction Trends in England Full Report
 Visitor Attraction Trends in England 2016 Full Report Contents Acknowledgement & Introduction Sample Headlines Weather Summary Visitor admission trends Category, Region, Charge, Geographic location, Size,
Table 4.1 Organisation and management
 Table 4.1 Organisation and management North East Offered to: M'g't Main Partner Others Nu Pr Se Sp Ps RU In Ot by fund'g authorities Gateshead a a a r a a Lib Lib n/a North Tyneside a a a a a a a a Lib
NHS South Warwickshire CCG
 1 West Midlands South Worcestershire, Redditch, Bromsgrove & Wyre Forest (Fast Track with 2 & 3) NHS Redditch and Bromsgrove Worcestershire West Midlands NHS South Worcestershire NHS Wyre Forest 2 West
2016-BASED HOUSEHOLD PROJECTIONS
 2016-BASED HOUSEHOLD PROJECTIONS PLANNING DESIGN ENVIRONMENT PEGASUSGROUP.CO.UK ECONOMICS 2016-BASED HOUSEHOLD PROJECTIONS The Office for National Statistics (ONS) released its 2016-household projections
#element of bullying / harassment South West 2gether NHS FT Mental Health Small
 1 South West 2gether NHS FT Mental Health Small 3 2 0 3 0 Aintree University Hospital NHS FT Yorks and Humber Airedale NHS FT Combined Acute and Community Small 28 0 8 7 1 North West Alder Hey Children's
Workless households for areas across the UK in 2010
 Workless households for areas across the UK in 2010 Coverage: UK Date: 08 September 2011 Geographical Area: Local Authority County Theme: Labour Market Animated YouTube Video A short video podcast explaining
AUTHORITY Central Bedfordshire Bedford Mid and South Bedfordshire Luton Bracknell Forest Reading Slough W Berkshire Windsor & Maidenhead Wokingham
 COUNTY AUTHORITY DESIGNATION CONTACT Bedfordshire Central Bedfordshire Unitary Authority RightsofWay@centralbedfordshire.gov.uk Bedford Metropolitan Borough row@bedford.gov.uk Mid and South Bedfordshire
Annex 3: CCGs confirmed for waves 1, 2, 3 and 4 for authorisation
 Annex 3: s confirmed for waves 1, 2, 3 and 4 for authorisation Below is a list of the clinical commissioning groups (s) which will be put forward for authorisation in wave 1, split by Commissioning Board
England screening uptake rates
 England screening uptake rates The average screening uptake rate in England is 58% In some cases it is as low as 33% 44% of s in England are below the national average Seven out of ten of the worst areas
BBC Local Democracy Reporter allocation
 BBC Local Democracy Reporter allocation Map shows distribution of reporters by BBC Nation and Region see page two, Table B for detail Page The distribution of reporters in Northern Ireland will be undertaken
The local elections of 1 May 1997
 The local elections of 1 May 1997 Research Paper 97/82 27 June 1997 The local elections that took place in many parts of England on 1 May were overshadowed by the general election and the results of them
STAMP IDENTIFICATION NUMBERS
 STAMP IDENTIFICATION NUMBERS DEPARTMENT OF TRADE AND INDUSTRY WEIGHTS AND MEASURES (PRESCRIBED STAMP) REGULATIONS 1968 LIST OF IDENTIFICATION NUMBERS National Weights and Measures Laboratory Stanton Avenue
NATIONAL OFFICERS AND EXECUTIVE MEMBERS
 NATIONAL OFFICERS AND EXECUTIVE MEMBERS 2014 2016 National Officers President Max Hyde Senior Vice-President Philipa Harvey Junior Vice-President Anne Swift Treasurer Ian Murch Ex-President Beth Davies
Swine Flu Weekly Vaccine Uptake 2009/10 - Frontline HCWs (Primary Care Organisations) Week 4 w/e 31/01/2010 For organisations under HPA
 Week 4 w/e 31/01/2010 For organisations under HPA") Swine Flu Weekly Vaccine Uptake 2009/10 - Frontline HCWs (Primary Care Organisations) Week 4 w/e 31/01/2010 For organisations under HPA Trust Code Trust Name SHA Org Code SHA Name Swine Flu Vaccination
Swine Flu Weekly Vaccine Uptake 2009/10 - Frontline HCWs (Primary Care Organisations) Week 4 w/e 31/01/2010 For organisations under HPA Trust Code Trust Name SHA Org Code SHA Name Swine Flu Vaccination
Oriel 2018 (2019intake) Hospital and Health Board Employers
 Hospital and Health Board Employers") Oriel 2018 (2019intake) Hospital and Health Board Employers Employer Name ABERTAWE BRO MORGANNWG UNIVERSITY HEALTH BOARD AINTREE UNIVERSITY HOSPITAL NHS FOUNDATION TRUST AIREDALE NHS FOUNDATION TRUST ALDER
Oriel 2018 (2019intake) Hospital and Health Board Employers Employer Name ABERTAWE BRO MORGANNWG UNIVERSITY HEALTH BOARD AINTREE UNIVERSITY HOSPITAL NHS FOUNDATION TRUST AIREDALE NHS FOUNDATION TRUST ALDER
CHAPLAINCY COSTS SURVEY, ENGLAND
 CHAPLAINCY COSTS SURVEY, ENGLAND APRIL 2009 Mental Health & Care Trusts, NHS & Foundation Trusts & Primary Care Trusts Trust Salaries per annum ( )* Staff - Whole time Equivalent 2gether NHS Foundation
Area1 Area Code Cut-off Date In Bank Date Area North East Essex. 28th 14th Mid Essex South East Essex
 North East Essex 5PW Mid Essex 5PX West Essex 5PV 28th 14th Mid Essex South East Essex 5P1 South West Essex 5PY Somerset 5QL 27th 15th Somerset York 5NV 27th 15th North Yorkshire and Humber Rotherham 5H8
CCG Annual Assessment 2017/18
 Annual Assessment 2017/18 annual assessment 2017/18 Publications Gateway reference number: 08247 Version number: 3.0 First published: 12 July 2018 Prepared by: NHS England Assessment Team Classification:
PQ Local Authorities with exceedances of NO 2 annual mean limit value (based on 2015
 PQ 47949 - Local Authorities with exceedances of NO 2 annual mean limit value (based on 2015 compliance assessment) Local Authorities with exceedances of NO 2 annual mean limit value (based on 2015 compliance
Council Tax since
 27 December 2015 Council Tax since 1996-97 Since 2010, central government has offered grants to local authorities to freeze or cut Council Tax. Additionally, local authorities wishing to Council Tax by
CAA Passenger Survey Report 2017
 Business Intelligence (CAA Strategy & Policy Department) CAA Passenger Survey Report 2017 A survey of passengers at Birmingham, East Midlands, Gatwick, Heathrow, Leeds Bradford, Liverpool, London City,
Council Performance Ratings 2010
 Council Performance Ratings 2010 Tameside Metropolitan Borough Council North West 4 - Performs excellently Wandsworth Borough Council London 4 - Performs excellently City of Westminster Council London
Q Embargoed until March 2010
 www.nationwide.co.uk/hpi Embargoed until 0700 30 March 2010 London mini-boom leads UK price growth UK house prices increased by 1.6% quarter-on-quarter in Q1 London saw the strongest growth in the quarter
Introduction to European Commission Funding: ERDF and JESSICA
 Developing interest - appendix: March 2013 Appendix 1: Introduction to European Commission Funding: ERDF and JESSICA European Regional Development Funding (ERDF) aim[s] to strengthen economic and social
Suitability of the subsurface for infiltration SuDS in Great Britain
 The British Geological Survey Suitability of the subsurface for in Great Britain Infiltration Drainage Ground stability Groundwater protection What are? Infiltration SuDS are sustainable drainage systems
Strategic Estate Advisers Contact Details
 Strategic Estate Advisers Midlands & East of CCG Basildon & Brentwood Ian Greggor i.greggor@communityhealthpartnerships.co.uk Bedfordshire Anthony Smith anthony.smith@property.nhs.uk Birmingham Cross City
Winners of the Exemplar Awards 2016
 Winners of the Exemplar Awards 2016 Winner of the Exemplar Award 2016 Leeds City Council Winner of the Peer Award 2016 David Lloyd, Huntingdonshire District Council Data Quality & Performance Awards 2016
House prices fall in most regions during the third quarter
 www.nationwide.co.uk/hpi Q3 2010 Embargoed until 0700 Thurs 30 Sep 2010 House prices fall in most regions during the third quarter House prices fell in nine out of thirteen UK regions in the third quarter
Dear Louise. I can confirm that the full list of approved sites for this study is:
 From: TOTENHOFER, Ashley (HEALTH RESEARCH AUTHORITY) Sent: 28 June 2018 13:06 To: SAVIC, Louise (LEEDS TEACHING HOSPITALS NHS TRUST) Subject: RE: DALES 232512 Dear Louise I can confirm that the full list
City employment: An overview from the Business Register & Employment Survey (BRES)
") employment September 2012 employment: An overview from the Business Register & Employment Survey (BRES) Rachel Smith, September 2012 On 28 September, the latest employment estimates for 2011, taken from
employment September 2012 employment: An overview from the Business Register & Employment Survey (BRES) Rachel Smith, September 2012 On 28 September, the latest employment estimates for 2011, taken from
House prices in London continue to climb
 www.nationwide.co.uk/hpi Q2 2014 Embargoed until 0700 Wed 2 Jul 2014 House prices in London continue to climb All UK regions saw annual price rises in Q2 2014 London continues to lead, with annual price
Most regions saw price falls during 2012
 www.nationwide.co.uk/hpi Embargoed until 0700 Thurs 3 Jan 2013 Most regions saw price falls during 2012 11 out of 13 UK regions saw annual price falls during 2012 London best performing region in 2012
2018 TOWN HALL RICH LIST. Theo Hutchinson April 2018
 2018 TOWN HALL RICH LIST Theo Hutchinson April 2018 For the eleventh comprehensive list of local authority employees in the United Kingdom whose total annual 6-17 financial year, the most recent full year
RSN Economic Profiling Service
 RSN Economic Profiling Service Introduction The RSN has developed an economic profiling service for its members. Information will be provided based on the indicators and to the frequency set out in the
Care Home Live Bed State System. North East & North Cumbria UEC Network. Jonathan Maloney Programme Director. 5 th July 2018
 Care Home Live Bed State System North East & North Cumbria UEC Network Jonathan Maloney Programme Director 5 th July 2018 Information Source: NHS England A Collaborative Approach Portal Overview CHLBS
*** STRICTLY EMBARGOED UNTIL 7.00AM THURSDAY 2 APRIL 2009 *** Price falls across all regions in Q1 2009
 Price falls across all regions in 2009 Northern Ireland sees first moderation in price falls in two years Scotland saw prices fall sharply during but still the most resilient market Wales sees biggest
System Improvements & Future Needs
 June 2005 System Improvements & Future Needs Ian Coles - Data & Systems Coordinator JMP Consulting 2005 JMP Consulting on behalf of the TRICS Consortium TRICS System Improvements & Future Needs New features
Census 2011: City snapshot
 Census Snapshot September 2012 Census 2011: snapshot Rachel Smith, September 2012 On 16 July 2012 the first outputs from the Census 2011 for England and Wales were released, followed on 19 September 2012
Understanding Visitor Satisfaction
 Understanding Visitor Satisfaction 2013-14 Debrief by TNS at VisitEngland 11 th November 2014 What we will cover: Introduction Tracking performance over time Headline performance by segment The drivers
Economic Impact of Tourism. Cambridgeshire 2010 Results
 Economic Impact of Tourism Cambridgeshire 2010 Results Produced by: Tourism South East Research Department 40 Chamberlayne Road, Eastleigh, Hampshire, SO50 5JH sjarques@tourismse.com http://www.tourismsoutheast.com
LOCAL AUTHORITY PROJECTS ENDORSED BY THE INTERDEPARTMENTAL PROJECT REVIEW GROUP (PRG
 LOCAL AUTHORITY PROJECTS ENDORSED BY THE INTERDEPARTMENTAL PROJECT REVIEW GROUP (PRG) The latest list of endorsed projects was published in this revised format by the ODPM on 24 November 2004. If you are
Research Note th June Council liabilities
 Research Note 136 26th June 2014 Council liabilities Public sector debt is forecast by the Office for Budgetary Responsibility to exceed 1.3 trillion in 2014-15. 1 However, as explained by previous TaxPayers
Tabular statement. Yearly Meeting of the Religious Society of Friends (Quakers) in Britain
 in Britain") Yearly Meeting of the Religious Society of Friends (Quakers) in Britain Tabular statement Compiled for Yearly Meeting, Friends House, London, 27 30 May 2016 Membership patterns in Britain Yearly Meeting
Yearly Meeting of the Religious Society of Friends (Quakers) in Britain Tabular statement Compiled for Yearly Meeting, Friends House, London, 27 30 May 2016 Membership patterns in Britain Yearly Meeting
Tourism Trends. Sharon Orrell October 2013
 Tourism Trends Sharon Orrell October 2013 Apr-06 Jun-06 Aug-06 Oct-06 Dec-06 Feb-07 Apr-07 Jun-07 Aug-07 Oct-07 Dec-07 Feb-08 Apr-08 Jun-08 Aug-08 Oct-08 Dec-08 Feb-09 Apr-09 Jun-09 Aug-09 Oct-09 Dec-09
Property Investment Guide: Leicester
 Property Investment Guide: Essential investment information sourcedleicester.com Introduction RANKED THE 5TH BEST PLACE TO INVEST Hi My name is Sam Ballard and I am the Director of Sourced, an investment
T bu ab l u a lar statement r s
 Yearly Yearly Meeting Meeting of of the the Religious Religious Society Society of of Friends Friends (Quakers) (Quakers) in in Britain Britain Tabular statement Compiled for Yearly Meeting Gathering,
00: Not for broadcast or publication before 00:01 Hrs Monday 20th June 2011
 Press Release Embargoed until: 00:01 20.06.11 Not for broadcast or publication before 00:01 Hrs Monday 20th June 2011 This is the Halifax review of economic and price performance at a local level. The
Regional Spread of Inbound Tourism
 Regional Spread of Inbound Tourism Foresight issue 164 VisitBritain Research, January 2019 1 Contents Introduction Summary Key metrics by UK area Analysis by UK area Summary of growth by UK area Scotland
Tourism Update. Xavier Faux October 2017
 Tourism Update Xavier Faux October 2017 1 Today s presentation Domestic and inbound tourism update Attractions Survey 2016 Domestic tourism to Wiltshire 2 Domestic and Inbound tourism: How are we doing?
WELCOME TO CHESTER AND CHESHIRE.
 WELCOME TO CHESTER AND CHESHIRE www.visitchester.com Introduction Chester Location Insights Product Approach EASY ACCESS CHESTER IS WELL CONNECTED BY ROAD, RAIL AND AIR WITH LIVERPOOL AND MANCHESTER AIRPORT
James Berresford Chief Executive VisitEngland
 James Berresford Chief Executive VisitEngland In 2014, visitors to England spent an estimated total of 82bn 18.1bn was spent by British residents on domestic overnight trips An estimated 18.9bn was spend
Economic Impact of Tourism. Norfolk
 Economic Impact of Tourism Norfolk - 2009 Produced by: East of England Tourism Dettingen House Dettingen Way, Bury St Edmunds Suffolk IP33 3TU Tel. 01284 727480 Contextual analysis Regional Economic Trends
Primary Care Support England. The National Engagement Team (NET)
") Primary Care Support England The National Engagement Team (NET) Background On 1 September 2015, Primary Care Support England (PCSE) took responsibility for the delivery of NHS England s primary care support
Primary Care Support England The National Engagement Team (NET) Background On 1 September 2015, Primary Care Support England (PCSE) took responsibility for the delivery of NHS England s primary care support
Property Investment Guide: West London
 Property Investment Guide: West London Essential investment information WEST LONDON sourcedwestlondon.com Introduction West London DIVERSE AND CHARMING 2 Hi My name is Kathy Bianchi and I am the Director
Bus Passenger Survey
 March 2012 Contents 1 Foreword 3 2 Key findings 4 3 Results by area Merseyside PTE (Merseytravel) South Yorkshire PTE Transport for Greater Manchester (TfGM) West Yorkshire PTE (Metro) Tyne & Wear PTE
Air Support Study. HMI Matt Parr CB. CCs Council 18 October 2017
 Air Support Study HMI Matt Parr CB CCs Council 18 October 2017 Fleet size and utilisation Number of bases Hours flown 35 35,000 31 30 30,000 25 25,000 20 20,000 15 15 15,000 10 10,000 5 5,000 0 2008/09
Specialised perinatal community team that meets Perinatal Quality Network Standards Type 1
 7 DATA UK Health Teams (Provision in 7) Specialised perinatal community team that meets Perinatal Quality Network Standards Type http://bit.ly/jouvad http://bit.ly/ahavex More than in women develop a mental
Regional Volunteer registration form
 Regional Volunteer registration form Please clearly complete all sections of this form, sign the agreement and return it along with a passport-sized photograph to: War Memorials Trust, 1 st Floor, 14 Buckingham
National Research and Visitor Satisfaction Update
 National Research and Visitor Satisfaction Update Sharon Orrell Head of Research and Insights, VisitEngland 10 March 2015 2014 England Headline Performance Trends Domestic Overnight Tourism Trends Since
Property Investment Guide: Reading
 Property Investment Guide: Essential investment information READING sourcedreading.com Introduction 900 MILLION INVESTED IN THE STATION, CROSSRAIL AND BUOYANT ECONOMY Hi My name is Adam Vickers and I am
The Economic Impact of BT Group plc in the UK
 2018 Edition The Economic Impact of BT Group plc in the UK A report by Hatch Regeneris for BT Group plc 1 Contents 2 Introduction 3 BT Group plc across the UK 11 London & the South East 12 3 Our Report
Driving Customer Satisfaction
 Driving Customer Satisfaction Getting the most out of the VE Brand & Satisfaction Tracker Jim Eccleston, TNS RI Travel & Tourism Destinations Conference 20 th October, 2011 Today s Coverage The context
Grant in Aid funding allocated to Risk Management Authorities. in 2016/17
 Grant in Aid funding allocated to Risk Management Authorities in 2016/17 Risk Management Authority Grant in Aid ( ) Environment Agency 197,082,658 Adur and Worthing Councils 400,000 Ainsty 2008 IDB Allerdale
Patients. Geography: Unitary Authorities, Counties and other areas. Administrative area geography in England and Wales. Unitary Authorities
 Appendix D: Methodology of standardised acceptance rates calculation and administrative area geography and Registry population groups in England & Wales Chapter 4, on the incidence of new patients, includes
Developing balanced local skills strategies. Francesca Froy, LEED Programme, OECD
 Developing balanced local skills strategies Francesca Froy, LEED Programme, OECD Attraction & retention Integrated local skills strategies Up-skilling Integration The OECD LEED diagnostic tool Supply GAPS
More transplants new lives
 More transplants new lives Transplant Activity in the UK 2002-2003 Executive Summary Transplantation is one of the successes of modern medicine. During 2002-2003, 2,780 people had their life saved or improved
Counties and unitary authorities in England 167. NUTS levels 1, 2 and 3 in England,
 Counties and unitary authorities in England 7 NUTS levels, and 3 in England, 998 8 Unitary authorities in Wales/Awdurdodau unedol yng Nghymru 9 NUTS levels, and 3 in Wales, 998/NUTS lefelau, a 3 yng Nghymru,
UNCLASSIFIED. PC24/2007 PROLIFIC AND OTHER PRIORITY OFFENDER ISSUES; DRUG TESTING OF PPOs ON LICENCE; DRUG TESTING IN APPROVED PREMISES
 Probation Circular PC24/2007 PROLIFIC AND OTHER PRIORITY OFFENDER ISSUES; DRUG TESTING OF PPOs ON LICENCE; DRUG TESTING IN APPROVED PREMISES IMPLEMENTATION DATE: 16 July 2007 EXPIRY DATE: July 2012 TO:
Produced by: Destination Research Sergi Jarques, Director
 Produced by: Destination Research Sergi Jarques, Director Economic Impact of Tourism Oxfordshire - 2015 Economic Impact of Tourism Headline Figures Oxfordshire - 2015 Total number of trips (day & staying)
POLICE GRANT REPORT ENGLAND AND WALES 2018/19 TABLES. Table 1: Provisional change in total direct resource funding compared to 2017/18
 POLICE GRANT REPORT ENGLAND AND WALES 2018/19 TABLES Table 1: Provisional change in total direct resource funding compared to 2017/18 2017/18* 2018/19* Cash increase 2017 reserves as percentage of funding**
Happy and healthy Hart tops 2012 Quality of Life Survey
 NOT FOR BROADCAST OR PUBLICATION BEFORE 00.01HRS Saturday 22 nd December 2012 The seventh annual Halifax Quality of Life Survey tracks where living standards are highest in the United Kingdom by ranking
Doncaster Chamber of Commerce. Andy Taylor Head of Public Affairs, HS2 Ltd
 Doncaster Chamber of Commerce Andy Taylor Head of Public Affairs, HS2 Ltd HS2 one railway, two phases 330 miles of new track 9 HS2 stations High speed trains running on HS2 and existing lines Up to 18
Ultimate Choice for Two
 Choose one from the following: Adventure Ultimate Choice for Two Action Air: Airsoft Pistol Shooting for Two - West Midlands (Birmingham) Canoe Hire for Two - Hertfordshire (Broxbourne) Discover Scuba
FINAL POLICE GRANT REPORT ENGLAND AND WALES 2019/20 TABLES
 FINAL POLICE GRANT REPORT ENGLAND AND WALES TABLES Table 1: Provisional change in total resource funding for England and Wales, compared to 2018/19 Total resource funding including pensions grant in *
NHS England Statistical Release Breastfeeding Initiation & Breastfeeding Prevalence 6-8 weeks Quarter /16 24th September 2015 Crown Copyright
 NHS England Statistical Release Breastfeeding Initiation & Breastfeeding Prevalence 6-8 weeks Quarter 1 2015/16 24th September 2015 Crown Copyright 2015 Statistical release Breastfeeding initiation and
decorative columns and brackets range
 decorative columns and brackets range 02 From decorative styles that enhance or standard styles to discreetly blend in, the Holophane columns and brackets range has been exclusively designed to complement
DEVOLUTION OF RAIL FRANCHISING. A new strategy for rail in the North of England
 DEVOLUTION OF RAIL FRANCHISING A new strategy for rail in the North of England A BETTER RAILWAY IN THE NORTH We want the economy and prosperity of the North to grow and rail will play a pivotal role in
Produced by: Destination Research Sergi Jarques, Director
 Produced by: Destination Research Sergi Jarques, Director Economic Impact of Tourism Epping Forest - 2014 Economic Impact of Tourism Headline Figures Epping Forest - 2014 Total number of trips (day & staying)
The Economic Impact of Tourism on Calderdale Prepared by: Tourism South East Research Unit 40 Chamberlayne Road Eastleigh Hampshire SO50 5JH
 The Economic Impact of Tourism on Calderdale 2015 Prepared by: Tourism South East Research Unit 40 Chamberlayne Road Eastleigh Hampshire SO50 5JH CONTENTS 1. Summary of Results 1 2. Table of Results Table
NEWS RELEASE. GB Drink Drive Trends Revealed. From Release Reference Date
 NEWS RELEASE From Release Reference Date Richard Owen Under embargo until 0000 Wednesday 16 th December GB Drink Drive Trends 2015 Tuesday, 15 th December 2015 GB Drink Drive Trends Revealed New study
Produced by: Destination Research Sergi Jarques, Director
 Produced by: Destination Research Sergi Jarques, Director Economic Impact of Tourism North Norfolk District - 2016 Contents Page Summary Results 2 Contextual analysis 4 Volume of Tourism 7 Staying Visitors
Produced by: Destination Research Sergi Jarques, Director
 Produced by: Destination Research Sergi Jarques, Director Economic Impact of Tourism Norfolk - 2016 Contents Page Summary Results 2 Contextual analysis 4 Volume of Tourism 7 Staying Visitors - Accommodation
The Economic Impact of Tourism Brighton & Hove Prepared by: Tourism South East Research Unit 40 Chamberlayne Road Eastleigh Hampshire SO50 5JH
 The Economic Impact of Tourism Brighton & Hove 2013 Prepared by: Tourism South East Research Unit 40 Chamberlayne Road Eastleigh Hampshire SO50 5JH CONTENTS 1. Summary of Results 1 1.1 Introduction 1 1.2
Produced by: Destination Research Sergi Jarques, Director
 Produced by: Destination Research Sergi Jarques, Director Economic Impact of Tourism Oxfordshire - 2016 Economic Impact of Tourism Headline Figures Oxfordshire - 2016 number of trips (day & staying) 27,592,106
CoStar Awards Submission Criteria & Market Boundaries
 Submission Criteria & Market Boundaries Agency Awards 2015 Table of Contents 1. Key Dates 2. How to Submit Data 3. Award Categories & Exclusions 4. Terms & Conditions 5. Market Boundaries & Definitions
Living Rents. 4th quartile earnings. Local Authority
 Local Authority 4th quartile earnings 1 bed Living Rents 2 bed 3 bed United Kingdom 251.80 70.50 91.66 112.81 Great Britain 253.00 70.84 92.09 113.34 England and Wales 252.90 70.81 92.06 England 253.60
NHS Dental Commissioning Statistics for England June 2016
 NHS Dental Commissioning Statistics for England June 2016 Published 4 th August 2016 Background This release provides information about the amount of NHS dental activity that has been commissioned, measured
The Economic Impact of Tourism Brighton & Hove Prepared by: Tourism South East Research Unit 40 Chamberlayne Road Eastleigh Hampshire SO50 5JH
 The Economic Impact of Tourism Brighton & Hove 2014 Prepared by: Tourism South East Research Unit 40 Chamberlayne Road Eastleigh Hampshire SO50 5JH CONTENTS 1. Summary of Results 1 1.1 Introduction 1 1.2
Funding for Better Care Fund : Disabled Facilities Grant element
 Funding for Better Care Fund 2016-17 : Disabled Facilities Grant element Rows 5 to 207 show the DFG for upper tier local authorities and the breakdown by lower tier local authority Rows 213 to 338 show
Kent Visitor Economy Barometer 2016
 Kent Visitor Economy Barometer 2016 In 2016 Kent s Tourism Businesses saw 2 Summary 2016 saw a strong performance for attractions, although fluctuations did occur from month to month. Accommodation providers
The Value of Activities for Tourism
 The Value of Activities for Tourism Introduction The measurement of activities undertaken during tourism trips is an important element of all the three main tourism monitors the GBTS (domestic overnight),
Technical specification: BS 4449:2005 GRADE B500B BAR AND COIL
 BS 4449:2005 GRADE B500B BAR AND COIL DIAMETER SIZE EXTRA* COIL EXTRA* 8 mm 40.00 15.00 10 mm 25.00 15.00 12 mm 20.00 15.00 Base price + the following extras per size and/or format (coil) 16 mm - 15.00