Figure (1/3) RAINFALL DATA
|
|
|
- Dinah Bennett
- 6 years ago
- Views:
Transcription
 Total No.")

1 Average Annual Rainfall = 2,449 mm Jan Feb Mar Apr May June July Aug Sep Oct Nov Dec Average Monthly Rainfall ( ) Total No. of Years : 49 years Jan Feb Mar Apr May June July Aug Sep Oct Nov Dec No. of Years Over 200/300/400 mm/month Lho Nga Weather Station No. 106 Figure (1/3) RAINFALL DATA 2-4
 Total No.")

2 Average Annual Rainfall = 3,635 mm Jan Feb Mar Apr May June July Aug Sep Oct Nov Dec Average Monthly Rainfall ( ) Total No. of Years : 34 years Jan Feb Mar Apr May June July Aug Sep Oct Nov Dec No. of Years Over 200/300/400 mm/month Calang Weather Station No. 103 Figure (2/3) RAINFALL DATA 2-5
 Average Annual Rainfall = 3,357 mm Total No.")

3 Jan Feb Mar Apr May June July Aug Sep Oct Nov Dec Average Monthly Rainfall ( ) Average Annual Rainfall = 3,357 mm Total No. of Years : 36 years Jan Feb Mar Apr May June July Aug Sep Oct Nov Dec No. of Years Over 200/300/400 mm/month Meulaboh Weather Station No. 102 Figure (3/3) RAINFALL DATA 2-6
4 At Banda Aceh Weather Station At Meulaboh Weather Station Figure MAXIMUM AND MINIMUM MONTHLY AVERAGE TEMPERATURE IN BANDA ACEH AND MEULABOH (Average of ) 2-7
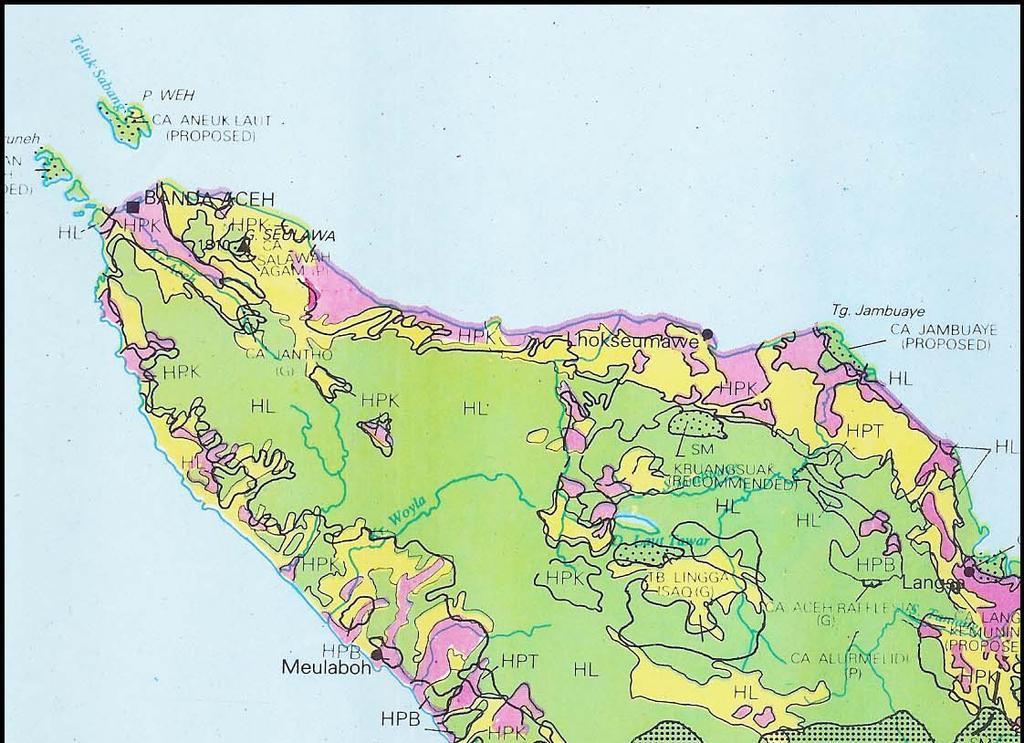
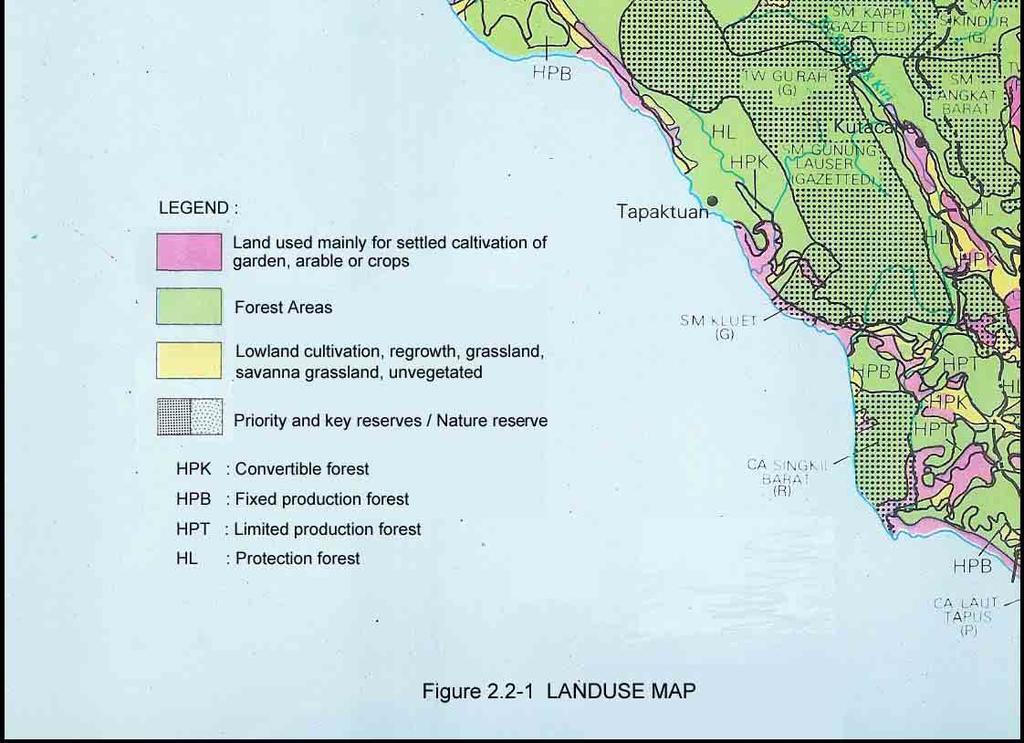
5 2.2 SOCIO-ECONOMIC CONDITIONS Population Population of Aceh Province in 2003 was 4.2 million which shares about 2% of total population of Indonesia. An average population growth rate of Aceh Province from 1990 to 2000 was 1.46% which was almost same growth rate as that of the country. An average annual population growth rate of Aceh Province recorded quite high at 2.57% compared with that of the country. Population density in 2003 was 81 persons/km 2 which is lower than national average. TABLE POPULATION, POPULATION GROWTH RATE AND POPULATION DENSITY Area Aceh Province Sumatra Indonesia Population (in 1,000) ,416 (1.90%) 36,472 (29.4%) 178,500 (100%) 3,929 (1.91%) 43,264 (21.04%) 205,843 (100%) 4,240 (1.97%) 44,816 (20.8%) 215,276 (100%) Annual Average Population Growth Rate (%) Population Density (Person / km 2 ) Source: Statistical Yearbook of Indonesia, Land Use Present land use is shown in Figure Most inland area is covered by deep forest. Unknown communities are scattered along the coastal area Major Economic Indicators Major economic indicators are shown in Table Economic outputs of Aceh Province contributed to about 2.2% of GDP in Recent economic growth of Aceh Province is rather stagnant and recorded lower growth than GDP, however, per capita GRDP was higher than that of the country. TABLE MAJOR ECONOMIC INDICATORS Aceh Province Sumatra Indonesia Unit GRDP 26,991 28,923 33,240 35,471 B.RP. (Current Price) (2.45%) (2.29%) (2.29%) (2.20%) GRDP (Constant Price) B.RP. 9,950 9,129 9,238 9,249 Growth Rate % Per Capita GRDP 1000 (Current Price) Rp. 6,864 7,361 8,342 8,778 GRDP 224, , , ,203 B.Rp. (Current Price) (20.4%) (20.2%) (19.9%) (20.1%) GRDP (Constant Price) B.Rp. 84,181 88,818 91,909 95,383 Growth Rate % Per Capita GRDP 1000 (Current Price) Rp. 5,364 5,917 6,550 7,207 GDP 1,099,732 1,264,919 1,449,398 1,610,012 B.Rp. (Current Price) (100%) (10%) (100%) (100%) GDP (Current Price) B.Rp. 379, , , ,741 Growth Rate % Per Capita GDP 1000 (Current Price) Rp. 4,954 5,812 6,537 7,
6 2-9
7 2.2.4 Industrial Structure Industrial structure of Aceh Province is shown in Table Primary industry is dominant and shares 60% which include mining industry (mainly oil and natural gas); secondary and tertiary industry shares 24% and 16%, respectively. Table INDUSTRIAL STRUCTURE OF ACEH PROVINCE Primary Industry Secondary Industry Tertiary Industry GRDP % GRDP % GRDP % Agri / fishery 9, , , Mining (include oil and natural gas) 10, , , Sub-total 20, , , Manufacturing 7, , , Electricity, Gas Water Construction , Sub-total 8, , , Commence, Hotel, Restaurant, etc. Transport Communication 1, , , , , , Finance Service , Sub-total 4, , , TOTAL 33, , , ROAD NETWORK AND TRAFFIC VOLUME Road Classification Road Classification of Indonesia is shown in Table The West Coast Road is classified as a national road. Primary Road Secondary Road Functional Classification TABLE ROAD CLASSIFICATION Collector Road Arterial Road Class 1 Class 2 Class 3 Class 4 Local Road Arterial, Collector, Local Road Local Road 2-10 Administrative Classification National Road Provincial Road Kabupaten Road Kota Road Village Road Responsible Agency Ministry of Public Works Provincial Government Kebupaten Government Kota Government Kota/Kebupaten Government Note: Class 1 : Road connecting Provincial Capitals Class 2 : Road connecting Provincial Capital with Kabupaten / Kota Capital Class 3 : Road connecting Kabupaten / Kota Capitals Class 4 : Road connecting Kabupaten / Kota Capital with Kecamatan / Klunahan Capital
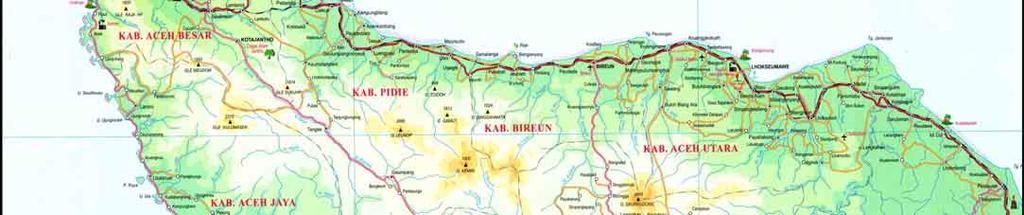
8 2.3.2 Road Network of Aceh Province Road network of Aceh Province is shown in Figure The West Coast Road is the only road serving for the West Coast Area. There are three Provincial Roads branching off from the West Coast Road and extending towards inland areas Traffic Volume on West Coast Road The Public Works Office of Aceh Province undertook traffic count survey in 2004, result of which is shown in Table Traffic volume varies from 3,150 to 7,450 vehicles/day. Section at 125 has the highest traffic volume both Banda Aceh and Meulaboh. 2-11


9 2-12
10 TABLE DAILY TRAFFIC VOLUME ON WEST COAST ROAD (2004) Location ~ Motor cycle car, Jeep, Van Minibus Pickup, Micro truck Small Bus Big Bus 2-Axle Truck 3-Axle Truck Trailer Truck Semi- Trailer Sub Total Non - Motorized KM 31 D D T KM 125 D D T KM 180 D D T KM 191 D D T KM 254 D D T KM 266 D D T Source : Public Works of Nanggroe Aceh Darussalam Province TOTAL Note : D1 -- Direction 1 D2 -- Direction 2 T -- Total 2-13
January 2018 Air Traffic Activity Summary
 January 2018 Air Traffic Activity Summary Jan-2018 Jan-2017 CY-2018 CY-2017 Passengers 528,947 505,421 4.7% 528,947 505,421 4.7% Passengers 537,332 515,787 4.2% 537,332 515,787 4.2% Passengers 1,066,279
DTTAS Quarterly Aviation Statistics Snapshot Quarter Report
 Contents DTTAS Quarterly Aviation Statistics Snapshot Quarter 3 2018 Report 1.1 Dublin Airport Key Statistics... 1 1.2 Cork Airport Key Statistics... 3 1.3 Shannon Airport Key Statistics... 5 1.4 Total
DTTAS Quarterly Aviation Statistics Snapshot Quarter Report
 Contents DTTAS Quarterly Aviation Statistics Snapshot Quarter 4 2015 Report 1.1 Dublin Airport Key Statistics... 1 1.2 Cork Airport Key Statistics... 3 1.3 Shannon Airport Key Statistics... 5 1.4 Total
DTTAS Quarterly Aviation Statistics Snapshot Quarter Report
 Contents DTTAS Quarterly Aviation Statistics Snapshot Quarter 1 2018 Report 1.1 Dublin Airport Key Statistics... 1 1.2 Cork Airport Key Statistics... 3 1.3 Shannon Airport Key Statistics... 5 1.4 Total
Rotorua. newzealand.com. argentina. Market information about our Visitors and our Active Considerers
 Rotorua argentina Market information about our Visitors and our Active Considerers newzealand.com PAST VISITORS HISTORIC VIEW TOTAL ARRIVALS YE MARCH 2018 AUS 1,495K 39% INDIA 63K 2% USA 340K 9% GERMAN
Airline industry outlook remains fragile
 Airline industry outlook remains fragile June 2009 www.iata.org/economics To represent, lead and serve the airline industry Airline industry outlook remains fragile Green shoots starting to appear Recovery
Research and Statistics Department FOR RELEASE 8:50 A.M. Friday, February 23, 2018
 Bank of Japan Research and Statistics Department FOR RELEASE 8:50 A.M. Friday, February 23, 2018 Report on the Services Producer Price ( Preliminary Figures for January 2018 ) The Services Producer Price
Sunshine Coast Residential Market
 Sunshine Coast Residential Market Warwick Temby HIA Executive Director, QLD HOUSING INDUSTRY ASSOCIATION April 2010 Overview Look at international, national and local events that are shaping the outlook
ANGUILLA TOURISM HIGHLIGHTS FOR 2006 VISITOR ARRIVALS 72, % 60.1% Same Day Visitors 94,283. Tourist Arrivals I ( Winter ( Summer
 ANGUILLA TOURISM HIGHLIGHTS FOR 2006 VISITOR ARRIVALS Tourist Arrivals I ( Winter ( Summer 72,962 39.9% 60.1% Same Day Visitors 94,283 VISITOR PROFILE Average Length of Stay (nights) I 8.0 Tourist Arrivals
EU banana sector Sarolta IDEI / Daniel VANDERELST / Lucie ZOLICHOVA
 EU banana sector Sarolta IDEI / Daniel VANDERELST / Lucie ZOLICHOVA European Commission DG Agriculture and Rural Development Unit C.2. Wine, spirits, horticultural products, specialised crops September
Hokitika Gorge, West Coast. newzealand.com INDIA. Market information about our Visitors and our Active Considerers
 Hokitika Gorge, West Coast INDIA Market information about our Visitors and our Active Considerers newzealand.com PAST VISITORS HISTORIC VIEW TOTAL ARRIVALS YE MARCH 2018 AUS 1,495K 39% INDIA 63K 2% USA
JAMAICA. Cruise Passengers 1,678, % 35.7% Cruise Calls VISITOR PROFILE % 5.7% 15.5% TOURISM AND OTHER RELATED ECONOMIC STATISTICS
 JAMAICA TOURISM HIGHLIGHTS FOR 2006 VISITOR ARRIVALS Tourist Arrivals I ( Summer ( Winter 1,678,905 64.3% 35.7% Cruise Passengers ( Summer ( Winter Cruise Calls 1,336,453 61.4% 38.6% 563 VISITOR PROFILE
Argentina is returning to the world markets. Leandro Pierbattisti, BA September 25th
 Argentina is returning to the world markets Leandro Pierbattisti, BA September 25th Federation of Country Elevators: some figures The Federation is a second level organization, in charge of carrying out
Yukon Bureau of Statistics
 Yukon Bureau of Statistics 2 9 # 1 $ > 0-2 + 6 & ± 8 < 3 π 7 5 9 1 ^ 1 Retail Motor Fuel Prices in the Yukon Average prices as of May 20 th, 2009 Self-serve regular premium diesel Whitehorse 99.5 105.9
Annual Weather Book RECORDED BY NW RESEARCH & OUTREACH CTR. By: Michael Leiseth
 Annual Weather Book RECORDED BY NW RESEARCH & OUTREACH CTR. By: Michael Leiseth Table I II 1 2 3 4 5 6 7 8 9, 10 11, 12 13, 14 15, 16 17 18 An average year in Crookston, MN. Seasonal extremes in Crookston,
REPUBLIC OF INDONESIA THE URGENT REHABILITATION AND RECONSTRUCTION SUPPORT PROGRAM FOR ACEH PROVINCE AND AFFECTED AREAS IN NORTH SUMATRA
 No. REPUBLIC OF INDONESIA THE URGENT REHABILITATION AND RECONSTRUCTION SUPPORT PROGRAM FOR ACEH PROVINCE AND AFFECTED AREAS IN NORTH SUMATRA ( REHABILITATION AND RECONSTRUCTION OF WEST COAST ROAD IN NORTH
Auckland Transport Quarterly Indicators Report 2018/19
 Attachment 1 Auckland Transport ly Indicators Report 218/19 September 218 Table of Contents Page 2. 1. Executive summary 2. External indicators 3. Performance by Key Priority 3.1 Deliver an efficient and
Consumer Price Index (CPI) March Consumer Price Index. March Contact Statistician: Phaladi Labobedi
 March Consumer Price Index. March Contact Statistician: Phaladi Labobedi") Consumer Price Index (CPI) March 2018 Consumer Price Index March 2018 Contact Statistician: Phaladi Labobedi Email: +267 3671300 March 2018 CPI 1 Published by STATISTICS BOTSWANA Private Bag 0024, Gaborone
Consumer Price Index (CPI) March 2018 Consumer Price Index March 2018 Contact Statistician: Phaladi Labobedi Email: +267 3671300 March 2018 CPI 1 Published by STATISTICS BOTSWANA Private Bag 0024, Gaborone
ST. EUSTATIUS. Sea Arrivals ( Summer ( Winter Yacht Arrivals 11, % 32.1%
 ST. EUSTATIUS TOURISM HIGHLIGHTS FOR 2007 VISITOR ARRIVALS Tourist Arrivals I ( Summer* ( Winter* 11,568 67.9% 32.1% Sea Arrivals ( Summer ( Winter Yacht Arrivals 5,858 48.5% 51.5% 707 ACCOMMODATION STATISTICS
ICPAC. IGAD Climate Prediction and Applications Centre Monthly Bulletin, February 2017
 IGAD CLIMATE PREDICTION AND APPLICATIONS CENTRE ICPAC Bulletin Issue March 2017 Issue Number: ICPAC/02/299 IGAD Climate Prediction and Applications Centre Monthly Bulletin, February 2017 For referencing
Statistics of Air, Water, and Land Transport Statistics of Air, Water, and Land. Transport Released Date: August 2015
 Statistics of Air, Water, and Land Transport 2014 2013 1 Released Date: August 2015 Table of Contents Introduction... 4 Key Points... 5 1. Air Transport... 6 1.1 Aircraft movements... 6 1.2 Number of passengers...
SYSTEM BRIEF DAILY SUMMARY
 SYSTEM BRIEF SUMMARY * ANNUAL (PEAK HOURS 7:00 AM TO 10:00 PM MON-SAT) MaxTemp NEL (MWH) Hr Ending Hr Ending LOAD ENERGY (MWH) INCREMENTAL COST DAY DATE Civic TOTAL MAXIMUM @Max MINIMUM @Min FACTOR ON
May 2011 Passenger and Cargo Traffic Statistics Reno-Tahoe International Airport
 May 2011 Passenger and Cargo Traffic Statistics Reno-Tahoe International Airport July 5, 2011 U.S. DOMESTIC INDUSTRY OVERVIEW FOR MAY 2011 All RNO Carriers Systemwide year over year comparison Average
U.S. DOMESTIC INDUSTRY OVERVIEW FOR OCTOBER 2010 All RNO Carriers Systemwide year over year comparison
 Inter-Office Memo Reno-Tahoe Airport Authority Date: November 22, 2010 To: Chairman and Board of Trustees From: Krys T. Bart, A.A.E., President/CEO Subject: RENO-TAHOE INTERNATIONAL AIRPORT OCTOBER 2010
Tourism Snapshot A focus on the markets in which the CTC and its partners are active
 Tourism Snapshot A focus on the markets in which the CTC and its partners are active www.canada.travel/corporate January 214 Volume 1, Issue 1 Key highlights Total arrivals from CTC s international markets
New Mexico Monthly Traffic Fatality Report, 2017
 New Mexico ly Traffic Fatality Report, 2017 Produced for the New Mexico Department of Transportation, Traffic Safety Division, Traffic Records Bureau, Under Contract No. 5801 by UNM Geospatial and Population
Council. Summary Schedule of Meetings (Approve LTP Consultation (Adoption of Annual Report)
") Summary Schedule of Meetings 2018 Jan Feb Mar Apr May June July Aug Sept Oct Nov Dec 001 Council - 13 27 (Approve LTP Consultation document) Extraordinary Council (additional as required) - 8 26 (Adoption
Summary Schedule of Meetings 2018 Jan Feb Mar Apr May June July Aug Sept Oct Nov Dec 001 Council - 13 27 (Approve LTP Consultation document) Extraordinary Council (additional as required) - 8 26 (Adoption
Month to Month Comparison of Crash-related Fatalities. Fatalities. - Jan Feb Mar Apr May Jun Jul Aug Sep Oct Nov Dec
 New Mexico ly Traffic Fatality Report, Produced for the New Mexico Department of Transportation, Traffic Safety Division, Traffic Records Bureau, Under Contract No. 5801 by UNM Geospatial and Population
Month to Month Comparison of Crash-related Fatalities. Fatalities. - Jan Feb Mar Apr May Jun Jul Aug Sep Oct Nov Dec
 New Mexico ly Traffic Fatality Report, 2018 Produced for the New Mexico Department of Transportation, Traffic Safety Division, Traffic Records Bureau, Under Contract No. 5801 by UNM Geospatial and Population
Month to Month Comparison of Crash-related Fatalities. Fatalities. - Jan Feb Mar Apr May Jun Jul Aug Sep Oct Nov Dec
 New Mexico ly Traffic Fatality Report, 2018 Produced for the New Mexico Department of Transportation, Traffic Safety Division, Traffic Records Bureau, Under Contract No. 6093 by UNM Geospatial and Population
LOUIS ARMSTRONG NEW ORLEANS INTERNATIONAL AIRPORT For the Period Ending September 30, Enplaned Passengers by Airline
 Domestic Scheduled Enplaned Passengers by Airline Alaska Airlines 7,070 4,331 63.2% 59,552 42,265 40.9% 1.2% 1.0% Virgin America 0 803-100.0% 12,231 803 1423.2% 0.3% 0.0% Allegiant Air 1,333 2,063-35.4%
AFTA Travel Trends. June 2017
 AFTA Travel Trends June 2017 AFTA Travel Trends Report 2017 Inbound and Outbound overview Introduction This snapshot provides an overview of the balance of trade between Inbound and Outbound Travel for
Consumer Price Index. January Contact Statistician: Phaladi Labobedi Fax: January 2018 CPI 1
 Consumer Price Index January 2018 Contact Statistician: Phaladi Labobedi Email: +267 3671300 Fax: 3952201 January 2018 CPI 1 Published by STATISTICS BOTSWANA Private Bag 0024, Gaborone Tel: 3671300 Fax:
STATISTICAL BULLETIN ON INTERNATIONAL ARRIVALS, DEPARTURES AND MIGRATION 2011 SERIES NO. SDT: Government of Tonga
 SERIES NO. SDT: 38-13 Government of Tonga STATISTICAL BULLETIN ON INTERNATIONAL ARRIVALS, DEPARTURES AND MIGRATION 2011 Statistics Department, P.O. Box 149, Nuku alofa, Kingdom of Tonga Website: www.spc.int/prism/tonga/
ANNUAL REPORT AIR TRAFFIC STATISTICS 2010/11 FINANCIAL YEAR
 ANNUAL REPORT AIR TRAFFIC STATISTICS 2010/11 FINANCIAL YEAR Released by Civil Aviation Authority of Botswana Department of Air Transport August 2011 ANNUAL REPORT: AIR TRAFFIC STATISTICS FOR THE 2010/
AFTA Travel Trends. July 2017
 AFTA Travel Trends July 2017 AFTA Travel Trends Report 2017 Inbound and Outbound overview Introduction This snapshot provides an overview of the balance of trade between Inbound and Outbound Travel for
I T N E T R E N R A N T A I T ON O AL A L A R A R R I R VA V L A S L S A N A D N D D E D PA
 INTERNATIONAL ARRIVALS AND DEPARTURES July 2015 Government of Tonga SD18M-36 Statistical Bulletin Month of Change from Change from July 2015 Number previous month previous year All Arrivals 8,252-28.0
Tourism in South Africa A statistical overview
 Tourism in South Africa A statistical overview Purpose of presentation Purpose of the presentation is to present different tourism statistics produced by Stats SA People like to travel we are a country
Cau River. Map of River. Table of Basic Data. Vietnam 5
 Cau River Map of River Table of Basic Data Name: Cau River Location: Thai Nguyen, Province, Viet Nam Area: 6,030 km 2 Origin: Mt. Phia Deng 1,527 m Outlet: Pha Lai Note: * Indicates missing data in some
Manual Number Description Part Number Revision Rev Date CYLINDER AND VALVE ASSEMBLY S Jun/1994
 25-60-119 CYLINDER AND VALVE ASSEMBLY S-802-40 4 Jun/1994 25-60-120 JETTHRUST ASPIRATOR S-900-5 1 Jan/1996 25-60-121 JETTHRUST ASPIRATOR S-900-7 1 Jan/1996 25-60-122 CYLINDER AND VALVE ASSEMBLY S-802-43
TOURISM NEW ZEALAND OUR VISITORS UNDERSTANDING <1% <1% <1% HISTORIC VIEW TOTAL ARRIVALS YE APRIL 2017
 TOURISM JAPAN 102K 3% NEW ZEALAND UNDERSTANDING OUR VISITORS Our market infographics are drawn from two different sources. HISTORIC VIEW: Past Visitor Research This is information collected about those
How Russians Spend Abroad 2010
 Russia Consumer research How Russians Spend Abroad Citibank s Annual Research of Credit Card Transactions Abroad August Spend Abroad Dynamics Share of spend abroad (as % of total spend over one year) 20%
August 2014 Passenger and Cargo Traffic Statistics Reno-Tahoe International Airport
 August 2014 Passenger and Cargo Traffic Statistics Reno-Tahoe International Airport October 8, 2014 U.S. DOMESTIC INDUSTRY OVERVIEW FOR AUGUST 2014 All RNO Carriers Domestic Systemwide year over year comparison
Passenger Traffic Achieves Strong Growth of 4.8% for the Month of August
 Passenger Traffic Achieves Strong Growth of 4.8% for the Month of August Montréal, 7 October Passenger traffic experienced a slight surge in growth to almost +5% for August compared to previous months
Board Box. October Item # Item Staff Page 1. Key Performance Indicators Sep 2018 M. Mungia Financial Report Aug 2018 H.
 Board Box October 2018 Item # Item Staff Page 1. Key Performance Indicators Sep 2018 M. Mungia 2-10 2. Financial Report Aug 2018 H. Rodriguez 11-15 ITEM 1 October 31, 2018 TO: FROM: RE: BOARD OF DIRECTORS
HOTEL INDUSTRY OVERVIEW. Texas
 HOTEL INDUSTRY OVERVIEW Texas DEMAND GROWTH STRONG BALANCED OCC & ADR GROWTH % Change Room Supply* 149M 1.3% Room Demand* 92M 5.6% Occupancy 61.6% 4.3% A.D.R. $90 4.4% RevPAR $55 8.9% Room Revenue* $8.3B
Beautiful Property in Cinnamon Ridge with Amazing Views - Walk to the...
 Beautiful Property in Cinnamon Ridge with Amazing Views - Walk to the... Summary 2 BR 2 Bath Condo - sleeps up to 7 Description C212 Cinnamon Ridge - a SkyRun Keystone Property With views like this you
IRRIGATION IN AGRICULTURE AND CLIMATE CHANGE. Agrotech, 2017
 IRRIGATION IN AGRICULTURE AND CLIMATE CHANGE Agrotech, 217 Legislation Current situation Needs, possibilities, existing and potential problems Irrigation is regulated with the Water Law, and when it comes
Belgrade City Report Q City Reports
 Belgrade City Report City Reports GDP Growth Q4 (y-o-y) Net Salary February Economy / Investment Economics 1.2% Inflation February (y-o-y) 1.5% 450 Unemployment Rate Q4 18.5% Retail Sales Index February
December 2013 Passenger and Cargo Traffic Statistics Reno-Tahoe International Airport
 December 2013 Passenger and Cargo Traffic Statistics Reno-Tahoe International Airport January 24, 2014 U.S. DOMESTIC INDUSTRY OVERVIEW FOR DECEMBER 2013 All RNO Carriers Domestic Systemwide year over year
middle left: Riversleigh fossils lower left: Constance Range images: Hj Preuss... Thx
 Upstreampaddle Summer 2008 18 middle left: Riversleigh fossils lower left: Constance Range images: Hj Preuss... Thx top right: road west of the Isa middle right: Constance Range lower right: rocky outcrop
Weekly Performance Update
 Pr. Rupert Vancouver Grain Monitoring Program Weekly Performance Update February 19, 19 For Grain (18-19 CY) Summary 1. Stocks in Store (' tonnes) Country Elevators % of Working T his Week Last Week Var.
Implementation Status & Results Indonesia Strategic Roads Infrastructure Project (P079906)
") Public Disclosure Authorized Public Disclosure Authorized The World Bank Implementation Status & Results Indonesia Strategic Roads Infrastructure Project (P079906) Operation Name: Strategic Roads Infrastructure
Public Disclosure Authorized Public Disclosure Authorized The World Bank Implementation Status & Results Indonesia Strategic Roads Infrastructure Project (P079906) Operation Name: Strategic Roads Infrastructure
March 2014 Passenger and Cargo Traffic Statistics Reno-Tahoe International Airport
 March 2014 Passenger and Cargo Traffic Statistics Reno-Tahoe International Airport April 25, 2014 U.S. DOMESTIC INDUSTRY OVERVIEW FOR MARCH 2014 All RNO Carriers Domestic Systemwide year over year comparison
Passenger and Cargo Statistics Report
 Passenger and Cargo Statistics Report Reno-Tahoe International Airport December 2014 U.S. DOMESTIC INDUSTRY OVERVIEW FOR DECEMBER 2014 All RNO Carriers Domestic Systemwide year over year comparison Average
The Geography of Climate
 The Geography of Climate Objective for Today: Today we will examine ways that latitude and landforms influence climate The focus of our study will be the South American Continent in the Formal Region known
Hector International Airport
 Hector International Airport Data Acquired via OAG on October 2, 216 Volume 3-17 April 216 thru March 217 (Scheduled Flights Only) October 2, 216 1.% 5.% 5.8% 5.% 3.5% 5.% 6.8%.5%.% -5.% -3.9% -1.4% -2.9%
Alberta Tourism Market Monitor
 Alberta Tourism Market Monitor Record-breaking 2016 for national parks visitation Alberta s national parks experienced new highs in 2016 as the provincial economy entered into recovery. Among the highs
LOUIS ARMSTRONG NEW ORLEANS INTERNATIONAL AIRPORT For the Period Ending August 31, Enplaned Passengers by Airline
 Enplaned Passengers by Airline Domestic Scheduled Alaska Airlines 3,797 4,077-6.9% 36,538 35,188 3.8% 1.0% 1.0% Allegiant Air 5,698 743 666.9% 41,738 14,843 181.2% 1.1% 0.4% American Airlines (US Air)
December 2012 Passenger and Cargo Traffic Statistics Reno-Tahoe International Airport
 December 2012 Passenger and Cargo Traffic Statistics Reno-Tahoe International Airport January 29, 2013 U.S. DOMESTIC INDUSTRY OVERVIEW FOR DECEMBER 2012 All RNO Carriers Systemwide year over year comparison
Hossana Solomon PhD; Henry H. Smith PhD University of the Virgin Islands (UVI)
") Effectiveness of Mandatory Law of Cistern Construction for Rainwater Harvesting on Supply and Demand of Public Water in U.S. Virgin Islands Hossana Solomon PhD; Henry H. Smith PhD University of the Virgin
Effectiveness of Mandatory Law of Cistern Construction for Rainwater Harvesting on Supply and Demand of Public Water in U.S. Virgin Islands Hossana Solomon PhD; Henry H. Smith PhD University of the Virgin
February Contact Statistician: Phaladi Labobedi. Tel: Fax:
 February 2018 Copyright 2018 @ Contact Statistician: Phaladi Labobedi Tel: 367 1300 Fax: 395 2201 1. CONSUMER PRICE INDEX February Statistics 2018 Botswana. Private Bag 0024 Gaborone Botswana Tel: (+267)
MARKET NEWSLETTER No 57 January 2012
 OVERVIEW OF INTRA-EUROPEAN UNION TRADING BETWEEN 2007/08 AND 2010/11 The data on intra-eu trade reported in this month s newsletter have been taken from the EUROSTAT database. However, it is important
Yukon Tourism Indicators Year-End Report 2013
 Yukon Tourism Indicators Yukon Tourism Indicators Overview This document is intended to provide a snapshot of tourism indicators for Yukon for 2013 (January to December). Contents 2013 Tourism Review 3
October 2013 Passenger and Cargo Traffic Statistics Reno-Tahoe International Airport
 October 2013 Passenger and Cargo Traffic Statistics Reno-Tahoe International Airport December 4, 2013 U.S. DOMESTIC INDUSTRY OVERVIEW FOR OCTOBER 2013 All RNO Carriers Systemwide year over year comparison
DECEMBER2014. InternationalVisitorArrivalstoBC. CanadianRe-entriestoBC. TravelPartiestoVisitorCentresbyRegion
 Research,Planning&Evaluation Page1 USTotal USOvernight Europe Asia/Pacific International Overnight - - - 4,453,346 245,014 286,729 444,425 727,196 703,547 574,646 442,525 286,160 269,439 237,541 236,124
November 2013 Passenger and Cargo Traffic Statistics Reno-Tahoe International Airport
 November 2013 Passenger and Cargo Traffic Statistics Reno-Tahoe International Airport December 26, 2013 U.S. DOMESTIC INDUSTRY OVERVIEW FOR NOVEMBER 2013 All RNO Carriers Domestic Systemwide year over
Tourism Snapshot A focus on the markets in which the CTC and its partners are active
 Tourism Snapshot A focus on the markets in which the CTC and its partners are active www.canada.travel/corporate June Volume 1, Issue 6 Key highlights CTC s overseas markets leaped 1% over the same month
MEIGS COUNTY TENNESSEE
 MEGS COUNTY TENNESSEE CONSOLDATED LSTNG OF MCROFLMED MEGS COUNTY RECORDS CONSSTNG OF ROLLS 1 13, 15 59, 65 85 and A15,982 A16,027 Note: available through nterlibrary Loan R Rolls 60-64 have been refilmed,
Steep increases in overnight stays and revenue
 Tourism Activity October 2016 December,15 th 2016 Steep increases in overnight stays and revenue Hotel establishments recorded 1.8 million guests and 5.0 million overnight stays in October 2016, figures
December 2011 Passenger and Cargo Traffic Statistics Reno-Tahoe International Airport
 December 2011 Passenger and Cargo Traffic Statistics Reno-Tahoe International Airport January 27, 2012 U.S. DOMESTIC INDUSTRY OVERVIEW FOR DECEMBER 2011 All RNO Carriers Systemwide year over year comparison
Table of Contents PAGE
 April 2015 EL PASO INTERNATIONAL AIRPORT MONTHLY ACTIVITY REPORT April 2015 Table of Contents PAGE AIRPORT ACTIVITY OVERVIEW 1 NONSTOP DESTINATION ANALYSIS 2 MAP OF NONSTOP DESTINATIONS 3 FLIGHT SCHEDULE
Report for Jan-Nov-2006 pdf. General Statistics
 Report for Jan-Nov-006 pdf Time range: /8/006 07:3:37 - /3/006 3:50:6 Generated on Mon Jan 0, 007-9:3:5 General Statistics Summary Summary Hits Total Hits 97,06 Average Hits per Day 89 Average Hits per
Let s Fly. Fort McMurray Airport Authority
 Let s Fly Fort McMurray Airport Authority The Largest Industrial Project in World History Canada s oil sands are found in three deposits the Athabasca, Peace River and Cold Lake deposits in Alberta and
Passenger and Cargo Statistics Report
 Passenger and Cargo Statistics Report RenoTahoe International Airport September 2016 U.S. DOMESTIC INDUSTRY OVERVIEW FOR SEPTEMBER 2016 All RNO Carriers Domestic Systemwide year over year comparison Average
Vancouver. July, 2015
 Vancouver July, 2015 7//20/2015 Gold Stocks Underperform Gold Source: Bloomberg Round Trip for Gold Stocks 200 150 100 54.20 50 2002 2003 2004 2005 2006 2007 2008 2009 2010 2011 2012 2013 2014 2015 Source:
MAURITIUS CANE INDUSTRY AUTHORITY MAURITIUS SUGARCANE INDUSTRY RESEARCH INSTITUTE
 MAURITIUS CANE INDUSTRY AUTHORITY MAURITIUS SUGARCANE INDUSTRY RESEARCH INSTITUTE Ref A 1/215 13 August 215 SUGAR CANE CROP 215 Status: End July 215 1. CLIMATE 1.1 Rainfall (Tables 1a and 1b, Figure 1)
Region 2: Tourism Partnership of Niagara. Visitor Statistics Visitor Spending Statistics Hotel Statistics Tourism Related Establishments
 Region 2: Tourism Partnership of Niagara Visitor Statistics Visitor Spending Statistics Hotel Statistics Tourism Related Establishments http://www.mtc.gov.on.ca/en/research/rtp/rtp.shtml tourism.research@ontario.ca
Tourism Snapshot A focus on the markets in which the CTC and its partners are active
 Tourism Snapshot A focus on the markets in which the CTC and its partners are active www.canada.travel/corporate April Volume 1, Issue 4 Key highlights Total arrivals from CTC s international markets improved
MinEx Health and Safety Statistics Q January to March
 MinEx Health and Safety Statistics Q1 2018 January to March MinEx Straterra Inc. Ground Level, 93 The Terrace PO Box 10668 Wellington 6143, New Zealand 0 TRIFR data: All operations - March 2016 to March
Table of Contents PAGE
 FEBRUARY 2018 EL PASO INTERNATIONAL AIRPORT MONTHLY ACTIVITY REPORT February 2018 Table of Contents PAGE AIRPORT ACTIVITY OVERVIEW 1 NONSTOP DESTINATION ANALYSIS 2 MAP OF NONSTOP DESTINATIONS 3 FLIGHT
Nova Scotia Tourism Indicators August 2017
 Nova Scotia Tourism Indicators August 2017 Data as of September 28, 2017 2017 Tourism Visitation YTD Jan Feb Mar Apr May Jun Jul Aug Sep Oct Nov Dec Visitor Entries ('000s) Road Visits by Entry Point*
AUGUST2014. InternationalVisitorArrivalstoBC. CanadianRe-entriestoBC. TravelPartiestoVisitorCentresbyRegion. Jan Feb Mar Apr May Jun YTD USTotal
 Research,Planning&Evaluation Page1 USTotal USOvernight Europe Asia/Pacific International Overnight -.9% 7.8% - -1.% 2,46,435 574,646 442,525 286,16 269,439 237,541 236,124 3.4% - 8.8% 7.7% - 9.7% 1,3,364
Weekly Performance Update
 Pr. Rupert Vancouver Grain Monitoring Program Weekly Performance Update January, 19 For Grain (1-19 CY) Summary 1. Stocks in Store (' tonnes) Country Elevators % of Working T his Week Last Week Var. fro
Jeneberang River. Serial No. : Indonesia-10 Location: South Sulawesi Area: 727 km 2 Origin: Mt. Bawakaraeng (2,833 MSL) Outlet: Makassar Strait
 Outlet: Makassar Strait") Jeneberang River Map of River Table of Basic Data Name: Jeneberang River Serial No. : Indonesia-10 Location: South Sulawesi S 5 10' 00" - 5 26' 00" E 119 23' 50" - 119 56' 10" Area: 727 km 2 Origin: Mt.
Jeneberang River Map of River Table of Basic Data Name: Jeneberang River Serial No. : Indonesia-10 Location: South Sulawesi S 5 10' 00" - 5 26' 00" E 119 23' 50" - 119 56' 10" Area: 727 km 2 Origin: Mt.
Passenger and Cargo Statistics Report
 Passenger and Cargo Statistics Report RenoTahoe International Airport December 2016 U.S. DOMESTIC INDUSTRY OVERVIEW FOR DECEMBER 2016 All RNO Carriers Domestic Systemwide year over year comparison Average
Consumer Price Index APRIL Consumer Price Index- April Contact Statistician: Phaladi Labobedi
 1 Consumer Price Index APRIL Contact Statistician: Phaladi Labobedi. Private Bag 0024 Gaborone Botswana Tel: (+267) 367 1300. Toll Free: 0800 600 200 Fax: (+267) Statistics 395 2201. Botswana Email: info@statsbots.org.bw
Nova Scotia Tourism Indicators March 2018
 Nova Scotia Tourism Indicators March 2018 Data as of May 31st, 2018 2018 Tourism Visitation YTD Jan Feb Mar Apr May Jun Jul Aug Sep Oct Nov Dec Visitor Entries ('000s) Road Visits by Entry Point* 220 68
January 2014 Passenger and Cargo Traffic Statistics Reno-Tahoe International Airport
 January 2014 Passenger and Cargo Traffic Statistics Reno-Tahoe International Airport March 12, 2014 U.S. DOMESTIC INDUSTRY OVERVIEW FOR DECEMBER 2013 All RNO Carriers Domestic Systemwide year over year
July 2012 Passenger and Cargo Traffic Statistics Reno-Tahoe International Airport
 July 2012 Passenger and Cargo Traffic Statistics Reno-Tahoe International Airport August 31, 2012 U.S. DOMESTIC INDUSTRY OVERVIEW FOR JULY 2012 All RNO Carriers Systemwide year over year comparison Average
Passenger and Cargo Statistics Report
 Passenger and Cargo Statistics Report RenoTahoe International Airport January 2017 U.S. DOMESTIC INDUSTRY OVERVIEW FOR JANUARY 2017 All RNO Carriers Domestic Systemwide year over year comparison Average
September 2013 Passenger and Cargo Traffic Statistics Reno-Tahoe International Airport
 September 2013 Passenger and Cargo Traffic Statistics Reno-Tahoe International Airport October 31, 2013 U.S. DOMESTIC INDUSTRY OVERVIEW FOR SEPTEMBER 2013 All RNO Carriers Systemwide year over year comparison
With the completion of this project, we would like to follow-up on the projections as well as highlight a few other items:
 TO: FROM: Mayor and Council Interim City Manager Rebecca Underhill, Director of Finance DATE: February 28, 2014 SUBJECT: Water Meter Project Analysis On March 28, 2012, Acting City Manager Mike Loftin
Weekly Performance Update
 Pr. Rupert Vancouver Grain Monitoring Program Weekly Performance Update January, 19 For (1-19 CY) Summary 1. Stocks in Store (' tonnes) Country Elevators % of Working T his Week Last Week Var. fro m Last
SIA GROUP FINANCIAL RESULTS
 FINANCIAL RESULTS For Ended 30 June 2018 197200078R Operating Result Q1 Q1 Better/ FY18/19 FY17/18 R1 (Worse) ($M) ($M) (%) Total Revenue 3,844 3,864 (0.5) Q1 Better/ FY17/18 R2 (Worse) ($M) (%) 3,689
FALKLAND ISLANDS International Tourism Statistics Report 2012
 FALKLAND ISLANDS International Tourism Statistics Report 2012 2 Falkland Islands Tourism 2012 Land-Based Tourism Number of tourist arrivals All tourists: Leisure tourists: 7,791 17% compared to 2011 1,937
12/10/2012 8:17 PM
 Login Enter a search item FIND: Local Association Builders & Remodelers About NAHB Newsroom Builders' Show Publications & Subscriptions Awards Housing Topics Housing Policy Housing Data Tools Community
The Outlook for the Residential Construction Industry Hunter and the Central Coast
 The Outlook for the Residential Construction Industry Hunter and the Central Coast Graham Wolfe HIA Chief Executive Industry Policy and Media HIA Industry Outlook Breakfast Newcastle February 2013 Backdrop:
Table 1 Feeder and slaughter cattle exports by destination. LiveLink - May 2017
 This edition of LiveLink includes the latest trends in Australian live export trade statistics and prices. Please note that all export data over the past nine months may later be revised. Feeder and slaughter
HAUS DAERR HAUS DAERR. Measured, drawn on site & compiled by Kazuo IWAMURA, August Muro, Haute-Corse, Calvi, Corsica, FRANCE CONTENS
 HAUS DAERR 01 HAUS DAERR Muro, Haute-Corse, Calvi, Corsica, FRANCE Measured, drawn on site & compiled by Kazuo IWAMURA, August 2017 CONTENS 1. CORSICA 3 2. MURO. 6 3. HAUS DAERR.7 3-1. Level 2 3-2. Level