Cross Border Update. August 30, 2011
|
|
|
- Eleanore Day
- 6 years ago
- Views:
Transcription

1 Cross Border Update August 30, 2011
2 The KCS Cross Border Network 2

3 KCS International Intermodal Corridor 3

4 Achieving Cross Border Success Mainline infrastructure Terminal infrastructure Channel strategy Network density and velocity Market access 4

5 Critical Impact of Victoria Rosenberg Shorter route improved transit speed and consistency Enabled cross border access to the Houston market Reduced route congestion Reduced cross border linehaul cost KCS Intermodal / Automotive Shipper Facility 5

6 Capital Spending Cross Border Network Between 2008 and 2011 (full year estimate), KCS projects it will have invested more than $275 million on the Houston to Lazaro Cardenas cross border corridor alone. 100 mile track expansion at Victoria Rosenberg San Luis Potosi Salinas Victoria Victoria Rosenberg Significant expansion and upgrade at Salinas Victoria (Monterrey) Planned investment at intermodal facility at Interpuerto in San Luis Potosi Puerta Mexico Upgraded and expanded intermodal layout at Puerta Mexico Upgrades and expansion in Lazaro Cardenas Continued investment in lift equipment at various locations Lazaro Cardenas 6
7 Key Cross Border Intermodal Coverage Salinas Victoria Interpuerto SLP Puerta Mexico Rosenberg Kansas City Southern covers 60 percent of Mexico s population and 63 percent of Mexico s GDP. SOURCE: INEGI Censo de Población y Vivienda


8 Effective Channel Strategy
9 Intermodal Border Crossing Cost Advantage Truck Rail Border Crossing Event / Other Costs Clearance Cost Clearance Cost Cost Difference Forwarder / Warehouse Maneuvers Yes $100 No $0 ($100) Dray Across Bridge Yes $115 No $0 ($115) Electronic Processing Yes $25 Yes $25 $0 Seals Yes $5 Yes $5 $0 Total Costs $245 $30 ($215) 9
10 Percent Share of All Shipments Percent Share of Rail Shipmetns Laredo, TX is the Leading Border Crossing 50% 45% 40% 35% 30% 25% 20% 15% 10% 5% 0% 2010 U.S. Surface Trade by Border Crossing Imports and Exports (Volume) Laredo, TX El Paso, TX Eagle Pass, TX Nogales, AZ Hidalgo, TX Otay Mesa, CA Brownsville, TX 100% 90% 80% 70% 60% 50% 40% 30% 20% 10% 0% All Shipments Rail Shipments SOURCE: TranSystems Freight Flow Analysis,
11 Cross Border Shipments by Truck 2.6 million truckloads originate or terminate in KCS Target Market 50 percent of loads move to/from locations deep into Mexico KCS operates the Laredo rail bridge on both sides of border The current KCS intermodal cross border market share represents about 1 percent of available market Eastern Upper Midwest Midwest 64, ,863 Central Plains 70,447 South Central 1,514,854 Northeast Great Lakes 217, ,817 Southeast 128,730 Atlantic States 180,424 SOURCE: TranSystems, Freight Flow Analysis


12 3 KANSAS CITY CHICAGO MONTREAL TORONTO DETROIT WORCHESTER HARRISBURG NEW YORK MARION PHILADLEPHIA MEMPHIS CHARLOTTE DALLAS ATLANTA JACKSON JACKSONVILLE HOUSTON TITUSVILLE MONTERREY MIAMI SAN LUIS POTOSI LAZARO CARDENAS TOLUCA/MEXICO CITY 12
")
13 KCS Intermodal Cross Border Growth Cross Border Volumes 14,749 Cross Border Revenue ($ in thousands) $13,605 11, % $9, % 3, % $4, % YTD 2009 YTD 2010 YTD 2011 YTD 2009 YTD 2010 YTD 2011 (*Data projected through August 31, 2011) 13
14 Units (millions) Share of North American Production Between 2005 and 2013, Mexico s Auto Production is Projected to Double 3.5 Mexican Automobile Production 25% % 2 15% % 5% Units (millions) Units Forecast (millions) % Share % Share Forecast 0% SOURCE: North America Production Quarterly Canada & Global Auto Report / Scotiabank Group, Autocast 14

15 Mexican Automotive Opportunity KCS currently serves ten automotive plants in Mexico. OEMS in site selection Mazda Toyota Tata Motors Plant expansion projects Chrysler Flat Toluca VW Puebla Ford Cuautitlan GM SLP Increased production creates new cross border part and vehicle opportunities 15
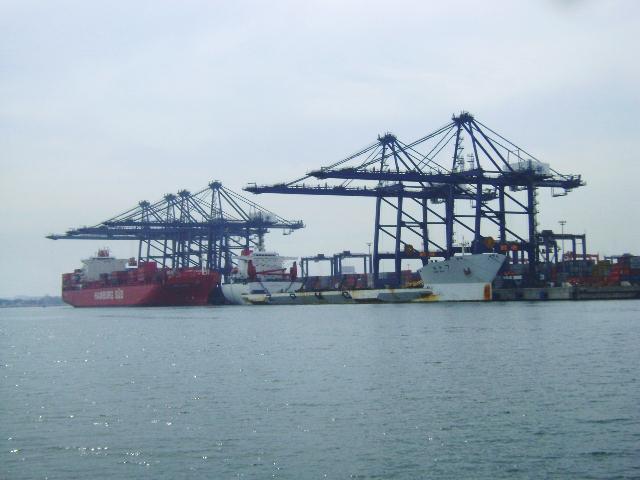
16 Port of Lazaro Cardenas 16

17 Port of Lazaro Cardenas 17


18 The Lazaro Cardenas Advantage No environmental issues/fees No infrastructure issues/fees Productive workforce Pro-business local government State of the art port infrastructure Natural deep water port maximum vessel flexibility Ample land for future terminal expansion 18

19 Lazaro Cardenas Growth Plans New Container Terminal Bulk Facility 19


20 Nine Major Ocean Carriers at Port of Lazaro Cardenas 20
21 Phase Two Infrastructure 21
22 TEUs Growth at Lazaro Cardenas Source: Secretaría de Comunicaciones Y Transportes, BMO Capital Markets, Port of Lazaro Cardenas 22
23 Percent Growth (volume) Lazaro Cardenas is the Fastest Growing Container Port in North America 40% North American Container Ports 2010 Year over Year Growth 35% 30% 25% 20% 15% 10% 5% 0% All North American Ports US Ports Canada Ports Mexico Ports Lazaro Cardenas SOURCE: The Journal of Commerce, May 9,

24 KCS Lazaro Cardenas Growth Revenue 14,087,381 Carloads 40,479 7,194,238 10,395,535 36% 21,933 29,439 85% 45% 34% Q Q Q Q Q Q

25 The Lazaro Land Bridge Route Advantage The Lazaro Cardenas Houston route is 335 rail miles shorter than the LA Houston Route. Oakland to Houston on UP: 2,050 miles Houston Routes LA to Houston on BNSF: 1,755 miles LA to Houston on UP: 1,633 miles Lazaro Cardenas to Houston: 1,298 miles SOURCE: PC Miler 25
26 Transit Through Lazaro Cardenas is 16 percent Lower than Southern California 1 Average Vessel Costs includes fuel 2 Alameda Corridor, Security & Harbor Maintenace Sample Total Route Costs From Shanghai to Houston (Per FEU) Ocean Carrier Cost Area Marine Terminal Southern California Lazaro Cardenas Cost Difference Vessel 1 $1,338 $1,590 $252 Total $1,338 $1,590 $252 Asia Terminal $250 $250 $0 US/MEX Terminal $580 $160 ($420) Rail Lift $180 $80 ($100) Total $760 $240 ($520) Fees 2 $149 $0 ($149) Total $149 $0 ($149) Rail Service Rail Rate $1,425 $1,325 ($100) Fuel Surcharge $513 $315 ($198) Total $1,938 $1,640 ($298) Grand Total $4,435 $3,720 ($715) SOURCE: Mercator International, LLC
27 Houston Market 27

28 Houston Metro Market Reach Ft. Worth 270 MI Dallas 240 MI Shreveport 240 MI Beaumont 90 MI Baton Rouge 270 MI San Antonio 240 MI Port Arthur 90 MI Laredo 350 MI Corpus Christi 220 MI Freeport 60 MI Kansas City Southern Intermodal Shipper Facility 28

29 CenterPoint Intermodal Center Houston 29
30 Units KCS New Business via Rosenberg 25,000 20,000 15,000 10,000 5, * *2011 Forecast 30
31 Units KCS Growth from Houston 8,000 7,000 6,000 5,000 4,000 CAGR = 62% 3,000 2,000 1, * *2011 Forecast 31


32 Based on our comprehensive review of possible locations, Victoria s proximity to our supply base, access to ports and other transportation, as well as the positive business climate in Texas made this the ideal site for this project. Last August, Caterpillar announced its plans to construct a 600,000 sq. ft. facility in Victoria, Texas for $130 million. In June 2011, Caterpillar, Inc. announced its plan to further expand its under construction, state of the art, 850,00 sq. ft. manufacturing facility in Victoria, Texas by an additional 200,000 square feet. The new expansion will add an additional $70 million to the project. The plant is expected to be completed in mid The new facility will manufacturer two excavator models currently produced in Aurora, IL and three models produced in Japan. 32


33 Recent Ethylene Growth Announcements SOURCE: ICIS, Wall Street Journal 33
34 Mexico: The Story Behind the Headlines 34
35 The Mainstream Media Headlines Mexicans have endured plenty of horrific crimes during their country's bloody five-year war against drug gangs. But the arson in the northern Mexican city that killed 52, mostly women, was a macabre milestone NPR, August 2011 Since President Felipe Calderón took office in December 2006, declaring war on traffickers, roughly 43,000 people have been killed in drug-related homicides [in Mexico], according to government figures and newspaper estimates. The pace of killings is escalating. More than half the dead, 22,000, were killed in the past 18 months, a rate of one every 35 minutes. Wall Street Journal, August 2011 The number of murder victims unearthed in mass graves in northern Mexico this month has risen to 279, making it easily the worst discovery of its kind since the government began a campaign against drug cartels. Reuters, April
36 Recent Business Headlines Direct foreign investment totaled $10.6 billion in the first half of the year this put the country on target to reach official forecasts of $20 billion for the year. Reuters, August 2011 Mexico's economy is expected to expand by more than 4.5 percent this year. CNBC, June 2011 In 2010 the Mexican peso appreciated against the dollar. Inflation was essentially flat. Foreign reserves rose to $113 billion Trade with the U.S. reached an all-time high of nearly $400 billion. The Wall Street Journal, May 2011 When it comes to global manufacturing, Mexico is quickly emerging as the "new" China. Keith Fitz-Gerald, Chief Investment Strategist, Money Morning 36

37 KCSM Shipment Security percent of shipments move without a claim Multi-layered safety and security process Full-time and contract agents Canine units Guard points Patrol vehicles 24 x 7 security desk - tracks data, trends and serves as the communication link Full process integration with U.S. and Mexico law enforcement VACIS scanning system in operation at Lazaro Cardenas, Nuevo Laredo and Laredo X-ray cargo imaging Radiation scanning 37
38 The Story Behind the Headlines Trade Growth Mexico has 13 Free Trade Agreements involving more than 44 countries 2010 US imports rose 31.4 percent from 2009 The United States is Mexico s largest trading partner Wage Rate Labor costs are converging with China Proximity Supply chain compression Time zones are similar Travel access is faster and cheaper Currency In US dollar terms, since 2005 Chinese products have become about 40 percent more expensive than those sourced in Mexico Transportation Costs percent less expensive to U.S. Markets than for those coming from Asia SOURCE: Department of Commerce, Bloomberg Businessweek, Mexico Today, J.P. Morgan, U.S. Bureau of Labor Statistics 38
39 Jan-04 Apr-04 Jul-04 Oct-04 Jan-05 Apr-05 Jul-05 Oct-05 Jan-06 Apr-06 Jul-06 Oct-06 Jan-07 Apr-07 Jul-07 Oct-07 Jan-08 Apr-08 Jul-08 Oct-08 Jan-09 Apr-09 Jul-09 Oct-09 Jan-10 Apr-10 Jul-10 Oct-10 Jan-11 Apr-11 Cross Border Trade Volume U.S. Mexico trade has returned to pre-recession levels US TRADE with Mexico ($ billions) US industrial Production Index SOURCE: Bureau of Transportation Statistics, BMO Capital Markets 39
40 U.S. Dollar Mexico vs. China Wage Rate Since 2003, wages in Mexico have risen only 25 percent compared to 218 percent in China. SOURCE: International Labour Organization, U.S. Bureau of Labor Statistics 40
41 16 Mexico s Currency Advantage In US Dollar terms, since 2005 products sourced in Mexico have become about 40 percent less expensive than products sourced in China. Peso & Yuan Exchange Rate Mar-04 Mar-05 Mar-06 Mar-07 Mar-08 Mar-09 Mar-10 Mar-11 6 Mexican Peso / USD Chinese Yuan/USD SOURCE: Banco de México, Chinability 41
 9th largest talent pool of IT professionals in the world SOURCE: INEGI, UNESCO, ANUIES, MEXICO IT")
42 Highly Skilled Work Force Population of 112 million people (average age of 29 years old) By 2030, Mexico will reach its lowest Dependency Ratio More than 90,000 engineers graduate every year 3x higher than the US (per capita) 9th largest talent pool of IT professionals in the world SOURCE: INEGI, UNESCO, ANUIES, MEXICO IT 42


43 Shipping Costs Advantages to Chicago Marine and Ground Transportation Shanghai to Chicago Shipping Cost $5,243 Cost per cubic foot $2.19 Transit Time 25 days Truck Transportation Monterrey Mexico to Chicago Shipping Cost $3,479 Cost per cubic foot $0.91 Transit Time 4-5 days Rail Transportation Monterrey Mexico to Chicago Shipping Cost $1,525 Cost per cubic foot $0.40 Transit Time 6-7 days 43

44 Foreign Direct Investment (FDI) in Mexico 2010 FDI multiyear projects reached $18.6 billion: - New Investments: $12B - Reinvestments: $2.6B - Intra-company: $4B Multiyear Investments over $150 million 2011 Q1 FDI reached $4.8 billion - Full year projected at $22B 75 FDI projects will be developed from Investments focus on: Aerospace, Automotive, Mining, Appliances & Wind Energy Wal-Mart is opening new stores nationwide - $958M SOURCE: ProMexico 44

45 The Emerging Population on KCS Population Growth: Overall, the South and West accounted for 84.4 percent of the U.S. population increase from 2000 to 2010 The South grew by 14.3 million over the decade to million people, while the West increased by 8.7 million to reach 71.9 million people Population Decrease 0-20 Percent Increase Percent Increase Population Forecast: By 2030, the U.S. population is expected to increase by 29.2 percent, with most of that growth occurring in the Southeast and West. Bismarck Fargo MINNESOTA Augusta MICHIGAN Montpelier Portland NEW VT WISCONSIN YORK Concord St Paul NH SOUTH DAKOTA MICHIGAN Minneapolis Rochester Albany MASS Boston Rapid City Pierre Buffalo Hartford Providence RI Sioux Falls Milwaukee CONN Madison Lansing Detroit PENNSYLVANIA Waterloo Newark New York Scottsbluff Sioux City Chicago Cleveland Trenton NEBRASKA IOWA Toledo South Bend Harrisburg Pittsburgh NEW JERSEY Omaha Des Moines INDIANA Philadelphia Baltimore Dover Champaign Columbus DELAWARE Denver Lincoln ILLINOIS Annapolis DC Indianapolis OHIO WEST Springfield MARYLAND Cincinnati Kansas VIRGINIA Charleston Colorado Topeka City Richmond COLORADO St Louis Springfield Springs Lexington Norfolk KANSAS Jefferson City Frankfort VIRGINIA Durango Wichita MISSOURI KENTUCKY Raleigh Nashville NORTH CAROLINA Santa Fe Oklahoma Knoxville ARKANSAS TENNESSEE Charlotte Amarillo City Tulsa Albuquerque SOUTH Columbia Little Rock OKLAHOMA Atlanta CAROLINA NEW MEXICO El Paso NORTH DAKOTA Ft. Worth TEXAS Austin San Antonio Dallas Houston Texarkana LOUISIANA Baton Rouge MISSISSIPPI Jackson New Orleans Montgomery ALABAMA Birmingham Tallahassee GEORGIA Savannah Jacksonville FLORIDA Orlando Charleston MAINE Percent Increase Miami SOURCE: U.S. Census Judson Drennan/The News & Observer 45

46 % of Total KCS Operating Revenues Cross-Border Linehaul & Fuel Revenue ($M) Total Cross Border Revenue 30% $120 25% $100 20% 15% $80 10% Q109 Q209 Q309 Q409 Q110 Q210 Q310 Q4 10 Q1 11 Q2 11 $60 X-Border Revenue % of Total Revenue 46

47 47
Geography Quiz: State Capitals
 Geography Quiz: State Capitals Directions: Select the correct capital city for each state in the United States of America. 1. Alabama a. Jackson b. Montgomery c. Jefferson city d. Augusta e. Boston 6.
RANKING OF THE 100 MOST POPULOUS U.S. CITIES 12/7/ /31/2016
 OVERVIEW OF THE DATA The following information is based on incoming communication to the National Human Trafficking Hotline via phone, email, and online tip report from December 7, 2007 December 31, 2016
Appendix D: Aggregation Error for New England Metro Areas and for Places
 Appendix D: for New England Metro Areas and for Places D-1 Appendix D: s Figure D-1: New England Metro Areas - Summary of Tract s (2000) Metro ID (msapma99) Metro Area Name Census NCDB 1120 Boston, MA-NH
Census Affects Children in Poverty by Professors Donald Hernandez and Nancy Denton State University of New York, Albany
 Phone: (301) 457-9900 4700 Silver Hill Road, Suite 1250-3, Suitland, MD 20746 Fax: (301) 457-9901 Census Affects in Poverty by Professors Donald Hernandez and Nancy Denton State University of New York,
Union Pacific Update September 22, 2016 North East Association of Rail Shippers Conference
 Union Pacific Update September 22, 2016 North East Association of Rail Shippers Conference I Sam Calabro Assistant Vice President Domestic Intermodal Sales 1 Seattle Eastport Portland Twin Cities Duluth
Location, Location, Location. 19 th Annual NIC Conference NIC MAP Data & Analysis Service
 Location, Location, Location 19 th Annual NIC Conference NIC MAP Data & Analysis Service The Great Occupancy Decline 94% Occupancy Trends Majority Nursing Seniors Housing 93% 92% 91% 92.8% 91.0% 90% 89%
ALN Apartment Data, Inc. (Continued on next page)
") AK - Anchorage 93.0% 90.9% -210-2.2% $1,035 $1,018-1.7% 93.0% 90.9% -210-2.2% $1,035 $1,018-1.7% AK - Misc. AK 90.3% 86.8% -350-3.8% $1,218 $1,245 2.3% 90.3% 86.8% -350-3.8% $1,218 $1,245 2.3% Alaska Average
AK - Anchorage 93.0% 90.9% -210-2.2% $1,035 $1,018-1.7% 93.0% 90.9% -210-2.2% $1,035 $1,018-1.7% AK - Misc. AK 90.3% 86.8% -350-3.8% $1,218 $1,245 2.3% 90.3% 86.8% -350-3.8% $1,218 $1,245 2.3% Alaska Average
National Electric Rate Study
 National Electric Rate Study Ranking of typical residential, commercial and industrial electric bills 2017 Study 1040 O Street, P.O. Box 80869 Lincoln, NE 68501-0869 p: 402.475.4211 www.les.com Lincoln
Oct-17 Oct-18 bps %CHG Oct-17 Oct-18 %CHG Oct-17 Oct-18 bps %CHG Oct-17 Oct-18 %CHG
 AK - Anchorage 92.6% 89.9% -270-2.9% $1,023 $1,011-1.2% 92.6% 89.9% -270-2.9% $1,023 $1,011-1.2% AK - Misc. AK 89.9% 85.8% -410-4.6% $1,227 $1,230 0.2% 89.9% 85.8% -410-4.6% $1,227 $1,230 0.2% Alaska Average
FBI Drug Demand Reduction Coordinators
 FBI Drug Demand Reduction Coordinators Alabama 2121 Building, Room 1400 Birmingham, AL 35203 (205) 252 7705 One St. Louis Centre One St. Louis Street Mobile, AL 36602 (334) 438 3674 Alaska 222 West Seventh
Rank Place State Native Hawaiian and Pacific Islander population (alone or in combination
 TABLE 2a: 100 Largest Places Ranked by Number of s (race alone or in *) Living in Hard-to- Census Rank Place State (alone or in 1 Honolulu (CDP) HI 64,196 11,130 17.3 2 New York City NY 14,981 8,211 54.8
At the end of the bill (before the short title), insert the following:
, insert the following:") AMENDMENT TO H. R. (CONTINUING APPROPRIATIONS, 0) OFFERED BY MR. PENCE OF INDIANA At the end of the bill (before the short title), insert the following: 0 SEC. ll. None of the funds made available by this
AMENDMENT TO H. R. (CONTINUING APPROPRIATIONS, 0) OFFERED BY MR. PENCE OF INDIANA At the end of the bill (before the short title), insert the following: 0 SEC. ll. None of the funds made available by this
Norwegian's Free Airfare Promotion
 Norwegian's Free Airfare Promotion Start planning your next vacation with 200+ cruises to incredible destinations, including Alaska, Bahamas & Florida, Bermuda, Canada & New England, Caribbean, Mexican
Major Metropolitan Area Sales Tax Rates
 August 19, 2010 No. 239 FISCAL FACT Major Metropolitan Area Sales Tax Rates By Lawrence Summers Introduction General sales taxes levied by state, county and city governments in the United States vary greatly,
Monthly Employment Watch: Milwaukee and the Nation's Largest Cities
 Monthly Employment Watch: Milwaukee and the Nation's Largest Cities A monthly report on employment trends in the nation s largest cities Prepared by: The University of Wisconsin-Milwaukee Center for Economic
BLACK KNIGHT HPI REPORT
 CONTENTS 1 OVERVIEW 2 NATIONAL OVERVIEW 3 LARGEST STATES AND METROS 4 FEBRUARY S BIGGEST MOVERS 5 20 LARGEST STATES 6 40 LARGEST METROS 7 ADDITIONAL INFORMATION OVERVIEW Each month, the Data & Analytics
International migration. Total net migration. Domestic migration
 Indicator Direction Comparables a. Net population migration b. Crime rate (city) c. Housing costs d. Cost-of-living index N.A. e. State & local tax intensity f. Performing arts groups g. Air quality index
MANGO MARKET DEVELOPMENT INDEX REPORT
 MANGO MARKET DEVELOPMENT INDEX REPORT 2015-2016 UNDERSTANDING THE MARKET INDEX The Mango Market Development Index is designed to measure and compare mango sales volume relative to population by region
Lower Income Journey to Work Market Share From American Community Survey
 Lower Income Journey to Work Market Share From American Community Survey 2006-2010 Table 1: Overall National Data Table 2: Car, Truck or Van Table 3: Transit Table 4: Metrics Table 1 Work Trip Market Share:
Mango Market Development Index
 Mango Market Development Index 2016-2017 Understanding the Market Index The Mango Market Development Index is designed to measure and compare mango volume sold at retail relative to population by region
Park-Related Total* Expenditure per Resident, by City
 Park-Related Total* per Resident, by City FY 2008 City Population Total Park per Resident Washington, D.C. 591,833 $153,324,830 $259 Seattle 598,541 $150,672,543 $252 Scottsdale 235,371 $50,429,049 $214
Hector International Airport Fargo, North Dakota
 Hector International Airport Fargo, North Dakota Volume 072 Twelve Months Ended June 2007 November 2007 Airlines Serving Fargo Carried 830 Onboard Passengers Per Day for the Twelve Months Ended June 2007,
Monthly Employment Watch: Milwaukee and the Nation's Largest Cities
 Monthly Employment Watch: Milwaukee and the Nation's Largest Cities A monthly report on employment trends in the nation s largest cities Prepared by: The University of Wisconsin-Milwaukee Center for Economic
Charleston, WV 18 Juneau, AK Peoria, IL Jefferson City,
 2004 Ranking Diocese Catholics Diocesan Seminarians 2004 Ratio (Catholics / Seminarians) 2003 Ranking 1 Lincoln, NE 89431 35 2555 2 2 Yakima, WA 68561 20 3428 5 3 Savannah, GA 75987 22 3454 13 4 Cheyenne,
DIRECT FASTENING. 20V MAX * Cordless Concrete Nailer
 DIRECT FASTENING 20V MAX * Cordless INTERCHANGEABLE CONTACT TRIPS Drywall and Mechanical contact trips for application versatility Removable; tool-free ADJUSTABLE POWER 3 settings for pin depth adjustment
Hector International Airport Fargo, North Dakota
 Hector International Airport Fargo, North Dakota Volume 073 Twelve Months Ended September 2007 January 2008 Airlines Serving Fargo Carried 831 Onboard Passengers Per Day for the Twelve Months Ended September
District Match Data Availability
 District Match Data Availability National & State Data Location Available National Data Australia Parliament, Provincial and Territory Assemblies Canada Parliament, Provincial Legislative Assemblies New
Trial Locations ADAPT: AGS 003. United States, Arizona. United States, Arkansas. United States, California. United States, Colorado
 Trial Locations ADAPT: AGS 003 United States, Arizona Scottsdale, Arizona, United States, 85259 United States, Arkansas Little Rock, Arkansas, United States, 72205 United States, California La Jolla, California,
OUR U.S. FULL SERVICE OFFICES:
 HOW TO NAME US AS YOUR REGISTERED AGENT Listing the correct name and address of your Registered Agent on filings is critically important. To make sure you have the most current address for COGENCY GLOBAL
Monthly Employment Watch: Milwaukee and the Nation's Largest Cities
 Monthly Employment Watch: Milwaukee and the Nation's Largest Cities A monthly report on employment trends in the nation s largest cities Prepared by: The University of Wisconsin-Milwaukee Center for Economic
A COMPARISON OF THE MILWAUKEE METROPOLITAN AREA TO ITS PEERS
 KRY/WJS/EDL #222377 (PDF: #223479) 1/30/15 PRELIMINARY DRAFT Memorandum Report A COMPARISON OF THE MILWAUKEE METROPOLITAN AREA TO ITS PEERS EXECUTIVE SUMMARY This memorandum report provides a statistical
Hector International Airport Fargo, North Dakota
 Hector International Airport Fargo, North Dakota Volume 081 Twelve Months Ended March 2008 July 2008 Airlines Serving Fargo Carried 838 Onboard Passengers Per Day for the Twelve Months Ended March 2008,
FILED: NEW YORK COUNTY CLERK 10/14/ :25 PM INDEX NO / /4/2016 Office locations in US states: PwC
 FILED: NEW YORK COUNTY CLERK 10/14/2016 02:25 PM INDEX NO. 451962/2016 10/4/2016 Office locations in US states: PwC NYSCEF DOC. NO. 9 RECEIVED NYSCEF: 10/14/2016 PwC office locations in (by state) Below
SLS Transportation Group
 THE STANDARDS: Chauffeurs SLS chauffeurs are both skilled and talented, employed on the basis of qualification, experience, appearance, communication skills, and knowledge of the city, suburbs and rural
ustravel.org/travelpromotion
 Agenda 1. Power of Travel Promotion Resources 2. New Tool: Travel Economic Impact Calculator 3. Accessing data through Interactive Travel Analytics 4. Unused Vacation Time Opportunity 5. Highlights from
 Chapter Name Albuquerque Ann Arbor Augusta Baton Rouge Bayou Oncology (C'est Bon) Big Sky Bluegrass Blue Ridge of Virginia Bluewater International Boston Broward Florida Bucks Montgomery Counties California
CSC Agent Office Addresses
 CSC Agent Office Addresses Alabama Montgomery, Inc. 641 South Lawrence Street Montgomery, AL 36104 Montgomery County Arizona Phoenix 2338 West Royal Palm Road, Suite J Phoenix, AZ 85021 Maricopa County
APPENDIX D SIZING STORM WATER DRAINAGE SYSTEMS. TABLE D-1 Maximum Rates of Rainfall for Various Cities
 APPENDIX D SIZING STORM WATER DRAINAGE SYSTEMS D 1 Roof Drainage. The rainfall rates in Table D-1 should be used for design unless higher values are established locally. D 2 Sizing by Flow Rate. Storm
Monthly Employment Watch: Milwaukee and the Nation's Largest Cities
 Monthly Employment Watch: Milwaukee and the Nation's Largest Cities A monthly report on employment trends in the nation s largest cities Prepared by: The University of Wisconsin-Milwaukee Center for Economic
ILLINOIS INTERSTATE AND INTRASTATE LOCAL REDUCED CITY-PAIR FARES
 The following section contains city-pair fares that are lower than walkup mileage-based fares. Although shown in only one direction, the fares in this section apply in both directions, unless otherwise
INDIANA INTERSTATE AND INTRASTATE LOCAL REDUCED CITY-PAIR FARES
 The following section contains city-pair fares that are lower than walkup mileage-based fares. Although shown in only one direction, the fares in this section apply in both directions, unless otherwise
Monthly Employment Watch: Milwaukee and the Nation's Largest Cities
 Monthly Employment Watch: Milwaukee and the Nation's Largest Cities A monthly report on employment trends in the nation s largest cities Prepared by: The University of Wisconsin-Milwaukee Center for Economic
Mechanical Anchoring. Screw-Bolt+ CODE LISTED CODE LISTED ICC-ES ESR-3889 CRACKED & UNCRACKED CONCRETE ICC-ES ESR-4042 GROUTED CONCRETE BLOCK
 Mechanical Anchoring CODE LISTED ICC-ES ESR-3889 CRACKED & UNCRACKED CONCRETE CODE LISTED ICC-ES ESR-4042 GROUTED CONCRETE BLOCK NEW APPROVED FOR GROUTED CONCRETE BLOCK (CMU) no load reduction in bed joints
Interest Bearing. Availability Schedule. April For Encoded Cash Letter Deposits received in Miami. Instructions. Schedule
 Instructions Schedule Bank of America OnUs Supplemental Interest Bearing Availability Schedule For Encoded Cash Letter Deposits received in Miami April 2011 Schedule 01 Availability Schedule for Corporate
Monthly Employment Watch: Milwaukee and the Nation's Largest Cities
 Monthly Employment Watch: Milwaukee and the Nation's Largest Cities A monthly report on employment trends in the nation s largest cities Prepared by: The University of Wisconsin-Milwaukee Center for Economic
16,000 50,000 WALKATHON CITIES WALKERS MILES
 WALKATHON 54 USA ARIZONA Phoenix ARKANSAS Little Rock CALIFORNIA Fresno Los Angeles Sacramento San Diego San Francisco San Jose CONNECTICUT Hartford DELAWARE New Castle FLORIDA Miami Orlando Tampa GEORGIA
Fort Lauderdale August 8, 2017
 Fort Lauderdale August 8, 2017 8/10/2017 TAP Software Analytics Division Brian Finucane TAP Reports Jeff Eastman TAP Hotel Reports Jeanne Eastman TAP Data Source Jeff Eastman Cloud Database Numerous Data
Major US City Preparedness For an Oil Crisis Which Cities and Metro Areas are Best Prepared for $4 a Gallon Gas and Beyond?
 Major US City Preparedness For an Oil Crisis Which Cities and Metro Areas are Best Prepared for $4 a Gallon Gas and Beyond? March 4, 2008 By Warren Karlenzig President Common Current www.commoncurrent.com
OBSERVERS. We shall not be moved NAACP. national Convention. advance registration form. 104 th ANNUAL CONVENTION
 OBSERVERS We shall not be moved 104 NAACP th national Convention advance registration form orlando, florida July 13-17, 2013 1 AT-LARGE OBSERVERS advanced registration Section I CONTACT INFORMATION (Please
Per capita carbon emissions from transportation and residential energy use, 2005
 Per capita carbon emissions from transportation and residential energy use, 2005 Metropolitan Area Carbon Footprint Honolulu, HI 1 1.356 Los Angeles-Long Beach-Santa Ana, CA 2 1.413 Portland-Vancouver-Beaverton,
DEGREE DAY AND DESIGN TEMPERATURES
 DEGREE DAY AND TABLE D DEGREE DAY AND a FOR CITIES IN THE UNITED S / % Dry bulb / % Wet bulb / % AL Birmingham Huntsville Mobile Montgomery, 3,,, 33 3 3 3 3 AK Anchorage Fairbanks Juneau Nome,,,, -8-8
Houston Economic Update. Presented by Patrick Jankowski Vice President, Research Greater Houston Partnership
 Houston Economic Update Presented by Patrick Jankowski Vice President, Research Greater Houston Partnership Houston Astros - Percent Regular Season Games Won Help from the bullpen this year Help from the
Strategic Central Florida Location Big Bend Road & U.S. Highway 41
 Strategic Central Florida Location Big Bend Road & U.S. Highway 41 Park Highlights 337,447 SF (Building 13124) under construction June 2017 occupancy Cross-Dock 101 Trailer Spaces 1.5 miles from I-75 8
333 W. Campbell Road, Suite 440 Richardson, Texas Cruising for Charity with Randy Limbacher in Tahiti July 28, 2007
 333 W. Campbell Road, Suite 440 Richardson, Texas 75080 972.238.1998 800.952.1998 Cruising for Charity with Randy Limbacher in Tahiti July 28, 2007 Join me for this special annual event to raise money
CHAPTER CHARTER DATES
 Bi-State 146 I Jun 4 1985 Boston 001 I Feb 8 1912 formerly Massachusetts Central New York 010 I May 28 1941 Champlain Valley 111 I Oct 2 1970 Connecticut 004 I Nov 8 1940 Granite State 152 I Mar 19 1987
840 PHASE I AVAILABLE
 PHASE I AVAILABLE PHASE I - SPEEDWAY BUILDING I - 689,4 SF EXPANDABLE to 1,500,000 SF Class A Distribution Center Under Construction LEBANON MT. JULIET NASHVILLE Nashville International Airport WILSON
House Price Appreciation by State Percent Change in House Prices Period Ended June 30, 2009
 House Price Appreciation by State Percent Change in House Prices (Estimates use FHFA s Seasonally-Adjusted Purchase-Only House Price Index) State Rank* 1-Yr. Qtr. 5-Yr. Since 1991Q1 North Dakota (ND) 1
CONNECTICUT INTERSTATE AND INTRASTATE LOCAL REDUCED CITY-PAIR FARES
 PASSENGER TARIFF AND SALES MANUAL CONNECTICUT INTERSTATE AND INTRASTATE LOCAL REDUCED CITY-PAIR S The following section contains city-pair fares that are lower than walkup mileage-based fares. Although
State DOL Contacts for Apprenticeship Programs
 State DOL Contacts for Apprenticeship Programs Alabama Gregory Collins Medical Forum Bldg. Room 648 950 22nd Street North Birmingham, Alabama 35203 205/731 1308 E Mail: collins.gregory@dol.gov Alaska John
Alabama Y Y Birmingham-Hoover, AL Y Y. Alaska N/A. Arizona N Y Phoenix-Mesa-Scottsdale, AZ N Y Tucson, AZ N Y
 - requires bidders to obtain out of state Alabama Y Y Birmingham-Hoover, AL Y Y Alaska Arizona N Y Phoenix-Mesa-Scottsdale, AZ N Y Tucson, AZ N Y Arkansas Y N Little Rock-North Little Rock, AR Y N Memphis,
Girl Friends, Inc. ca
 Sc MG 415 Girl Friends, Inc. ca. 1939-2002 NEW YORK PUBLIC LIBRARY Schomburg Center for Research in Black Culture 515 Malcolm X Boulevard New York, New York 10037-1801 Bulk Dates: 1939-2002 Extent: Linear
MAMA Risk Summary Data as of 2008 Q4
 MAMA Risk Summary Data as of 2008 Q4 Table of Contents Contents. 2 Largest 25 Metro Areas based on HMDA originations.. 3 Lowest Risk 25 Metro Areas 4 Highest Risk 25 Metro Areas... 5 Largest 25 States
L U K A S LIGHTING. If your City or State is not listed, Contact Lukas Lighting Directly:
 If your City or State is not listed, Contact Lukas Lighting Directly: Lukas Lighting 40-20 22nd Street Long Island City, NY 11101 info@lukaslighting.com 1-800-841-4011 ALPHABETICAL BY STATE (Last Updated
Rail in Mexico: Innovative Solutions for a Vibrant and Growing Mexican Economy
 Rail in Mexico: Innovative Solutions for a Vibrant and Growing Mexican Economy José Zozaya President, General Manager and Executive Representative Kansas City Southern de México General Overview of KCSM
PUBLIC TRANSPORTATION INTRODUCTION
 PUBLIC TRANSPORTATION INTRODUCTION 1 OUTLINE Current Status and Recent Trends Significant Influences A Critical Assessment Arguments Supporting Public Transport Future Influences Ingredients for Future
The Economic Impact of Tourism in Missouri. Fiscal Year 2016 Summary December 2016
 The Economic Impact of Tourism in Missouri Fiscal Year 2016 Summary December 2016 Introduction and definitions This study measures the economic impact of tourism in Missouri in FY2016. Visitors included
A COMPARISON OF THE MILWAUKEE METROPOLITAN AREA TO ITS PEERS
 KRY/WJS/EDL #222377 v4 (PDF: #223479v2) 4/1/15 APPENDIX D REVISED DRAFT Memorandum Report A COMPARISON OF THE MILWAUKEE METROPOLITAN AREA TO ITS PEERS EXECUTIVE SUMMARY This report provides a statistical
Q1 Arrival Statistics. January-March 2015
 Q1 Arrival Statistics January-March 2015 Q1 Total Air Arrivals Visitor Expenditure The average per person expenditure increased by $278 vs. Q1 2014. Overall this increase in spend contributed over $6M
TOGETHER, MAKING BOATING THE PREFERRED CHOICE IN RECREATION RECREATIONAL BOATING ECONOMIC STUDY $ $
 2012 TOGETHER, MAKING BOATING THE PREFERRED CHOICE IN RECREATION RECREATIONAL BOATING ECONOMIC STUDY In 2013 NMMA s Center of Knowledge contracted with the Recreational Marine Research Center at Michigan
DOWNLOAD OR READ : USA EAST MAP PDF EBOOK EPUB MOBI
 DOWNLOAD OR READ : USA EAST MAP PDF EBOOK EPUB MOBI Page 1 Page 2 usa east map usa east map pdf usa east map East Coast USA Maps.... Buy from a wide collection of maps of East Coast United States comprising
University of Denver
 Glenn R. Mueller, Ph.D. Professor University of Denver Franklin L. Burns School of Real Estate & Construction Management & Real Estate Investment Strategist glenn.mueller@du.edu Supply The new supply of
Population Estimates for U.S. Cities Report 1: Fastest Growing Cities Based on Numeric Increase,
 ulation s for U.S. Cities Report 1: Fastest Growing Cities Based on Numeric Increase, 2015-2015 1 Phoenix AZ 32,113 2.0 1,582,904 1,615,017 167,393 11.6 2 Los Angeles CA 27,173 0.7 3,949,149 3,976,322
Initial Locations of 2020 Area Census Offices
 1 of 6 Anchorage* AK At Large Birmingham* AL 007 Huntsville AL 005 Mobile AL 001 Fayetteville AR 003 Little Rock AR 002 Flagstaff AZ 001 Window Rock AZ 001 Maricopa (Central)* AZ 006 Maricopa (South) AZ
(See Note 1) Solar Energy Factor (SEF D ) Solar Fraction (SF D ) Estimated Energy Savings SYSTEM DETAILS
 Solar Energy Factor (SEF D ) Solar Fraction (SF D ) Estimated Energy Savings SYSTEM DETAILS") OG-300 ICC-SRCC TM CERTIFIED SOLAR SYSTEM # SYSTEM INFORMATION Pumped Internal Backup: Gas Tank Collector Type: Glazed Flat Plate Solar Tank Volume: 379 liter (100 gal) Collector Heat Transfer Fluid: GRAS
OG-300 ICC-SRCC TM CERTIFIED SOLAR SYSTEM # SYSTEM INFORMATION Pumped Internal Backup: Gas Tank Collector Type: Glazed Flat Plate Solar Tank Volume: 379 liter (100 gal) Collector Heat Transfer Fluid: GRAS
Communicating the Importance of Seaports. Bringin It Home. Presented to AAPA Annual Convention Galveston, TX October 27, 2009
 Communicating the Importance of Seaports Bringin It Home Presented to AAPA Annual Convention Galveston, TX October 27, 2009 Jim Kruse Director, Center for Ports & Waterways Texas Transportation Institute
Item 185 Storage-In-Transit First Ea. Add'l. Service
 Service Day Day 4 Birmingham, AL 19.62 0.68 2 8 Dothan, AL 15.08 0.48 2 12 Huntsville, AL 15.55 0.50 2 16 Mobile, AL 16.23 0.68 3 20 Montgomery, AL 16.23 0.68 3 22 State of Alaska 14.76 0.55 4 24 Flagstaff,
US Cities Over 100,000 Population in 1998 & 1990
 US Cities Over 100,000 Population in 1998 & 1990 Population Ranking Alphabetical Listing Population Change Ranking Percentage Population Change Ranking DEMOGRAPHIA An undertaking of Wendell Cox Consultancy
The 156 Arts & Economic Prosperity III Study Regions
 Full-Time Resident Local NATIONAL ESTIMATES OF ECONOMIC IMPACT $63,053,399,000 $103,145,088,000 $166,198,487,000 5,695,361 $104,234,116,000 $7,936,383,000 $9,140,633,000 AK City of Homer A 5,364 $1,248,208
Service Service Area Name
 Atlas Van Lines, Inc. Origin and Destination s Effective: 05/15/2018 Area Name 4 Birmingham, AL 6.99 8 Dothan, AL 4.80 12 Huntsville, AL 7.37 16 Mobile, AL 4.80 20 Montgomery, AL 7.37 22 State of Alaska
TOP 100 Bus Fleets Agency 35 ft. and Over Artic under 35 ft. Total. 18 < metro magazine SEPTEMBER/OCTOBER 2018 metro-magazine.
 1 1 MTA New York City Transit/MTA Bus Co. 0 4,860 951 5,811 New York City 2 3 New Jersey Transit Corp. 418 2,879 85 3,382 Newark, N.J. 3 2 Los Angeles County Metropolitan Transportation Authority 50 1,882
Agency 35 ft. Over Artic. Trolley 2012 Total and 35 ft. under. 1 1 MTA New York City Transit 0 3, ,344 New York City
 Capital Metro-No. 40 Courtesy Capital Metro 1 1 MTA New York City Transit 0 3,704 640 0 4,344 New York City 2 3 New Jersey Transit Corp. 47 2,263 85 0 2,395 Newark, N.J. 3 2 Metro 50 1,956 378 0 2,384
Social Media In Your New & Improved Phoenix Sky Harbor
 Social Media In Your New & Improved Phoenix Sky Harbor AZ Chapter of HSMAI September 19, 2013 It always begins & ends with: skyharbor.com Began Facebook page in October 2010 More than 27,000 people Like
November Air Traffic Statistics. Prepared by the Office of Corporate Risk and Strategy
 November 214 Air Traffic Statistics Prepared by the Office of Corporate Risk and Strategy Air Traffic Statistics Table of Contents Summary Air Traffic Summary... 1 SH&E Air Traffic Schedule Activity...
October Air Traffic Statistics. Prepared by the Office of Corporate Risk and Strategy
 October 214 Air Traffic Statistics Prepared by the Office of Corporate Risk and Strategy Metropolitan Washington Airports Authority Air Traffic Statistics Table of Contents Summary Air Traffic Summary...
Delivering the Goods: Ports in the South
 Delivering the Goods: Ports in the South Sujit M. CanagaRetna The Council of State Governments Southern Legislative Conference (SLC) Atlanta, Georgia Presentation to the Southern Economic Development Council
2016 City Park Facts
 2016 Park Facts This report was made possible through the generous support of: The 2016 Park Facts report was created by: Peter Harnik, Director, Center for Park Excellence Abby Martin, Research Coordinator
Miscellaneous Negro Newspaper Series on Microfilm (E185.5.M58)
") State City Title Period Reel # AL Birmingham Wide Awake 1900 4 AL Huntsville Huntsville Star 1900 4 AL Montgomery Montgomery Enterprise 1900 4 Ark. Helena Reporter 1900 4 Ark. Little Rock American Guide
State City Title Period Reel # AL Birmingham Wide Awake 1900 4 AL Huntsville Huntsville Star 1900 4 AL Montgomery Montgomery Enterprise 1900 4 Ark. Helena Reporter 1900 4 Ark. Little Rock American Guide
Chapter Delegate Seats Calculations Spreadsheet
 ST Chapter # Chapter Name # Members # Guaranteed # # Rounded Final # Chapter AL 0101 Birmingham 103 1 5.617 6 7 0102 South Alabama 52 1 2.8358 3 4 0103 AORN of North Alabama 29 1 1.5815 2 3 0104 Central
National Fact Sheet: FY 2008
 The name "Amtrak" is the blending of the words "America" and "track." It is properly used in documents with only the first letter capitalized. The railroad is also known as the National Railroad Passenger
STATE OF UTAH "BEST VALUE" COOPERATIVE CONTRACT CONTRACT NUMBER: AR2270 November 14, 2016
 Item: Contracted Airline Fares Purchasing Agent: Chad Hinds Phone #: (801) 538-1287 Email: chinds@utah.gov Vendor: 112932A Internet Homepage: Delta Air Lines, Inc. 1030 Delta Blvd. Atlanta, GA 30354 www.statetravel.utah.gov
Emerging Trends in Real Estate Sustaining Momentum but Taking Nothing for Granted
 Emerging Trends in Real Estate 2015 Sustaining Momentum but Taking Nothing for Granted PwC-ULI Outlook on trends 36th edition 368 interviews 1,055 survey responses 1,400+ participants, a record Who? District
Appendix A TRIP Urban Roads Report 2018
 Appendix A TRIP Urban Roads Report 2018 Pavement Conditions and Extra Vehicle Operating Costs for Urban Areas with Population of 500K or More Akron OH 49% 12% 14% 25% $837 Albany Schenectady Troy NY 15%
U.S. Metropolitan Area Exports, 2015
 U.S. Metropolitan Area Exports, 2015 Jeffrey Hall Office of Trade and Economic Analysis Industry and Analysis Department of Commerce International Trade Administration September 2016 U.S. Metro Exports:
1301 Wigmore St. Jacksonville, Fl 32206
 For Sale Industrial Waterfront Opportunity Shipping Channel Depth of 40 ± 1301 Wigmore St. Jacksonville, Fl 32206 Land Size: 39.5 acres Zoned: Waterfront Industrial Rail: NS active rail spur and rail lines
U.S. Lodging Industry Update
 U.S. Lodging Industry Update First Watch on a Long Voyage R. MARK WOODWORTH AMERICAS RESEARCH AGENDA THE ECONOMY WHAT COULD END THE CURRENT CYCLE? LABOR COSTS OUR FORECASTS SHARING ECONOMY UPDATE First
Non-stop Scheduled Passenger Service at Fargo as of October Top 20 Domestic O&D Passenger Markets at Fargo Twelve Months Ended June 2006
 0 5000 10000 15000 20000 25000 30000 35000 40000 45000 50000 Airport Traffic Quarterly Non-stop Scheduled Passenger Service at Fargo as of October 2006 Top 20 Domestic O&D Passenger Markets at Fargo Twelve
August Air Traffic Statistics. Prepared by the Office of Marketing & Consumer Strategy
 August 218 Air Traffic Statistics Prepared by the Office of Marketing & Consumer Strategy This report includes only data submitted by airlines as of the date of publication: October 17, 218. Reports are
Strategic Central Florida Location Just West of Interstate 75
 Strategic Central Florida Location Just West of Interstate 75 Park Highlights 337,447 SF (Building 13124) under construction June 2017 occupancy Cross-Dock 101 Trailer Spaces 1.5 miles from I-75 8 million
TOP 100. Transit Bus Fleets Agency 35 ft. Over Artic and 35 ft. Total +/- under 0 3, ,426 82
 L.A. Metro-No. 3 1 1 MTA New York City Transit New York City 2 2 New Jersey Transit Corp. Newark, N.J. 3 3 Metro Los Angeles 4 5 Toronto Transit Commission Toronto 5 10 Chicago Transit Authority Chicago
Chicago, Rock Island and Pacific Railway, The 7/1/1911 7/1/1931 Chicago, Saint Paul, Minneapolis and Omaha Railway 10/1/1912 9/30/1932 Cincinnati,
 Pullman Company PULLMAN, INCORPORATED........................................................... Inc. in DE, no date listed Controls 99.98% of Pullman Company stock, as of December 31, 1931 Re-evaluation