Fourth Quarter and Full Year 2012 Results
|
|
|
- Barnaby Henry
- 5 years ago
- Views:
Transcription
1 Contacts: Ricardo Sánchez Baker CFO Carlos Doormann SVP Financial Analysis Investor Relations Tel. (52) (55) Fourth Quarter and Full Year 2012 Results February 11, 2013 Earnings conference call Date: February 14, :00 a.m. ET (10:00 a.m. MEX) Conference Call Dial-In Numbers: Mexico USA (719) International +1 (719) Call ID number: Speakers: Andrés Conesa Labastida CEO Ricardo Sánchez Baker CFO Grupo Aeroméxico, S.A.B. de C.V. Paseo de la Reforma 445, Piso 10 Colonia Cuauhtémoc Phone:+52 (55) México,DF 1
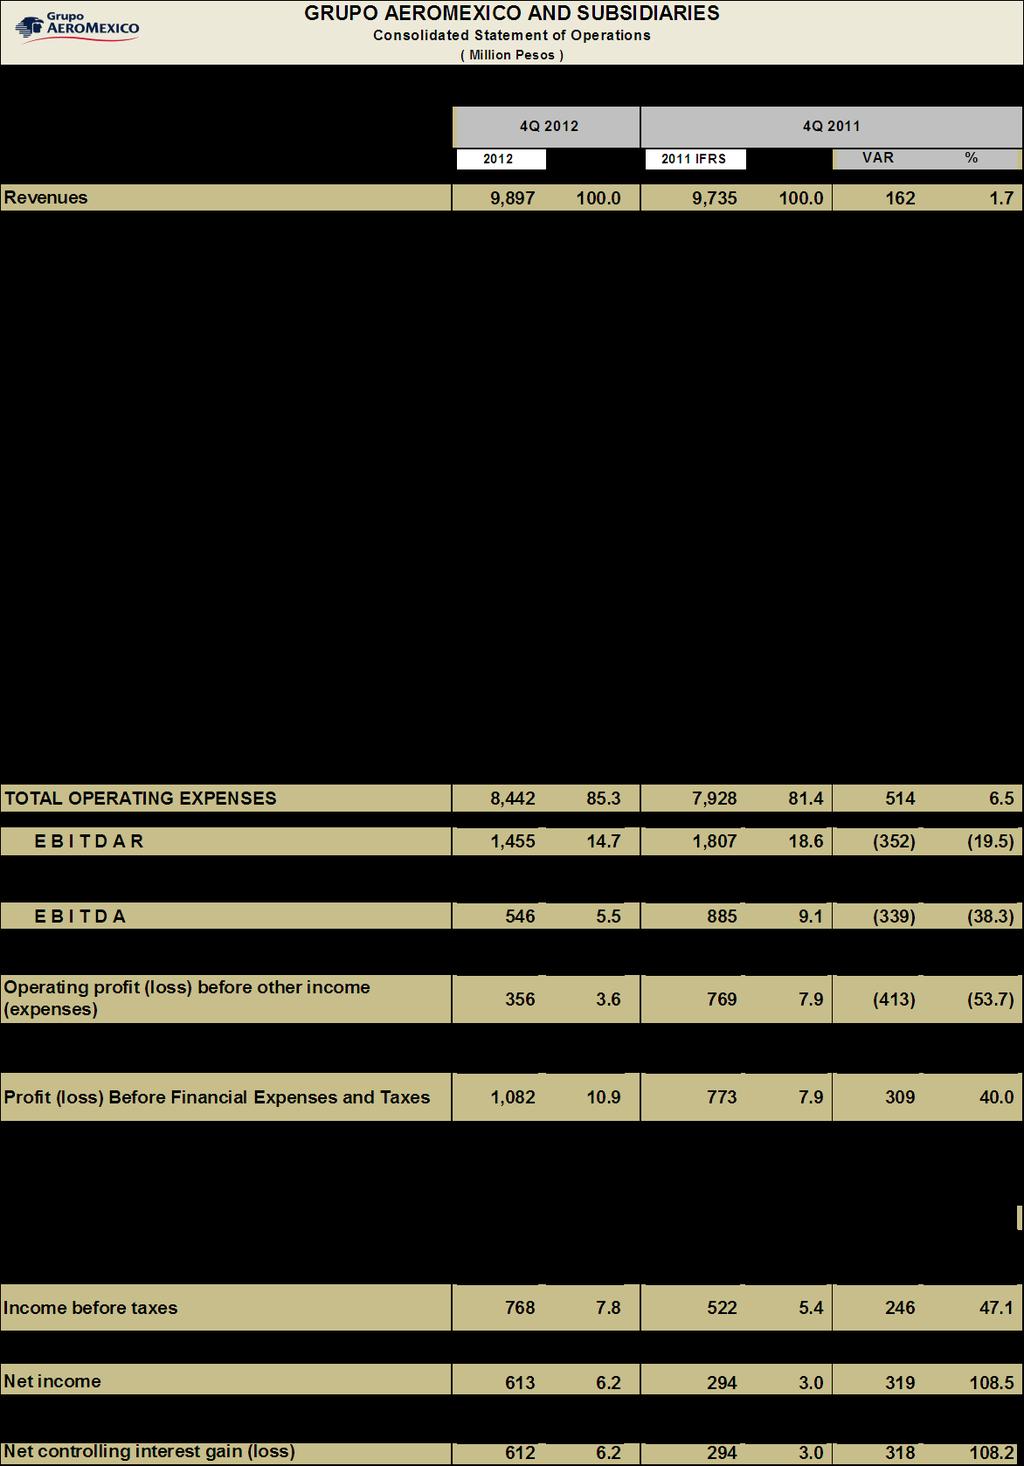
2 GRUPO AEROMÉXICO, S.A.B. DE C.V. KEY FINANCIAL RESULTS FOR FOURTH QUARTER 2012 February 11, 2013 Net income during the fourth quarter 2012 was MXP $612 million; an increase as compared to the MXP $294 million net income reported for the same period in Full year net income was MXP $1,323 million despite record-high fuel prices and the negative impact of a 5.8% exchange rate depreciation. Fourth quarter operating profit before other non-operating revenues and expenses was MXP $356 million, with a 3.6% margin operating profit before other non-operating revenues and expenses was MXP $2,529 million, with a 6.4% margin. Operating margin was 6.5%, excluding the effect of Aeroméxico Cargo consolidation EBITDAR was MXP $6,811 million, the second highest annual EBITDAR in the Company s history, despite negative impacts related to the fuel price increase and the aforementioned exchange rate depreciation. EBITDAR margin was 17.2%; after adjusting for the cargo consolidation effect, this margin was 17.6%. Grupo Aeroméxico reported record revenues of MXP $39,569 million in 2012; 10.5% growth yearover-year. This growth was driven primarily by increased yields, higher passenger flows and an increase in cargo revenues. Fourth quarter revenues reached MXP $9,897 million; a 1.7% increase year on year. Cost per available seat kilometer (CASK) excluding fuel and adjusting for the accounting effect of consolidating Aeroméxico Cargo (AM Cargo), increased 5.4% in 2012 compared to last year. This is primarily due to the exchange rate depreciation. This indicator, expressed in U.S. dollars, decreased 1.7%. CASK in pesos, excluding fuel and the cargo business consolidation, grew 3.7% in the fourth quarter as compared to the same period last year. During the year, Grupo Aeroméxico executed the most ambitious investment program in the Company s history, making payments of MXP $4,261 million in fixed assets investments, aircraft purchase prepayments, guarantee deposits and the amortization of debt not related to the purchase of aircraft. The Company s cash position as of December 31, 2012 was MXP $3,452 million. Grupo Aeroméxico took delivery of eight new Embraer-190 in Six of these were delivered as part of the aircraft acquisition program through the BNDES credit line and two were delivered through operating leases. The Company also took delivery of three Boeing through US Ex-Im Bank financing. Three Embraer 170 aircrafts also were added to the fleet through operating leases. Additionally, two Boeing , one Boeing and one Embraer E-145 aircraft were redelivered. 2
3 MANAGEMENT DISCUSSION AND ANALYSIS OF THE COMPANY S CONSOLIDATED OPERATING RESULTS AND CONSOLIDATED FINANCIAL POSITION GRUPO AEROMÉXICO, S.A.B. DE C.V. REPORTS FOURTH QUARTER 2012 RESULTS All figures are reported in nominal pesos unless otherwise stated. Financial statements have been prepared in accordance to International Financial Reporting Standards. Mexico City, February 11, Grupo Aeroméxico, S.A.B. DE C.V. (BMV: AEROMEX), reported unaudited consolidated results for the fourth quarter The accompanying consolidated financial statements were prepared in accordance with International Financial Reporting Standards ("IFRS"), issued by the International Accounting Standards Board ( IASB ). As is referenced in a separate announcement, the Company has prepared its first consolidated financial statements for the full year ended December 31, 2011 using the IFRS accounting. Therefore, Grupo Aeroméxico s IFRS transition year is the full year ended December 31, Additionally, results for Aeroméxico Cargo, a wholly-owned subsidiary of Grupo Aeroméxico that began operation in January 2012, are consolidated within Grupo Aeroméxico s financial statements since the first quarter of The following is a summary of financial information and operating results from the Company s unaudited financial statements for the 2012 and 2011 fourth quarters. These have been reported using both IFRS accounting standards as well as Mexican Financial Reporting Standards (MFRS), as they were originally prepared. Considering the effects of IFRS adoption as of 2012, Aeroméxico s 2011 financial information has been included below in both IFRS and MFRS formats, for comparison purposes. Item Total ASKs (million) Total RPKs (million) Itinerary Load Factor (%) Passengers ( 000) Total Fuel liters ('000) Total Revenue (MXP million) Yield (Revenue / RPK) (pesos) Revenue / ASK (pesos) 2012 From October 1 st to December 31 st 2011 IFRS Restated Var % 2011 MFRS Var 2011 IFRS vs MFRS 2012 From January 1 st to December 31 st 2011 IFRS Restated Var % 2011 MFRS 7,922 7,631 4% 7,631-30,724 28,987 6% 28,987-5,996 5,949 1% 5,949-23,484 22, % 22, pp pp ,774 3, % 3,769-14,812 14,334 3% 14, , ,024 3% 291,024-1,166,932 1,111,766 5% 1,111,766-9,897 9, % 9, ,569 35, % 35, % % % % Var 2011 IFRS vs MFRS 3
4 From October 1 st to December 31 st From January 1 st to December 31 st Item IFRS Restated Var % 2011 MFRS Var 2011 IFRS vs MFRS IFRS Restated Var % 2011 MFRS Var 2011 IFRS vs MFRS Total Cost / ASK (pesos) Total Cost/ ASK (USD) Total Cost / ASK excluding fuel (pesos) Total Cost / ASK excluding fuel (USD) % % % % % % % % CASK excl. Fuel AM Cargo Equity Method (pesos)* % % CASK excl. Fuel AM Cargo Equity Method (USD)* % % EBITDAR (MXP million)** 1,455 1, % 1, ,811 7, % 7, EBITDAR Margin** pp pp pp pp Operating Profit (MXP million)* Operating Margin (% of Revenue)** % ,529 3, % 3, pp pp pp pp Consolidated Net Profit (MXP million) % ,323 1, % 2, Controlling Interest Net Profit (MXP million) % ,323 1, % 2, Controlling Interest Net Margin (% of Revenue) Earnings per share (pesos) pp pp pp pp % % * 2012 figures adjusted to reflect the accounting effect of the Aeroméxico Cargo consolidation in 2012 related to the equity method used in ** Metric included for reader reference but not defined under IFRS given its relevance. *** Figures may not add up due to rounding. 4
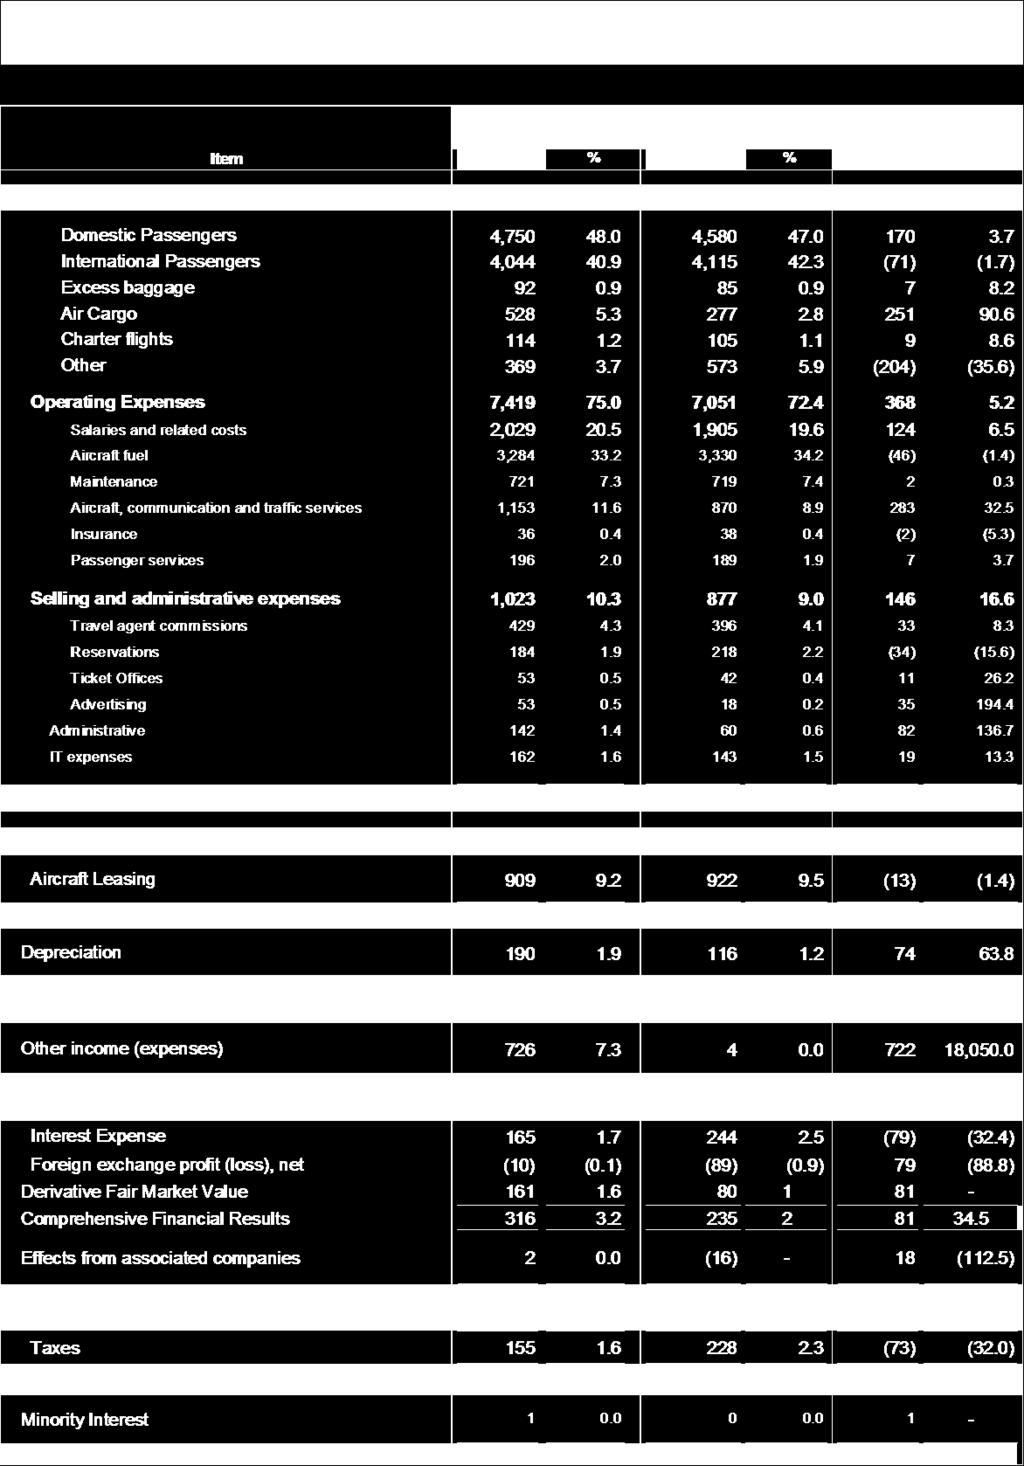
5 Market Conditions During the fourth quarter and full year 2012, Grupo Aeroméxico operated in an environment characterized by the following factors: Revenues i) Fuel price volatility: U.S. dollar-denominated fuel prices reached a record high in 2012; increasing 2% compared to the 2011 average price. Furthermore, peso/dollar exchange rate depreciation resulted in a 10.2% increase in the average peso-denominated fuel price. Fourth quarter average U.S. dollar denominated fuel prices 1 increased 1.4% year-overyear. However, quarterly peso/dollar appreciation resulted in a lower peso-denominated price of 4.2% as compared to the fourth quarter ii) Exchange rate fluctuations: The peso appreciated 5% against the U.S. dollar during the fourth quarter 2012, shifting from an average exchange rate of MXP $13.67 per dollar in fourth quarter 2011 to an average of MXP $12.95 per dollar in fourth quarter However, the peso depreciated 5.8% against the U.S. dollar in 2012, shifting from an average of MXP $12.45 per U.S. dollar in 2011 to MXP $13.17 per dollar in iii) Increased domestic passenger traffic: According to the Mexican Aviation Authority 2, total passenger numbers increased by 7.4% in the October through December 2012 quarter, with a 7.6% increase in domestic passenger travel and a 7.2% increase in passengers traveling internationally. However, the fourth quarter increase in passenger traffic was less than the 8.3% average reported for the entire year of The number of domestic passengers increased by 10.3% on an annual basis, while passengers on international flights increased 6.5%. iv) On-time performance recovery program: The Company launched an on-time performance improvement program in the fourth quarter 2012, with the goal of offering our passengers a unique program that significantly improves customer service. This program significantly improved our on-time performance, however, it adversely impacted quarterly ASKs and therefore also impacted fourth quarter unit revenues and costs during the program s initial implementation phase. The Company s total revenues in the fourth quarter 2012 reached MXP $9,897 million, which represented a record high for that period and a 1.7% increase compared to the same period of Passenger revenues totaled MXP $8,794 million in the fourth quarter 2012, a 1.1% year-over-year increase, driven primarily by a 0.6% increase in yield. Grupo Aeroméxico transported million passengers in the quarter; 5,000 passengers more than those transported in the fourth quarter International route passengers increased 0.6%, while domestic passengers remained virtually unchanged. 54% of passenger revenue was generated on domestic flights and 46% on international flights. The Company reported record revenues in 2012 of MXP $39,569 million; a 10.5% increase year-overyear. Passenger revenues also reached a record high at MXP $34,791 million; 9.3% greater than US Gulf Coast Jet fuel. Source: Energy Information Administration 2 Source: DGAC (Mexican Directorate General Civil Aviation) airline operating report 5
6 Aeroméxico s strong year-on-year passenger revenue growth was the result of a combination of both (1) a greater volume measured in RPKs, which increased 3.7% year over year, and (2) a 3.6% growth in Yield unit revenues per ASK, an indicator that is a reflection of both passenger volume behavior and average air fare prices, increased 4.3% year-over-year, driven primarily by a 3.6% increase in yields. Load factors, on the other hand, remained at 76.6%; 1.8 percentage points below Annual RASK (MXP) % Fourth quarter cargo revenues totaled MXP $528 million; 91% higher than the same period in 2011, and a reflection of the effects of the Aeroméxico Cargo operation financial consolidation. Adjusting this figure using the equity accounting method applied in 2011, cargo revenues decreased 2.9% year on year, as a result of cargo activity deterioration worldwide, 3 which in the case of Mexico translated into a 11% decline in tons transported during the fourth quarter 4, in both the domestic and the international market cargo revenues totaled MXP $2,123 million; 118% greater than in 2011, the result of increasing cargo activity and the previously referenced financial consolidation. Grupo Aeromexico s Cargo revenues grew MXP $72 million; a 7.4% increase over 2011, using the equity accounting method. Charter service revenues totaled MXP $114 million in the fourth quarter 2012; an 8.6% increase as compared to the same period in Charter service revenues reached MXP $585 million; a 5.5% decrease compared with 2011, resulting from the Company's strategy to focus on its scheduled flight offerings. Other operating revenues 5 amounted to MXP $461 million during the fourth quarter 2012; a 29.9% year over year decrease over those reported under this item for the same period of 2011, mainly resulting from: (1) a decrease in unused air ticket revenues related to changes in consumption patterns (2) increased payments related to interline sales agreements and (3) a higher Premier Kilometers accrual related to our strengthening loyalty program, including increased membership and greater loyalty. Other operating revenues totaled MXP $2,070 million in 2012; 13% lower than those reported in According to IATA, Freight Tons Kilometer (FTKs) decreased 1.1% worldwide in Q Source: Dirección General de Aeronáutica Civil (DGAC). 5 Other revenue includes excess baggage charges and income not directly related to passenger or cargo transportation. 6

7 Operating Expenses Fourth quarter 2012 operating expenses, including aircraft leases and depreciation, totaled MXP $9,541 million; 6.4% higher than the same period in This quarter s Operating Expenses were primarily impacted by accounting effects related to Aeroméxico Cargo consolidation as well as to the increase in the number of operations flown by Grupo Aeroméxico carriers Operating Expenses including equipment leases and depreciation totaled MXP $37,040 million; a 15.5% increase year over year. Factors that influenced the Company's year on year increase in annual spending included: (1) the 6% increase in the number of operations, (2) the effect of the 5.8% peso/dollar depreciation, (3) the effects of the Aeroméxico Cargo operations financial consolidation, and (4) 10.2% increase in Mexican peso denominated fuel prices. The cargo consolidation mentioned above resulted in a MXP $245 million impact from Aeroméxico Cargo expenses in the fourth quarter Adjusting for this accounting effect, the cost of available seat kilometer (CASK) in pesos excluding fuel in the fourth quarter 2012 increased 3.7% year over year. This was primarily due to lower ASK production resulting from the previously mentioned on-time performance recovery program. In annual terms, the Aeroméxico Cargo financial consolidation resulted in a MXP $956 million impact in Adjusting for accounting consolidation effects, the cost per ASK excluding fuel increased 5.4% compared to 2011, primarily due to the effects of peso/dollar depreciation. This indicator, expressed in U.S. dollars, decreased 1.7%. Annual CASK excluding fuel (AM Cargo Equity Method) %
8 Item (MXP million) Grupo Aeromexico Expenses Impact of cargo business accounting change* 4Q Q 2011 Aeromexico Cargo: Consolidated Aeromexico Cargo: Equity Method Variation 4Q 2011 Var AM Cargo Cons. vs 4Q 2011 Var AM Cargo Equity Method vs 4Q 2011 Total Operating Expenses 9,541 9, , % 3.7% Total CASK (pesos) % % -0.2% CASK excluding fuel (pesos) % % 3.7% Total CASK (USD) % % 5.8% CASK excluding fuel (USD) % % 9.3% * Figures may not add up due to rounding. Item (MXP million) Grupo Aeromexico Expenses Impact of cargo business accounting change* Aeromexico Cargo: Consolidated Aeromexico Cargo: Equity Method Variation 2011 Var AM Cargo Cons. vs 2011 Var AM Cargo Equity Method vs 2011 Total Operating Expenses 37,040 36, , % 12.5% Total CASK (pesos) % % 6.1% CASK excluding fuel (pesos) % % 5.4% Total CASK (USD) % % 0.0% CASK excluding fuel (USD) % % -1.7% * Figures may not add up due to rounding. Total fuel costs reached MXP $3,284 million during the quarter; 1.4% lower than the fourth quarter 2011, primarily due to the 4.2% reduction in peso-denominated fuel prices driven by the 5.2% currency appreciation recorded in the quarter, which was partially offset by the 3.8% increase in ASKs production during the quarter. Total fuel expenses increased MXP $1,778 million in 2012 compared to 2011; a 15.8% increase. Fuel cost variations were due primarily to (1) a 10.2% increase in the peso-denominated fuel price, and (2) the Company s 6.0% increase in ASKs throughout the year. 8

9 Fuel Cost Evolution 2012 (MXP million) 1, ,063 11, fuel costs Fuel Price Increase Increased Consumption 2012 fuel costs Grupo Aeroméxico has a hedging policy in place to address the risk of rising fuel prices with call and call spread options equal to approximately 50% of the estimated fuel consumption for the subsequent 12 months. Hedging benefits obtained from fuel costs in the fourth quarter 2012 were equal to US $1.8 million. Hedging benefits obtained for the full year 2012 amounted to US $7.3 million. To date, 50% of estimated fuel consumption accrued through the fourth quarter of 2013 is hedged with underlying Jet Fuel (JF54) and Heating Oil (HO) hedging instruments. This position is comprised of 26% HO instruments with weighted average hedging levels starting at US $2.98 and hedged up to US $3.39 per gallon, and 74% in JF54 instruments with hedging levels starting at US $3.13 dollars and hedged up to US $3.79 per gallon. During the quarter, the Company recorded a negative impact of MXP $161 million as a result of marking to market of its position, due to the evolution of the U.S. dollar fuel prices. In 2012, the negative impact on the market price valuation of Grupo Aeroméxico s position was MXP $262 million. It is important to note that Grupo Aeroméxico uses call type and call spread options for its hedging program, so the maximum loss the Company can record is capped by the value of the premiums paid for such options. Labor costs in the fourth quarter 2012 increased 6.5% year over year. This stems mainly from the Aeroméxico Cargo consolidation effect, Aeromexico s pilot training program in anticipation of B787 additions to Aeroméxico s fleet, and the Company s expansion, which is reflected in the 3.8% increase in ASKs. In 2012, the cost of labor grew 13.2% compared with The expense increase is related to: (1) ASK growth, (2) the Aeroméxico Cargo consolidation effect, and (3) MXP $87 million in additional pilot training expenses in preparation for Aeroméxico s 2013 B787 fleet. Adjusting for the Aeroméxico Cargo consolidation effect, labor costs increased 12.4% in 2012 over Fourth quarter maintenance costs remained largely constant compared to the corresponding period in The impact on maintenance costs caused by the increase in ASKs (+3.8%) and operations (+4.7%) was largely offset by the peso/dollar appreciation. In 2012, maintenance costs increased 13% primarily due to the 6.0% increase in ASKs as compared to 2011 and the 5.8% peso/dollar depreciation. Ground and traffic services costs increased 32.5% in the fourth quarter 2012 compared to 2011, primarily due to Aeroméxico Cargo consolidation related accounting effects and to the increase in ASKs. Ground and traffic services costs increased 29% year over year. Excluding the financial impact 9
10 of the Aeroméxico Cargo consolidation, ground and traffic services costs increased 12% year on year, primarily due to the increased number of operations (+6%) and currency depreciation. Fourth quarter sales and administrative expenses increased 16.6% over year on year, primarily due to the increase in general administrative expenses and professional fees related to the B737 MAX and B787-9 aircraft acquisition campaign and to the professional fees related to passenger service improvement. In 2012, sales and administrative expenses increased 7.6%, which represents lower growth than the 9.3% growth in passenger revenues, and therefore the cost of administration and sales as a percentage of passenger revenues declined from 10.7% in 2011 to 10.5% in Other operating expenses, including insurance and passenger services, increased 2.2% in the fourth quarter, primarily due to growth in operations. Said expenses therefore increased 9.3% in 2012 compared to 2011, primarily due to an increase in operations and the exchange rate depreciation. Fourth quarter 2012 aircraft lease expenses totaled MXP $909 million; 1.4% lower than for the same period of 2011, primarily due to the Mexican peso/u.s. dollar appreciation during the quarter and to the implementation Aeroméxico s strategy to increase the number owned aircraft within its fleet. Aircraft lease expenses grew 11.5% year on year, primarily due to exchange rate depreciation and to the net increase of two aircraft under operating leasing. Grupo Aeroméxico took delivery of three Embraer 170 aircraft and two Embraer-190 in 2012 under operating leases, while it redelivered two Boeing , 1 Boeing and one Embraer 145 under operating leases from the fleet. EBITDAR EBITDAR 6 for the quarter totaled MXP $1,455 million; a 19.5% decrease compared to the same period last year. The Company s 2012 EBITDAR reached MXP $6,811 million, which represents an 8.1% decrease compared to 2011, primarily the result of pressures generated by the 10.2% increase in peso denominated fuel costs and the effects of the 5.8% exchange depreciation in a variety of expense items EBITDAR margin stood at 17.2% (17.6% when adjusted for the accounting change related to the Aeroméxico Cargo consolidation). 7,414 EBITDAR (MXP million) 6, EBITDAR: earnings before interest, taxes, depreciation, amortization and aircraft rents. 10
11 Operating Profit Before other Income (Expenses) Operating profit before other income and other non-operating expenses for the quarter was MXP $356 million. In 2012, income from operations before other income and expenses was booked at MXP $2,529 million, with a 6.4% operating margin (6.5% when adjusted for the accounting change related to Aeroméxico Cargo consolidation). This despite the MXP $1,218 million pressure related to the increase in MXP denominated fuel prices in 2012 compared to operating income ex-fuel was MXP $15,592 million, a record high for the company. IFRS regulations do not define the Operating Income metric. However, this indicator is included within Aeroméxico s results due to its importance when analyzing the Company's operating performance, and to provide the reader a basis of comparison between reporting periods. Other income and expenses Aeroméxico reported MXP $522 million in other non-operating income in 2012, primarily related to the sale of a 20% stake Aeroméxico held in PLM (the subsidiary that manages the Company s loyalty program). Net Financial Expenses Financial expenses were booked at MXP $165 million; MXP $79 million below that of the fourth quarter Interest expenses totaled MXP $928 million in 2012; MXP $35 million lower than 2011 interest expenses. The decrease in the financial expenses entry, both in the fourth quarter and full year 2012, was driven primarily by the cancellation of option rights valued at MXP $121 million which were granted to AIMIA, related to the additional acquisition of a 20% stake in PLM. These rights were executed during the fourth quarter Fourth quarter financial expenses also decreased due to the cancellation of slightly more expensive working capital debt, which was partially offset by an increase in financial debt related to aircraft acquisition in the quarter. Foreign Exchange Profit (Loss) The Company recognized a net positive impact of MXP $10 million under the exchange differences item in the quarter, as a result of fourth quarter Mexican peso/us dollar appreciation compared with the previous 7 quarter. The above effect includes a negative impact associated with the MXP $11 million revaluation of U.S. dollar denominated non-monetary assets and a positive MXP $21 million foreign exchange effect generated by a foreign currency denominated short position on monetary items. There was a MXP $172 million negative impact in 2012, which includes a negative impact related to the MXP $304 million revaluation of U.S. dollar denominated non-monetary assets and a MXP $132 million positive foreign exchange effect resulting from a short position on foreign currency denominated monetary items. The above effects are due to the fact that Aeroméxico uses the U.S. dollar as its functional currency and the Mexican peso for registration and reporting purposes. 7 The average exchange rate for each quarter was recorded respectively in Q312 at $13.12 and $12.95 in Q
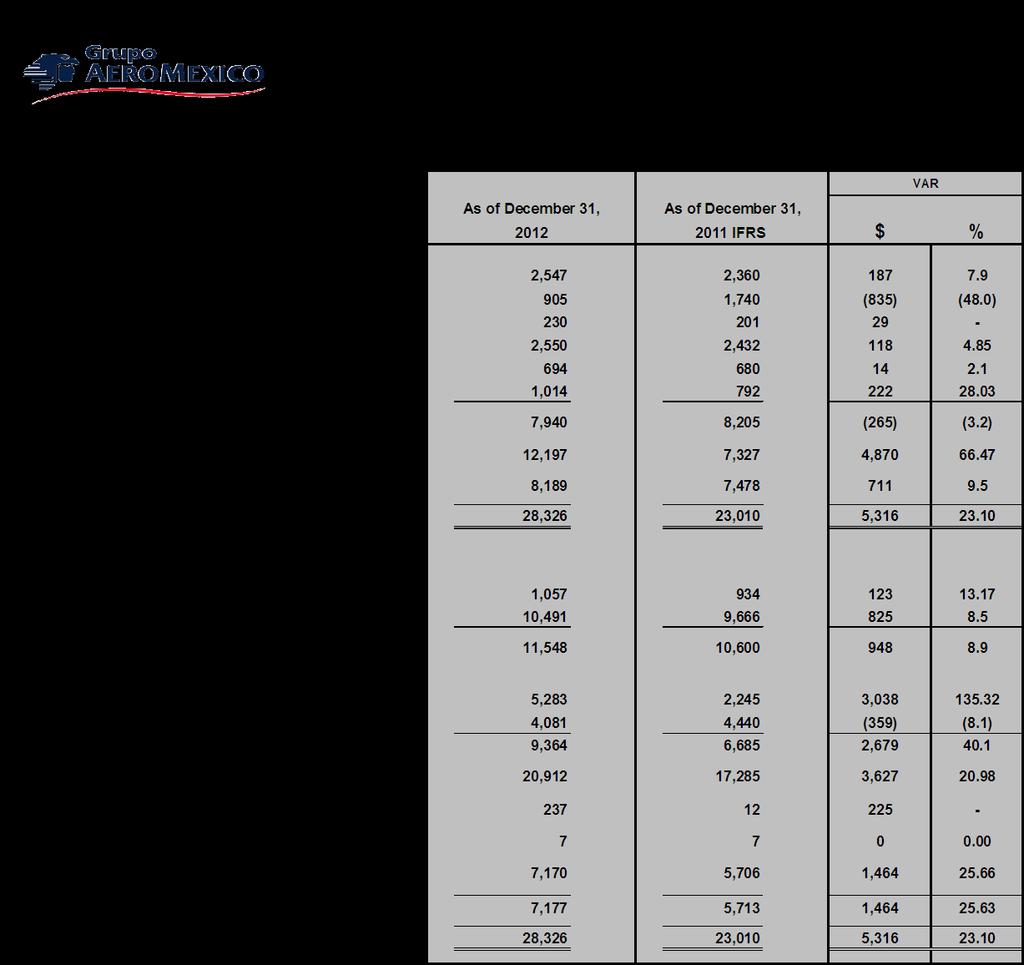
12 Derivative Fair Market Value Aeroméxico reported a MXP $161 million negative impact in the fourth quarter 2012, due to a decreased market value of its fuel hedge position (JF54 and HO). The total full year market value reached MXP $262 million. It is important to note that Grupo Aeroméxico uses call type and call spread options for its hedging program, therefore the maximum loss the Company can record is capped by the value of the premiums paid for said options. Controlling Interest Net Income (Profit) Grupo Aeroméxico reported MXP $612 million in controlling interest net income for the fourth quarter 2012, with a 6.2% net margin controlling interest net income was MXP $1,323 million; a reflection of the effect of various non-recurring items including: (1) a MXP $434 million negative impact related to currency fluctuations and fuel hedge market value loss adjustment, and (2) a MXP $601 million net benefit resulting from the sale of a 20% stake in PLM, which, among other effects, resulted in certain contractual changes and a corresponding impact in the recognition of some transactionrelated deferred taxes. Comments to the Consolidated Statements of Financial Position Grupo Aeroméxico generated MXP $3,578 million in cash before tax for the full year Approximately MXP $4.100 million pesos were spent in 2012, as part of Grupo Aeroméxico s historically unprecedented investment program. These included prepayments related to aircraft purchases, security deposits and other fixed assets, as well as MXP $182 million in the net amortization of aircraft-related debt. The annual investment program includes the purchase of six E190 and three B jet airlines, and the construction of a hangar and a platform at the east side of Mexico City International Airport, among other assets. Aeroméxico s unrestricted cash position as at December 31, 2012 was MXP $3,452 billion; MXP $253 million more than for the third quarter ended September 30, As of December 31, 2012, debt associated with aircraft acquisition represented 92% of total debt; an increased percentage as compared to the 76% that debt associated to aircraft purchase represented as of December 31, Controlling stockholders' equity was MXP $7,170 million as of December 31, 2012; a MXP $1,464 million increase from controlling stockholders equity at year s end As of December 31 st (MXP million) Unrestricted cash and cash equivalents Var 3,452 4, Financial debt 6,340 3,179 3,161 Net financial debt 2, ,809 Stockholders equity 7,170 5,706 1,464 Consolidated Stockholders equity 7,177 5,713 1,464 12
13 At December 31, 2012, Grupo Aeroméxico had 717,375,698 shares outstanding and 241,473,021 treasury shares. 11,599,923 shares were repurchased as part of Grupo Aeroméxico s share repurchase program. 13
14 Relevant events Grupo Aeroméxico and AIMIA announce the closing of AIMIA, Inc. s purchase of an additional 20% Premier Loyalty & Marketing shares. On December 17, 2012, Grupo Aeroméxico and AIMIA announced the successful closing of the purchase previously announced on October 29 of AIMIA Inc. s purchase of an additional 20% stake in Premier Loyalty & Marketing, S.A.P.I. de C.V. ("PLM"), the company which owns and operates Club Premier. The transaction was valued at US $88 million. PLM was valued at US $518 million, however, AIMIA paid a total of US $88 million based on a discount agreed to at the time of AIMIA s initial PLM investment in September 2010 in exchange for the aforementioned 20% stake in PLM. Subsequent to finalization of the sale, 51% of PLM s shares are now held by Grupo Aeroméxico and 49% are held by AIMIA. Grupo Aeroméxico formalized the purchase of Boeing 737MAX and Dreamliner Grupo Aeroméxico signed two contracts with Boeing during the fourth quarter 2012, as part Aeroméxico s program to purchase a total of 100 aircraft valued at approximately US $11 billion, as was announced on July 25, Aeroméxico announced on November 5 that it had signed a contract to purchase up to 90 narrow body Boeing 737 MAX aircraft. The Company then signed a second contract on December 27, 2012 to purchase ten Dreamliners. 60 of the 90 B737 MAX aircraft purchases are firm, while the remaining 30 are subject to Grupo Aeroméxico s final confirmation. Similarly, six of the 10 B787-9 aircraft are firm while four are subject to the Company s confirmation. Grupo Aeroméxico change in International Financial Reporting Standards (IFRS) adoption year. Grupo Aeroméxico, announced on February 11 that it will be preparing its first consolidated financial statements for the year ended December 31, 2011 using the International Financial Reporting Standards ("IFRS") as issued by the International Accounting Standards Board ( IASB ). Grupo Aeroméxico s transition year is therefore the full year ended December 31,
15 Fleet Grupo Aeroméxico took delivery of one new Boeing in the fourth quarter 2012 under financial leasing conditions. As of December 31, 2012, the average age of Grupo Aeroméxico s fleet was nine years. Operating Fleet Fleet 4Q Q 2012 B B B Aeroméxico ERJ E E Aeroméxico Connect GRUPO AEROMÉXICO
16 Financial Analyst Coverage Company Analyst address Actinver Gustavo Adolfo Terán BBVA Bancomer Pablo Abraham Peregrina Deutsche Bank Michael Linenberg GBM Bianca Faiwichow Intercam Alejandra Marcos Morgan Stanley Nicolai Sebrell Vector Marco Montañez 16
17 4Q Consolidated Statement of Operations 17
18 2012 Consolidated Statement of Operations 18
19 Consolidated Statement of Financial Position 19
FIRST QUARTER 2014 RESULTS
 FIRST QUARTER 2014 RESULTS Mexico City, April 29, 2014 - Grupo Aeromexico S.A.B de C.V. ( Aeromexico ) (BMV: AEROMEX), the largest airline in Mexico, today reported its unaudited consolidated results for
First Quarter 2013 Results
 Contacts: Ricardo Sánchez Baker CFO rsbaker@aeromexico.com.mx Carlos Doormann SVP Financial Analysis cdoormann@aeromexico.com.mx First Quarter 2013 Results April 23, 2013 Luz Montemayor lmontemayor@aeromexico.com.mx
THIRD QUARTER RESULTS 2017
 THIRD QUARTER RESULTS 2017 KEY RESULTS In the 3Q17 Interjet total revenues added $5,835.1 million pesos that represented an increase of 22.0% over the revenue generated in the 3Q16. In the 3Q17, operating
FOURTH QUARTER RESULTS 2017
 FOURTH QUARTER RESULTS 2017 KEY RESULTS In the 4Q17 Interjet total revenues added $5,824.8 million pesos that represented an increase of 10.8% over the revenue generated in the 4Q16. In the 4Q17, operating
THIRD QUARTER RESULTS 2018
 THIRD QUARTER RESULTS 2018 KEY RESULTS In the 3Q18 Interjet total revenues added $ 6,244.8 million pesos that represented an increase of 7.0% over the revenue generated in the 3Q17. In the 3Q18, operating
FIRST QUARTER RESULTS 2016
 FIRST QUARTER RESULTS 2016 KEY RESULTS In 1Q16 Interjet total revenues added $3,850.8 million pesos that represented an increase of 21.9% over the income generated in the 1Q15. In 1Q16 total passengers
SECOND QUARTER RESULTS 2018
 SECOND QUARTER RESULTS 2018 KEY RESULTS In the 2Q18 Interjet total revenues added $ 5,781.9 million pesos that represented an increase of 9.6% over the revenue generated in the 2Q17. In the 2Q18, operating
THIRD QUARTER AND NINE MONTHS OF 2014 KEY RESULTS
 THIRD QUARTER AND NINE MONTHS OF 2014 KEY RESULTS In 3Q14 INTERJET total revenues were $ 3,643.4 million, representing an increase of 9.9% on revenues generated in the 3Q13. Accumulated 9M14 INTERJET total
FIRST QUARTER RESULTS 2017
 FIRST QUARTER RESULTS 2017 KEY RESULTS In the 1Q17 Interjet total revenues added $4,421.5 million pesos that represented an increase of 14.8% over the income generated in the 1Q16. In the 1Q17, operating
Volaris Reports Strong First Quarter 2015: 32% Adjusted EBITDAR Margin, 9% Operating Margin
 Volaris Reports Strong First Quarter 2015: 32% Adjusted EBITDAR Margin, 9% Operating Margin Mexico City, Mexico, April 22, 2015 Volaris* (NYSE: VLRS and BMV: VOLAR), the ultra-low-cost airline serving
Copa Holdings Reports Net Income of $49.9 million and EPS of $1.18 for the Second Quarter of 2018
 Copa Holdings Reports Net Income of $49.9 million and EPS of $1.18 for the Second Quarter of 2018 Panama City, Panama --- Aug 8, 2018. Copa Holdings, S.A. (NYSE: CPA), today announced financial results
OPERATING AND FINANCIAL HIGHLIGHTS SUBSEQUENT EVENTS
 Copa Holdings Reports Net Income of US$6.2 Million and EPS of US$0.14 for the Third Quarter of 2015 Excluding special items, adjusted net income came in at $37.4 million, or EPS of $0.85 per share Panama
Earnings Report 1 st Quarter 2016 Grupo Viva Aerobus
 Earnings Report 1 st Quarter 2016 Grupo Viva Aerobus Grupo Viva Aerobus announces results for the first quarter of 2016 Mexico City, Mexico, April 29, 2016- Grupo Viva Aerobus S.A. de C.V. ( Grupo Viva
OPERATING AND FINANCIAL HIGHLIGHTS. Subsequent Events
 Copa Holdings Reports Net Income of $103.8 million and EPS of $2.45 for the Third Quarter of 2017 Excluding special items, adjusted net income came in at $100.8 million, or EPS of $2.38 per share Panama
Copa Holdings Reports Net Income of $136.5 million and EPS of $3.22 for the First Quarter of 2018
 Copa Holdings Reports Net Income of $136.5 million and EPS of $3.22 for the First Quarter of 2018 May 9, 2018 PANAMA CITY, May 9, 2018 /PRNewswire/ -- Copa Holdings, S.A. (NYSE: CPA), today announced financial
OPERATING AND FINANCIAL HIGHLIGHTS
 Copa Holdings Reports Financial Results for the Fourth Quarter of 2018 Excluding special items, adjusted net profit came in at $44.0 million, or Adjusted EPS of $1.04 Panama City, Panama --- February 13,
Grupo Viva Aerobus announces results for the third quarter of 2016
 Earnings Earnings Report Report 3 rd rd Quarter Quarter 2016 2016 Grupo Grupo Viva Viva Aerobus Aerobus Grupo Viva Aerobus announces results for the third quarter of 2016 Mexico City, Mexico, October 27,
Copa Holdings Reports Net Income of $57.7 million and EPS of $1.36 for the Third Quarter of 2018
 Copa Holdings Reports Net Income of $57.7 million and EPS of $1.36 for the Third Quarter of 2018 November 14, 2018 PANAMA CITY, Nov. 14, 2018 /PRNewswire/ -- Copa Holdings, S.A. (NYSE: CPA), today announced
OPERATING AND FINANCIAL HIGHLIGHTS. Subsequent Events
 Copa Holdings Reports Financial Results for the First Quarter of 2016 Excluding special items, adjusted net income came in at US$69.9 million, or EPS of US$1.66 per share Panama City, Panama --- May 5,
OPERATING AND FINANCIAL HIGHLIGHTS. Subsequent Events
 Copa Holdings Reports Net Income of US$113.1 Million and EPS of US$2.57 for the First Quarter of 2015 Excluding special items, adjusted net income came in at US$106.0 million, or EPS of US$2.41 per share
OPERATING AND FINANCIAL HIGHLIGHTS
 Copa Holdings Reports Financial Results for the Fourth Quarter of 2015 Excluding special items, adjusted net income came in at $31.7 million, or EPS of $0.73 per share Panama City, Panama --- February
OPERATING AND FINANCIAL HIGHLIGHTS SUBSEQUENT EVENTS
 Copa Holdings Reports Financial Results for the Third Quarter of 2016 Excluding special items, adjusted net income came in at $55.3 million, or adjusted EPS of $1.30 per share Panama City, Panama --- November
CONTACT: Investor Relations Corporate Communications
 NEWS RELEASE CONTACT: Investor Relations Corporate Communications 435.634.3200 435.634.3553 Investor.relations@skywest.com corporate.communications@skywest.com SkyWest, Inc. Announces Fourth Quarter 2017
OPERATING AND FINANCIAL HIGHLIGHTS
 Copa Holdings Reports Net Income of US$32.0 Million and EPS of US$0.72 for the Second Quarter of 2012 Excluding special items, adjusted net income came in at $58.6 million, or EPS of $1.32 per share Panama
Copa Holdings Reports Record Earnings of US$41.8 Million for 4Q06 and US$134.2 Million for Full Year 2006
 Copa Holdings Reports Record Earnings of US$41.8 Million for 4Q06 and US$134.2 Million for Full Year 2006 Panama City, Panama --- March 7, 2007. Copa Holdings, S.A. (NYSE: CPA), parent company of Copa
Copa Holdings Reports Fourth Quarter and Full Year 2007 Results
 Copa Holdings Reports Fourth Quarter and Full Year 2007 Results Panama City, Panama --- February 21, 2008. Copa Holdings, S.A. (NYSE: CPA), parent company of Copa Airlines and Aero Republica, today announced
AEROFLOT ANNOUNCES FY 2017 IFRS FINANCIAL RESULTS
 AEROFLOT ANNOUNCES FY 2017 IFRS FINANCIAL RESULTS Moscow, 1 March 2018 Aeroflot Group ( the Group, Moscow Exchange ticker: AFLT) today publishes its audited financial statements in accordance with International
Copa Holdings Reports Earnings of US$30.3 Million and EPS of US$0.70 for 3Q08
 Copa Holdings Reports Earnings of US$30.3 Million and EPS of US$0.70 for 3Q08 Panama City, Panama --- November 13, 2008. Copa Holdings, S.A. (NYSE: CPA), parent company of Copa Airlines and Aero Republica,
El Al Israel Airlines announced today its financial results for the year 2016 and the fourth quarter of the year:
 El Al Israel Airlines announced today its financial results for the year 2016 and the fourth quarter of the year: The Company's revenues in 2016 amounted to approx. USD 2,038 million, compared to approx.
Volaris Reports First Quarter 2018 Results: Ancillary Revenue Expansion, Unit Cost Reduction and Cash Flow Generation
 Volaris Reports First Quarter 2018 Results: Ancillary Revenue Expansion, Unit Cost Reduction and Cash Flow Generation Mexico City, Mexico, April 20, 2018 Volaris* (NYSE: VLRS and BMV: VOLAR), the ultra-low-cost
Enhancing air travel options through a strong focus on profitability and innovation. 4 th Quarter 2017 Earnings Report Grupo Viva Aerobus
 4 th Quarter 2017 Earnings Report Grupo Viva Aerobus Enhancing air travel options through a strong focus on profitability and innovation 1 VIVA AEROBUS REPORTS GROWTH OF 17.9% IN TOTAL OPERATING REVENUE
Copa Holdings Reports Net Income of US$51.9 Million for the Fourth Quarter of 2008 and US$152.2 Million for Full Year 2008
 Copa Holdings Reports Net Income of US$51.9 Million for the Fourth Quarter of 2008 and US$152.2 Million for Full Year 2008 Panama City, Panama --- February 19, 2009. Copa Holdings, S.A. (NYSE: CPA), parent
Copa Holdings Reports Net Income of US$113.9 Million for the Fourth Quarter of 2013
 Copa Holdings Reports Net Income of US$113.9 Million for the Fourth Quarter of 2013 Panama City, Panama --- February 12, 2014. Copa Holdings, S.A. (NYSE: CPA), today announced financial results for the
OPERATING AND FINANCIAL HIGHLIGHTS
 Copa Holdings Reports Net Income of US$18.6 Million and EPS of US$0.42 for the Second Quarter of 2010 Excluding special items, adjusted net income came in at $26.3 million, or $0.60 per share Panama City,
Azul Increases Net Income by R$152 Million in 1Q18 Operating margin was a record 12.5% despite the 21% increase in oil year over year
 Azul Increases Net Income by R$152 Million in 1Q18 Operating margin was a record 12.5% despite the 21% increase in oil year over year São Paulo, May 10, Azul S.A., Azul, (B3:AZUL4, NYSE:AZUL) the largest
Volaris Reports First Quarter 2017 Results: 19% Adjusted EBITDAR Margin
 Volaris Reports First Quarter 2017 Results: 19% Adjusted EBITDAR Margin Mexico City, Mexico, April 20, 2017 Volaris* (NYSE: VLRS and BMV: VOLAR), the ultra-low-cost airline serving Mexico, the United States
El Al Israel Airlines announced today its financial results for the second quarter and the first half of 2017.
 August 16, 2017 El Al Israel Airlines announced today its financial results for the second quarter and the first half of 2017. The Company's revenues in the second quarter of 2017 amounted to approx. USD
CONTACT: Investor Relations Corporate Communications
 NEWS RELEASE CONTACT: Investor Relations Corporate Communications 435.634.3200 435.634.3553 Investor.relations@skywest.com corporate.communications@skywest.com SkyWest, Inc. Announces Second Quarter 2017
CONTACT: Investor Relations Corporate Communications
 NEWS RELEASE CONTACT: Investor Relations Corporate Communications 435.634.3200 435.634.3553 Investor.relations@skywest.com corporate.communications@skywest.com SkyWest, Inc. Announces Second Quarter 2016
Volaris Reports Third Quarter 2018 Results: Ancillary Revenue Expansion And Reduction Of Unit Cost Excluding Fuel
 Volaris Reports Third Quarter 2018 Results: Ancillary Revenue Expansion And Reduction Of Unit Cost Excluding Fuel Mexico City, Mexico, October 25, 2018 Volaris* (NYSE: VLRS and BMV: VOLAR), the ultra-low-cost
Third Quarter Results
 1 Third Quarter 2010-11 Results Highlights of the Third Quarter Passenger business affected by significant disruptions Dynamic cargo activity Strong improvement in results Decline in ex-fuel unit costs
Volaris Reports Second Quarter 2017 Results: 26% Adjusted EBITDAR Margin. Non-Ticket Revenues Reached 29%
 Volaris Reports Second Quarter 2017 Results: 26% Adjusted EBITDAR Margin. Non-Ticket Revenues Reached 29% Mexico City, Mexico, July 21, 2017 Volaris* (NYSE: VLRS and BMV: VOLAR), the ultra-low-cost airline
PRESS RELEASE Financial Results. Rising passenger traffic at 12.5m Exceeding 1bn in consolidated revenue
 PRESS RELEASE 2016 Financial Results Rising passenger traffic at 12.5m Exceeding 1bn in consolidated revenue Kifissia, 23 March 2017 AEGEAN reports full year 2016 results with consolidated revenue at 1,020m,
Results 1 st Quarter 2005
 Grupo Posadas, s, S.A. de C.V. & Subsidiaries April 28, 2005 Results 1 st Quarter 2005 Total revenues increase 13% in the quarter Higher demand in urban hotels Better results in coastal hotels 3 openings
SkyWest, Inc. Announces First Quarter 2018 Profit
 NEWS RELEASE CONTACT: Investor Relations Corporate Communications 435.634.3200 435.634.3553 Investor.relations@skywest.com corporate.communications@skywest.com SkyWest, Inc. Announces First Quarter 2018
In 2Q18, Brazil s #1 airline achieves a 2% EBIT margin and grows net revenues by 9%
 In 2Q18, Brazil s #1 airline achieves a 2% EBIT margin and grows net revenues by 9% Operating Income for the second quarter doubled, reaching R$43 million São Paulo, August 2, 2018 - ( GOL or Company ),
Earnings Report 4 th Quarter 2016 Grupo Viva Aerobus
 Earnings Report 4 th Quarter 2016 Grupo Viva Aerobus Grupo Viva Aerobus announces results for the fourth quarter of 2016 Mexico City, Mexico, February 20, 2016- Grupo Viva Aerobus S.A. de C.V. ( Grupo
Finnair Q Result
 Finnair Q1 2015 Result 7 May 2015 CEO Pekka Vauramo, Interim CFO Mika Stirkkinen 1 Turbulent market environment The weakness of the Finnish economy continued to be reflected in the demand in the first
Spirit Airlines Reports First Quarter 2017 Results
 Spirit Airlines Reports First Quarter 2017 Results MIRAMAR, Fla., April 28, 2017 - Spirit Airlines, Inc. (NASDAQ: SAVE) today reported first quarter 2017 financial results. GAAP net income for the first
Finnair Q Result
 Finnair Q2 2015 Result 14 August 2015 CEO Pekka Vauramo, Interim CFO Mika Stirkkinen 1 Market environment shows signs of improvement There were signs of a recovery in the demand for consumer and business
Fourth Quarter 2017 Highlights
 Avianca Holdings Reports Fourth Quarter 2017 Adjusted Operating Income 1 of $169.1 Million Bogota, Colombia, February 27, 2018 Avianca Holdings S.A. (NYSE: AVH, BVC: PFAVH) today reported its financial
Enhancing air travel options through a strong focus on profitability and innovation. 1 rst Quarter 2018 Earnings Report Grupo Viva Aerobus
 1 rst Quarter 2018 Earnings Report Grupo Viva Aerobus Enhancing air travel options through a strong focus on profitability and innovation 1 VIVA AEROBUS REPORTS GROWTH OF 49.2% IN REVENUE AND 83.2% IN
Ref. PE004/ May Subject: Management Discussion and Analysis for the First Quarter of 2018
 Ref. PE004/2561 10 May 2018 Subject: Management Discussion and Analysis for the First Quarter of 2018 Attention: President The Stock Exchange of Thailand According to the financial reports of Nok Airlines
MIRAMAR, Fla., April 29, 2015 (GLOBE NEWSWIRE) -- Spirit Airlines, Inc. (Nasdaq:SAVE) today reported first quarter 2015 financial results.
 -- Spirit Airlines, Inc. (Nasdaq:SAVE) today reported first quarter 2015 financial results.") April 29, 2015 Spirit Airlines Announces First Quarter 2015 Results; Adjusted Net Income Increases 87.1 Percent to $70.7 Million and Pre-Tax Margin Increases 900 Basis Points to 22.7 Percent MIRAMAR, Fla.,
April 29, 2015 Spirit Airlines Announces First Quarter 2015 Results; Adjusted Net Income Increases 87.1 Percent to $70.7 Million and Pre-Tax Margin Increases 900 Basis Points to 22.7 Percent MIRAMAR, Fla.,
Investor Relations Update January 25, 2018
 General Overview Investor Relations Update Accounting Changes On January 1, 2018, the company adopted two new Accounting Standard Updates: (ASUs): ASU 2014-9: Revenue from Contracts with Customers (the
Third Quarter 2017 Highlights
 Avianca Holdings Reports Third Quarter 2017 Adjusted Operating Income 1 of $131.5 Million Bogota, Colombia, November 14, 2017 Avianca Holdings S.A. (NYSE: AVH, BVC: PFAVH) today reported its financial
AIR CANADA REPORTS 2010 THIRD QUARTER RESULTS; Operating Income improved $259 million or 381 per cent from previous year s quarter
 AIR CANADA REPORTS 2010 THIRD QUARTER RESULTS; Operating Income improved $259 million or 381 per cent from previous year s quarter MONTRÉAL, November 4, 2010 Air Canada today reported operating income
SKYWEST, INC. ANNOUNCES THIRD QUARTER 2014 RESULTS
 NEWS RELEASE For Further Information Contact: Investor Relations Telephone: (435) 634-3203 Fax: (435) 634-3205 FOR IMMEDIATE RELEASE: October 29, 2014 SKYWEST, INC. ANNOUNCES THIRD QUARTER 2014 RESULTS
FIRST QUARTER 2017 RESULTS. 4 May 2017
 FIRST QUARTER 2017 RESULTS 4 May 2017 A resilient start of the year, traffic up 4.2% 20.9 million passengers carried, up 5.2%, traffic (RPK) up 4.2%, capacity (ASK) up 3.3% and load factor up 0.7pts Confirmation
26 October 2017 Icelandair Group Interim Report NET PROFIT USD 101 MILLION IN THIRD QUARTER
 NET PROFIT USD 101 MILLION IN THIRD QUARTER Total income in Q3 up by 10% between years, to USD 536.0 million Passenger revenue higher than expected EBITDA unchanged year on year, at USD 161.1 million Passenger
ASUR 2Q11 PASSENGER TRAFFIC UP 2.89% YOY
 In Mexico ASUR Lic. Adolfo Castro (52) 5552-84-04-08 acastro@asur.com.mx In the U.S. Breakstone Group Susan Borinelli (646) 330-5907 sborinelli@breakstone-group.com ASUR 2Q11 PASSENGER TRAFFIC UP 2.89%
H1 RESULTS 2007 Jón Karl Ólafsson, CEO
 H1 RESULTS 2007 Jón Karl Ólafsson, CEO Agenda 01 Highlights 02 Financial results 03 Outlook 04 New organizational chart 05 Q & A H1 Highlights Aggressive fleet growth characterizes H1 results 12 aircraft
Analyst and Investor Conference Call Q Ulrik Svensson, CFO and Member of the Executive Board
 Analyst and Investor Conference Call Q2 2017 Ulrik Svensson, CFO and Member of the Executive Board Frankfurt, 2 August 2017 Disclaimer The information herein is based on publicly available information.
Second Quarter Management s Discussion and Analysis of Results of Operations and Financial Condition
 Second Quarter 2017 Management s Discussion and Analysis of Results of Operations and Financial Condition August 1, 2017 TABLE OF CONTENTS 1. Highlights... 3 2. Introduction and Key Assumptions... 5 3.
Third Quarter Management s Discussion and Analysis of Results of Operations and Financial Condition
 Third Quarter 2017 Management s Discussion and Analysis of Results of Operations and Financial Condition October 25, 2017 TABLE OF CONTENTS 1. Highlights... 3 2. Introduction and Key Assumptions... 5 3.
Management Discussions and Analysis for the three-month period ended 31 March 2014 and Executive Summary
 Executive Summary Overview of the global economy during the first quarter of 2015 (Q1/2015) are as following; the US economy has been in recovery mode while rapidly dollar appreciation weighs on net exports
Q Fast growth continued, Comparable operating result at record high levels Pekka Vauramo
 2018 Fast growth continued, Comparable operating result at record high levels 17.7.2018 Pekka Vauramo 2 A good - Comparable operating result increased to new seasonal high Revenue Comparable operating
Spirit Airlines Reports Fourth Quarter and Full Year 2016 Results
 Spirit Airlines Reports Fourth Quarter and Full Year 2016 Results MIRAMAR, FL. (February 7, 2017) - Spirit Airlines, Inc. (NASDAQ: SAVE) today reported fourth quarter and full year 2016 financial results.
Adjusted net income of $115 million versus an adjusted net loss of $7 million in the second quarter of 2012, an improvement of $122 million
 Air Canada Reports Record Second Quarter 2013 Results Highest Adjusted Net Income, Operating Income and EBITDAR Results for Second Quarter in Air Canada s History Adjusted net income of $115 million versus
Enhancing air travel options through a strong focus on profitability and innovation innovation
 2 nd Quarter 2018 Earnings Report Grupo Viva Aerobus Enhancing air travel options through a strong focus on profitability and innovation innovation 1 VIVA AEROBUS REPORTS GROWTH OF 32.3% IN EBITDAR AND
LAN AIRLINES REPORTS NET INCOME OF US$88.3 MILLION FOR THE FIRST QUARTER OF 2010
 FOR IMMEDIATE RELEASE LAN AIRLINES REPORTS NET INCOME OF US$88.3 MILLION FOR THE FIRST QUARTER OF 2010 Santiago, Chile, April 27, 2010 LAN Airlines S.A. (NYSE: LFL), one of Latin America s leading passenger
QUARTER Management s Discussion and Analysis of Results of Operations and Financial Condition
 QUARTER 1 2009 Management s Discussion and Analysis of Results of Operations and Financial Condition MAY 8, 2009 TABLE OF CONTENTS 1. Highlights...1 2. Introduction...2 3. Overview...4 4. Results of Operations
AIR CANADA REPORTS THIRD QUARTER RESULTS
 AIR CANADA REPORTS THIRD QUARTER RESULTS THIRD QUARTER OVERVIEW Operating income of $112 million compared to operating income of $351 million in the third quarter of 2007. Fuel expense increased 49 per
AMR CORPORATION REPORTS THIRD QUARTER 2011 RESULTS. Net Loss of $162 Million; Operating Earnings of $39 Million
 CONTACT: Sean Collins Corporate Communications Fort Worth, Texas 817-967-1577 mediarelations@aa.com FOR RELEASE: Wednesday, REPORTS THIRD QUARTER 2011 RESULTS Net Loss of $162 Million; Operating Earnings
Second Quarter Management s Discussion and Analysis of Results of Operations and Financial Condition
 Second Quarter 2018 Management s Discussion and Analysis of Results of Operations and Financial Condition July 27, 2018 TABLE OF CONTENTS 1. Highlights... 1 2. Introduction and Key Assumptions... 3 3.
1Q 2014 Edition. Share Information. Daily Share Price Movements
 1Q 2014 Edition 1Q 2013 1Q 2014 Change Financial Summary (USD Mio) OPERATING REVENUES 807 807 0.01% OPERATING EXPENSES 827 1,000 20.86% OTHERS (INCOME) 4 25 460.80% INCOME (LOSS) FROM OPERATIONS -20-193
4Q15 and 2015 Results Presentation. March 30, 2016
 4Q15 and 2015 Results Presentation March 30, 2016 Highlights Paulo Kakinoff CEO Highlights Macro Environment Even more adverse environment for the Brazilian economy, with a GDP drop of 3.8% in 2015 Devaluation
LATAM AIRLINES GROUP REPORTS OPERATING INCOME OF US$267 MILLION FOR FOURTH QUARTER 2014 AND US$513 FOR FULL YEAR 2014
 LATAM AIRLINES GROUP REPORTS OPERATING INCOME OF US$267 MILLION FOR FOURTH QUARTER 2014 AND US$513 FOR FULL YEAR 2014 Santiago, Chile, March 17, 2015 (NYSE: LFL; IPSA: LAN; BOVESPA: LATM33), the leading
AIR CANADA REPORTS FULL YEAR AND FOURTH QUARTER 2010 RESULTS
 AIR CANADA REPORTS FULL YEAR AND FOURTH QUARTER 2010 RESULTS Record annual EBITDAR of $1.386 billion, 104 per cent improvement Operating income improvement of $677 million Employees to receive special
Results 3 rd Quarter 2003
 Grupo Posadas, s, S.A. de C.V. & Subsidiaries October 28 th, 2003 Results 3 rd Quarter 2003 Total revenue and EBITDA increased by 10 and 12 % respectively Coastal hotels continue to improve, rates on urban
Air Canada Reports Second Quarter 2018 Results
 \ Air Canada Reports Second Quarter 2018 Results Second quarter EBITDAR of $646 million and operating income of $226 million Record second quarter operating revenues of $4.333 billion Record unrestricted
FILED: NEW YORK COUNTY CLERK 03/27/ :34 PM INDEX NO /2017 NYSCEF DOC. NO. 69 RECEIVED NYSCEF: 03/27/2017. Exhibit 13
 Exhibit 13 Avianca Holdings Reports Fourth Quarter 2016 Adjusted Operating Profit 1 of $102.1 Million Bogota, Colombia, February 28, 2017 Avianca Holdings S.A. (NYSE: AVH, BVC: PFAVH) today reported its
Spirit Airlines Reports Third Quarter 2015 Pre-Tax Margin of 26.9 Percent
 October 27, 2015 Spirit Airlines Reports Third Quarter 2015 Pre-Tax Margin of 26.9 Percent MIRAMAR, Fla., Oct. 27, 2015 (GLOBE NEWSWIRE) -- Spirit Airlines, Inc. (NASDAQ:SAVE) today reported third quarter
Conference Call 1Q14 Results. Investor Relations May 15, 2014
 Conference Call Results Investor Relations May 15, 2014 1 Highlights 2 Highlights Net revenues of R$2.5 billion in the quarter, an increase of 20% or R$411 million quarter-over-quarter; EBIT totaled R$144
Vueling improves its result in 4 points for the first quarter 2009
 Vueling improves its result in 4 points for the first quarter 2009 Improvement in costs was the most important factor for the improvement in EBIT margin Synergies in revenue due to the merger offset the
THIRD QUARTER OPERATING PROFIT UP 51% TO $675 MILLION
 THIRD QUARTER OPERATING PROFIT UP 51% TO $675 MILLION GROUP FINANCIAL PERFORMANCE Third Quarter 2007-08 The Group made an operating profit of $675 million in the third quarter of financial year 2007-08,
Fourth Quarter and Full Year 2009 Results Presentation January 27, 2010
 Fourth Quarter and Full Year 2009 Results Presentation January 27, 2010 This presentation may include forward-looking comments regarding the Company s business outlook and anticipated financial and operating
Fourth Quarter 2006 Results Presentation February 15, 2007
 Fourth Quarter 2006 Results Presentation February 15, 2007 This presentation may include forward-looking comments regarding the Company s business outlook and anticipated financial and operating results.
Managing through disruption
 28 July 2016 Third quarter results for the three months ended 30 June 2016 Managing through disruption 3 months ended Like-for-like (ii) m (unless otherwise stated) Change 30 June 2016 30 June 2015 change
PROFIT OF $1.24b ON STRONG REVENUE GAINS BUT FUEL COSTS REMAIN GREATEST CHALLENGE
 PROFIT OF $1.24b ON STRONG REVENUE GAINS BUT FUEL COSTS REMAIN GREATEST CHALLENGE HIGHLIGHTS OF THE GROUP S PERFORMANCE Financial Year 2005-06 4th Quarter 2005-06 Apr 2005 Mar 2006 Year-on-Year % Change
Investor Update Issue Date: April 9, 2018
 Investor Update Issue Date: April 9, 2018 This investor update provides guidance and certain forward-looking statements about United Continental Holdings, Inc. (the Company or UAL ). The information in
NORWEGIAN AIR SHUTTLE ASA QUARTERLY REPORT SECOND QUARTER 2006 [This document is a translation from the original Norwegian version]
![NORWEGIAN AIR SHUTTLE ASA QUARTERLY REPORT SECOND QUARTER 2006 [This document is a translation from the original Norwegian version]](/thumbs/74/71229964.jpg "NORWEGIAN AIR SHUTTLE ASA QUARTERLY REPORT SECOND QUARTER 2006 [This document is a translation from the original Norwegian version]") NORWEGIAN AIR SHUTTLE ASA QUARTERLY REPORT SECOND QUARTER 2006 SECOND QUARTER IN BRIEF had earnings before tax of MNOK 24.8 (20.6) in the second quarter. The operating revenue increased by 44 % this quarter,
NORWEGIAN AIR SHUTTLE ASA QUARTERLY REPORT SECOND QUARTER 2006 SECOND QUARTER IN BRIEF had earnings before tax of MNOK 24.8 (20.6) in the second quarter. The operating revenue increased by 44 % this quarter,
Q Finnair s growth continued Pekka Vähähyyppä
 2018 Finnair s growth continued 25.10.2018 Pekka Vähähyyppä 1 We continued to develop our services and network New route to Los Angeles in 2019, two daily flights to Hong Kong New digital service for exploring
Norwegian Air Shuttle ASA
 Norwegian Air Shuttle ASA Q4 2017 Presentation 15 February 2018 Highlights Q4 2017 Added one 737-800 and two 787-9s to operations Financed the first aircraft with a combination of UKEF and JOLCO Agreed
SKYWEST, INC. ANNOUNCES THIRD QUARTER 2012 RESULTS
 NEWS RELEASE For Further Information Contact: Michael J. Kraupp Chief Financial Officer and Treasurer Telephone: (435) 634-3212 Fax: (435) 634-3205 FOR IMMEDIATE RELEASE: November 7, 2012 SKYWEST, INC.
ASUR 2Q15 PASSENGER TRAFFIC UP 14.27% YOY
 In Mexico ASUR Lic. Adolfo Castro (52) 5552-84-04-08 acastro@asur.com.mx In the U.S. MBS Value Partners Susan Borinelli (646) 330-5907 susan.borinelli@mbsvalue.com For Immediate Release ASUR 2Q15 PASSENGER
PRESS RELEASE. First Half 2017 Financial Results Higher Load Factors and traffic lead to a significant rebound in second quarter profitability
 PRESS RELEASE First Half 2017 Financial Results Higher Load Factors and traffic lead to a significant rebound in second quarter profitability Kifissia, 12 September 2017 AEGEAN announces first half 2017
2012 Result. Mika Vehviläinen CEO
 2012 Result Mika Vehviläinen CEO 1 Agenda Market environment in Q4 Business performance and strategy execution Outlook Financials 2 Market Environment According to IATA, Global air travel continues to
Delta Air Lines Announces September Quarter Profit
 Page 1 FOR IMMEDIATE DISTRIBUTION CONTACT: Investor Relations 404-715-2170 Corporate Communications 404-715-2554, media@delta.com news archive at news.delta.com Delta Air Lines Announces September Quarter
Thank you for participating in the financial results for fiscal 2014.
 Thank you for participating in the financial results for fiscal 2014. ANA HOLDINGS strongly believes that safety is the most important principle of our air transportation business. The expansion of slots