Market and Industry Data
|
|
|
- Aron Rodgers
- 5 years ago
- Views:
Transcription

1 Investor Presentation June 2018
2 Forward-Looking Statements Statements in this presentation that are not historical facts are "forward-looking" statements and "safe harbor statements" within the meaning of the Private Securities Litigation Reform Act of 1995 that involve risks and/or uncertainties, including those described in the Company's public filings with the Securities and Exchange Commission and any amendments thereto. The Company has based forward-looking statements on management's current expectations and assumptions and not on historical facts. Examples of these statements include, but are not limited to, the Company s expectations regarding its ability to meet its financial and strategic goals, the Company s ability to further grow its portfolio on an accretive basis, the Company s expectations with respect to future rent growth, including potential rent from the ROFO property and the expected closing of the Hard Rock Rocksino and Empire City Casino, any expected benefits to be realized as a result of the acquisitions and the Company s ability to sell the Hard Rock Rocksino operating assets to a third party operator. These forward-looking statements involve a number of risks and uncertainties. Among the important factors that could cause actual results to differ materially from those indicated in such forward-looking statements include risks related to the Company s ability to receive, or delays in obtaining, any regulatory approvals required to own its properties, or other delays or impediments to completing the Company s planned acquisitions or projects, including any acquisitions of properties from MGM Resorts International ( MGM or MGM Resorts ); the ultimate timing and outcome of any planned acquisitions or projects; the Company s ability to maintain its status as a REIT; the availability of and the ability to identify suitable and attractive acquisitions and development opportunities and the ability to acquire and lease those properties on favorable terms; the Company s ability to access capital through debt and equity markets in amounts and at rates and costs acceptable to the Company; changes in the U.S. tax law and other state, federal or local laws, whether or not specific to REITs or to the gaming or lodging industries; and other factors described in the Company's public filings with the Securities and Exchange Commission (the SEC ). In providing forward-looking statements, the Company is not undertaking any duty or obligation to update these statements publicly as a result of new information, future events or otherwise, except as required by law. If the Company updates one or more forward-looking statements, no inference should be drawn that it will make additional updates with respect to those other forward-looking statements. In addition, the Company has included certain historical information in this presentation related to the Company and MGM, including historical information related to the Company s and MGM s business, financial condition and results of operations. The delivery of this presentation is not intended to and does not create any implication that there have been no changes to the Company s or MGM s affairs since the date of any of the historical information provided. Market and Industry Data This presentation also contains estimates and information concerning the Company s industry, that are based on industry publications, reports and peer company public filings. This information involves a number of assumptions and limitations, and you are cautioned not to rely on or give undue weight to this information. The Company has not independently verified the accuracy or completeness of the data contained in these industry publications, reports or filings. The industry in which we operate is subject to a high degree of uncertainty and risk due to variety of factors, including those described in the Risk Factors section of the Company s public filings with the SEC. Third party logos & brands including in this presentation are the property of their respective owners. Non-GAAP Disclaimer The following presentation includes certain non-gaap financial measures as defined in Regulation G under the Securities Exchange Act of 1934, as amended. Schedules that reconcile the non-gaap financial measures to the most directly comparable financial measures calculated and presented in accordance with Generally Accepted Accounting Principles in the United States are included herein and in MGP s earnings releases that have been furnished with the SEC and are available on MGP s website at This presentation also includes certain financial measures, such as MGM s Adjusted EBITDA and MGM s Adjusted Property EBITDA, which are not calculated in accordance with U.S. generally accepted accounting principles ( U.S. GAAP ). Management recommends that you focus on the U.S. GAAP numbers as the best indicator of financial performance. These alternative measures are provided only as a supplement to aid in your analysis. MGM uses Adjusted EBITDA and Adjusted Property EBITDA as the primary profit measure for its reportable segments. Adjusted EBITDA is a measure defined as earnings before interest and other non-operating income (expense), taxes, depreciation and amortization, preopening and start-up expenses, and property transactions, net. Adjusted Property EBITDA is a measure defined as Adjusted EBITDA before corporate expense and stock compensation expense related to MGM s stock option plan, not allocated to each casino resort. Adjusted EBITDA or Adjusted Property EBITDA should not be construed as an alternative to operating income or net income, as an indicator of MGM s performance; or as an alternative to cash flows from operating activities, as a measure of liquidity; or as any other measure determined in accordance with generally accepted accounting principles. MGM has significant uses of cash flows, including capital expenditures, interest payments, taxes and debt principal repayments, which are not reflected in Adjusted EBITDA or Adjusted Property EBITDA. Also, other companies in the gaming and hospitality industries that report Adjusted EBITDA or Adjusted Property EBITDA information may calculate Adjusted EBITDA or Adjusted Property EBITDA in a different manner. Please see MGM s earnings releases which have been filed with the SEC and are available on MGM s website for a reconciliation of MGM s reported Adjusted EBITDA and Adjusted Property EBITDA to net income. Financial information for MGM included in this presentation has been derived from MGM s public filings, which includes certain expenses related to the Company that are not eliminated in consolidation. 1


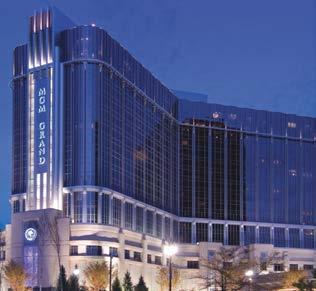
3 MGP Premier Triple Net REIT Triple net lease REIT engaged in owning, acquiring and leasing high-quality leisure, entertainment and hospitality assets with one of the largest portfolios of premier assets on the Las Vegas Strip Assets leased to MGM Resorts with expected annual rent of approximately $770 million as part of a long-term triple net master lease Las Vegas Assets Company Highlights Regional Assets 4.0x Rent Coverage Ratio (1) Tenant & Property-Level Financial Performance Publicly Disclosed >$4 billion of announced acquisitions since IPO ~17.5% Dividend Growth since April 2016 IPO % Annual Rent Increase Fixed Through 2022 (2) 3 Dividend Increases Since IPO 5 1 ROFO (4) No Near Term Lease Expirations Embedded Growth Pipeline through ROFO and MGM Assets 5.6% Dividend Yield (3) Under Contract 1 2 (1) Based on calculations on page 24. (2) Based on 2.0% annual escalator on fixed rent (90% of total rent), compounded through the lease year ending 4/1/2022. (3) Based on closing share price on 6/1/2018 and annual per share dividend amount of $1.68, which amount may be changed in the future at the discretion of the Company. (4) The Master Lease provides us with a right of first offer with respect to MGM s development property located in Springfield, Massachusetts should MGM Resorts choose to sell such asset. 2


 488 (354 / 134) Park MGM")


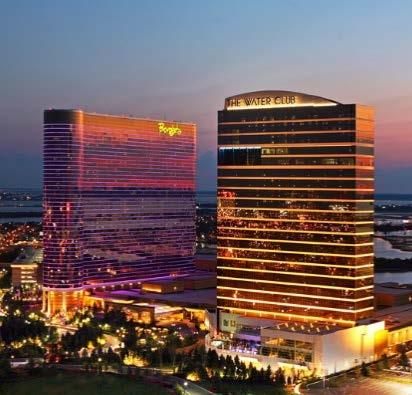
 Borgata Land")
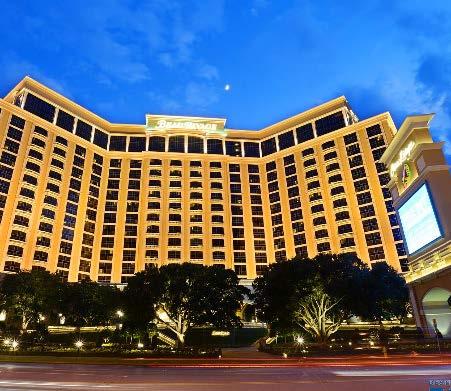
4 Landmark Real Estate Mandalay Bay + Delano Portfolio Snapshot Significant Real Estate Asset Value as of 12/31/17 # of Hotel Rooms 27,538 MGM National Harbor Total Acres (Las Vegas / Regional) 488 (354 / 134) Park MGM Meeting / Convention Space Square Footage >2.68 million MGM Grand Detroit Total Casino Square Footage >1.15 million Gross Book Value of Assets as of 12/31/17 ($ in billions) Borgata Land Value $4.1 Buildings Value $8.5 Gross Land & Building Value $12.7 Beau Rivage 3
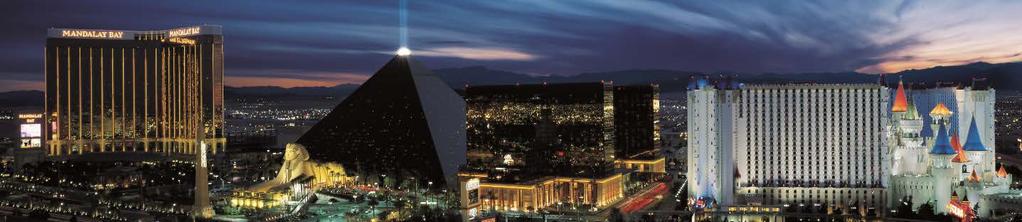
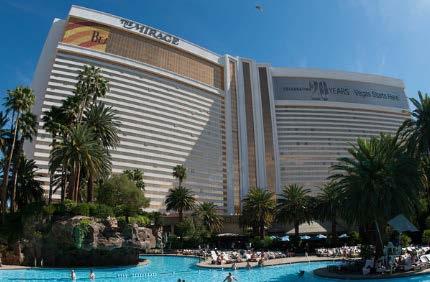
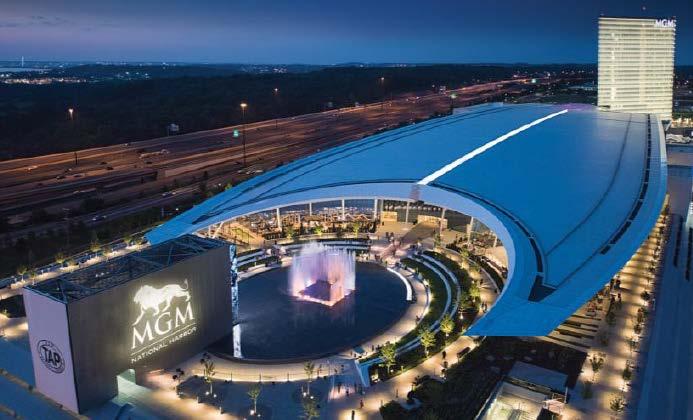
5 Enhanced Geographic Diversification Premium portfolio consisting of 11 high-quality, mixed-use Las Vegas resorts and market-leading regional assets + ROFO assets (1) + 2 assets under contract Detroit, MI Cleveland, OH New York, NY Springfield, MA Las Vegas _1.wor (NY008MZK) Tunica, MS Washington D.C. Atlantic City, NJ Biloxi, MS Las Vegas Assets Regional Assets ROFO Asset (1) Under Contract (1) MGP has a right of first offer on MGM Springfield and Empire City Developments 4


6 Rent Supported by Diversified Revenue Stream The Las Vegas market continues to diversify its offerings, solidifying its position as a major U.S. entertainment destination with MGM Resorts leading this diversification Non-gaming revenues constituted 66% of total market-wide revenues in 2017 Leading Las Vegas Position 2017 LV Market Total Revenue Mix Other 15% Gaming 34% F&B 23% Hotel 28% MGM Growth Properties Tenant Owned Source: Nevada Gaming Abstract 5


7 Market Leading (1) Regional Portfolio Under Contract: Hard Rock Rocksino is the market leader in Ohio with a Net Win of ~$240 million in 2017 Atlantic City, NJ Mississippi (Biloxi, Tunica) Maryland / WV / Metro DC Detroit, MI 2017 GGR: $2.4 Billion #1 Market Leader 2017 GGR: $2.1 Billion #1 Market Leader 2017 GGR: $1.6 Billion #1 Market Leader 2017 GGR: $1.4 Billion #1 Market Leader Source: Department of Gaming Enforcement of New Jersey, Michigan Gaming Control Board, Maryland Lottery & Gaming Control Commission, Mississippi Gaming Commission, Ohio Lottery Commission (1) Based on gross gaming revenue as of the 12 months ended December 31,
 $800 $700 $600 $550 $757 $75 $770 $75 $784 $75 $798 $75 $813 $75 $500 $55 2% Escalator Fixed through 2021")
 5-Year Extensions (3) $0 At IPO Year 2 Year 3 Year 4 Year 5 Year 6 Fixed Rent Percentage Rent (1) Illustrative Rent Growth based on current Master")
 Does not give effect to announced Hard Rock Rocksino and Empire City Casino acquisitions.")
8 Master Lease Provides Stable Income Plus Embedded Growth High Organic Growth Predictable Rent Growth (1)(2) $900 Illustrative 6-Year Total Growth: +48% Current Annual Rent of $770 million 2% Escalator on $696 of $770 million ~$14 million expected annual rent increase on 4/1/19 (2) $800 $700 $600 $550 $757 $75 $770 $75 $784 $75 $798 $75 $813 $75 $500 $55 2% Escalator Fixed through 2021 First test on 4/1/22 Percentage rent on $75 of $770 million 1 st Adjustment in 2022 based on average Net Revenue for prior 5 year period ($ in millions) $400 $300 $200 $495 $682 $696 $710 $724 $738 $ year total term 10 year Initial with (4) 5-Year Extensions (3) $0 At IPO Year 2 Year 3 Year 4 Year 5 Year 6 Fixed Rent Percentage Rent (1) Illustrative Rent Growth based on current Master Lease; in year 2, assumes full year impact of the Borgata & National Harbor transaction plus 1 year of the fixed rent escalator pro forma for the Borgata transaction and rent at year 1 only; thereafter, based on current Master Lease. (2) Does not give effect to announced Hard Rock Rocksino and Empire City Casino acquisitions. (3) The initial term of the Master Lease with respect to MGM National Harbor ends on August 31 st, 2024, and may be renewed thereafter at the option of the Tenant for an initial renewal period lasting until the earlier of the end of the then-current term of the Master Lease or the next renewal term (depending on whether MGM elects to renew the other properties under the Master Lease in connection with the expiration of the initial ten-year term), after which the term of the Master Lease with respect to MGM National Harbor will be the same as the term of the Master Lease with respect to the other properties currently under the Master Lease. If MGM does not renew the lease with respect to MGM National Harbor after the initial term, MGM would lose the right to renew the Master Lease with respect to the rest of the properties when the initial ten-year lease term related to the rest of the properties ends in
 in Net Revenues (1) 28 Unique Hotel Offerings 480+ Food Beverage & Club Experiences 3.9 Million 2.")
9 Tenant Snapshot: MGM Resorts is a Leading Global Entertainment Company (1) S&P 500 $17.4 Billion $10.9 Billion Company Market Cap (1) in Net Revenues (1) 28 Unique Hotel Offerings 480+ Food Beverage & Club Experiences 3.9 Million 2.4 Million SF Convention Space SF of Casino Space 7,000+ Convention/Meetings Per Year 29,000+ Slot Machines 8,100+ Shows Per Year 25+ Arena & Entertainment Venues 350+ Retail Experiences 49,000+ Rooms & Suites 1,900+ Table Games 78,000 Employees Source: MGM Resorts International public filings as of 4/2018 (1) Market cap based on share price as of 6/1/2018, Net Revenues based on trailing 12 months ended 3/31/2018 other data as of 2/
 Coverage stress tested through both the Recession & Las Vegas supply increases 26 Million M Life Rewards members and growing ~$5 billion of")

 Based on method shown on page 24, corporate rent coverage of 4.")
10 Stable & Secure Rent All Properties Under 1 Master Lease Corporate Guarantee from MGM Resorts 4.0x Rent Coverage Ratio (1) Coverage stress tested through both the Recession & Las Vegas supply increases 26 Million M Life Rewards members and growing ~$5 billion of invested capital coming online in 2018 (2) MGM Cotai opened in February 2018 Historical Corp. Rent Covg. based on JV Distributions (1) 3.4x 2.4x 2.5x 2.2x 2.4x 2.9x 3.2x 3.7x 4.1x Rent Supported by MGM Resorts Diverse Portfolio of Globally Recognized Brands Source: MGM Resorts International public filings as of 2/2018. Third party logos & brands are the property of their respective owners. (1) Based on method shown on page 24, corporate rent coverage of 4.0x; please refer to appendix page 25 for historical corporate rent coverage ratio detail. (2) Based on the opening of Park MGM (~$550 million), MGM Springfield ($960 million) & MGM Cotai ($3.4 billion). Real Estate owned/leased by MGP 9
 (8) with Unit-Level 79% 97% 54% -- 100% -- -- Financials (2) 2017 % of Rent with Corporate- Level Financials (2) 78% -- -- 100% 100% -- 98% 2017 Same Store Rental Growth (3) 0.")
11 Attractive REIT Portfolio ($ in millions) 2017 Rent Coverage (1) 3.4x 2.1x 2.7x 3.6x 4.0x x 2017 % of Rent (7) (8) with Unit-Level 79% 97% 54% % Financials (2) 2017 % of Rent with Corporate- Level Financials (2) 78% % 100% -- 98% 2017 Same Store Rental Growth (3) 0.4% 1.2% 1.0% 0.6% 1.8% 1.8% 1.7% 2017 Net Investment (4) $658 $1,103 $1,353 $1,062 $1,188 $868 $ Dividend (9) (10) Growth (5) 4.4% 6.9% 5.6% % 6.3% 5.0% Current Dividend Yield (6) 4.6% 4.7% 5.0% 5.4% 5.6% 7.1% 7.2% Sources: Company filings as of year end 2017; FactSet, SNL Financial as of 6/1/2018. Note: -- = Not available or not reported; ranked left to right by dividend yield. (1) (6) Please refer to detailed footnotes in appendix. (7) Based on % of locations subject to unit-level financial reporting Store Capital defined. (8) Based on % of retail tenants that provide unit-level financials * 2017FY % of total rent from retail tenants per Company filings. (9) Midpoint of escalators per Company Investor Presentation 4Q 2017, page 12. (10) % of Rent (83%) subject to escalator * escalator (1.8%); subject to minimum rent coverage of 1.8x. = Information publicly filed by tenants 10


12 Built-In Organic Growth and Through Acquisitions April 20, 2016 August 2016 April 1, 2017 October 2017 April 2018 IPO Acquired Borgata For 8.5% Cap Rate 1st Escalator Acquired National Harbor for 8.0% Cap Rate 2nd Escalator Annualized Cash Rental Revenue +40.0% (1) $757 $757 $770 ($ in millions) $550 $650 $650 $650 $662 $662 Borgata 1st Esc National Harbor 2nd Esc IPO IPO Q3'16 Q4'16 Q1'17 Q2'17 Q3'17 Q4'17 Q1'18 Q2'18 (1) Includes annualized fixed rent escalator effective as of April 1, 2017 and full year of National Harbor rent of $95 million. 11


13 Dividend Growth Increased dividend 3 out of the 8 dividends paid to date +17.5% $1.68 $1.68 National Harbor $1.58 $1.58 $1.55 $1.55 $1.55 1st Esc Borgata $1.43 IPO IPO Q3'16 Q4'16 Q1'17 Q2'17 Q3'17 Q4'17 Q1'18 12


")


14 2018 YTD Acquisition Activity Pro Forma Annual Cash Rent ($mm) $50 $870 $880 $50 60 $ PF Pro Forma Last Twelve Month Adjusted Property EBITDA by Region as of 3/31/18 (1) Washington, D.C., 9% New York City, 4% Ohio, 6% New Jersey, 17% Mississippi, 9% Las Vegas, 52% Washington, D.C., 8% New Jersey, 16% Las Vegas, 47% Michigan, 12% Mississippi, 8% Michigan, 10% Source: MGM Resorts International public filings as of 6/2018 (1) Empire City EBITDA based on pre-synergy adjusted EBITDA of $70 million. 13


15 Acquisition of Empire City Casino On May 29, 2018 MGM Growth Properties announced the agreement to acquire the real estate of Empire City Casino for $625 million $50 million in rent to be added to the Master Lease with MGM Resorts 8.0% acquisition cap rate / 12.5x EBITDA multiple In addition, MGM Resorts has agreed to give MGP a right of first offer (ROFO) with respect to certain land adjacent to the property to the extent MGM Resorts develops additional gaming facilities and chooses to sell or transfer the property in the future. Further geographically diversifies MGP s portfolio with exposure to the New York City area The transaction is expected to close in 1Q 19 and is subject to customary closing conditions and regulatory approvals Transaction Financing: OP Units issued to MGM: Approximately $380 million Debt: Approximately $245 million of debt to be refinanced using cash on hand and MGP s existing credit agreement Immediately accretive 15 Mi. Empire City Casino 14

 Gaming Square Feet: ~200,000 VLTs: ~2,300 Other: 1,800 1,900 seat")
16 Acquisition of Hard Rock Rocksino Northfield Park Transaction Overview On April 5, 2018, MGM Growth Properties announced agreement to acquire Hard Rock Rocksino Northfield Park for $1.06 billion The transaction is expected to close in the second half of 2018 & is subject to customary closing conditions & regulatory approvals MGP expects to ultimately sell the operations to a thirdparty operator & hold ownership of the real estate. Property Overview Location: Northfield Park, OH (~17 miles southeast of downtown Cleveland & 18 miles north of Akron) Gaming Square Feet: ~200,000 VLTs: ~2,300 Other: 1,800 1,900 seat music venue, 250 seat comedy club, 5 F&B offerings including a buffet and Hard Rock Café 18 Mi. 21 Mi. Hard Rock Rocksino 15
17 Disciplined Buyer Closed Gaming Real Estate Precedent Transactions Acquirer / Target MGP / National Harbor MGP / Borgata VICI Properties / Harrah s Las Vegas Gaming & Leisure Properties / Tunica Gaming & Leisure Properties / Meadows Gaming & Leisure Properties / Pinnacle Gaming & Leisure Properties / Casino Queen Announce Date 9/5/2017 5/31/ /29/2017 3/28/ /16/2015 7/21/ /9/2013 Consideration ($mm) Initial Rent / NOI ($mm) $1,188 $1,175 $1,136 $83 $302 ~$4,750 $140 $95 $100 $87 $9 $25 $377 $14 Cap Rate 8.0% 8.5% 7.5% 10.9% 8.4% 7.9% 10.0% Management Accretion Commentary (Prior to Transaction Close) Mid-Single Digit % Accretion to AFFO / Share High Single Digit % Accretion to AFFO / Share No Comment Separate land sale contingent on transaction Acquisition is expected to be immediately accretive Expected to be immediately accretive Anticipates low doubledigit percentage accretion to AFFO No Comment Subsequent Dividend Increase (%) +6.3% (Increased in subsequent quarter after close) +8.4% (Increased in subsequent quarter after close) No Change (Pre-IPO) No Change No Change +7.1% (Increased in subsequent quarter after close) No Change Source: Company filings, Wall Street Research 16


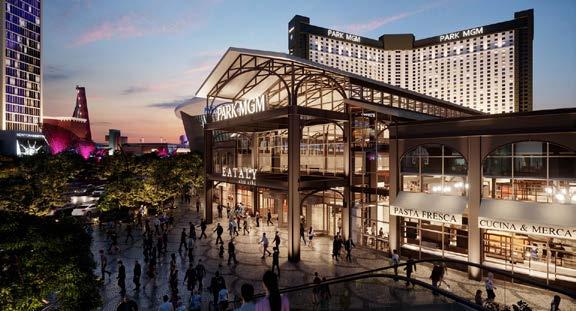
18 Park MGM Transformation Enhancing asset quality in MGP portfolio Project Highlights Front Entrance Rendering Project Cost: ~$550 million Opening Date: In phases through 2018 Park MGM brand expected to have ~2,600 rooms NoMad brand expected to have ~300 rooms Leveraging existing 5,200 seat Park Theater to further cement the area as an entertainment hub Renovations include ~77,000 square feet of meeting space 15+ New restaurants, bars and lounges Partnership with New York-based Sydell Group New Completed Lobby New F&B Bavette s Steakhouse New Room Product Source: MGM Resorts International public filings New F&B Primrose 17


 Includes Poker Tables.")
19 Right of First Offer Asset MGM Springfield Project Highlights Project Cost: ~$960 million Opening Date: August 24, 2018 Location: 14 acres of land in downtown Springfield, MA Casino with approximately 2,500 slots and 120 tables (1) Hotel with 250 rooms 110,000 square feet of retail and dining Rendering NY VT NH 3,500 space parking garage Albany Rivers Mohawk MA Everett Wynn Boston Meeting & Event Space: 46,000 square feet PA Hartford CT Springfield RI Mohegan Sun Plainridge Park Twin River Providence Newport Grand Foxwoods Rendering Source: MGM Resorts International public filings (1) Includes Poker Tables. NJ New York Other Casino Properties Planned Casino Projects 18
20 Highly Visible Growth Path & Strategy Organic Growth ~$0.21 (1) of AFFO/unit from contractual rent growth over 5 years ROFO Property MGM Springfield opening on August 24, 2018 ROFO on potential future Empire City Development MGM Wholly Owned, Joint Ventures & Add-ons Add-ons: Park Theater, Park MGM (Monte Carlo re-development) Wholly Owned: Bellagio, MGM Grand and Circus Circus Joint Ventures: CityCenter and T-Mobile Arena Asset & Tenant Diversification ~57 Target Gaming Properties across 20+ different owners Numerous other attractive net lease acquisitions in leisure, entertainment, hospitality and related sectors +$56 million through YE 2021 National Harbor +$95mm of Rent Wholly Owned & Joint Venture Total Potential Rent: ~$671 million (2) Gaming Properties potential rent of ~$2.3 billion (3) Hard Rock Rocksino Empire City (1) ~266.0 million units outstanding as 3/31/2018. (2) Based on 2.0x rent coverage on LTM Adjusted EBITDA reported by MGM related to the Bellagio, MGM Grand Las Vegas, Circus Circus Las Vegas and CityCenter Holdings, LLC (excluding Crystals and Mandarin Oriental) as of 3/31/18 ($517, $361, $69 and $396 million, respectively, totaling ~$1.343 billion, 12 months ended 3/31/2018). (3) Based on 2.0x rent coverage on estimated total EBITDA of target gaming opportunity universe. 19
 $2,000 $1,813 $1,500 $1,000 $500 $270 $1,050 $500 $350 Equity Value 67% Fixed Rate 26%")
 1Q'18 Net Debt / Annualized Adjusted")
 600 Total Liquidity $880 Source: Company")

21 Conservative Balance Sheet with Flexibility to Grow Debt Maturity Profile ($mm) as of 1Q 2018 Capital Structure (1) $2,000 $1,813 $1,500 $1,000 $500 $270 $1,050 $500 $350 Equity Value 67% Fixed Rate 26% Floating Rate 7% $0 Liquidity & Capitalization ($mm) as of 1Q 2018 Total Debt as of 1Q'18 $3,983 Total Equity Value 7,920 Total Capitalization $11,903 Credit Ratios (2) 1Q'18 Net Debt / Annualized Adjusted EBITDA 5.0x Annualized Adjusted EBITDA / Cash Interest 4.1x Total Cash Balance $280 Total Revolver Capacity ($0 Drawn) 600 Total Liquidity $880 Source: Company filings, FactSet as of 6/1/2018 (1) Fixed rate debt includes $1.2 billion of notional amount swapped to fixed; share price as of 6/1/2018. (2) Please refer to appendix page 23 for reconciliation of Annualized Adjusted EBITDA & Annualized Cash Interest. 20
22 Superior Portfolio and Growth Secure Stable Rent 4.0x Rent Coverage Ratio (1) MGM Corporate Guarantee - Tenant Financial Performance Disclosed No Near Term Annual Lease Expirations Built-In Growth 1.8%+ Annual Increases Fixed through 2022 (2) Embedded Growth Pipeline through ROFO and other MGM Assets Proven Track Record 17.5% Dividend Growth Since IPO >$4 Billion of Announced Acquisitions since IPO Superior Value $12.7 Billion Book Value of Real Estate (3) 5.6% Dividend Yield (4) Increased dividend 3 out of the 8 dividends paid to date (1) Please refer to appendix page 24 for detail on Rent Coverage Ratio. (2) Based on 2.0% annual escalator on fixed rent (90% of total rent), compounded through (3) As of 12/31/2017 (4) As of share price close on 6/1/
23 Appendix 22
24 Adjusted EBITDA & Cash Interest Expense Reconciliation ($ in thousands) 3 Mo. Ended Reconciliation of Net Income to Adj EBITDA 3/31/2018 Note: All figures reported as of 3/31/2018 Net Income $58,169 Depreciation 68,991 Property transactions, net 4,086 Funds from Operations 131,246 Amortization and write-off of financing costs and cash flow hedges 3,109 Non-cash compensation expense 384 Net effect of straight-line rent & amortization of deferred revenue 1,696 Acquisition-related expenses 541 Amortization of above market lease, net 171 Provision for income taxes 1,231 Other non-operating expenses 2,184 Adjusted Funds from Operations $140,562 Interest Income (1,032) Interest Expense 49,230 Amortization of financing costs (3,109) Adjusted EBITDA $185,651 Annualized Adjusted EBITDA $742,604 Interest Expense 49,230 Less: Amortization of Financing Costs (3,109) Less: Interest Income (1,032) Cash Interest Expense $45,089 Annualized Cash Interest Expense $180,356 23
25 Calculation of MGM Rent Coverage Ratio Rent Coverage FY2017 Actuals ($ in 000s) Adjusted EBITDA Related to: 2017 Ownership % Pro Rata Share Domestic Resorts $2,514, % $2,514,819 Management & Other Operations 27, % 27,737 (1) Corporate (Excluding Stock-Based Compensation) (326,036) % (326,036) Total Wholly-Owned $2,216,520 Joint Ventures (2) CityCenter $419, % $209,874 (2) MGM China 524, % 293,711 Total Wholly-Owned + Joint Ventures $2,720,105 (3) Rent Paid to MGM Growth Properties $681,503 Rent Coverage Ratio 4.0x Source: MGM Resorts International filings. Note: Management has determined to present a new calculation of rent coverage in its presentations beginning with the fiscal year ended December 31, 2017 that includes MGM Resorts share of the Adjusted EBITDA reported by its joint ventures based on MGM Resorts ownership in such entity, instead of its historic presentation which was calculating using actual dividends received from such entities. Management believes that this presentation is more useful to investors since dividend amounts are difficult to predict and may result in material year over year deviations whereas MGM Resorts share of Adjusted EBITDA reported results would result in a more predictable measure of the value of these entities to MGM Resorts. Management believes this presentation will be useful to investors to evaluate the financial strength of MGM Resorts, which is the Company s sole tenant. However, the ability of MGM Resorts to access the cash of these joint venture entities in limited by the laws of the respective jurisdictions of organization, the willingness and ability of the boards of these entities to declare dividends and other contractual restrictions. As a result, investors should not put undue reliance on this measure as an indicator of the tenant s ability to pay rent under the master lease. For a description of our historic corporate rent coverage ratio and related calculations see slide 25. (1) Includes MGP general & administrative expense. (2) For a reconciliation of CityCenter and MGM China Adjusted EBITDA please see MGM Resorts earnings releases which have been filed with the SEC and are available on MGM Resorts website. (3) Cash rent paid to MGP by MGM under the master lease, 12 months ended 12/31/
26 Calculation of MGM Historical Corporate Rent Coverage Ratio (1)(2) ($ in 000s) Year Ended December 31, Adjusted EBITDA Related to: Domestic Resorts $1,901,031 $1,343,562 $1,165,413 $1,298,116 $1,325,220 $1,442,686 $1,518,307 $1,689,966 $2,063,016 Management & Other Operations 16,894 18,322 (12,158) 287 9,947 25,777 35,984 37,419 13,000 Corporate (Excluding Stock-Based Compensation) (95,862) (131,142) (109,911) (156,086) (215,757) (200,708) (220,664) (254,104) (283,727) Subtotal $1,822,063 $1,230,742 $1,043,344 $1,142,317 $1,119,410 $1,267,755 $1,333,627 $1,473,281 $1,792,289 Dividends & distributions received by MGM CityCenter $200,000 $540,000 MGM China ,355 30, , , , ,159 52,902 Grand Victoria 41,125 33,750 33,500 30,000 22,000 16,275 15,450 16,850 14,250 Borgata 19,579 60, , ,094 2,654 Subtotal $60,704 $93,886 $339,277 $60,513 $225,886 $328,500 $405,189 $535,103 $609,806 Total Adj. EBITDA & Div. & Dist. $1,882,767 $1,324,628 $1,382,621 $1,202,830 $1,345,296 $1,596,255 $1,738,816 $2,008,384 $2,402,095 Corporate Rent Coverage Ratio 3.4x 2.4x 2.5x 2.2x 2.4x 2.9x 3.2x 3.7x 4.1x (1) MGM s historical corporate rent coverage ratio is calculated by dividing (a) the sum of Adjusted EBITDA as reported by MGM related to domestic resorts, management and other operations, and corporate (excluding stockbased compensation), plus dividends and distributions received by MGM from CityCenter, Borgata, Grand Victoria and MGM China, by (b) either (i) for all periods up to and including the year ended December 31, 2015, year one rent under the Master Lease of $550.0 million, or (ii) for the year ended December 31, 2016, rent under the Master Lease of $591.7 million, which reflects year one rent under the Master Lease of $550.0 million prorated for the period prior to the Borgata Transaction, and $650.0 million prorated for the remainder of the lease year following the closing of the Borgata Transaction on August 1, For a calculation of MGM s historical corporate rent coverage ratio, see Annex II Calculation of MGM Historical Corporate Rent Coverage Ratio. We use MGM s historical corporate rent coverage ratio to illustrate our Tenant s ability to meet its obligations under the Master Lease. The numerator to the calculation of MGM s historical corporate rent coverage ratio for the year ended December 31, 2016 shown above includes Adjusted Property EBITDA with respect to MGM National Harbor following its opening on December 8, 2016 and Adjusted Property EBITDA with respect to Borgata following its acquisition on August 1, However, the denominator to the calculation of the ratio shown above does not reflect what the rent would have been under the Master Lease had MGM National Harbor been subject to the Master Lease following its opening on December 8, In addition, the ratio shown above does not reflect what the historical corporate rent coverage ratio would have been had Borgata and MGM National Harbor been included in MGM s operating results (and, in the case of MGM National Harbor, had it been fully stabilized) and had such properties been subject to the Master Lease for the entire period presented. On August 1, 2016, Borgata was added to the existing Master Lease between the Landlord and the Tenant. As a result, the initial annual rent amount under the Master Lease increased by $100.0 million to $650.0 million, prorated for the remainder of the first lease year. Furthermore, post the closing of the National Harbor transaction, the Master Lease was amended to include MGM National Harbor, increasing the annual rent amount under the Master Lease by $95.0 million to $756.7 million, prorated for the remainder of the lease year. The calculation of MGM s historical corporate rent coverage ratio shown above does not include the impact of the MGM National Harbor Transaction. As noted on Slide 24 in this presentation, the corporate rent coverage ratio has not been updated for the fiscal year ended December 31, 2017 since management has determined to use an alternative calculation of rent coverage going forward. (2) The numerator to the calculation of MGM s historical corporate rent coverage ratio includes $60.7 million, $93.9 million, $339.3 million, $60.5 million, $225.9 million, $328.5 million, $405.2 million, $535.1 million and $609.8 million of special and ordinary dividends and other cash distributions actually received by MGM from CityCenter, Borgata, Grand Victoria and MGM China for the years ended December 31, 2008, 2009, 2010, 2011, 2012, 2013, 2014, 2015 and 2016, respectively. Dividends and distributions are made at the discretion of each relevant entity s board of directors or similar body, and depend on several factors, including financial position, results of operations, cash flows, capital requirements, debt covenants, and applicable law, among others. Accordingly, historical dividends and distributions may not be indicative of future dividends or distributions and should not be relied upon as an indicator of MGM s historical corporate rent coverage ratio for future periods. In addition, as described in note (1) above, Borgata was acquired by MGM on August 1, The historic dividends and distributions related to Borgata have not been adjusted as a result of the Borgata Transaction. MGM s corporate rent coverage ratio excluding dividends and distributions received by MGM from CityCenter, Borgata, Grand Victoria and MGM China was 3.3x, 2.2x, 1.9x, 2.1x, 2.0x, 2.3x, 2.4x, 2.7x and 3.0x for the years ended December 31, 2008, 2009, 2010, 2011, 2012, 2013, 2014, 2015 and 2016, respectively. Since the 2008 recession, the lowest annual MGM corporate rent coverage ratio (excluding dividends and distributions received by MGM from CityCenter, Borgata, Grand Victoria and MGM China) was 1.9x. 25
27 Detailed Footnotes (1) MGM Growth Properties based on calculations per page 24; Gaming & Leisure Properties based on blended property EBITDAR rent coverage before lease payments; VICI Properties based on EBITDAR / LTM rent per Company filings 2/2018; Realty Income based on average Median EBITDAR / Rent Ratio on Retail properties per Company filings: Based on the analysis of the most recently provided information from retail tenants that provide such information. We (Realty Income) do not independently verify the information we receive from our retail tenants ; National Retail Properties based on top 13 tenants average rent coverage with Corporate Overhead per Company filings; STOR based on Median unit level fixed charge coverage, Company defined. (2) % of Rent w/ Unit-Level financials defined as % of rent with tenants that have publicly filed per-unit or per-property financials ( financials defined as at a minimum, disclosure of Net Revenue & EBITDA OR Adjusted EBITDA). % of Rent w/ Corporate-Level financials defined as % of rent with tenants that have publicly filed corporate financials, AND the total of which, is reported by each respective REIT in regular filings. MGP s tenant, MGM Resorts International, publicly discloses financials on 100% of MGM Growth Properties assets, on a per property basis & on a corporate basis; Gaming & Leisure Properties based on 98% of rent from tenants with public corporate financials, Penn National & Boyd Gaming per property-level financials not reported by tenants in most recent filings; VICI Properties tenant, Caesars Entertainment, publicly discloses 100% of corporate financials per property-level financials not reported by tenant in most recent filings; National Retail Properties based on % of tenant corporate financials per Company filings and % of property level financial information per Company filings. (3) MGM Growth Properties based on fixed annual rent escalator; Store Capital based on 68% of Base Rent & Interest subject to weighted average annual escalation rate on annual basis of 1.8% per Company filings; Realty Income based on Same Store Rental Revenue growth 12 months ended 12/31/2017 vs. 12/31/2016 per Company filings; National Retail Properties based on same store rental income (cash basis) year ended 12/31/2017 vs. 12/31/2016; VICI Properties based on 1 year forward annual escalators per Company filings 0% on $465 million initial rent for Non-CPLV & Joliet, assumed 2% on $165 million of initial rent for Caesars Palace Las Vegas and 1% on $87 million for Harrah s Las Vegas. (4) Net Acquisition defined as acquisition volume less disposition volume. MGP, Gaming & Leisure Properties, VICI Properties, Realty Income & National Retail Properties based on total acquisitions less total dispositions per Company filings; EPR Properties based on acquisitions and investments in mortgage notes only and excludes development/redevelopment, dispositions based on net proceeds from sale of properties & excludes mortgage note payoffs; Store Capital based on total investment activity for year-end 2017, dispositions based on total proceeds from dispositions, including loan repayments received in conjunction with certain property sales per Company filings. (5) National Retail properties based on annualized quarterly dividends paid to shareholders of record on the last record date in 2017 vs. annualized quarterly dividends paid to shareholders of record on the last record date in 2016; Realty Income based on Common Dividend paid per Share through year end 2017 vs per Company filings; EPR Properties based on annualized dividend paid to shareholders of record on December 29, 2017 vs. prior year per Company filing on 12/17/2017; Store Capital based on annualized quarterly dividends paid to shareholders of record on the last record date in 2017 vs. annualized quarterly dividends paid to shareholders of record on the last record date in 2016; Gaming & Leisure Properties based on annualized quarterly dividends paid to shareholders of record on the last record date in 2017 vs. annualized quarterly dividends paid to shareholders of record on the last record date in (6) Calculated as most recently announced dividend annualized / share price as of 6/1/
Forward-Looking Statements Statements in this presentation that are not historical facts are "forward-looking" statements and "safe harbor
 2017 Annual Meeting of Shareholders Presentation May 2017 Forward-Looking Statements Statements in this presentation that are not historical facts are "forward-looking" statements and "safe harbor statements"
Market and Industry Data
 Investor Presentation March 2018 Forward-Looking Statements Statements in this presentation that are not historical facts are "forward-looking" statements and "safe harbor statements" within the meaning
Forward-Looking Statements Statements in this presentation that are not historical facts are "forward-looking" statements and "safe harbor
 Investor Presentation November 2018 Forward-Looking Statements Statements in this presentation that are not historical facts are "forward-looking" statements and "safe harbor statements" within the meaning
Forward-Looking Statements Statements in this presentation that are not historical facts are "forward-looking" statements and "safe harbor
 Investor Presentation November 2017 Forward-Looking Statements Statements in this presentation that are not historical facts are "forward-looking" statements and "safe harbor statements" within the meaning
MGM GROWTH PROPERTIES LLC Second Quarter 2016 Earnings Presentation
 MGM GROWTH PROPERTIES LLC Second Quarter 06 Earnings Presentation August 4, 06 Forward-Looking Statements Statements in this presentation that are not historical facts are "forward-looking" statements
Wells Fargo Net Lease REIT Forum 2016
 Wells Fargo Net Lease REIT Forum 2016 September 2016 Forward-Looking Statements Statements in this presentation that are not historical facts are "forward-looking" statements and "safe harbor statements"
Investor Presentation
 Investor Presentation December 2016 Forward-Looking Statements Statements in this presentation that are not historical facts are "forward-looking" statements and "safe harbor statements" within the meaning
GAMING INVESTMENT FORUM AT G2E. September 26, 2016
 GAMING INVESTMENT FORUM AT G2E September 26, 2016 Dan D Arrigo EVP & Chief Financial Officer MGM Resorts International MGM RESORTS INTERNATIONAL Strong Domestic Operating Results Las Vegas Trends Maximizing
MGM Resorts International Reports Second Quarter Financial Results
 NEWS RELEASE MGM Resorts International Reports Second Quarter Financial Results 8/5/2014 Consolidated Adjusted EBITDA Increased 8%, Led By 10% Growth In Wholly Owned Domestic Resorts MGM China Declares
BAML 2017 Japan Conference The Opportunity For Integrated Resorts In Japan
 BAML 2017 Japan Conference The Opportunity For Integrated Resorts In Japan September 7, 2017 Jim Murren Chairman and CEO MGM Resorts International AGENDA 1. MGM Resorts Who We Are 2. The Japan Opportunity
MGM Resorts International Reports Strong First Quarter Financial And Operating Results
 NEWS RELEASE MGM Resorts International Reports Strong First Quarter Financial And Operating Results 5/5/2016 Increases Wholly Owned Domestic Resorts Net Revenue and Adjusted Property EBITDA by 3% and 24%
MGM RESORTS INTERNATIONAL Third Quarter 2016 Earnings Presentation
 MGM RESORTS INTERNATIONAL Third Quarter 2016 Earnings Presentation November 7, 2016 Forward-Looking Statements Statements in this presentation that are not historical facts are forward-looking statements,
MGM Resorts International Reports First Quarter Financial And Operating Results
 NEWS RELEASE MGM Resorts International Reports First Quarter Financial And Operating Results 4/27/2017 LAS VEGAS, April 27, 2017 /PRNewswire/ -- MGM Resorts International (NYSE: MGM) ("MGM Resorts" or
MGM Resorts International Reports Fourth Quarter And Full Year Financial And Operating Results; Announces Quarterly Dividend
 NEWS RELEASE MGM Resorts International Reports Fourth Quarter And Full Year Financial And Operating Results; Announces Quarterly Dividend 2/16/2017 Increased diluted earnings per share in the fourth quarter
Forward-Looking Statements. Note Regarding Presentation of Non-GAAP Financial Measures
 First Quarter 2016 Earnings Presentation May 5, 2016 Forward-Looking Statements Statements in this presentation that are not historical facts are forward-looking statements, within the meaning of the Private
MGM Resorts International Reports Fourth Quarter and Full Year Results
 NEWS RELEASE MGM Resorts International Reports Fourth Quarter and Full Year Results 2/14/2011 LAS VEGAS, Feb. 14, 2011 /PRNewswire-FirstCall/ -- MGM Resorts International (NYSE: MGM) today announced a
Investor Conference April 2016
 Investor Conference April 2016 Forward Looking Statements This presentation contains forward-looking statements regarding operating trends, future results of operations and the completion of new projects,
CLSA Asia Investor Forum. January, 2008
 CLSA Asia Investor Forum January, 2008 Forward Looking Statements This presentation contains forward-looking statements regarding operating trends, future results of operations and the completion of new
MGM MIRAGE Reports Record Second Quarter Revenue, Cash Flow and Net Income
 NEWS RELEASE MGM MIRAGE Reports Record Second Quarter Revenue, Cash Flow and Net Income 7/24/2001 PRNewswire LAS VEGAS MGM MIRAGE (NYSE: MGG) today reported earnings of 47 cents per diluted share for the
CLSA Investors Forum 2015 September 2015
 CLSA Investors Forum 2015 September 2015 Forward Looking Statements This presentation contains forward-looking statements regarding operating trends, future results of operations and the completion of
LD Micro Conference June 2017 FULL HOUSE RESORTS 1
 LD Micro Conference June 2017 FULL HOUSE RESORTS 1 Forward-looking Statements / Regulation G This presentation may contain statements that are "forward-looking statements" within the meaning of the safe
MGM RESORTS INTERNATIONAL REPORTS SECOND QUARTER FINANCIAL AND OPERATING RESULTS
 Exhibit 99.1 MGM RESORTS INTERNATIONAL REPORTS SECOND QUARTER FINANCIAL AND OPERATING RESULTS Las Vegas, Nevada, August 2, 2018 MGM Resorts International (NYSE: MGM) ( MGM Resorts or the Company ) today
MGM Resorts International INVESTOR PRESENTATION
 MGM Resorts International INVESTOR PRESENTATION March 2017 Forward-Looking Statements Statements in this presentation that are not historical facts are forward-looking statements, within the meaning of
MGM MIRAGE Reports Record First Quarter Results
 NEWS RELEASE MGM MIRAGE Reports Record First Quarter Results 5/3/2007 PRNewswire-FirstCall LAS VEGAS MGM MIRAGE (NYSE: MGM) today reported its first quarter 2007 financial results, achieving the Company's
MGM MIRAGE Reports Fourth Quarter and Full Year Financial Results
 NEWS RELEASE MGM MIRAGE Reports Fourth Quarter and Full Year Financial Results 2/18/2010 CityCenter Opens to Rave Reviews Convention Booking Pace Continues to Strengthen PRNewswire-FirstCall LAS VEGAS
Q3 HIGHLIGHTS. Strong High End Table Games Volume Baccarat Volume Up 22%
 what if Q3 HIGHLIGHTS Net Revenues up 5% to $1.9 Billion 5% Increase in Gaming Revenues Strong High End Table Games Volume Baccarat Volume Up 22% Slot Revenue Up 5% Hotel Revenues Grew 3% - Led by a 6%
MGM Resorts International (Exact name of registrant as specified in its charter)
") UNITED STATES SECURITIES AND EXCHANGE COMMISSION Washington, D.C. 20549 FORM 8-K CURRENT REPORT PURSUANT TO SECTION 13 OR 15(d) OF THE SECURITIES EXCHANGE ACT OF 1934 Date of report (Date of earliest event
UNITED STATES SECURITIES AND EXCHANGE COMMISSION Washington, D.C. 20549 FORM 8-K CURRENT REPORT PURSUANT TO SECTION 13 OR 15(d) OF THE SECURITIES EXCHANGE ACT OF 1934 Date of report (Date of earliest event
MGM RESORTS INTERNATIONAL 4Q and FY 2016 Earnings Presentation
 MGM RESORTS INTERNATIONAL 4Q and FY 2016 Earnings Presentation February 16, 2017 Forward-Looking Statements Statements in this presentation that are not historical facts are forward-looking statements,
Copa Holdings Reports Record Earnings of US$41.8 Million for 4Q06 and US$134.2 Million for Full Year 2006
 Copa Holdings Reports Record Earnings of US$41.8 Million for 4Q06 and US$134.2 Million for Full Year 2006 Panama City, Panama --- March 7, 2007. Copa Holdings, S.A. (NYSE: CPA), parent company of Copa
Q2 Financial Results Before One-Time Charges
 Q2 Highlights Generated Record Net Revenues of $1.7 Billion, Up 60% Same-Store Net Revenues were $1.2 Billion, Up 11% Over 2004 Produced Record Property-Level EBITDA of $567 Million Same-Store Property-Level
Gaming Investment Forum September 2014
 Gaming Investment Forum September 2014 Forward Looking Statements This presentation contains forward-looking statements regarding operating trends, future results of operations and the completion of new
Nomura Investor Forum December 2014
 Nomura Investor Forum December 2014 Forward Looking Statements This presentation contains forward-looking statements regarding operating trends, future results of operations and the completion of new projects,
Investor Presentation
 MGM Resorts International Investor Presentation The MGM Resorts Investment Case July 27, 2017 Forward-Looking Statements Statements in this presentation that are not historical facts are forward-looking
MGM MIRAGE Reports Second Quarter Results
 NEWS RELEASE MGM MIRAGE Reports Second Quarter Results 8/5/2008 PRNewswire-FirstCall LAS VEGAS MGM MIRAGE (NYSE: MGM) today reported its second quarter 2008 financial results. The Company achieved 97%
Management Presentation. March 2016
 Management Presentation March 2016 Forward looking statements This presentation as well as oral statements made by officers or directors of Allegiant Travel Company, its advisors and affiliates (collectively
MGM MIRAGE Reports Record Third Quarter Revenue, Cash Flow, and Net Income
 NEWS RELEASE MGM MIRAGE Reports Record Third Quarter Revenue, Cash Flow, and Net Income 10/18/2000 PRNewswire LAS VEGAS MGM MIRAGE (NYSE: MGG) today reported earnings of 42 cents per diluted share for
CONTACT: Investor Relations Corporate Communications
 NEWS RELEASE CONTACT: Investor Relations Corporate Communications 435.634.3200 435.634.3553 Investor.relations@skywest.com corporate.communications@skywest.com SkyWest, Inc. Announces Second Quarter 2017
AIR CANADA REPORTS 2010 THIRD QUARTER RESULTS; Operating Income improved $259 million or 381 per cent from previous year s quarter
 AIR CANADA REPORTS 2010 THIRD QUARTER RESULTS; Operating Income improved $259 million or 381 per cent from previous year s quarter MONTRÉAL, November 4, 2010 Air Canada today reported operating income
ABX. Holdings, Inc. BB&T Transportation Conference. February 2008
 ABX Holdings, Inc. BB&T Transportation Conference February 2008 1 Safe Harbor Statement Except for historical information contained herein, the matters discussed in this presentation contain forward-looking
Forward Looking Statements
 October 2, 2012 Forward Looking Statements Certain information in this presentation may be considered forward-looking information within the meaning of the Private Securities Litigation Reform Act of 1995.
CONTACT: Investor Relations Corporate Communications
 NEWS RELEASE CONTACT: Investor Relations Corporate Communications 435.634.3200 435.634.3553 Investor.relations@skywest.com corporate.communications@skywest.com SkyWest, Inc. Announces Fourth Quarter 2017
Spirit Airlines Reports Fourth Quarter and Full Year 2016 Results
 Spirit Airlines Reports Fourth Quarter and Full Year 2016 Results MIRAMAR, FL. (February 7, 2017) - Spirit Airlines, Inc. (NASDAQ: SAVE) today reported fourth quarter and full year 2016 financial results.
Management Presentation. November 2018
 Management Presentation November 2018 Forward looking statements This presentation as well as oral statements made by officers or directors of Allegiant Travel Company, its advisors and affiliates (collectively
MIRAMAR, Fla., April 29, 2015 (GLOBE NEWSWIRE) -- Spirit Airlines, Inc. (Nasdaq:SAVE) today reported first quarter 2015 financial results.
 -- Spirit Airlines, Inc. (Nasdaq:SAVE) today reported first quarter 2015 financial results.") April 29, 2015 Spirit Airlines Announces First Quarter 2015 Results; Adjusted Net Income Increases 87.1 Percent to $70.7 Million and Pre-Tax Margin Increases 900 Basis Points to 22.7 Percent MIRAMAR, Fla.,
April 29, 2015 Spirit Airlines Announces First Quarter 2015 Results; Adjusted Net Income Increases 87.1 Percent to $70.7 Million and Pre-Tax Margin Increases 900 Basis Points to 22.7 Percent MIRAMAR, Fla.,
Spirit Airlines Reports First Quarter 2017 Results
 Spirit Airlines Reports First Quarter 2017 Results MIRAMAR, Fla., April 28, 2017 - Spirit Airlines, Inc. (NASDAQ: SAVE) today reported first quarter 2017 financial results. GAAP net income for the first
2014 J.P. Morgan Global High Yield & Leveraged Finance Conference February 26, 2014
 2014 J.P. Morgan Global High Yield & Leveraged Finance Conference February 26, 2014 MTGA Overview MTGA: Premier Tribal Gaming Operator High Quality Built to Last Gaming Assets Leading Market Share/Fair
MARRIOTT INTERNATIONAL, INC. PRESS RELEASE SCHEDULES QUARTER 4, 2016 TABLE OF CONTENTS
 PRESS RELEASE SCHEDULES QUARTER 4, 06 TABLE OF CONTENTS Consolidated Statements of Income - As Reported A- Consolidated Statements of Income - Fourth Quarter Adjusted 06 Compared to Combined 05 A-3 Consolidated
OPERATING AND FINANCIAL HIGHLIGHTS. Subsequent Events
 Copa Holdings Reports Net Income of $103.8 million and EPS of $2.45 for the Third Quarter of 2017 Excluding special items, adjusted net income came in at $100.8 million, or EPS of $2.38 per share Panama
AAGI AAGI: APPLIED ANALYSIS GAMING INDEX JUNE Operators. Manufacturers. Composite
 '98 '99 '00 '01 '02 '03 '04 '05 '06 '07 '08 '09 '10 '11 '12 '13 AAGI Operators Manufacturers Composite Stock Price - Daily Average Prior Period Prior Year Contribution Jun-13 May-13 Jun-12 % Change % Change
CONTACT: Investor Relations Corporate Communications
 NEWS RELEASE CONTACT: Investor Relations Corporate Communications 435.634.3200 435.634.3553 Investor.relations@skywest.com corporate.communications@skywest.com SkyWest, Inc. Announces Second Quarter 2016
ABX HOLDINGS, INC. Shareholders Meeting. May 13, 2008
 Shareholders Meeting May 13, 2008 1 1 1 Safe Harbor Statement Except for historical information contained herein, the matters discussed in this presentation contain forward-looking statements that involve
FORWARD LOOKING STATEMENTS
 MARCH 2007 FORWARD LOOKING STATEMENTS This presentation contains statements regarding operating trends, future results, new projects, and other market, business and property trends that are forward-looking.
SkyWest, Inc. Announces First Quarter 2018 Profit
 NEWS RELEASE CONTACT: Investor Relations Corporate Communications 435.634.3200 435.634.3553 Investor.relations@skywest.com corporate.communications@skywest.com SkyWest, Inc. Announces First Quarter 2018
Management Presentation. November 2011
 Management Presentation November 2011 Forward looking statements This presentation as well as oral statements made by officers or directors of Allegiant Travel Company, its advisors and affiliates (collectively
Management Presentation. September 2011
 Management Presentation September 2011 Forward looking statements This presentation as well as oral statements made by officers or directors of Allegiant Travel Company, its advisors and affiliates (collectively
Full House Resorts. Investor Presentation December 2018
 Full House Resorts Investor Presentation December 2018 Forward-looking Statements & Regulation G 2 This presentation may contain statements that are "forward-looking statements" within the meaning of the
Spirit Airlines Reports First Quarter 2018 Results
 Spirit Airlines Reports First Quarter 2018 Results MIRAMAR, Fla., April 26, 2018 - Spirit Airlines, Inc. (NYSE: SAVE) today reported first quarter 2018 financial results. For the first quarter 2018, Spirit
Crown Resorts Limited
 Crown Resorts Limited 2015 Full Year Results Presentation 13 August 2015 1 Crown Resorts Limited Results Overview Crown Resorts Limited (Crown) performance: Overall, the results for Crown s portfolio of
Copa Holdings Reports Net Income of $49.9 million and EPS of $1.18 for the Second Quarter of 2018
 Copa Holdings Reports Net Income of $49.9 million and EPS of $1.18 for the Second Quarter of 2018 Panama City, Panama --- Aug 8, 2018. Copa Holdings, S.A. (NYSE: CPA), today announced financial results
INVESTOR PRESENTATION. Imperial Capital Global Opportunities Conference September 2015
 INVESTOR PRESENTATION Imperial Capital Global Opportunities Conference September 2015 Forward-looking Statements This presentation contains forward-looking statements within the meaning of the Private
Investor Relations Update January 25, 2018
 General Overview Investor Relations Update Accounting Changes On January 1, 2018, the company adopted two new Accounting Standard Updates: (ASUs): ASU 2014-9: Revenue from Contracts with Customers (the
Spirit Airlines Reports Third Quarter 2017 Results
 Spirit Airlines Reports Third Quarter 2017 Results MIRAMAR, Fla., October 26, 2017 - Spirit Airlines, Inc. (NASDAQ: SAVE) today reported third quarter 2017 financial results. GAAP net income for the third
Cowen 11 th Annual Global Transportation Conference
 Cowen 11 th Annual Global Transportation Conference September 5, 2018 Disclaimer This presentation contains forward-looking statements within the meaning of Section 27A of the Securities Act of 1933, as
ISI Group Annual Conference February 15, 2011
 ISI Group Annual Conference February 15, 2011 CURRENT LAS VEGAS MARKET TRENDS (Full Year 2010) Visitation Up 2.7% Las Vegas Strip Gaming Revenues Up 4.1% Airline Passengers Down 1.8% Auto Traffic Up 3.1%
Great Portland Estates Trading Update Strong Operational Performance
 Press Release 6 July 2017 Great Portland Estates Trading Update Strong Operational Performance Great Portland Estates plc ( GPE ) today publishes its trading update for the quarter to 30 June 2017. Continued
Analyst and Investor Conference Call Q Ulrik Svensson, CFO and Member of the Executive Board
 Analyst and Investor Conference Call Q2 2017 Ulrik Svensson, CFO and Member of the Executive Board Frankfurt, 2 August 2017 Disclaimer The information herein is based on publicly available information.
E190 REPLACEMENT & FLEET UPDATE JULY 11, 2018
 1 E190 REPLACEMENT & FLEET UPDATE JULY 11, 2018 SAFE HARBOR This presentation contains forward-looking statements within the meaning of the Private Securities Litigation Reform Act of 1995, Section 27A
Fourth Quarter 2015 Financial Results
 Fourth Quarter 2015 Financial Results AerCap Holdings N.V. February 23, 2016 Disclaimer Incl. Forward Looking Statements & Safe Harbor This presentation contains certain statements, estimates and forecasts
44th Consecutive Profitable Quarter Fourth Quarter Fully Diluted Earnings per Share of $0.94 Full Year Fully Diluted Earnings per Share of $4.
 Allegiant Travel Company Fourth Quarter and Full Year 2013 Financial Results January 29, 2014 1:00 PM PT 44th Consecutive Profitable Quarter Fourth Quarter Fully Diluted Earnings per Share of $0.94 Full
Spirit Airlines Reports Second Quarter 2018 Results
 Spirit Airlines Reports Second Quarter 2018 Results MIRAMAR, Fla., July 25, 2018 - Spirit Airlines, Inc. (NYSE: SAVE) today reported second quarter 2018 financial results. GAAP net income for the second
Management Presentation. May 2013
 Management Presentation May 2013 Forward looking statements This presentation as well as oral statements made by officers or directors of Allegiant Travel Company, its advisors and affiliates (collectively
10TH ANNUAL WOLFE RESEARCH GLOBAL TRANSPORTATION CONFERENCE MAY 23, 2017
 1 10TH ANNUAL WOLFE RESEARCH GLOBAL TRANSPORTATION CONFERENCE MAY 23, 2017 SAFE HARBOR This presentation contains forward-looking statements within the meaning of the Private Securities Litigation Reform
Copa Holdings Reports Net Income of $136.5 million and EPS of $3.22 for the First Quarter of 2018
 Copa Holdings Reports Net Income of $136.5 million and EPS of $3.22 for the First Quarter of 2018 May 9, 2018 PANAMA CITY, May 9, 2018 /PRNewswire/ -- Copa Holdings, S.A. (NYSE: CPA), today announced financial
American Airlines Group Inc.
 American Airlines Group Inc. Bank of America Merrill Lynch 2018 Transportation Conference Derek Kerr Chief Financial Officer Cautionary Statement Regarding Forward-Looking Statements and Information This
Spirit Airlines Reports Third Quarter 2015 Pre-Tax Margin of 26.9 Percent
 October 27, 2015 Spirit Airlines Reports Third Quarter 2015 Pre-Tax Margin of 26.9 Percent MIRAMAR, Fla., Oct. 27, 2015 (GLOBE NEWSWIRE) -- Spirit Airlines, Inc. (NASDAQ:SAVE) today reported third quarter
First Quarter Results August 31 st, 2006
 First Quarter Results 2006-07 August 31 st, 2006 Key features of the First Quarter Market context Sustained global economic growth, and a recovery in Europe Average jet fuel price of 691 $/t, up 25% year-on-year
American Airlines Group Reports Second-Quarter Profit
 NEWS RELEASE American Airlines Group Reports Second-Quarter Profit 7/28/2017 FORT WORTH, Texas American Airlines Group Inc. (NASDAQ:AAL) today reported its second-quarter 2017 results, including these
Morgan Stanley Asia Pacific Conference November 2014
 Morgan Stanley Asia Pacific Conference November 2014 Forward Looking Statements This presentation contains forward-looking statements regarding operating trends, future results of operations and the completion
Penn National Gaming. Tim Wilmott, President & COO
 Penn National Gaming Tim Wilmott, President & COO East Coast Gaming Congress - May 24, 2011 Who is Penn National Gaming? Largest publicly traded regional gaming operator in the U.S., featuring a $3 billion
Crown Resorts Limited
 Crown Resorts Limited 2016 Half Year Results Presentation 25 February 2016 1 Crown Resorts Limited Results Overview Crown Resorts Limited (Crown) performance: The 2016 First Half results across Crown s
Spirit Overview & 2016 Priorities
 March 2016 Disclaimer Statements in this release and certain oral statements made from time to time by representatives of the Company contain various forward-looking statements within the meaning of Section
OPERATING AND FINANCIAL HIGHLIGHTS
 Copa Holdings Reports Financial Results for the Fourth Quarter of 2015 Excluding special items, adjusted net income came in at $31.7 million, or EPS of $0.73 per share Panama City, Panama --- February
Bank of America Merrill Lynch Global Transportation Conference. June 16, 2010
 Bank of America Merrill Lynch Global Transportation Conference June 16, 2010 FORWARD-LOOKING STATEMENT Certain information in this presentation and statements made during this presentation, including any
Parques Reunidos Corporate Presentation March 2016
 Parques Reunidos Corporate Presentation March 216 Disclaimer The information contained in this presentation (the Presentation ), including but not limited to forward-looking statements, is provided as
OPERATING AND FINANCIAL HIGHLIGHTS
 Copa Holdings Reports Financial Results for the Fourth Quarter of 2018 Excluding special items, adjusted net profit came in at $44.0 million, or Adjusted EPS of $1.04 Panama City, Panama --- February 13,
Investor Update September 2017 PARTNER OF CHOICE EMPLOYER OF CHOICE INVESTMENT OF CHOICE
 Investor Update September 2017 PARTNER OF CHOICE EMPLOYER OF CHOICE INVESTMENT OF CHOICE 1 Forward Looking Statements In addition to historical information, this presentation contains forward-looking statements
Delta Air Lines Reports June 2009 Quarter Financial Results
 CONTACT: Investor Relations 404-715-2170 Corporate Communications 404-715-2554 Delta Air Lines Reports June 2009 Quarter Financial Results ATLANTA, July 22, 2009 Delta Air Lines (NYSE:DAL) today reported
AIR CANADA REPORTS FULL YEAR AND FOURTH QUARTER 2010 RESULTS
 AIR CANADA REPORTS FULL YEAR AND FOURTH QUARTER 2010 RESULTS Record annual EBITDAR of $1.386 billion, 104 per cent improvement Operating income improvement of $677 million Employees to receive special
Copa Holdings Reports Net Income of $57.7 million and EPS of $1.36 for the Third Quarter of 2018
 Copa Holdings Reports Net Income of $57.7 million and EPS of $1.36 for the Third Quarter of 2018 November 14, 2018 PANAMA CITY, Nov. 14, 2018 /PRNewswire/ -- Copa Holdings, S.A. (NYSE: CPA), today announced
Investor Relations Update October 25, 2018
 General Overview Investor Relations Update Revenue The company expects its fourth quarter total revenue per available seat mile (TRASM) to be up approximately 1.5 to 3.5 percent year-over-year. Fuel Based
Management Presentation. August 2012
 Management Presentation August 2012 Forward looking statements This presentation as well as oral statements made by officers or directors of Allegiant Travel Company, its advisors and affiliates (collectively
WH Smith PLC Acquisition of InMotion providing access to the world s largest travel retail market 30 October 2018
 WH Smith PLC Acquisition of InMotion providing access to the world s largest travel retail market 30 October 2018 Transaction highlights WH Smith announces acquisition of InMotion for $198m ( 155 million)
1Q 2017 EARNINGS PRESENTATION APRIL 25, 2017
 1 1Q 2017 EARNINGS PRESENTATION APRIL 25, 2017 SAFE HARBOR This presentation contains forward-looking statements within the meaning of the Private Securities Litigation Reform Act of 1995, Section 27A
Ramsay Health Care Limited Results Briefing Half Year ended 31 December 2018
 Ramsay Health Care Limited Results Briefing Half Year ended 31 December 2018 Craig McNally, Group Managing Director & Bruce Soden, Group Finance Director 28 February 2019 ramsayhealth.com Agenda Group
Management Presentation. September 2015
 Management Presentation September 2015 Forward looking statements This presentation as well as oral statements made by officers or directors of Allegiant Travel Company, its advisors and affiliates (collectively
The Manager Company Announcements Australian Stock Exchange Limited Sydney NSW Dear Sir. Demerger of BHP Steel
 The Manager Company Announcements Australian Stock Exchange Limited Sydney NSW 2000 Dear Sir Demerger of BHP Steel At the time of the announcement of the creation of the DLC between BHP Limited and Billiton
Deutsche Bank 2011 Leveraged Finance Conference Sarah Rogers - Investor Relations
 Deutsche Bank 2011 Leveraged Finance Conference Sarah Rogers - Investor Relations Las Vegas Indicators Improving (YTD through August 2011) Visitation +5% Average Daily Auto Traffic Flat McCarran Airport
Joe Randell President and Chief Executive Officer Jolene Mahody Executive Vice President and Chief Financial Officer
 Joe Randell President and Chief Executive Officer Jolene Mahody Executive Vice President and Chief Financial Officer Nathalie Megann Vice President, Investor Relations and Corporate Affairs December, 2015
M2 Group Ltd 2014 Interim Results
 M2 Group Ltd 2014 Interim Results 24 February 2014 Geoff Horth, CEO Presentation Content Record Financial Performance Strong Organic Growth FY14 Priorities and Guidance Slide 2, 24 February 2014 Record
2010 ANNUAL GENERAL MEETING. May 4, 2010
 2010 ANNUAL GENERAL MEETING May 4, 2010 FORWARD-LOOKING STATEMENT Certain information in this presentation and statements made during this presentation, including any question and answer session, may contain