MGM Resorts International INVESTOR PRESENTATION
|
|
|
- Clinton Walker
- 6 years ago
- Views:
Transcription

1 MGM Resorts International INVESTOR PRESENTATION March 2017
2 Forward-Looking Statements Statements in this presentation that are not historical facts are forward-looking statements, within the meaning of the Private Securities Litigation Reform Act of 1995 and involve risks and/or uncertainties, including those described in the Company's public filings with the Securities and Exchange Commission. The Company has based forward-looking statements on management s current expectations and assumptions and not on historical facts. Examples of these statements include, but are not limited to, the Company s expectations regarding future results (including RevPAR and other guidance), the payment of any future cash dividends on the Company s common stock and dividends and distributions we expect to receive from MGM China, The MGM Growth Properties Operating Partnership or CityCenter, its ability to generate future cash flow growth and to execute on future development and other projects, amounts the Company expects to spend capital expenditures, and the Company s ability to execute its strategic initiatives, improve its financial flexibility (including its balance sheet) and continue to execute on operational improvements. These forward-looking statements involve a number of risks and uncertainties. Among the important factors that could cause actual results to differ materially from those indicated in such forward-looking statements include effects of economic conditions and market conditions in the markets in which the Company operates and competition with other destination travel locations throughout the United States and the world, the design, timing and costs of expansion projects, risks relating to international operations, permits, licenses, financings, approvals and other contingencies in connection with growth in new or existing jurisdictions and additional risks and uncertainties described in the Company s Form 10-K, Form 10-Q and Form 8-K reports (including all amendments to those reports). In providing forward-looking statements, the Company is not undertaking any duty or obligation to update these statements publicly as a result of new information, future events or otherwise, except as required by law. If the Company updates one or more forward-looking statements, no inference should be drawn that it will make additional updates with respect to those other forward-looking statements. Market and Industry Data This presentation also contains estimates and information concerning the Company s industry and peers, including market position and fair share information, that are based on industry publications, reports and peer company public filings. This information involves a number of assumptions and limitations, and you are cautioned not to rely on or give undue weight to this information. The Company has not independently verified the accuracy or completeness of the data contained in these industry publications, reports or filings. The industry in which we operate is subject to a high degree of uncertainty and risk due to variety of factors, including those described in the Risk Factors section of the Company s public filings with the SEC. Note Regarding Presentation of Non-GAAP Financial Measures The following presentation includes certain non-gaap financial measures as defined in Regulation G under the Securities Exchange Act of 1934, as amended. Schedules that reconcile the non-gaap financial measures to the most directly comparable financial measures calculated and presented in accordance with Generally Accepted Accounting Principles in the United States are included in our earnings releases that have been furnished with the SEC and are available on our website at 1


3 Company Overview Leading Global Gaming & Hospitality Company with Highly Valuable Portfolio Extensively vetted and globally diversified across all high-quality gaming jurisdictions Operates some of the best known international luxury properties in the gaming and lodging industry including Bellagio, MGM Grand Las Vegas, ARIA Resort & Casino, Mandalay Bay, Borgata, MGM National Harbor and MGM Macau Experienced management team and Board of Directors with extensive industry background Dominant leader in food & beverage and conventions & corporate meetings Over 400 owned & leased outlets Over 3 million square feet of convention space World-class entertainment featuring a wide array of venues & shows 21 live entertainment venues, including T-Mobile Arena and Cirque du Soleil Embarking on new growth opportunities worldwide MGM Springfield MGM Cotai MGM Hospitality Fortune 500 company with 77,000 employees and ~$30bn enterprise value Consolidated Net Revenue 1 of $9.5bn and Adjusted EBITDA 1 of $2.8bn 1 As of 12/31/16 2
4 MGM Resorts Organization Structure Public Shareholders MGM Resorts (Stock Exchange: NYSE / Ticker: MGM) Owned & Leased Resorts & Other (100%) MGM Growth Properties REIT (76%) MGM China Holdings Limited (56%) CityCenter Holdings (50%) Las Vegas Arena Company (42.5%) Owned Bellagio, MGM Grand LV, Circus Circus LV, MGM National Harbor, Shadow Creek, Fallen Oak Publicly Traded REIT (1) Stock Exchange: NYSE Ticker: MGP Stock Exchange: HKSE Ticker: 2282 HK Properties: MGM Macau Properties: ARIA Vdara Mandarin Oriental Properties: T-Mobile Arena MGM Grand Garden (Lease) Leased 1 Mandalay Bay, Mirage, Luxor, Excalibur, New York- New York, Monte Carlo, The Park, MGM Grand Detroit, Beau Rivage, Gold Strike Tunica, Borgata Development MGM Springfield (Opening Late 2018) Development MGM Cotai (Opening 2H 2017) Diaoyutai MGM Hospitality (49%) Properties: MGM Grand Sanya Diaoyutai Hotel Hangzhou Diaoyutai Hotel Chengdu Elgin Riverboat Resort (50%) Properties: Grand Victoria Development Bellagio Shanghai (Opening 2017) 3 1 MGM Growth Properties owns the properties leased by MGM Resorts International
5 Strategic Highlights 4
6 Looking Back A Transformative 3 Years MGM has come a long way since 2014 Significantly improved MGM s balance sheet MGP transaction resulted in ~$4bn reduction of debt Sale of Crystals for $1.1bn provided MGM with $540mm dividend from CityCenter Converted $1.45bn of convertible notes to equity Continued MGM China dividends through construction of MGM Cotai Initiated CityCenter dividends Multiple Rating Agency upgrades Operational initiatives Strategic investment in personnel Expanded market share through innovative product and media initiatives Profit Growth Plan initiated program, upsized target, achieved goals ahead of schedule Opened MGM National Harbor, T-Mobile Arena and Park Theater Completed Mandalay Bay Convention Center expansion Strategic initiatives MGP transaction Borgata acquisition with simultaneous sale of real estate to MGP Sale of non-core assets (Crystals, Circus Circus Reno, Railroad Pass & Gold Strike Jean) Increased ownership in MGM China from 51% to 56% 5
7 Progress Since Analyst & Investor Day (June 2016) AGENDA ITEM TOPIC STATUS Growing Our Top Line Las Vegas Market On Track MGM Market Share On Track Operational Excellence PGP Target Up to $400mm On Track EBITDA Margins to 30%+ On Track Marketing in a Digital World Digital Platform On Track Social On Track Mobile Sports App Launched Setting MGM Apart MGM National Harbor Completed (Dec 2016) Park Theater Completed (Dec 2016) Park MGM / NoMad (2017/2018) On Track MGM Springfield (Late 2018) On Track MGM China Holdings MGM Macau Continued Strong Performance MGM Cotai (Q1 2017) 2H 2017 MGM Growth Properties Growth - Borgata Completed (Aug 2016) Premium Valuation On Track Financial Overview Balance Sheet Improvements On Track Strategic Investments MGM National Harbor and Park Theater opened, MGM Cotai (2H 2017) Investment Grade On Track Return Capital to Shareholders Initiated Quarterly Dividend (Feb 2017) Paid First Dividend (Mar 2017) 6
8 MGM Ongoing Initiatives Continued Operational Improvements Focused on growing topline results and continued margin improvement Las Vegas Strip: 1QE 2017 RevPAR growth of 7% Achieved 30% margin in 2016 Strategies in place to grow 2017 margin bps Transition from Profit Growth Plan to Continuous Improvement Disciplined and targeted reinvestment in existing properties Park MGM/ NoMad Convention center expansions (Aria, MGM Grand, Bellagio) Further improvement of Balance Sheet Accelerating free cash flow story current development pipeline winding down Utilize excess free cash flow to pay down debt and return capital to shareholders Obtain investment grade status Strategic Initiatives Potential sale of National Harbor real estate to MGP MGM Cotai in 2 nd half of 2017 MGM Springfield in late 2018 Maximizing future dividends from Joint Ventures Continue to utilize MGP as a platform for growth Selectively pursue new jurisdiction opportunities (Japan) 7
9 Driving Increased Shareholder Value Leading global integrated resort company Large scale portfolio with best-in-class brands Premier operator in the industry Strong One Company culture with focus on continuous improvement Near term accretive growth opportunities Enhanced financial position provides visible path to investment grade Free cash flow profile positions MGM to continue to return capital to its shareholders 8
10 Operating Highlights 9
11 MGM Is Well Diversified Net Revenue Mix 1 FY % U.S. Regionals Macau 26% Las Vegas 62% Pro forma FY % U.S. Regionals Las Vegas 54% Macau 19% 1 Excludes Management & Other Operations and Other Nevada 2 Includes 12/31/16 reported Net Revenue plus an annualization adjustment for Borgata and MGM National Harbor for the year ended December 31,


 9% 6% 4%")


 Includes")
 Excludes Las")
12 MGM Is Well Positioned In Las Vegas 2016 Las Vegas Strip NO. OF ROOMS CONVENTION SPACE (2) 9% 6% 4% 12% 49% MGM 1 32% 48% MGM 1 25% 4% 12% NO. OF TABLES + SLOTS ARENA, THEATER & SHOWROOM (3) 15% 7% 7% 44% 44% MGM 1 MGM 1 27% Source: Company filings (1) Includes 100% of CityCenter (2) Excludes Las Vegas Convention Center (3) As of May
13 RevPAR 1 Trends MGM Resorts Las Vegas Strip Resorts 2 16% Guidance RevPAR growth Reported RevPAR growth 14% 14% 12% Year-over-year growth 12% 10% 8% 6% 10% 6% 6% 5% 5% 5% 7% CON/AGG comparable in 1Q14 5% 6% 6% 8% 8% 6% Pro forma growth excluding fight weekends 3 8% 5% 6% 7% 11% 4% 3% 3% 3% 2% 1% 3% 0% 1Q14 2Q14 3Q14 4Q14 1Q15 2Q15 3Q15 4Q15 1Q16 2Q16 3Q16 4Q16 We have met or exceeded Las Vegas Strip RevPAR guidance in 22 of the last 24 quarters, with misses attributable to difficult year-over-year comparisons due to historic events in the prior period 1 RevPAR is hotel revenue per available room 2 Excluding CityCenter 3 Excluding the Mayweather vs Pacquiao fight in May 2015 and Canelo vs. Kahn in May 2016 Source: Company filings 12
14 MGM Has Meaningfully Improved Margins Same Store Domestic Margin 1 Las Vegas Wholly Owned Margin 2 32% 32% 31% 30% 30% 31% 30% 30% 29% 29% 28% 28% 27% 26% 26% 27% 26% 26% 25% 24% 24% 25% 24% 24% 23% 23% 22% % Excludes Borgata which was acquired on August 1, 2016, MGM National Harbor which opened December 8, 2016, and Other Nevada Resorts (Circus Circus Reno, Railroad Pass and Gold Strike Jean) which were sold in Excludes CityCenter resort operations 13
15 MGM Resorts Outperforms Competitors Bellagio Leads In Luxury Segment Adjusted Property EBITDA Margin % 35.8% 29.6% 29.3% Wynn/ Encore Bellagio Wynn/ Encore Bellagio Source: Company filings 1 Adjusted Property EBITDA margin is Adjusted Property EBITDA stated as a percentage of net revenue 14

16 MGM Resorts Outperforms Competitors Mandalay Bay Leads In Convention Segment Adjusted Property EBITDA Margin % 22.5% 23.1% 20.3% Venetian/ Palazzo Mandalay Bay Venetian/ Palazzo Mandalay Bay Source: Company filings 1 Adjusted Property EBITDA margin is Adjusted Property EBITDA stated as a percentage of net revenue 15
17 Return On Invested Capital Case Studies 16
18 Successful Track Record Of Return On Invested Capital CityCenter MGM invested ~$2.2bn in CityCenter o $1.1bn monetization of Crystals at extremely attractive cap rate (~4%) Provided opportunity to repay $260mm in debt & reduced leverage to < 4x o MGM s dividends to date: $865mm 1 Resulting in MGM s Net investment in CityCenter of ~$1.38bn 1 today MGM China MGM initial investment in MGM China was $341mm prior to its recent 4.95% purchase o Distributions and dividends to date of $1.4bn are approximately 4x above initial investment o MGM s current ownership of 56% equals $4.3bn 2 of value MGM Detroit MGM invested $800mm o Stabilized Adjusted Property EBITDA of ~$160mm 3 T-Mobile Arena MGM invested ~$73mm and owns 42.5% of the $375mm venue o Top 3 grossing arena in its category in 2016 (only 9 months of operations) o Benefits nearby MGM properties and several ancillary revenue streams 1 Includes announced dividend of $250 million on March 24, 2017 (of which $125 million represents MGM Resorts 50% share) 2 Assumes HKD / USD exchange rate of 7.75 based on closing price of $15.70 on 3/24/17 3 Reflects trailing two year average 17
19 CityCenter Case Study Return on Invested Capital MGM s investment in CityCenter is far below investor perception In 2007, MGM de-risked investment by selling 50% of CityCenter MGM invested ~$2.2bn in CityCenter $1.1bn monetization of Crystals at extremely attractive cap rate (~4%) o Provided opportunity to repay $260mm in debt o Reduced leverage to < 4x MGM s dividends to date: $865mm 1 Resulting in MGM s net investment in CityCenter of ~$1.38bn 1 Today, CityCenter is well capitalized, generating strong returns and positioned to continue returning capital to MGM in excess of cumulative earnings 1 Includes announced dividend of $250 million on March 24, 2017 (of which $125 million represents MGM Resorts 50% share) 18
20 Is CityCenter Misvalued? Aria is consistently one of the top 3 performing resorts within the MGM portfolio MGM Resorts accounts for CityCenter under the equity method of accounting as per GAAP. The result of which is Income from Unconsolidated Affiliates which represents our 50% share of operating income of CityCenter and adjusted for certain basis differences This is not a true reflection of CityCenter s value to MGM Resorts Illustrative 2016 Valuation Multiple 1 50% of CityCenter Adjusted EBITDA $175 x 11 = $1,925 Reported CityCenter Income From Unconsolidated Affiliates $86 x 11 = $941 Value Variance $983 3 Value Variance per share $ While the Company is referencing publicly available reports prepared by securities analysts, the Company is not endorsing or adopting the views or analysis of, or methodologies employed by, those analysts with respect to whether the valuation multiples utilized by those securities analysts is either the correct methodology or the correct multiple; rather, the Company is solely noting that if such analyst multiples were applied to 50% of CityCenter s Adjusted EBITDA instead of CityCenter s Income from Unconsolidated Affiliates 2 CityCenter Income From Unconsolidated Affiliates is as of 12/31/16 of $446 million less gain from the Crystals sale of $401 million plus Nevada Energy Expense of $41 million 3 Assumes 574 million shares outstanding 19
21 MGM China Case Study Return on Invested Capital MGM initial investment in MGM China was $341mm prior to its recent 4.95% purchase Distributions and dividends to date of $1.4bn are approximately 4x above initial investment In September 2016, MGM increased its ownership stake in MGM China by 4.95% via cash / stock purchase Price of MGM China at close of transaction was HK$11.98, which is well below recent closing price 1 of HK$15.70 MGM s current ownership of 56% equals $4.3bn 2 of value 1 As of 3/24/17 2 Assumes HKD / USD exchange rate of 7.75 based on closing price of $15.70 on 3/24/17 20
22 MGM Grand Detroit Case Study Return on Invested Capital Total spend on current MGM Detroit permanent facility of $800mm MGM Detroit is generating stabilized Adjusted Property EBITDA of ~$160mm (reflects trailing two year average) Consistent market leader with > 40% market share 21
23 T-Mobile Arena Case Study Return on Invested Capital Developed brand new best-in-class $375 million entertainment venue MGM owns 42.5% in the T-Mobile Arena with a net investment of ~$73 million Benefits several neighboring MGM Resorts properties and offers incremental ancillary revenue streams to Casino, Hotel, F&B, Retail, Entertainment & Other Hosting first Las Vegas NHL team beginning 2017, which secures over 40 event dates excluding concerts, boxing and other events Top 3 grossing arena in its category in 2016 (only 9 months of operations) 22
24 Leverage & Trading Comparables 23
25 Historical Consolidated Leverage Total Cash $1,544 $1,447 LTM Adjusted EBITDA related to: 2 Domestic Resorts $1,325 $2,340 Management and other operations MGM China Corporate expense (excluding stock-based compensation) (216) (284) $1,799 $2,590 Recurring dividends received by MGM Resorts $1,821 $2,649 Total Principal Amount of Debt related to: 4 MGM Resorts Consolidated $13,598 $13,144 3 $13,598 $13,144 Consolidated Net Leverage Ratio 6.6x 4.4x 1 12/31/2012 includes $952 million at MGM China; 12/31/16 includes $454 million and $360 million at MGM China and MGM Growth Properties, respectively 2 Includes 12/31/16 reported Adjusted Property EBITDA plus an annualization adjustment for Borgata and MGM National Harbor for the year ended December 31, Represents ordinary dividends (excluding special dividends) and other regular cash distributions actually received by MGM from CityCenter and Grand Victoria. 4 12/31/12 includes $554 million at MGM China; 12/31/16 includes $1.9 billion, $3.7 billion, and $450 million at MGM China, MGM Growth Properties, and MGM National Harbor, respectively 24
26 2016 Credit Profile Peer Comparison MGM vs. Select Gaming Companies 8.0x Net Leverage 1 7.0x 6.7x 6.0x 5.0x 4.0x 4.4x 4.9x 5.8x 3.0x 2.0x 2.0x 1.0x 0.0x LVS MGM Red Rock Boyd Wynn Source: Company filings 1 Consolidated net leverage represents total indebtedness less cash and cash equivalents divided by Adjusted EBITDA. 25
27 Capital Initiative Projects 26

28 MGM National Harbor Opened December 8, 2016 Financial Performance Average market share of ~30% vs. fair share 1 of 23% Property Highlights 4 Cost: $1.4 billion Location: On the Potomac River just outside of Washington D.C. Casino: 3,241 slots and 126 tables 5 Hotel: 308 rooms Meeting & Event Space: 50,000 sq. ft. Retail and dining: 93,100 sq. ft. Theater: 3,000 seat Luxury spa and roof-top pool Positioned to be one of the highest grossing facilities in the country Achieved the highest table games revenue on record in January and February of 2017 for Maryland gaming Year-to-date February 2017 total WPPD 2 of $336, $40 higher than its peers 3 Property is averaging over 22,000 daily visitors Source: Company filings; Maryland Gaming commission Note: Financial performance statistics combine Jan & Feb 2017 based on Maryland Gaming Commission and West Virginia Lottery reports 1 Fair share is based on total table game and slot units for the D.C. Metro peer / competitive set 2 Win per position per day; assumes 7 seats per table 3 D.C. Metro peer / competitive set includes MGM National Harbor, Maryland Live, Horseshoe Baltimore, Hollywood Perryville, Ocean Downs, Rocky Gap and Hollywood Chares Town. MGM National Harbor of $336 vs peer / competitive set total WPPD weighted by total gross gaming revenue YTD as of Feb As of 12/31/ Includes 39 poker tables 27


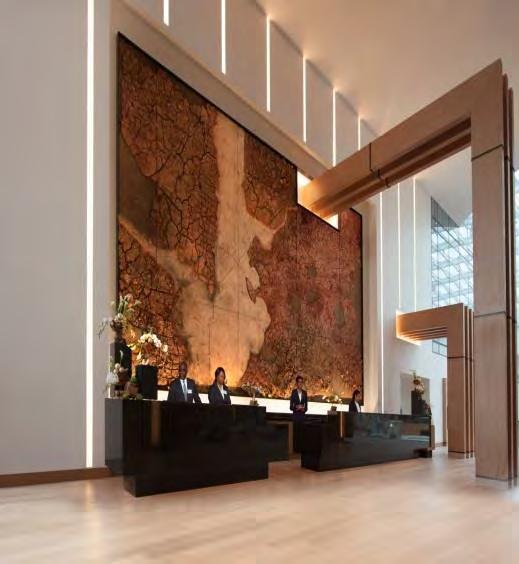
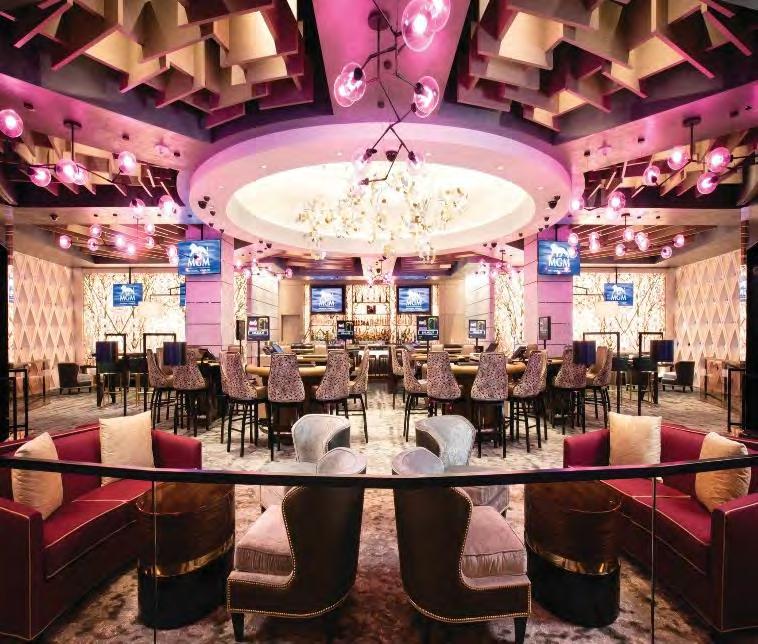
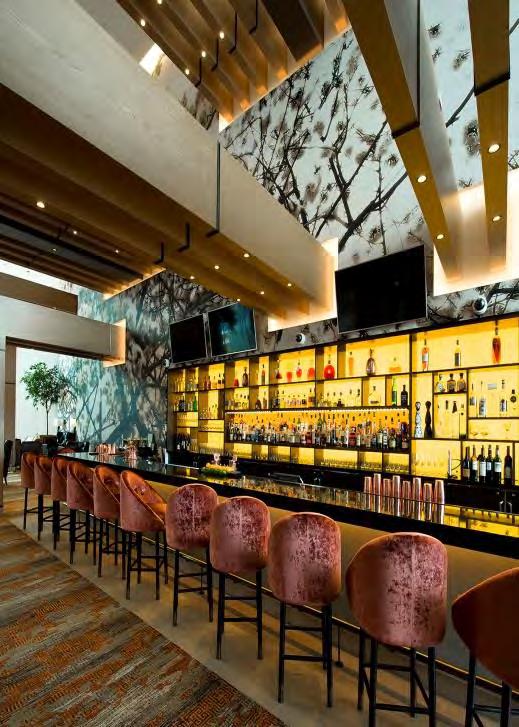
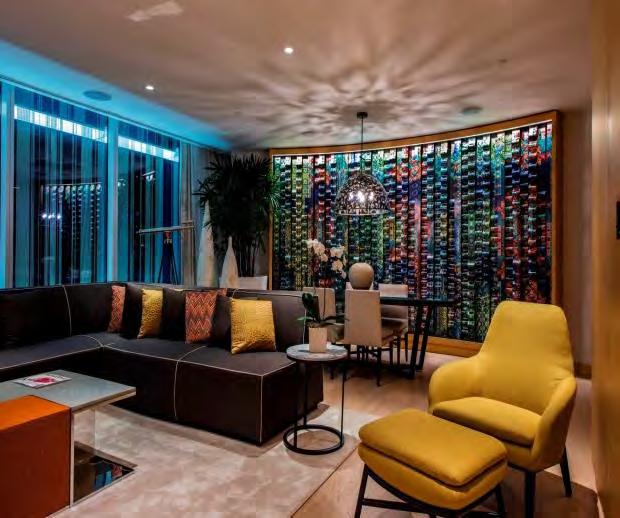
29 MGM National Harbor Property Highlights 28


30 Park Theater at Monte Carlo Opened December 17, 2016 Celebrated the grand opening of the 5,200-seat theater with inaugural performances by legendary singer-songwriter Stevie Nicks and renowned rock group The Pretenders The Park Theater will play a key role in MGM s strategy to further evolve the entertainment landscape in Las Vegas, featuring unparalleled audio and visual technology and providing intimate exposure to some of the most celebrated artists The stage is set for award winning entertainers in 2017 Bruno Mars, a 17-time GRAMMY Award nominee will take the stage in March and September Multiple GRAMMY Award-winning artist, Ricky Martin will begin his Las Vegas residency in April The Oscar, Emmy, and GRAMMY Award-winning Goddess of Pop, Cher will perform in February and May 29

31 Park Theater at Monte Carlo 30

32 Park Theater at Monte Carlo 31


33 Park MGM / The NoMad Las Vegas Interstate 15 Tropicana Avenue Park Theater NoMad Las Vegas Park MGM Market at Park MGM Project Highlights Cost: ~$500 million Opening Date: Late 2018 Location: Las Vegas Strip, between New York- New York, T-Mobile Arena and CityCenter Hotel: Las Vegas Boulevard Park MGM: 2,700 room luxury resort conceptualized by MGM and Sydell Group conceived to target a younger, well-traveled demographic seeking unique experiences and innovative design. NoMad Las Vegas: 292 guestrooms and suites with a dedicated drop-off lobby, swimming pool and NoMad branded gaming, eating and drinking experiences. 32


34 MGM Springfield 50 mi Population 3.3 million 25 mi Population 1.2 million Everett Wynn Plainridge Park Twin River Mohegan Sun Newport Grand Foxwoods Other Casino Properties Planned Casino Projects Project Highlights: Cost: ~$865 million (1) Opening Date: Late 2018 Location: 14 acres in downtown Springfield, MA Casino: 3,000 slots and 100 tables (2) Hotel: 250 rooms Retail and dining: 100,000 sq..ft. Parking garage: 3,375 spaces Meeting & Event Space: 44,000 sq. ft. 1 Excludes capitalized interest and land related costs 2 Includes poker tables 33

35 MGM Springfield Construction Aerial View 34


36 MGM Cotai Project Highlights Cost: $3.3 billion Opening Date: 2 nd Half of 2017 Location: 18 acre site on the Cotai Strip in Macau Casino: capacity for up to 500 gaming tables and 1,500 slots Hotel: 1,500 rooms Other amenities: meeting space, high end spa, retail offerings, F&B outlets, a transformable theater, and the Spectacle as well as the first international MGM Mansion villa product for the ultimate luxury experience. 35

37 MGM Cotai Construction 36

38 MGM Cotai Construction 37
39 Appendix Strategic Highlights Detail Total Shareholder Return Performance 38
40 MGM Highlights 2014 & Re-priced CityCenter's TLB generating annual savings of $12mm MGM issued $1.25bn of 6% Senior Notes due 2023 MGM repaid $509mm of 5.875% senior notes MGM China paid $499mm special dividend in March, $127mm final dividend in June and $137mm interim dividend in September 2015 Converted $1.45bn convertible notes to equity Closed on sale of Railroad Pass & Gold Strike Jean for net proceeds of $20mm Announced implementation of Profit Growth Plan with initial target of $300mm Closed on sale of Circus Circus Reno for net proceeds of $72mm MGM Resort s $200mm share of the first ever $400mm special distribution from CityCenter Repayment of the $875mm senior notes Amend and extend of MGM China's Senior Credit Facility with +$1B upsize MGM China paid $400mm special dividend in March, $120mm final dividend in June and $76mm interim dividend in August 39
41 MGM Highlights 2016 Profit Growth Plan Continued successful execution with 2017 target increased from $300mm to $400mm MGP Formation & IPO $1.2bn of proceeds was third largest US IPO of 2016 Priced at the high-end of the range 14x multiple represented a premium valuation to closest comp Strong after-market performance with MGP equity currently trading ~16% above issuance Significant MGM balance sheet improvement Consolidated net leverage below 4.5x o Lowest levels since pre-recession despite funding over $3bn in construction in progress MGP transaction resulted in two-notch upgrade from Moody s and Fitch and a one-notch upgrade from S&P MGM raised $500mm of 10 year bonds at 4.625% - lowest long-term bond yield in MGM's history Overall reduction of ~$4bn of debt Crystals Sale for $1.1bn represents cap rate of ~4.2% Acquired BYD's 50% interest in Borgata at $1.8bn valuation (100%) & sold underlying real estate to MGP for $1.175bn Implied multiple of 8.9x at signing (8.5x at announce) 40
42 MGM Highlights 2016 (Continued) MGM acquired 4.95% of MGM China from Pansy Ho for 7.1mm MGM shares, $100mm cash & $50mm deferred cash payment Entered into MGM National Harbor $525mm credit facility to complete construction MGP raised $500 million of 10 year bonds at 4.50% - lowest coupon in company's history Re-priced MGP's TLB generating annual savings of $13.5mm upon Moody's upgrade CityCenter Dividends - $540mm received in 2016 by MGM as a result of Crystals transaction MGM China paid $46mm final dividend in June and $58mm interim dividend in August Announced $450mm Monte Carlo rebrand initiative (with expected completion in 2018) Completed $70mm Mandalay Bay Convention expansion Successfully opened the T-Mobile Arena / MGM National Harbor / Park Theater 41
43 Appendix Strategic Highlights Detail Total Shareholder Return Performance 42
44 Total Shareholder Returns MGM has generally outperformed industry peers on a 1,3, and 5 year basis Annualized Returns 1 1-Year 3-Year 5-Year MGM Resorts International 25.8% 0.3% 12.2% Las Vegas Sands 12.0% -6.5% 4.0% Wynn Resorts 22.3% -17.9% 1.3% S&P 500 Index 17.6% 10.2% 13.0% Source: Bloomberg Note: Trailing total stock performance as of 3/24/17 1 Returns include dividends; 3-Year and 5-Year represents the compounded annual growth rate 43
45 1-Year Performance 1-Year Performance 50% Stock Price Stock Price 1 Year Company 3/24/2016 3/24/2017 Return (1) MGM Resorts International $20.52 $ % Las Vegas Sands % Wynn Resorts % S&P 500 Index 2,036 2, % 40% 30% 20% 10% 25.8% 22.3% 17.6% 12.0% 0% -10% -20% -30% Mar-16 Apr-16 May-16 Jun-16 Jul-16 Aug-16 Sep-16 Oct-16 Nov-16 Dec-16 Jan-17 Feb-17 Mar-17 MGM LVS WYNN S&P 500 Index Source: Bloomberg Note: Trailing total stock performance as of 3/24/17 1 Returns include dividends 44
46 3-Year Performance 60% 3-Year Performance Stock Price Stock Price 3 Year Return (1) Company 3/25/2014 3/24/2017 Cumulative CAGR MGM Resorts International $ % 0.3% Las Vegas Sands % -6.5% Wynn Resorts % -17.9% S&P 500 Index 1,866 2, % 10.2% 40% 20% 0% -20% -40% -60% 33.8% 0.8% -18.4% -44.7% -80% -100% Mar-14 Jun-14 Sep-14 Dec-14 Mar-15 Jun-15 Sep-15 Dec-15 Mar-16 Jun-16 Sep-16 Dec-16 MGM LVS WYNN S&P 500 Index Source: Bloomberg Note: Trailing total stock performance as of 3/24/17 1 Returns include dividends 45
47 5-Year Performance 5-Year Performance 140% 120% 100% 80% 60% 40% 20% 0% -20% -40% -60% Stock Price Stock Price 5 Year Return (1) Company 3/26/2012 3/24/2017 Cumulative CAGR MGM Resorts International $14.54 $ % 12.2% Las Vegas Sands % 4.0% Wynn Resorts % 1.3% S&P 500 Index 1,417 2, % 13.0% 84.1% 77.6% 21.5% 6.4% -80% Mar-12 Jun-12 Sep-12 Dec-12 Mar-13 Jun-13 Sep-13 Dec-13 Mar-14 Jun-14 Sep-14 Dec-14 Mar-15 Jun-15 Sep-15 Dec-15 Mar-16 Jun-16 Sep-16 Dec-16 MGM LVS WYNN S&P 500 Index Source: Bloomberg Note: Trailing total stock performance as of 3/24/17 1 Returns include dividends 46
Forward-Looking Statements Statements in this presentation that are not historical facts are "forward-looking" statements and "safe harbor
 2017 Annual Meeting of Shareholders Presentation May 2017 Forward-Looking Statements Statements in this presentation that are not historical facts are "forward-looking" statements and "safe harbor statements"
GAMING INVESTMENT FORUM AT G2E. September 26, 2016
 GAMING INVESTMENT FORUM AT G2E September 26, 2016 Dan D Arrigo EVP & Chief Financial Officer MGM Resorts International MGM RESORTS INTERNATIONAL Strong Domestic Operating Results Las Vegas Trends Maximizing
MGM Resorts International Reports Second Quarter Financial Results
 NEWS RELEASE MGM Resorts International Reports Second Quarter Financial Results 8/5/2014 Consolidated Adjusted EBITDA Increased 8%, Led By 10% Growth In Wholly Owned Domestic Resorts MGM China Declares
MGM Resorts International Reports Strong First Quarter Financial And Operating Results
 NEWS RELEASE MGM Resorts International Reports Strong First Quarter Financial And Operating Results 5/5/2016 Increases Wholly Owned Domestic Resorts Net Revenue and Adjusted Property EBITDA by 3% and 24%
MGM RESORTS INTERNATIONAL Third Quarter 2016 Earnings Presentation
 MGM RESORTS INTERNATIONAL Third Quarter 2016 Earnings Presentation November 7, 2016 Forward-Looking Statements Statements in this presentation that are not historical facts are forward-looking statements,
MGM RESORTS INTERNATIONAL 4Q and FY 2016 Earnings Presentation
 MGM RESORTS INTERNATIONAL 4Q and FY 2016 Earnings Presentation February 16, 2017 Forward-Looking Statements Statements in this presentation that are not historical facts are forward-looking statements,
MGM Resorts International Reports Fourth Quarter And Full Year Financial And Operating Results; Announces Quarterly Dividend
 NEWS RELEASE MGM Resorts International Reports Fourth Quarter And Full Year Financial And Operating Results; Announces Quarterly Dividend 2/16/2017 Increased diluted earnings per share in the fourth quarter
MGM GROWTH PROPERTIES LLC Second Quarter 2016 Earnings Presentation
 MGM GROWTH PROPERTIES LLC Second Quarter 06 Earnings Presentation August 4, 06 Forward-Looking Statements Statements in this presentation that are not historical facts are "forward-looking" statements
Forward-Looking Statements. Note Regarding Presentation of Non-GAAP Financial Measures
 First Quarter 2016 Earnings Presentation May 5, 2016 Forward-Looking Statements Statements in this presentation that are not historical facts are forward-looking statements, within the meaning of the Private
MGM Resorts International Reports First Quarter Financial And Operating Results
 NEWS RELEASE MGM Resorts International Reports First Quarter Financial And Operating Results 4/27/2017 LAS VEGAS, April 27, 2017 /PRNewswire/ -- MGM Resorts International (NYSE: MGM) ("MGM Resorts" or
Wells Fargo Net Lease REIT Forum 2016
 Wells Fargo Net Lease REIT Forum 2016 September 2016 Forward-Looking Statements Statements in this presentation that are not historical facts are "forward-looking" statements and "safe harbor statements"
BAML 2017 Japan Conference The Opportunity For Integrated Resorts In Japan
 BAML 2017 Japan Conference The Opportunity For Integrated Resorts In Japan September 7, 2017 Jim Murren Chairman and CEO MGM Resorts International AGENDA 1. MGM Resorts Who We Are 2. The Japan Opportunity
MGM Resorts International Reports Fourth Quarter and Full Year Results
 NEWS RELEASE MGM Resorts International Reports Fourth Quarter and Full Year Results 2/14/2011 LAS VEGAS, Feb. 14, 2011 /PRNewswire-FirstCall/ -- MGM Resorts International (NYSE: MGM) today announced a
Investor Presentation
 MGM Resorts International Investor Presentation The MGM Resorts Investment Case July 27, 2017 Forward-Looking Statements Statements in this presentation that are not historical facts are forward-looking
MGM RESORTS INTERNATIONAL REPORTS SECOND QUARTER FINANCIAL AND OPERATING RESULTS
 Exhibit 99.1 MGM RESORTS INTERNATIONAL REPORTS SECOND QUARTER FINANCIAL AND OPERATING RESULTS Las Vegas, Nevada, August 2, 2018 MGM Resorts International (NYSE: MGM) ( MGM Resorts or the Company ) today
Forward-Looking Statements Statements in this presentation that are not historical facts are "forward-looking" statements and "safe harbor
 Investor Presentation November 2017 Forward-Looking Statements Statements in this presentation that are not historical facts are "forward-looking" statements and "safe harbor statements" within the meaning
Q2 Financial Results Before One-Time Charges
 Q2 Highlights Generated Record Net Revenues of $1.7 Billion, Up 60% Same-Store Net Revenues were $1.2 Billion, Up 11% Over 2004 Produced Record Property-Level EBITDA of $567 Million Same-Store Property-Level
Q3 HIGHLIGHTS. Strong High End Table Games Volume Baccarat Volume Up 22%
 what if Q3 HIGHLIGHTS Net Revenues up 5% to $1.9 Billion 5% Increase in Gaming Revenues Strong High End Table Games Volume Baccarat Volume Up 22% Slot Revenue Up 5% Hotel Revenues Grew 3% - Led by a 6%
Investor Presentation
 Investor Presentation December 2016 Forward-Looking Statements Statements in this presentation that are not historical facts are "forward-looking" statements and "safe harbor statements" within the meaning
CLSA Asia Investor Forum. January, 2008
 CLSA Asia Investor Forum January, 2008 Forward Looking Statements This presentation contains forward-looking statements regarding operating trends, future results of operations and the completion of new
Market and Industry Data
 Investor Presentation March 2018 Forward-Looking Statements Statements in this presentation that are not historical facts are "forward-looking" statements and "safe harbor statements" within the meaning
MGM Resorts International (Exact name of registrant as specified in its charter)
") UNITED STATES SECURITIES AND EXCHANGE COMMISSION Washington, D.C. 20549 FORM 8-K CURRENT REPORT PURSUANT TO SECTION 13 OR 15(d) OF THE SECURITIES EXCHANGE ACT OF 1934 Date of report (Date of earliest event
UNITED STATES SECURITIES AND EXCHANGE COMMISSION Washington, D.C. 20549 FORM 8-K CURRENT REPORT PURSUANT TO SECTION 13 OR 15(d) OF THE SECURITIES EXCHANGE ACT OF 1934 Date of report (Date of earliest event
MGM MIRAGE Reports Fourth Quarter and Full Year Financial Results
 NEWS RELEASE MGM MIRAGE Reports Fourth Quarter and Full Year Financial Results 2/18/2010 CityCenter Opens to Rave Reviews Convention Booking Pace Continues to Strengthen PRNewswire-FirstCall LAS VEGAS
MGM MIRAGE Reports Record First Quarter Results
 NEWS RELEASE MGM MIRAGE Reports Record First Quarter Results 5/3/2007 PRNewswire-FirstCall LAS VEGAS MGM MIRAGE (NYSE: MGM) today reported its first quarter 2007 financial results, achieving the Company's
MGM MIRAGE Reports Record Second Quarter Revenue, Cash Flow and Net Income
 NEWS RELEASE MGM MIRAGE Reports Record Second Quarter Revenue, Cash Flow and Net Income 7/24/2001 PRNewswire LAS VEGAS MGM MIRAGE (NYSE: MGG) today reported earnings of 47 cents per diluted share for the
Forward-Looking Statements Statements in this presentation that are not historical facts are "forward-looking" statements and "safe harbor
 Investor Presentation November 2018 Forward-Looking Statements Statements in this presentation that are not historical facts are "forward-looking" statements and "safe harbor statements" within the meaning
Market and Industry Data
 Investor Presentation June 2018 Forward-Looking Statements Statements in this presentation that are not historical facts are "forward-looking" statements and "safe harbor statements" within the meaning
MGM MIRAGE Reports Second Quarter Results
 NEWS RELEASE MGM MIRAGE Reports Second Quarter Results 8/5/2008 PRNewswire-FirstCall LAS VEGAS MGM MIRAGE (NYSE: MGM) today reported its second quarter 2008 financial results. The Company achieved 97%
CLSA Investors Forum 2015 September 2015
 CLSA Investors Forum 2015 September 2015 Forward Looking Statements This presentation contains forward-looking statements regarding operating trends, future results of operations and the completion of
Management Presentation. March 2016
 Management Presentation March 2016 Forward looking statements This presentation as well as oral statements made by officers or directors of Allegiant Travel Company, its advisors and affiliates (collectively
Gaming Investment Forum September 2014
 Gaming Investment Forum September 2014 Forward Looking Statements This presentation contains forward-looking statements regarding operating trends, future results of operations and the completion of new
Deutsche Bank 2011 Leveraged Finance Conference Sarah Rogers - Investor Relations
 Deutsche Bank 2011 Leveraged Finance Conference Sarah Rogers - Investor Relations Las Vegas Indicators Improving (YTD through August 2011) Visitation +5% Average Daily Auto Traffic Flat McCarran Airport
MGM MIRAGE Reports Record Third Quarter Revenue, Cash Flow, and Net Income
 NEWS RELEASE MGM MIRAGE Reports Record Third Quarter Revenue, Cash Flow, and Net Income 10/18/2000 PRNewswire LAS VEGAS MGM MIRAGE (NYSE: MGG) today reported earnings of 42 cents per diluted share for
ISI Group Annual Conference February 15, 2011
 ISI Group Annual Conference February 15, 2011 CURRENT LAS VEGAS MARKET TRENDS (Full Year 2010) Visitation Up 2.7% Las Vegas Strip Gaming Revenues Up 4.1% Airline Passengers Down 1.8% Auto Traffic Up 3.1%
LD Micro Conference June 2017 FULL HOUSE RESORTS 1
 LD Micro Conference June 2017 FULL HOUSE RESORTS 1 Forward-looking Statements / Regulation G This presentation may contain statements that are "forward-looking statements" within the meaning of the safe
Nomura Investor Forum December 2014
 Nomura Investor Forum December 2014 Forward Looking Statements This presentation contains forward-looking statements regarding operating trends, future results of operations and the completion of new projects,
Morgan Stanley Asia Pacific Conference November 2014
 Morgan Stanley Asia Pacific Conference November 2014 Forward Looking Statements This presentation contains forward-looking statements regarding operating trends, future results of operations and the completion
Investor Conference April 2016
 Investor Conference April 2016 Forward Looking Statements This presentation contains forward-looking statements regarding operating trends, future results of operations and the completion of new projects,
Management Presentation. November 2018
 Management Presentation November 2018 Forward looking statements This presentation as well as oral statements made by officers or directors of Allegiant Travel Company, its advisors and affiliates (collectively
WH Smith PLC Acquisition of InMotion providing access to the world s largest travel retail market 30 October 2018
 WH Smith PLC Acquisition of InMotion providing access to the world s largest travel retail market 30 October 2018 Transaction highlights WH Smith announces acquisition of InMotion for $198m ( 155 million)
Management Presentation. November 2011
 Management Presentation November 2011 Forward looking statements This presentation as well as oral statements made by officers or directors of Allegiant Travel Company, its advisors and affiliates (collectively
AAGI AAGI: APPLIED ANALYSIS GAMING INDEX JUNE Operators. Manufacturers. Composite
 '98 '99 '00 '01 '02 '03 '04 '05 '06 '07 '08 '09 '10 '11 '12 '13 AAGI Operators Manufacturers Composite Stock Price - Daily Average Prior Period Prior Year Contribution Jun-13 May-13 Jun-12 % Change % Change
How Real Estate Plays a Role in a Gaming Company s Valuation and Strategy. Global Gaming Group 1
 How Real Estate Plays a Role in a Gaming Company s Valuation and Strategy Global Gaming Group 1 Carlton L. Geer Senior Vice President, Global Gaming Group (a dedicated business unit of CB Richard Ellis
Crown Resorts Limited
 Crown Resorts Limited 2015 Full Year Results Presentation 13 August 2015 1 Crown Resorts Limited Results Overview Crown Resorts Limited (Crown) performance: Overall, the results for Crown s portfolio of
Management Presentation. September 2011
 Management Presentation September 2011 Forward looking statements This presentation as well as oral statements made by officers or directors of Allegiant Travel Company, its advisors and affiliates (collectively
Results 2Q17. August 9, 2017
 Results 2Q17 August 9, 2017 2Q17 Highlights Indicators 2Q17 Var. x 2Q16 ASK (BN) 10.4-3.0% Traffic (000) 7,261-1.3% RPK (BN) 8.1 +0.5% Load Factor 77.9% +2.7 p.p. Yield (R$ cents) 23.2 +4.8% Pax Revenue
SET Opportunity Day #3/2011
 SET Opportunity Day #3/2011 2Q11 & 1H11 Performance & Outlook 18 August 2011 The views expressed here contain some information derived from publicly available sources that have not been independently verified.
MARRIOTT INTERNATIONAL, INC. PRESS RELEASE SCHEDULES QUARTER 4, 2016 TABLE OF CONTENTS
 PRESS RELEASE SCHEDULES QUARTER 4, 06 TABLE OF CONTENTS Consolidated Statements of Income - As Reported A- Consolidated Statements of Income - Fourth Quarter Adjusted 06 Compared to Combined 05 A-3 Consolidated
MARRIOTT INTERNATIONAL 2017 SECURITY ANALYST MEETING. March 21, 2017
 MARRIOTT INTERNATIONAL 2017 SECURITY ANALYST MEETING March 21, 2017 FORWARD LOOKING STATEMENTS, NON GAAP FINANCIAL MEASURES, AND INFORMATION FOR 2016 AND 2015 This material contains forward looking statements
Management Presentation. September 2015
 Management Presentation September 2015 Forward looking statements This presentation as well as oral statements made by officers or directors of Allegiant Travel Company, its advisors and affiliates (collectively
Management Presentation. May 2013
 Management Presentation May 2013 Forward looking statements This presentation as well as oral statements made by officers or directors of Allegiant Travel Company, its advisors and affiliates (collectively
E190 REPLACEMENT & FLEET UPDATE JULY 11, 2018
 1 E190 REPLACEMENT & FLEET UPDATE JULY 11, 2018 SAFE HARBOR This presentation contains forward-looking statements within the meaning of the Private Securities Litigation Reform Act of 1995, Section 27A
STAYING TRUE. Scotia Capital Transportation & Aerospace Conference. November 15, 2011
 STAYING TRUE Scotia Capital Transportation & Aerospace Conference November 15, 2011 FORWARD-LOOKING STATEMENT Certain information in this presentation and statements made during this presentation, including
Company Presentation
 Company Presentation Forward Looking Statements These materials contain forward-looking statements within the meaning of Section 27A of the Securities Act, and Section 21E of the Securities Exchange Act.
Air China Limited Annual Results. March Under IFRS
 Air China Limited 21 Annual Results Under IFRS March 211 Agenda Part 1 Highlights Part 2 Business Overview Part 3 Financial Overview Part 4 Outlook 2 Part 1 Highlights Steady Economic Growth; Asia Pacific
Forward Looking Statements
 October 2, 2012 Forward Looking Statements Certain information in this presentation may be considered forward-looking information within the meaning of the Private Securities Litigation Reform Act of 1995.
FORWARD LOOKING STATEMENTS
 MARCH 2007 FORWARD LOOKING STATEMENTS This presentation contains statements regarding operating trends, future results, new projects, and other market, business and property trends that are forward-looking.
ABX. Holdings, Inc. BB&T Transportation Conference. February 2008
 ABX Holdings, Inc. BB&T Transportation Conference February 2008 1 Safe Harbor Statement Except for historical information contained herein, the matters discussed in this presentation contain forward-looking
Air China Limited Interim Results. August Under IFRS
 Air China Limited 21 Interim Results Under IFRS August 21 1 Agenda 21 Interim Results Overview Business Overview Financial Overview Outlook 2 2 2 21 Interim Results 3 21 Interim Results Overview 4 4 4
Crown Resorts Limited
 Crown Resorts Limited 2016 Half Year Results Presentation 25 February 2016 1 Crown Resorts Limited Results Overview Crown Resorts Limited (Crown) performance: The 2016 First Half results across Crown s
Wells Fargo Consumer, Gaming and Lodging Conference May 24, 2011
 Wells Fargo Consumer, Gaming and Lodging Conference May 24, 2011 MGM Resorts International Las Vegas Trends M Life Loyalty Program MGM Resorts Hospitality Marketing Las Vegas COMPANY OVERVIEW Collection
TUI GROUP INVESTOR PRESENTATION
 TUI GROUP INVESTOR PRESENTATION German Investment Conference UniCredit / Kepler Munich, 26-27 September 2012 Future-related statements This presentation contains a number of statements related to the future
MIRAMAR, Fla., April 29, 2015 (GLOBE NEWSWIRE) -- Spirit Airlines, Inc. (Nasdaq:SAVE) today reported first quarter 2015 financial results.
 -- Spirit Airlines, Inc. (Nasdaq:SAVE) today reported first quarter 2015 financial results.") April 29, 2015 Spirit Airlines Announces First Quarter 2015 Results; Adjusted Net Income Increases 87.1 Percent to $70.7 Million and Pre-Tax Margin Increases 900 Basis Points to 22.7 Percent MIRAMAR, Fla.,
April 29, 2015 Spirit Airlines Announces First Quarter 2015 Results; Adjusted Net Income Increases 87.1 Percent to $70.7 Million and Pre-Tax Margin Increases 900 Basis Points to 22.7 Percent MIRAMAR, Fla.,
Gerry Laderman SVP Finance, Procurement and Treasurer
 Gerry Laderman SVP Finance, Procurement and Treasurer Safe Harbor Statement Certain statements included in this release are forward-looking and thus reflect our current expectations and beliefs with respect
Management Presentation. August 2012
 Management Presentation August 2012 Forward looking statements This presentation as well as oral statements made by officers or directors of Allegiant Travel Company, its advisors and affiliates (collectively
Indiabulls Real Estate Limited (CIN : L45101DL2006PLC148314)
") Indiabulls Real Estate Limited (CIN : L45101DL2006PLC148314) Earnings Update Audited Financial Results FY 2013-14 April 23, 2014 Safe Harbor Statement This document contains certain forward looking statements
Indiabulls Real Estate Limited (CIN : L45101DL2006PLC148314) Earnings Update Audited Financial Results FY 2013-14 April 23, 2014 Safe Harbor Statement This document contains certain forward looking statements
GALAXY ENTERTAINMENT GROUP
 GALAXY ENTERTAINMENT GROUP RECORD HALF YEAR GROUP ADJUSTED EBITDA OF $5.8 BILLION, UP 23% YEAR-ON-YEAR NET PROFIT ATTRIBUTABLE TO SHAREHOLDERS GREW 35% TO $4.6 BILLION FURTHER STRENGTHENED LIQUID BALANCE
Jumpstart 2017 Lukas Johnson SVP, Commercial. June 2017
 Jumpstart 2017 Lukas Johnson SVP, Commercial June 2017 Forward looking statements This presentation as well as oral statements made by officers or directors of Allegiant Travel Company, its advisors and
Emperor Entertainment Hotel Limited (Stock code: 296) 2007/08 Annual Results Announcement July 17, 2008
 2007/08 Annual Results Announcement July 17, 2008") (Stock code: 296) 2007/08 Annual Results Announcement July 17, 2008 0 Core Businesses Macau Casino Hotel Grand Emperor Hotel Shanghai Retail & Hotel Complex Emperor Star City Opened since Jan 2006 To complete
(Stock code: 296) 2007/08 Annual Results Announcement July 17, 2008 0 Core Businesses Macau Casino Hotel Grand Emperor Hotel Shanghai Retail & Hotel Complex Emperor Star City Opened since Jan 2006 To complete
2007/08 Full Year Results Investor Briefing
 2007/08 Full Year Results Investor Briefing Highlights of Result Profit before tax up 46% to $1,408 million Up 36% on the reported result Margin improvement $3 billion of Sustainable Future Benefits achieved
10TH ANNUAL WOLFE RESEARCH GLOBAL TRANSPORTATION CONFERENCE MAY 23, 2017
 1 10TH ANNUAL WOLFE RESEARCH GLOBAL TRANSPORTATION CONFERENCE MAY 23, 2017 SAFE HARBOR This presentation contains forward-looking statements within the meaning of the Private Securities Litigation Reform
Corporate Presentation. Genting Malaysia Berhad ( GENM ) May 2012
 May 2012") Corporate Presentation Genting Malaysia Berhad ( GENM ) May 2012 1 Agenda Introduction Financial Highlights Malaysian Operations Resorts World Genting Overseas Operations United Kingdom United States Looking
Corporate Presentation Genting Malaysia Berhad ( GENM ) May 2012 1 Agenda Introduction Financial Highlights Malaysian Operations Resorts World Genting Overseas Operations United Kingdom United States Looking
PAN PACIFIC HOTELS GROUP LIMITED 2010 FULL YEAR RESULTS BRIEFING 22 FEB 2011
 PAN PACIFIC HOTELS GROUP LIMITED 2010 FULL YEAR RESULTS BRIEFING 22 FEB 2011 2010 RESULTS OVERVIEW STRATEGIC & OPERATIONS HIGHLIGHTS NEO SOON HUP CHIEF FINANCIAL OFFICER 2 CONTENTS Focus and Highlights
MGM MIRAGE and Mandalay Resort Group Sign Definitive Agreement for MGM MIRAGE to Acquire Mandalay for $71.00 Per Share in Cash
 NEWS RELEASE MGM MIRAGE and Mandalay Resort Group Sign Definitive Agreement for MGM MIRAGE to Acquire Mandalay for $71.00 Per Share in Cash 6/16/2004 Will Create the Premier Global Diversified Gaming and
1Q 2017 EARNINGS PRESENTATION APRIL 25, 2017
 1 1Q 2017 EARNINGS PRESENTATION APRIL 25, 2017 SAFE HARBOR This presentation contains forward-looking statements within the meaning of the Private Securities Litigation Reform Act of 1995, Section 27A
Crown Limited. Annual General Meeting. 30 October, 2012
 Crown Limited Annual General Meeting 30 October, 2012 Presentation Outline 1. F12 Year in Review 2. Recent Trading Update 3. Capital Expenditure Update 4. Crown Sydney Update 5. Crown: Building a Global
Thank you for participating in the financial results for fiscal 2014.
 Thank you for participating in the financial results for fiscal 2014. ANA HOLDINGS strongly believes that safety is the most important principle of our air transportation business. The expansion of slots
Investor Meeting Presentation. 4 June 2014
 Investor Meeting Presentation 4 June 2014 COMPANY OVERVIEW 1Q2014 RESULTS OVERVIEW OPERATION HIGHLIGHTS Q&A 2 Founded in 1963, listed on the Singapore Exchange in 1964 Three core businesses: - Property
2016 HALF YEAR RESULTS. Mandarin Oriental Hotel Group
 2016 HALF YEAR RESULTS Mandarin Oriental Hotel Group 2016 Half Year Results Highlights US $ m June 2016 June 2015 Combined Total Revenue * 644 641 Underlying EBITDA 71 82 * Includes revenue from the Group
For personal use only
 THE GPT GROUP ANNOUNCES 29 October 2014 September Quarter Operational Update Key Highlights 2014 earnings guidance upgraded to at least 4 per cent earnings per security (EPS) growth Strong leasing momentum
American Airlines Group Inc.
 American Airlines Group Inc. Deutsche Bank Leveraged Finance Conference October 4, 2017 Tom Weir Vice President, Treasurer Cautionary Statement Regarding Forward-Looking Statements and Information This
Presentation on Results for the 2nd Quarter FY Idemitsu Kosan Co.,Ltd. November 14, 2018
 Presentation on Results for the 2nd Quarter FY 2018 Idemitsu Kosan Co.,Ltd. November 14, 2018 Table of Contents 1. FY 2018 2nd Quarter Financials (1) Overview (2) Segment Information 2. Reference Materials
Full House Resorts. Investor Presentation December 2018
 Full House Resorts Investor Presentation December 2018 Forward-looking Statements & Regulation G 2 This presentation may contain statements that are "forward-looking statements" within the meaning of the
Bank of America Gaming Conference Presentation. June 2006
 Bank of America Gaming Conference Presentation June 2006 Agenda Company Overview Slot Route Operations Nevada Casino Operations Midwest Casino Operations (Grace) Financial Overview Key Takeaway 1 Company
American Airlines Group Inc.
 American Airlines Group Inc. Bank of America Merrill Lynch 2018 Transportation Conference Derek Kerr Chief Financial Officer Cautionary Statement Regarding Forward-Looking Statements and Information This
Spirit Airlines Reports First Quarter 2017 Results
 Spirit Airlines Reports First Quarter 2017 Results MIRAMAR, Fla., April 28, 2017 - Spirit Airlines, Inc. (NASDAQ: SAVE) today reported first quarter 2017 financial results. GAAP net income for the first
2008 INTERIM ANNOUNCEMENT
 (Stock Code: 78) 2008 INTERIM ANNOUNCEMENT FINANCIAL HIGHLIGHTS Six months ended 30th June, 2008 (Unaudited) Six months ended 30th June, 2007 (Unaudited) HK$ M HK$ M Revenue 750.8 622.0 Operating profit
China Lodging Group (HTHT.US) Q4 and full year 2017 Earnings Call March 13, 2018
 Q4 and full year 2017 Earnings Call March 13, 2018") China Lodging Group (HTHT.US) Q4 and full year 2017 Earnings Call March 13, 2018 Agenda Strategy Review Operational and Financial Review Q & A Appendix 1 Strong RevPAR Growth Driven by ADR + Occupancy
China Lodging Group (HTHT.US) Q4 and full year 2017 Earnings Call March 13, 2018 Agenda Strategy Review Operational and Financial Review Q & A Appendix 1 Strong RevPAR Growth Driven by ADR + Occupancy
Analysts and Investors conference call. Q results. 15 May 2013
 Analysts and Investors conference call Q1 2013 results 15 May 2013 Management summary Key messages of Q1 2013 +6% +9% +3.3%p. Q1 2013 operational KPIs are in line with 109.7 116.2 6.5 7.1 82.3 85.6 expectations,
For personal use only
 ASX and Media Release QANTAS DELIVERS RECORD FIRST HALF PROFIT, INVESTS IN AIRCRAFT AND TRAINING Sydney, 22 February 2018 Underlying Profit Before Tax: $976 million (up 15%) Record results for Qantas Domestic,
Cebu Air, Inc. 4 th Quarter and Full Year 2017 Results of Operations. cebupacificair.com
 Cebu Air, Inc. 4 th Quarter and Full Year 2017 Results of Operations cebupacificair.com Disclaimer The information provided in this presentation is provided only for your reference. Such information has
Copa Holdings Reports Record Earnings of US$41.8 Million for 4Q06 and US$134.2 Million for Full Year 2006
 Copa Holdings Reports Record Earnings of US$41.8 Million for 4Q06 and US$134.2 Million for Full Year 2006 Panama City, Panama --- March 7, 2007. Copa Holdings, S.A. (NYSE: CPA), parent company of Copa
JP Morgan Aviation, Transportation and Industrials Conference MARCH 15, 2017
 JP Morgan Aviation, Transportation and Industrials Conference MARCH 15, 2017 1 1 SAFE HARBOR This presentation contains forward-looking statements within the meaning of the Private Securities Litigation
Fourth Quarter and Full Year 2009
 Investor and analyst meeting: Fourth Quarter and Full Year 29 25 th February 21 2 The views expressed here contain some information derived from publicly available sources that have not been independently
Parques Reunidos Corporate Presentation March 2016
 Parques Reunidos Corporate Presentation March 216 Disclaimer The information contained in this presentation (the Presentation ), including but not limited to forward-looking statements, is provided as
Positive rental reversions in Hong Kong portfolio. Rising contribution from Singapore office portfolio. Strong performance from Residential business
 2012 Review The Group performed well in 2012 Positive rental reversions in Hong Kong portfolio Rising contribution from Singapore office portfolio Strong performance from Residential business 2 Highlights
MARRIOTT INTERNATIONAL 2017 SECURITY ANALYST MEETING. March 21, 2017
 MARRIOTT INTERNATIONAL 2017 SECURITY ANALYST MEETING March 21, 2017 FORWARD LOOKING STATEMENTS, NON GAAP FINANCIAL MEASURES, AND INFORMATION FOR 2016 AND 2015 This material contains forward looking statements
Great Portland Estates Trading Update Strong Operational Performance
 Press Release 6 July 2017 Great Portland Estates Trading Update Strong Operational Performance Great Portland Estates plc ( GPE ) today publishes its trading update for the quarter to 30 June 2017. Continued
Management Presentation. November 2013
 Management Presentation November 2013 Forward looking statements This presentation as well as oral statements made by officers or directors of Allegiant Travel Company, its advisors and affiliates (collectively
CROWN ANNOUNCES 2010 FULL YEAR RESULTS
 ASX / MEDIA RELEASE FOR IMMEDIATE RELEASE 26 August 2010 CROWN ANNOUNCES 2010 FULL YEAR RESULTS MELBOURNE: Crown Limited (ASX: CWN) today announced its results for the full year ended 30 June 2010: Normalised