Fishery statistics P O C K E T B O O K S. Data E D I T I O N KS-DW EN-C. Price (excluding VAT) in Luxembourg: EUR 10
|
|
|
- Josephine Griffin
- 5 years ago
- Views:
Transcription
")
1 KS-DW EN-C _Cover.pdf :05:48 C M P O C K E T B O O K S Fishery statistics E D I T I O N Data Y CM MY CY CMY K Price (excluding VAT) in Luxembourg: EUR 10 ISBN E U R O P E A N COMMISSION THEME Agriculture and Fisheries
2 Our mission is to provide the European Union with a high-quality statistical information service Eurostat publications cover nine themes: General and regional statistics Economy and finance Population and social conditions Industry, trade and services Agriculture and fisheries External trade Transport Environment and energy Science and technology Eurostat publications are divided into collections adapted to the needs of all users: Press releases: key figures on the EU, the Member States and their partners. They are provided free of charge. They are also available on the Internet as soon as they are published. Statistics in focus: up-to-date summaries of the main results of statistical surveys, studies and analyses. Pocketbooks: the main indicators on a theme or sub-theme in an easy-to-carry booklet. Panorama of the European Union: highlights the features and trends of a multisectoral theme or a sectoral sub-theme. Methods and nomenclatures: intended for specialists who want to consult the methodologies and nomenclatures used for a theme, a sub-theme or a sector. Detailed tables: statistical data for specialists compiled on a theme, subtheme or sector. Catalogues: rapid access to concise information on Eurostat s products and services.
3 SALES AND SUBSCRIPTIONS Publications for sale produced by the Office for Official Publications of the European Communities are available from our sales agents throughout the world. How do I set about obtaining a publication? Once you have obtained the list of sales agents, contact the sales agent of your choice and place your order. How do I obtain the list of sales agents? Go to the Publications Office website Or apply for a paper copy by fax (352)
4 E D I T I O N Fishery statistics Data E U R O P E A N COMMISSION THEME Agriculture and Fisheries Completo.pdf :09:36
5 Eurostat on the Internet Our website is updated daily. Visit it today and get: direct and free access to all Eurostat PDF publications; direct and free access to our databases; alert me customisable alerts; specialised access to short-term economic data; complete information on all Eurostat products and services. European Statistical Data Support Eurostat has set up with the members of the European statistical system a network of support centres which will exist in nearly all Member States as well as in some EFTA countries. Their mission is to provide help and guidance to Internet users of European statistical data. Contact details for this support network can be found on our Internet site. Media Support Eurostat Journalists can contact the media support service: Tel. (352) Fax (352) eurostat-mediasupport@cec.eu.int Europe Direct is a service to help you find answers to your questions about the European Union Freephone number (*): (*) Certain mobile telephone operators do not allow access to numbers or these calls may be billed. A great deal of additional information on the European Union is available on the Internet. It can be accessed through the Europa server ( Cataloguing data can be found at the end of this publication. Luxembourg: Office for Official Publications of the European Communities, 2005 ISBN ISSN European Communities, 2005 Printed in Belgium PRINTED ON WHITE CHLORINE-FREE PAPER
6 EUROSTAT L-2920 Luxembourg Tel. (352) Eurostat is the Statistical Office of the European Communities. Its task is to gather and analyse figures from the different European statistical offices in order to provide comparable and harmonised data for the European Union to use in the definition, implementation and analysis of Community policies. Its statistical products and services are also of great value to Europe s business community, professional organisations, academics, librarians, NGOs, the media and citizens. To ensure that the vast quantity of accessible data is made widely available and to help each user make proper use of the information, Eurostat has set up a publications and services programme. This programme makes a clear distinction between general and specialist users and particular collections have been developed for these different groups. The collections Press releases, Statistics in focus, Panorama of the European Union, Pocketbooks and Catalogues are aimed at general users. They give immediate key information through analyses, tables, graphs and maps. The collections Detailed tables and Methods and nomenclatures suit the needs of the specialist who is prepared to spend more time analysing and using very detailed information and tables. As part of the new dissemination policy, Eurostat has developed its website. All Eurostat publications are downloadable free of charge in PDF format from the website. Furthermore, Eurostat s databases are freely available there, as are tables with the most frequently used and demanded short- and long-term indicators. Eurostat has set up with the members of the European statistical system a network of support centres which will exist in nearly all Member States as well as in some EFTA countries. Their mission is to provide help and guidance to Internet users of European statistical data. Contact details for this support network can be found on our Internet site. Eurostat
7 For further information regarding the data contained in this publication please contact: David Cross; Unit E2: Agriculture Statistics Production; Directorate for Agriculture and Environment Statistics and Statistical Cooperation; EUROSTAT; L-2920 Luxembourg. Tel: Fax: Data extracted beginning October
8 TABLE OF CONTENTS Symbols and abbreviations 4 Preliminary remarks 5 Chart of FAO Major Fishing Areas 10 Tables Total production 12 Aquaculture production 14 Catches All regions 16 Northwest Atlantic 18 Northeast Atlantic 20 Eastern Central Atlantic 22 Mediterranean 24 Southwest Atlantic 26 Southeast Atlantic 28 Western Indian Ocean 30 Internal waters 32 Landings Quantities 34 Value 35 Foreign trade Imports: quantity 38 value 39 Exports: quantity 40 value 41 Trade balance: quantity 42 value 43 Fishing fleet Number 46 Total tonnage 47 Total power 48 Employment 50 Per caput supply 52 3 Completo.pdf :09:37
9 SYMBOLS AND ABBREVIATIONS - Nil 0 Data less than half the unit used : Data not available EU-25 EU-15 BE BLEU/UEBL CZ DK DE EE EL ES FR IE IT CY LV LT LU HU MT NL AT PL PT SI SK FI SE UK IS NO EEA BG HR RO TR CECAF FAO GFCM ICCAT ICES ICSEAF NAFO European Union (25 member countries) European Union (15 member countries) Belgium Belgo-Luxembourg Economic Union Czech Republic Denmark Germany Estonia Greece Spain France Ireland Italy Cyprus Latvia Lithuania Luxembourg Hungary Malta Netherlands Austria Poland Portugal Slovenia Slovak Republic Finland Sweden United Kingdom Iceland Norway European Economic Area (28 countries) Bulgaria Croatia Romania Turkey Fishery Committee for the Eastern Central Atlantic Food and Agriculture Organisation of the United Nations General Fisheries Commission for the Mediterranean International Commission for the Conservation of Atlantic Tunas International Council for the Exploration of the Sea International Commission for the Southeast Atlantic Fisheries Northwest Atlantic Fisheries Organisation 4
10 Introduction PRELIMINARY REMARKS Eurostat s fisheries data-base 1) on fishery statistics contains around time series and 28 million data items covering catches, landings, aquaculture production, the fishing fleets, foreign trade in fishery products, employment and supply balance sheets for fishery products. As far as data availability and resources permit, the contents of the data-base have been maximised in terms of the length of the time series and the country coverage. This publication is intended to summarise the fisheries data for the period for: - EU-15 Member States: Austria, Belgium, Denmark, Finland, France, Germany, Greece, Ireland, Italy, Luxembourg, the Netherlands, Portugal, Spain, Sweden and the United Kingdom. - EU-25 Member States: EU-15 plus Cyprus, Czech Rep., Estonia, Hungary, Latvia, Lithuania, Malta, Poland, Slovak Rep. and Slovenia. - EEA-28 countries: EU-25 plus Iceland, Liechtenstein and Norway. - EU Candidate Countries: Bulgaria, Croatia, Romania and Turkey. Data sources Eurostat s programme of fishery statistics is highly dependent on collaboration with other international organisations with responsibilities for fishery statistics. This collaboration is co-ordinated through the Co-ordinating Working Party on Fishery Statistics (CWP). Eurostat gratefully acknowledges this contribution to its programme of work without which the quantity and quality of data in the data-base on fishery statistics would be very restricted. While every effort has been made to provide complete, comparable and harmonised data in all topics covered in the data-base and in this publication, attention is drawn to the following notes which briefly indicate the definitions used in each of the topics covered and where care has to be exercised in the use of the data. 1) Eurostat s databases are available free of charge through the Eurostat internet site: 5
11 Total production Total production is the sum of the total catches and aquaculture production. See below for the notes on these two components of total production. Total production is recorded in the live weight equivalent of the production (for aquaculture) or of the landings (for catches). Aquaculture production Aquaculture is defined as the farming of aquatic organisms including fish, molluscs, crustaceans and aquatic plants. Farming implies some intervention in the rearing process to enhance production, such as regular stocking, feeding and protection from predators. Farming also implies individual or corporate ownership of, or rights resulting from contractual arrangements to, the stock being cultivated. For statistical purposes, aquatic organisms which are harvested by an individual or corporate body which has owned them throughout their rearing period contribute to aquaculture, while aquatic organisms which are exploited by the public as a common property resource, with or without appropriate licences, are the harvest of fisheries. The national authorities of EEA countries submit aquaculture production data to Eurostat under the terms of: Council Regulation (EC) no. 788/96 of 22 April 1996 on the submission by Member States of statistics on aquaculture production (OJ L108 of ) FAO receives aquaculture production data from national authorities on the FISHSTAT AQ questionnaire. This questionnaire uses the same concepts and definitions as the EU legislation and the data from the two sources are comparable. The FAO Fisheries Department performs a check on the quality of the data and makes the results available to Eurostat for inclusion in the NewCronos database. The data are recorded in the live weight equivalent of the product weight. 6
12 Catch Catch statistics are submitted to Eurostat by EEA member countries in compliance with the following EU legislation: Council Regulation (EEC) no. 1637/2001 of 23 July 2001 amending Regulation (EEC) no. 3880/91 on the submission of catch statistics by Member States fishing in the Northeast Atlantic. (OJ L222 of ) Council Regulation (EEC) no. 1636/2001 of 23 July 2001 amending Regulation (EEC) no. 2018/93 on the submission of catch and activity statistics by Member States fishing in the Northwest Atlantic. (OJ L222 of ) Council Regulation (EEC) no. 1638/2001 of 24 July 2001 amending Regulation (EEC) no. 2597/95 on the submission of catch statistics by Member States fishing in certain regions other than those of the North Atlantic (OJ L222 of ) All national authorities are requested to submit catch data to FAO and the appropriate regional organisations on a series of STATLANT questionnaires. These questionnaires use the same concepts and definitions as are used in the EU legislation. The regional organisations and FAO make the data for non-eea countries available to Eurostat. The national authorities are requested to submit catch statistics for all commercial, subsistence and recreational fisheries. However the reporting of data for recreational fisheries is known to be incomplete. The data are reported as the live weight equivalent of the landings (i.e. the landed weight of a product to which an appropriate conversion factor has been applied). The data therefore exclude quantities of fishery products which are caught but not landed. For example, fish caught but rejected at sea (a non-commercial species, under-sized fish, etc) or fish consumed on board the vessel are excluded. The flag of the fishing vessels is used as the primary indication of the nationality of the catch, though this concept may be varied in certain circumstances (for example, in the case of joint ventures and chartering of vessels). 7
13 Landings Each EEA member country reports monthly data on the quantities and values of fishery products landed in its ports under the terms of: Council Regulation no. 2104/93 of 22 July 1993 amending Regulation (EEC) no. 1382/91 on the submission of data on the landings of fishery products in Member States (OJ L191 of ) The data are the landings (expressed as the product weight) of all fishery products in the reporting country, regardless of the nationality of the vessel making the landings. Landings by vessels of the reporting country in foreign ports are excluded. Foreign trade Data for EEA Member States have been extracted from Eurostat s COMEXT foreign trade data-base. The data on the trade balance are probably underestimates. Apart from the fact that, in many situations, export data are less completely recorded than import data, two specific situations with regard to fisheries result in the under-reporting of exports: - trans-shipping of catches at sea to vessels of a different nationality, - landings by fishing vessels in foreign ports. Per capita supply The source of these data is the FAO Fisheries Circular FIDI/C821-Rev.7 (Fish and Fishery products: World Apparent Consumption based on Food Balance Sheets ). These balance sheets are compiled by FAO s Fisheries Department using the concept: Per capita food supply = Production + Imports Exports Non-Food Uses + Change in Stocks Resident population The data are expressed in kg live weight / head of population / year. The items are converted to the live weight equivalent from the landed weight or the product using appropriate conversion factors. Quantities of fish or other fishery products not used for human consumption (for example, fish used for the production of meal and oils or fish fed directly to animals) are excluded from the balance sheets. 8
14 Particular attention is drawn to the fact that the data are not a direct measure of the per capita consumption. The data result from the compilation of balance sheets and thus are dependent on the errors associated with each item of the balance sheets. Among the problems in compiling balance sheets for fishery products are obtaining data for the changes in stocks and the selection of appropriate factors for the conversion to the live weight equivalent. Fishing fleet The data for EU-15 Member States are tabulated from Eurostat s Statistical Register of Fishing Vessels which is up-dated annually from the administrative file of fishing vessels maintained by the European Commission s Directorate-General for Fisheries. Data for the new Member States are not included because they do not yet submit data to the administrative file of fishing vessels. Data for Iceland and Norway are compiled from fleet files submitted by the national authorities. During the period covered by these data the method of recording the tonnage of fishing vessels changed from the Gross Register Tonnage (Oslo Convention, 1947) to the Gross Tonnage (London Convention, 1969). These two measures can produce significantly different data. This change has taken place at differing rates in the Member States and thus care has to be exercised both in comparing data between countries and between years (in the latter case due to changes over time in the proportion of vessels being recorded in each of the units). Employment The data have been collected by FAO from the national authorities in the FISHSTAT FM questionnaire and have been published in FAO Fisheries Circular FIDI/C929-Rev.2 (Numbers of Fishers ). The national authorities are requested to submit data on the number of fishers (male and female) from both marine and inland fisheries and the number of employees in aquaculture production. It is known that there can be significant differences in the national sources of the data and in the definitions used. 9

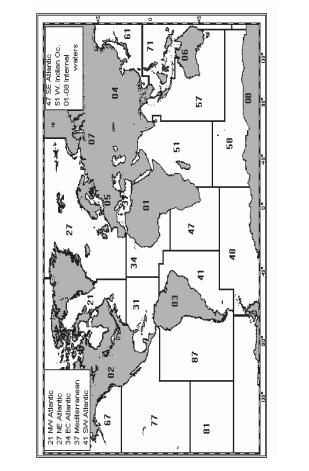
15 10 Map of Fishing Areas
16 TABLES
17 TOTAL PRODUCTION All fishery products tonnes live weight EU-25 : : EU : BE : CZ : DK DE : EE EL ES : FR IE IT : CY LV LT LU HU : MT NL : AT : PL : PT : SI : SK : FI SE UK IS : NO EEA : : BG HR : : RO : TR : World : 12
18 CONTENTS OF EUROSTAT'S DATA-BASE OF FISHERY STATISTICS Sector: Years: Periodicity: Species: Areas: Countries: Unit: Global Production 1950 onwards annual individually identified species by major fishing areas individually by all countries reporting catches in the area tonnes live weight Data Source :Eurostat and FAO Commentary In 2003 the EU-25 production of fishery products (capture fisheries and aquaculture production) was 5% of the world total. The 10 new Member States only contributed 9% to the total EU-25 production. Four of the EU-25 Member States (Denmark, France, Spain and the United Kingdom) accounted for 56% of the total production in The production in 2003 was about 11% less than the estimated total production in
19 TOTAL AQUACULTURE PRODUCTION All products tonnes live weight EU-25 : : EU : BE : CZ : DK DE : EE EL ES FR IE IT : CY LV LT LU HU MT NL : AT : PL : PT : SI : SK : FI SE UK IS : NO EEA : : BG HR : : RO : TR : World : 14
20 CONTENTS OF EUROSTAT'S DATA-BASE OF FISHERY STATISTICS Sector: Aquaculture production Years: 1984 onwards Periodicity: annual Species: individually identified species Areas: by major fishing areas Environment: freshwater, brackish water, marine water Countries: individually by all reporting countries Unit: tonnes live weight and value (ECU/EUR) Data source: Eurostat and FAO Commentary EU-25 aquaculture production was only 2.5% of the world production in (N.B. 89% of the total production was by Asian countries.) The EU-25 production increased by about 35% from In the same period the production in Norway (largely of Atlantic salmon) increased by 287%. Four Member States (France, Italy, Spain and the United Kingdom) accounted for 68% of the EU-25 production in
21 CATCHES All regions tonnes live weight * EU-25 : : EU : BE CZ : DK DE EE : EL ES : FR IE IT CY LV : LT : LU HU : MT NL AT : PL PT SI : SK : FI SE UK IS NO EEA : : BG HR : : RO : TR : World : * For 2004, captures from Inland Waters may be missing from the total for some countries 16
22 CONTENTS OF EUROSTAT'S DATA-BASE OF FISHERY STATISTICS Sector: Years: Periodicity: Species: Areas: Countries: Unit: Total catches 1950 onwards annual individually identified species by major fishing areas individually by all countries reporting catches in the area tonnes live weight Data source: Eurostat and FAO Commentary In 2003 EU-25 catches accounted for 6.6% of the world total. The 10 new Member States only accounted for 9.1% of the EU-25 catches in Between 1990 and 2003 the EU-25 catch decreased by an estimated 18%. Over the same period the combined catch of Iceland and Norway increased by 46% and the world production by 5%. 17
23 CATCHES Northwest Atlantic tonnes live weight EU-25 : EU BE CZ DK DE EE : EL ES FR IE IT CY LV : LT : LU HU MT NL AT PL PT SI SK FI SE UK IS NO EEA : BG HR RO TR World : 18
24 CONTENTS OF EUROSTAT'S DATA-BASE OF FISHERY STATISTICS Sector: Years: Periodicity: Species: Areas: Countries: Unit: Catches for the Northwest Atlantic (Major Fishing Area 21) 1950 onwards annual individually identified species by NAFO divisions and sub-divisions (1960 onwards) and by major fishing area (1950 onwards) individually by all countries reporting catches in the area tonnes live weight Data source: Eurostat, NAFO and FAO Commentary In 2003 the EU-25 catches in the Northwest Atlantic accounted for 8.5% of the total catches in the area. Due to the restriction of EU fishing to international waters and the imposition of stringent management measures, the EU-15 catch in the Northwest Atlantic is under 5% of the 1.2 million tonnes caught in % of the EU-15 catches from all areas were taken in the Northwest Atlantic in In 2003 this had fallen to just 1%. 19
25 CATCHES Northeast Atlantic tonnes live weight EU-25 : : EU : BE CZ DK DE EE : EL ES : FR IE IT CY LV : LT : LU HU MT NL AT PL PT SI SK FI SE UK IS NO EEA : : BG HR RO TR World : 20
26 CONTENTS OF EUROSTAT'S DATA-BASE OF FISHERY STATISTICS Sector: Years: Periodicty: Species: Areas: Countries: Unit: Catches for the Northeast Atlantic (Major Fishing area 27) 1950 onwards annual individually identified species. by ICES divisions and sub-divisions (1973 onwards) and by major fishing area (1950 onwards) individually by all countries reporting catches in the area tonnes live weight Data source: Eurostat, ICES and FAO Commentary The Northeast Atlantic is the most important fishing region for the EU-25 Member States with 71% of their catches being taken from this region in The EU-25 accounted for 40% of the total catch in the region in Iceland and Norway were the other main fishing nations (43% of the total for the region). Since 1990 the EU-25 catch in the Northeast Atlantic has fallen by around 14%. On the other hand, the combined catch of Iceland and Norway has risen by 46% in the same period. 21
27 CATCHES Eastern Central Atlantic tonnes live weight EU-25 : : EU : BE CZ DK DE EE : : EL ES : FR IE IT CY LV : LT : LU HU MT NL AT PL PT SI SK FI SE UK IS NO EEA : : BG HR RO TR World : 22
28 CONTENTS OF EUROSTAT'S DATA-BASE OF FISHERY STATISTICS Sector: Years: Periodicity: Species: Areas: Countries: Unit: Catches for the Eastern Central Atlantic (Major Fishing Area 34) 1950 onwards annual individually identified species by CECAF divisions and sub-divisions (from 1970) and by major fishing area (from 1950) individually by all countries reporting catches in the area tonnes live weight Data source: Eurostat, CECAF and FAO Commentary EU-25 Member States accounted for 17% of the total catches in the Eastern Central Atlantic in The EU-15 catches in 2003 showed a 19% decrease to those in This compares with a drop of 21% in the total catches from the region in the same period. In % of EU-25 catches were taken in the Eastern Central Atlantic. 23
29 CATCHES Mediterranean tonnes live weight EU-25 : : EU : BE CZ DK DE EE EL ES : FR IE IT CY LV LT LU HU MT NL AT PL PT SI : SK FI SE UK IS NO EEA : : BG HR : : RO : TR : World : 24
30 CONTENTS OF EUROSTAT'S DATA-BASE OF FISHERY STATISTICS Sector: Years: Periodicity: Species: Areas: Countries: Unit: Catches for the Mediterranean (Major Fishing Area 37) 1950 onwards annual individually identified species by GFCM divisions and sub-divisions (from 1970) and by major fishing area (from 1950) individually by all countries reporting catches in the area tonnes live weight Data source: Eurostat, GFCM and FAO Commentary In 2003 the EU-25 accounted for 34% of the total catch from the Mediterranean. 53% of the EU-25 catch was by Italy. The EU-25 catch decreased by about 19% in the period In the same period the total catch in the Mediterranean increased by 6%. Turkey accounted for 31% of the total catch in the Mediterranean in 2003, only a little less than the combined catch of the EU-25 Member States. 25
31 CATCHES Southwest Atlantic tonnes live weight EU : EU : BE CZ DK DE EE : EL ES : FR IE IT CY LV LT LU HU MT NL AT PL PT SI SK FI SE UK IS NO EEA : BG HR RO TR World : 26
32 CONTENTS OF EUROSTAT'S DATA-BASE OF FISHERY STATISTICS Sector: Years: Periodicity: Species: Areas: Countries: Unit: Catches for the Southwest Atlantic (Major Fishing Area 41) 1950 onwards annual individually identified species for the major fishing area individually by all countries reporting catches in the area tonnes live weight Data source: Eurostat and FAO Commentary The EU-25 Member States accounted for only 1.8% of the total catch in the Southwest Atlantic in Of this, 89% was caught by one Member State, Spain. Since 1990 the EU-25 catch has decreased by 85%. A major cause of this was the virtual withdrawal of the new Member States (Estonia, Latvia, Lithuania and Poland) from the fisheries of the region. On the other hand, there was little change in the total catch in the Southwest Atlantic between 1990 and 2003 (+ 0.9%). 27
33 CATCHES Southeast Atlantic tonnes live weight EU : EU : BE CZ DK DE EE EL ES : FR IE IT CY LV LT : LU HU MT NL AT PL PT SI SK FI SE UK IS NO EEA : BG HR RO TR World : 28
34 CONTENTS OF EUROSTAT'S DATA-BASE OF FISHERY STATISTICS Sector: Years: Periodicity: Species: Areas: Countries: Unit: Catches for the Southeast Atlantic (Major Fishing Area 47) 1950 onwards annual individually identified species by ICSEAF divisions and sub-divisions (from 1975) and by major fishing area ( from 1950) individually by all countries reporting catches in the area tonnes live weight Data source: Eurostat, ICSEAF and FAO Commentary EU-25 catches in the Southeast Atlantic in 2003 were 2% of the total catch in the region. Only five Member States (Poland, Portugal, France, Lithuania and Spain) fished in the region in This contrasts with the situation in 1990 when EU-25 catches accounted for 11% of the total. Six Member States fished in the region in that year and the EU-25 catch was over 4 times greater than in While the EU catch fell sharply in the period , the total catch in the region rose by 23% in the same period. 29
35 CATCHES Western Indian Ocean tonnes live weight EU : EU : BE CZ DK DE EE EL ES : FR IE IT CY LV LT LU HU MT NL AT PL PT SI SK FI SE UK IS NO EEA : BG HR RO TR World : 30
36 CONTENTS OF EUROSTAT'S DATA-BASE OF FISHERY STATISTICS Sector: Years: Periodicity: Species: Areas: Countries: Unit: Catches for the Western Indian Ocean (Major Fishing Area 51) 1950 onwards annual individually identified species for the major fishing area individually by all countries reporting catches in the area tonnes live weight Data source: Eurostat and FAO Commentary EU-25 Member States accounted for 7% of the catches in the Western Indian Ocean in Two Member States, France and Spain, were responsible for 95% of the EU catch. In the period the EU-25 catch increased by 62%. In the same period the total catches in the region increased by 30% 31
37 CATCHES Inland waters tonnes live weight EU-25 : : EU : BE : CZ : DK DE EE : EL : ES : FR : IE : IT CY : : LV LT : LU HU : MT : NL : AT : PL : PT : SI : SK : FI SE UK : IS : NO : EEA : : BG HR : : RO : TR : World : 32
38 CONTENTS OF EUROSTAT'S DATA-BASE OF FISHERY STATISTICS Sector: Years: Periodicity: Species: Areas: Countries: Unit: Catches in inland waters (Major Fishing Areas 01-08) 1950 onwards annual individually identified species by continent individually by all reporting countries tonnes live weight Data source: Eurostat and FAO Commentary In 2003 the EU-25 Member States catches from inland waters only accounted for 1.4% of the world catch from such waters and only 2.1% of the catches from all EU-25 fisheries. The contribution of the 10 new Member States to the EU-25 total from inland fisheries (32%) was relatively high compared with their contribution to the catches from marine regions (9%). 33
39 LANDINGS Total quantity tonnes product weight EU-25 : : : : : EU-15 : : : : : BE : CZ : DK : DE : : EE : : : : : EL : ES : : FR : : IE : : IT : CY : : : : : LV : : : : : LT : : : : : LU : HU : MT : : : NL : AT : PL : : : : : PT : SI : : : SK : FI : : SE : UK : IS : : NO : EEA : : : : : BG : : : : : HR : : : : : RO : : : : : TR : : : : : World : : : : : 34
40 LANDINGS Total value million ECU/EUR EU-25 : : : : : EU-15 : : : : : BE : CZ : DK : DE : : EE : : : : : EL : ES : : FR : : IE : : IT : CY : : : : : LV : : : : : LT : : : : : LU : HU : MT : : : 4 4 NL : AT : PL : : : : : PT : SI : : : 1 0 SK : FI : : SE : UK : IS : : NO : EEA : : : : : BG : : : : : HR : : : : : RO : : : : : TR : : : : : World : : : : : 35
41 CONTENTS OF EUROSTAT'S DATA-BASE OF FISHERY STATISTICS Sector: Years: Periodicity: Products: Countries: Unit: Landings from January 1992, at the earliest monthly all landings of fishery products, with details of products covered by EU Market Management regime EEA member countries only tonnes product weight and value (ECU/EUR) Data source: Eurostat Commentary Data are insufficiently complete to permit an analysis of trends. The value of the landings in Spain are nearly twice as much as that of the landings in any of the other EU-15 countries. Norway s landings have a value higher than that of all the EU-15 countries except Spain. 36
42 .
43 FOREIGN TRADE IN FISHERY PRODUCTS Total imports tonnes product weight EU-25 * : : EU-15 * BE : : BLEU : : : CZ : : DK DE EE : : EL ES FR IE IT CY : : LV : : LT : : LU : : HU : : MT : : NL AT PL : : PT SI : : SK : : FI SE UK IS NO EEA * : : BG : : HR : : : RO : : TR : : World : : : : : * EU and EEA totals include Intra and Extra EU-Trade 38
44 FOREIGN TRADE IN FISHERY PRODUCTS Total imports million ECU/EUR EU-25 * : : EU-15 * BE : : BLEU : : : CZ : : DK DE EE : : EL ES FR IE IT CY : : LV : : LT : : LU : : HU : : MT : : NL AT PL : : PT SI : : SK : : FI SE UK IS NO EEA * : : BG : : HR : : : RO : : TR : : World : : : : : * EU and EEA totals include Intra and Extra EU-Trade 39
45 FOREIGN TRADE IN FISHERY PRODUCTS Total exports tonnes product weight EU-25 * : : EU-15 * BE : : BLEU : : : CZ : : DK DE EE : : EL ES FR IE IT CY : : LV : : LT : : LU : : HU : : MT : : NL AT PL : : PT SI : : SK : : FI SE UK IS NO EEA * : : BG : : HR : : : RO : : TR : : World : : : : : * EU and EEA totals include Intra and Extra EU-Trade 40
46 FOREIGN TRADE IN FISHERY PRODUCTS Total exports million ECU/EUR EU-25 * : : EU-15 * BE : : BLEU : : : CZ : : DK DE EE : : EL ES FR IE IT CY : : LV : : LT : : LU : : HU : : MT : : NL AT PL : : PT SI : : SK : : FI SE UK IS NO EEA * : : BG : : HR : : : RO : : TR : : World : : : : : * EU and EEA totals include Intra and Extra EU-Trade 41
47 FOREIGN TRADE IN FISHERY PRODUCTS Trade balance tonnes product weight EU-25 * : : EU-15 * BE : : BLEU : : : CZ : : DK DE EE : : EL ES FR IE IT CY : : LV : : LT : : LU : : HU : : MT : : NL AT PL : : PT SI : : SK : : FI SE UK IS NO EEA * : : BG : : HR : : : RO : : TR : : World : : : : : * EU and EEA totals include Intra and Extra EU-Trade 42
48 FOREIGN TRADE IN FISHERY PRODUCTS Trade balance million ECU/EUR EU-25 * : : EU-15 * BE : : BLEU : : : CZ : : DK DE EE : : EL ES FR IE IT CY : : LV : : LT : : LU : : HU : : MT : : NL AT PL : : PT SI : : SK : : FI SE UK IS NO EEA * : : BG : : HR : : : RO : : TR : : World : : : : : * EU and EEA totals include Intra and Extra EU-Trade 43
49 CONTENTS OF EUROSTAT'S DATA-BASE OF FISHERY STATISTICS Sector: Years: Periodicity: Products: Flow: Countries: Unit: Foreign trade in fishery products from 1976 at the earliest annual for 10 major groups of fishery products imports, exports and trade balance all reporting countries tonnes product weight and value (ECU/EUR) Data source: Eurostat (Comext for EU-25 and EU-Candidate countries) and FAO (for the other countries) Commentary The EU-25 Member States have an overall negative balance in trade in fishery products, both in terms of volume and value, and this negative balance has increased in the period since 1990, with the exception of the latest year, Only five of the EU-25 Member States (Denmark, Estonia, Ireland, Latvia and the Netherlands) have positive balances in terms of the value. France, Germany, Italy, Spain and the United Kingdom are the biggest net importers of the EU Member States. 44
50 .
51 FISHING FLEET Number of vessels EU-25 : : : : EU-15 : BE CZ : : : : : DK DE EE : : : : EL : ES FR * IE IT : CY : : : : 897 LV : : : : 942 LT : : : : 304 LU : : : : : HU : : : : : MT : : : : NL AT : : : : : PL : : : : PT SI : : : : 148 SK : : : : : FI : SE : UK IS : : NO : : EEA : : : : BG : : : : : HR : : : : : RO : : : : : TR : : : : : World : : : : : * From 1997 the French data (and hence EU and EEA totals) include vessels of the French Overseas Departments 46
52 FISHING FLEET Total tonnage tons EU-25 : : : : EU-15 : BE CZ : : : : : DK DE EE : : : : EL : ES FR * IE IT : CY : : : : LV : : : : LT : : : : LU : : : : : HU : : : : : MT : : : : NL AT : : : : : PL : : : : PT SI : : : : 865 SK : : : : : FI : SE : UK IS : : NO : : EEA : : : : BG : : : : : HR : : : : : RO : : : : : TR : : : : : World : : : : : * From 1997 the French data (and hence EU and EEA totals) include vessels of the French Overseas Departments 47
53 FISHING FLEET Total power KW EU-25 : : : : EU-15 : BE CZ : : : : : DK DE EE : : : : EL : ES FR * IE IT : CY : : : : LV : : : : LT : : : : LU : : : : : HU : : : : : MT : : : : NL AT : : : : : PL : : : : PT SI : : : : SK : : : : : FI : SE : UK IS : : NO : : EEA : : : : BG : : : : : HR : : : : : RO : : : : : TR : : : : : World : : : : : * From 1997 the French data (and hence EU and EEA totals) include vessels of the French Overseas Departments 48
Pocketbooks. Fishery statistics. Data edition. EuropEan Commission. hery.indd :03:37
 Pocketbooks Fishery statistics Data 1990-2006 2007 edition EuropEan Commission hery.indd 1 20-12-2007 13:03:37 Europe Direct is a service to help you ind answers to your questions about the European Union
October 2013 compared with September 2013 Industrial production down by 1.1% in euro area Down by 0.7% in EU28
 10-2004 01-2005 04-2005 07-2005 10-2005 01-2006 04-2006 07-2006 10-2006 01-2007 04-2007 07-2007 10-2007 01-2008 04-2008 07-2008 10-2008 01-2009 04-2009 07-2009 10-2009 01-2010 04-2010 07-2010 10-2010 01-2011
EUROPEANS EXPERIENCE WITH USING SHIPS AND PERCEPTIONS OF MARITIME SAFETY
 Special Eurobarometer 422b EUROPEANS EXPERIENCE WITH USING SHIPS AND PERCEPTIONS OF MARITIME SAFETY SUMMARY Fieldwork: October 2014 Publication: March 2015 This survey has been requested by the European
in focus Statistics How Eur opeans go on Contents Main features INDUSTRY, TRADE AND SERVICES POPULATION AND SOCIAL CONDITIONS
 Statistics in focus INDUSTRY, TRADE AND SERVICES POPULATION AND SOCIAL CONDITIONS 18/2006 How Eur opeans go on holiday Main features In 2004, European tourists made on average at least two holiday trips
ATTITUDES OF EUROPEANS TOWARDS TOURISM
 Flash Eurobarometer ATTITUDES OF EUROPEANS TOWARDS TOURISM REPORT Fieldwork: January 213 Publication: March 213 This survey has been requested by the European Commission, Directorate-General for Enterprise
MAIS3+ assessment: Current practices around Europe
 MAIS3+ assessment: Current practices around Europe Klaus Machata SafetyCube workshop, The Hague, 24 May 2016 Co-funded by the Horizon 2020 Framework Programme of the European Union 5/31/2016 Data collection
March 2015 compared with February 2015 Volume of retail trade down by 0.8% in euro area Down by 0.6% in EU28
 03-2006 06-2006 09-2006 12-2006 03-2007 06-2007 09-2007 12-2007 03-2008 06-2008 09-2008 12-2008 03-2009 06-2009 09-2009 12-2009 03-2010 06-2010 09-2010 12-2010 03-2011 06-2011 09-2011 12-2011 03-2012 06-2012
Survey on the attitudes of Europeans towards tourism. Analytical report
 Flash Eurobarometer 328 The Gallup Organization Flash Eurobarometer European Commission Survey on the attitudes of Europeans towards tourism Analytical report Wave 3 Fieldwork: February 2011 Publication:
External Quality of Service Monitoring
 External Quality of Service Monitoring Improving the Quality of International Mail 2012 Results UNEX International letter performance continues to exceed objectives In 2012 European priority letter mail
Air transport in the EU27 Air passenger transport up by 0.6% in 2008 Declining trend through the year
 STAT/09/174 4 December 2009 Air transport in the EU27 Air passenger transport up by 0.6% in 2008 Declining trend through the year The total number of passengers 1 transported by air in the EU27 rose by
TRIPS OF BULGARIAN RESIDENTS IN ABROAD AND ARRIVALS OF VISITORS FROM ABROAD TO BULGARIA IN FEBRUARY 2011
 TRIPS OF BULGARIAN RESIDENTS IN ABROAD AND ARRIVALS OF VISITORS FROM ABROAD TO BULGARIA IN FEBRUARY 2011 In February 2011, the number of the trips of Bulgarian residents in abroad was 246.2 thousand or
Cumulative Investments by Sector. Cumulative Investment by Country. Industry, Commerce & Agribusiness 18% Transport 30% Natural Resources 2%
 Cumulative Investments by Sector Cumulative Investment by Country Industry, Commerce & Agribusiness 18% Transport 30% Natural Resources 2% SERBIA 45% KOSOVO 2% MONTENEGRO 6% Financial Institutions 30%
An overview of Tallinn tourism trends
 An overview of Tallinn tourism trends August 2015 The data is collected from Statistics Estonia, Tallinn Airport and Port of Tallinn. In August 2015, 179,338 stayed overnight in Tallinn s accommodation
TRIPS OF BULGARIAN RESIDENTS ABROAD AND ARRIVALS OF VISITORS FROM ABROAD TO BULGARIA IN FEBRUARY 2018
 TRIPS OF BULGARIAN RESIDENTS ABROAD AND ARRIVALS OF VISITORS FROM ABROAD TO BULGARIA IN FEBRUARY 2018 In February 2018, the number of the trips of Bulgarian residents abroad was 379.5 thousand (Annex,
TRIPS OF BULGARIAN RESIDENTS ABROAD AND ARRIVALS OF VISITORS FROM ABROAD TO BULGARIA IN NOVEMBER 2018
 TRIPS OF BULGARIAN RESIDENTS ABROAD AND ARRIVALS OF VISITORS FROM ABROAD TO BULGARIA IN NOVEMBER 2018 In November 2018, the number of the trips of Bulgarian residents abroad was 426.3 thousand (Annex,
The explanations of other terms used throughout the tables are contained in the section on Definitions immediately following the tables.
 FOREWORD 1 CONTENT 1.1 UK Airports - Annual Statements of Movements, Passengers and Cargo is prepared by the Civil Aviation Authority with the co-operation of the United Kingdom airport operators. The
TRIPS OF BULGARIAN RESIDENTS ABROAD AND ARRIVALS OF VISITORS FROM ABROAD TO BULGARIA IN OCTOBER 2017
 TRIPS OF BULGARIAN RESIDENTS ABROAD AND ARRIVALS OF VISITORS FROM ABROAD TO BULGARIA IN OCTOBER 2017 In October 2017, the number of the trips of Bulgarian residents abroad was 439.0 thousand (Annex, Table
TRIPS OF BULGARIAN RESIDENTS ABROAD AND ARRIVALS OF VISITORS FROM ABROAD TO BULGARIA IN NOVEMBER 2017
 TRIPS OF BULGARIAN RESIDENTS ABROAD AND ARRIVALS OF VISITORS FROM ABROAD TO BULGARIA IN NOVEMBER 2017 In November 2017, the number of the trips of Bulgarian residents abroad was 417.6 thousand (Annex,
TRIPS OF BULGARIAN RESIDENTS ABROAD AND ARRIVALS OF VISITORS FROM ABROAD TO BULGARIA IN JANUARY 2018
 TRIPS OF BULGARIAN RESIDENTS ABROAD AND ARRIVALS OF VISITORS FROM ABROAD TO BULGARIA IN JANUARY 2018 In January 2018, the number of the trips of Bulgarian residents abroad was 387.6 thousand (Annex, Table
CCBE LAWYERS STATISTICS 2016
 Austria 31/12/2015 6.057 1.242 Belgium (OBFG) How many s are 81-2 Bulgaria - 2 Croatia - 5 Czech Republic - 40 Germany - 1 Greece - 3 Hungary - 6 Italy - 1 Liechtenstein - 1 Lithuania - 2 The Netherlands
The economic impact of ATC strikes in Europe Key findings from our updated report for A4E
 pwc.com The economic impact of ATC strikes in Europe Key findings from our updated report for A4E Prepared for A4E Updates to our analysis since June 2016 Since releasing our Preliminary Findings in June
COMMUNICATION FROM THE COMMISSION TO THE COUNCIL
 EUROPEAN COMMISSION Brussels, 14.10.2016 COM(2016) 652 final COMMUNICATION FROM THE COMMISSION TO THE COUNCIL European Development Fund (EDF): forecasts of commitments, payments and contributions from
Dr. Violeta Vinceviciene, DG ENV D.2
 Urban Waste Water Treatment Directive implementation in the Member States Dr. Council Directive 91/271/EEC of 21-05 05-1991, as amended by Commission Directive 98/15/EC of 27-02 02-1998 http://europa.eu.int/comm/environment/water
Survey on the attitudes of Europeans towards tourism. Analytical report
 Flash Eurobarometer 258 The Gallup Organisation Analytical Report Flash EB No 258 Survey on the attitudes of Europeans towards tourism Flash Eurobarometer European Commission Survey on the attitudes of
JAR-145: APPROVED MAINTENANCE ORGANISATIONS. Please find attached a copy of Amendment 6 to JAR-145, effective 1 November 2004.
 oint Aviation Authorities Postal Address: P.O. Box 3000 2130 KA Hoofddorp Visiting Address: Saturnusstraat 8-10 The Netherlands Tel.: 31 (0)23-5679700 Fax: 31 (0)23-5621714 Our reference number: 07/03-11
EU Report. Europe JANUARY 2017
 H EU Report Europe JANUARY 2017 ANALYSIS OF HOTEL RESULTS JANUARY 2017 Overall improvement in the European hospitality industry The European industry starts the year on a positive note, with indicators
EU-Russia summit Strong recovery of trade in goods between EU27 and Russia in 2011 An EU27 deficit of 91 bn euro with Russia in 2011
 STAT/2/82 June 202 EU-Russia summit Strong recovery of trade in goods between EU27 and Russia in 20 An EU27 deficit of 9 bn euro with Russia in 20 Following a sharp fall in 2009, EU27 trade in goods with
Europeans and Tourism - Autumn Analytical Report
 Flash Eurobarometer European Commission Europeans and Tourism - Autumn 2009 Analytical Report Fieldwork: September 2009 Publication: October 2009 Flash Eurobarometer 281 The Gallup Organisation This survey
% change vs. Dec ALL VISITS (000) 2,410 12% 7,550 5% 31,148 1% Spend ( million) 1,490 15% 4,370-1% 18,710 4%
 2,410 12% 7,550 5% 31,148 1% Spend ( million) 1,490 15% 4,370-1% 18,710 4%") HEADLINES FULL YEAR 2012 (PROVISIONAL) 1 Overall visits 31.148 million visits making 2012 the best year for inbound tourism since 2008 but not a record. 1% increase in visits on 2011 (30.798 visits) slightly
HEADLINES FULL YEAR 2012 (PROVISIONAL) 1 Overall visits 31.148 million visits making 2012 the best year for inbound tourism since 2008 but not a record. 1% increase in visits on 2011 (30.798 visits) slightly
Organization for Security and Co-operation in Europe
 SEC.GAL/19/13 6 February 2013 OSCE+ ENGLISH only Organization for Security and Co-operation in Europe Office of the Secretary General Section for External Co-operation Vienna, 6 February 2013 To: Delegations
ENGLISH. Lombardia in Europe REGIONAL STATISTICAL YEARBOOK
 WWW.ASR-LOMBARDIA.IT ENGLISH Lombardia in Europe REGIONAL STATISTICAL YEARBOOK 2O11 Director-General Antonio Vincenzo Lentini Technical and Scientific Committee Rosalia Coniglio, Antonio Vincenzo Lentini,
Common Market Organisation (CMO) Fruit and vegetables sector Evolution of EU prices of some F&V products
 Fruit and vegetables sector Evolution of EU prices of some F&V products") Common Market Organisation (CMO) Fruit and vegetables sector Evolution of EU prices of some F&V products Unit C.2. - Wine, spirits, horticultural products, specialised crops DG Agriculture and Rural Development
Common Market Organisation (CMO) Fruit and vegetables sector Evolution of EU prices of some F&V products Unit C.2. - Wine, spirits, horticultural products, specialised crops DG Agriculture and Rural Development
PRESS RELEASE. ARRIVALS OF NON-RESIDENTS IN GREECE: January - June 2016 HELLENIC REPUBLIC HELLENIC STATISTICAL AUTHORITY. Piraeus, 13 October 2016
 HELLENIC REPUBLIC HELLENIC STATISTICAL AUTHORITY Piraeus, 13 October 2016 PRESS RELEASE ARRIVALS OF NON-RESIDENTS IN GREECE: January - June 2016 According to the Frontier Statistical Survey conducted by
New wiiw forecast for Central, East and Southeast Europe,
 Wiener Institut für Internationale Wirtschaftsvergleiche The Vienna Institute for International Economic Studies www.wiiw.ac.at Press Conference, 3 July 1 New wiiw forecast for Central, East and Southeast
Next Release: 13 April Next Release: 13 April December
 43070 Next Release: 13 April 2018 Next Release: 13 April 2018 December Date of publication: 15 March 2018 TABLE OF CONTENTS Charts 1 Gross consumption of natural gas by OECD region 3 2 Indigenous production
CAP CONTEXT INDICATORS
 CAP CONTEXT INDICATORS 2014-2020 34. NATURA 2000 AREAS 2017 update CONTEXT INDICATOR 34: NATURA 2000 AREAS In 2016, the Natura 2000 sites (SPAs + SCIs) covered 18.2 % of the terrestrial area of the EU-
EU Report. Europe JANUARY 2019
 H EU Report Europe JANUARY 2019 ANALYSIS OF HOTEL RESULTS JANUARY 2019 A cloud on the horizon for European hoteliers The year is off to a slow start for European hoteliers who post less encouraging results
Please find attached a copy of JAR-66 Amendment 2 dated February 2007.
 oint Aviation Authorities Postal Address: P.O. Box 3000 2130 KA Hoofddorp Visiting Address: Saturnusstraat 50 The Netherlands Tel.: 31 (0)23-5679700 Fax: 31 (0)23-5621714 Our reference number: 01106evd
Legal and Institutional Aspects of ATM in Europe. Roderick D. van Dam Head of Legal Service EUROCONTROL
 Legal and Institutional Aspects of ATM in Europe Roderick D. van Dam Head of Legal Service EUROCONTROL EUROCONTROL: European Organisation for the Safety of Air Navigation Coordination and integration -
GODINA XI SARAJEVO, BROJ 2 TOURISM STATISTICS. Tourism in BIH, February 2017
 number of nights GODINA XI SARAJEVO, 06.04.2017. BROJ 2 TOURISM STATISTICS Tourism in BIH, February 2017 In February 2017 tourists realised 56,042 tourist arrivals in Bosnia and Hercegovina which represent
Rules for reimbursement of expenses for delegates attending meetings
 16 March 2017 EMA/MB/144136/2017 Management Board meeting of 16 March 2017 Rules for reimbursement of expenses for delegates attending meetings With effect from 01 April 2017 THE MANAGEMENT BOARD HAVING
Tourist flow in Italy Year 2017
 27 November 2018 Tourist flow in Italy Year 2017 The National Institute of Statistics releases data on tourist flows and their features in 2017 from a supply 1 and demand-side 2 perspective. In 2017, around
JAR-147: APPROVED MAINTENANCE TRAINING/EXAMINATIONS. Please find attached a copy of JAR-147 Amendment 3 dated February 2007.
 oint Aviation Authorities Postal Address: P.O. Box 3000 2130 KA Hoofddorp Visiting Address: Saturnusstraat 50 The Netherlands Tel.: 31 (0)23-5679700 Fax: 31 (0)23-5621714 Our reference number: 01406evd
CEFS SUGAR STATISTICS 2010
 COMITE EUROPEEN DES FABRICANTS DE SUCRE 182, Av de Tervueren B - 1150 BRUSSELS Tel: 32 2 762 07 60 Fax: 32 2 771 00 26 E-mail: cefs@cefs.org Website: www.cefs.org CEFS SUGAR STATISTICS 2010 INDEX CEFS
Travel Policy Fly America Act Compliance Presentation. Presented by: Travel Services
 Travel Policy Fly America Act Compliance Presentation Presented by: Travel Services Travel on Federal Funds Federal regulations require (coach or equivalent), the lowest commercial discount airfare to
CABOTAGE GUIDELINES. Hauliers from Croatia are covered by a ban on cabotage until the end of June 2017.
 June 2015 CABOTAGE GUIDELINES Guidelines on the rules on road cabotage in Regulation No. 1072/2009 of the European Parliament and of the Council on common rules for access to the international road haulage
JAR-21: CERTIFICATION PROCEDURES FOR AIRCRAFT AND RELATED PRODUCTS AND PARTS. Please find attached a copy of JAR-21 Amendment 7 dated February 2007.
 oint Aviation Authorities Postal Address: P.O. Box 3000 2130 KA Hoofddorp Visiting Address: Saturnusstraat 50 The Netherlands Tel.: 31 (0)23-5679700 Fax: 31 (0)23-5621714 Our reference number: 00106evd
Tourist flow in Italy Year 2016
 27 October 2017 Tourist flow in Italy Year 2016 The National Institute of Statistics releases data on tourist flows and their features in 2016 from the point view of supply 1 and demand 2 side. In 2016,
The impact of economic crisis on air transport Dragotă Violeta Gianina PhD Buzilă Nicoleta PhD Gordean Raoul Sabin PhD student Dogan Mihaela
 The impact of economic crisis on air Dragotă Violeta Gianina PhD Tibiscus University Timişoara, Faculty of Economic Sciences Buzilă Nicoleta PhD Tibiscus University Timişoara, Faculty of Economic Sciences
European Organisation for the Safety of Air Navigation Central Route Charges Office (CRCO) Report on the Operation of the Route Charges System in 2016
 Report on the Operation of the Route Charges System in 2016") European Organisation for the Safety of Air Navigation Central Route Charges Office (CRCO) Report on the Operation of the Route Charges System in 2016 March 2017 TABLE OF CONTENTS EUROCONTROL CHARGING
European Organisation for the Safety of Air Navigation Central Route Charges Office (CRCO) Report on the Operation of the Route Charges System in 2016 March 2017 TABLE OF CONTENTS EUROCONTROL CHARGING
MARKET NEWSLETTER No 57 January 2012
 OVERVIEW OF INTRA-EUROPEAN UNION TRADING BETWEEN 2007/08 AND 2010/11 The data on intra-eu trade reported in this month s newsletter have been taken from the EUROSTAT database. However, it is important
International Green Week January, Berlin
 International Green Week 2018 19 28 January, Berlin Content 1. General Information 2. Exhibitors 3. Visitors 4. Your Benefit Messe Berlin GmbH 180,000 m² of hall area 100,000 m² of outdoor display area
Going Beyond GDP and Measuring Poverty: new challenges ahead
 Going Beyond GDP and Measuring Poverty: new challenges ahead Michail Skaliotis Eurostat 20 th Statistical Days - Measuring the Well-being and the Progress of Society - Radenci 8-10 Nov. 2010 1 Why is it
Maritime ports freight and passenger statistics
 Maritime ports freight and passenger statistics Statistics Explained Data from March 2018. Planned update: January 2019. This article presents the latest statistical data on freight handling and passenger
irport atchment rea atabase
 irport atchment rea atabase Examples 539 Airports Four range sizes 50, 75, 100 and 150 km. Time series 00-015 30+ variables About ACAD The database contains catchment area information for 539 European
FINLAND. Table 1. FDI flows in the host economy, by geographical origin. (Millions of US dollars)
") Table 1. FDI flows in the host economy, by geographical origin World 3 732 8 046 3 319 2 823 4 750 7 652 12 451-1 144 718 7 359 2 550 4 158 Developed economies 3 638 8 003 2 382 2 863 4 934 7 258 12 450-855
Table 1. FDI flows in the host economy, by geographical origin World 3 732 8 046 3 319 2 823 4 750 7 652 12 451-1 144 718 7 359 2 550 4 158 Developed economies 3 638 8 003 2 382 2 863 4 934 7 258 12 450-855
IMD World Talent Report Factor 1 : Investment and Development
 THAILAND 2012 2013 2014 2015 2016 Overall Investment & Development Appeal Rank 2016 37 42 24 Readiness 49 of 61 Factor 1 : Investment and Development Total Public Expenditure on Education Percentage of
ROAD SAFETY MANAGEMENT AND DATA SYSTEMS
 PIARC International Road Safety Seminar Beijing, 18 th 2 th of October 25 ROAD SAFETY MANAGEMENT AND DATA SYSTEMS DR. JOSEF MIKULIK (mikulik@cdv.cz) DIRECTOR TRANSPORT RESEARCH CENTRE (CDV) BRNO, CZECH
assists in the development of airport capacity to meet growing demand supports the development of improved ground access to airports
 ATAG The Air Transport Action Group (ATAG) is a coalition of organisations from throughout the air transport industry, formed to press for economically beneficial aviation capacity improvements in an environmentally
EUROCONTROL. Visit of the Transport Attachés. 10 April Frank Brenner. Director General EUROCONTROL
 EUROCONTROL Visit of the Transport Attachés 10 April 2015 Frank Brenner Director General EUROCONTROL One day s traffic EUROCONTROL - Visit of the Transport Attachés - 10 April 2015 2 ATM Today Air Transport
SLOVAKIA. Table 1. FDI flows in the host economy, by geographical origin. (Millions of US dollars)
") Table 1. FDI flows in the host economy, by geographical origin World 1 271 4 095 1 060 1 058 714 4 693 3 267 4 692-6 1 769 3 491 2 825 Developed economies 1 204 4 050 1 036 1 113 485 4 265 1 001 5 084-881
Table 1. FDI flows in the host economy, by geographical origin World 1 271 4 095 1 060 1 058 714 4 693 3 267 4 692-6 1 769 3 491 2 825 Developed economies 1 204 4 050 1 036 1 113 485 4 265 1 001 5 084-881
The Nordic Countries in an International Comparison. Helga Kristjánsdóttir 20. apríl 2012
 The Nordic Countries in an International Comparison Helga Kristjánsdóttir 20. apríl 2012 15 Figure 1. World Bank, GDP growth (annual %) 10 5 0 1961 1963 1965 1967 1969 1971 1973 1975 1977 1979 1981 1983
Survey on arrivals and overnight stays of tourists, total 2017
 MONTENEGRO STATISTICAL OFFICE R E L E A S E No: 34/2 Podgorica, 1 June 2018 When using the data please name the source Survey on arrivals and overnight stays of tourists, total In Montenegro, in, tourist
Network Management, building on our experience of flow management and network planning.
 Network Management, building on our experience of flow management and network planning. Giovanni Lenti Head of Network Operation Services The European Organisation for the Safety of Air Navigation Air
! " in focus. Statistics. Air transport between the EU and the USA. Contents TRANSPORT 7/2006. Highlights. Author Luis DE LA FUENTE LAYOS
 Air transport between the EU and the USA!!!!!!!!!!!!!!!!!!!!!!!!!!!!!!!!!!!!!!!!!!! Statistics in focus Graph 1: Evolution of total passenger transport to/from the USA 50 000 000 EU-15 EU-25 45 000 000
Fly America and Open Skies. For Travel on Federal Sponsored Awards
 Fly America and Open Skies For Travel on Federal Sponsored Awards University and Sponsor Travel Policies Federal regulations require the customary standard commercial airfare (coach or equivalent), or
FACTS & FIGURES ISE 2016
 FACTS & FIGURES ISE 2016 The first four-day Integrated Systems Europe exhibition was an unqualified success. In drawing over 65,000 registered attendees to interact with over 1,100 exhibitors it officially
DIRECTORATE CIVIL-MILITARY ATM COORDINATION. FLEXIBLE USE of AIRSPACE in EUROPE «Challenges»
 DIRECTORATE CIVIL-MILITARY ATM COORDINATION FLEXIBLE USE of AIRSPACE in EUROPE «Challenges» Olivier Mrowicki CHISINAU 4th August 2009 1 Report of the PRC in 2007 Objective: Review of civil-military use
Travel Policy Fly America Act Compliance Presentation. Presented by: Travel Services
 Travel Policy Fly America Act Compliance Presentation Presented by: Travel Services Agenda Fly America Act Exceptions Open Skies Agreement Documentation Requirements Good News and Bad News CTP demo 3 Travel
Please find attached a copy of JAR-25 Amendment 20 dated December 2007.
 oint Aviation Authorities Postal Address: P.O. Box 3000 2130 KA Hoofddorp Visiting Address: Saturnusstraat 40-44 The Netherlands Tel.: 31 (0)23-5679790 Fax: 31 (0)23 5657731 www.jaa.nl January 2008 JAR-25
International Operations: NATA 2012 Air Charter Summit
 International Operations: NATA 2012 Air Charter Summit Larry Williams Senior Trip Owner Charter Management Blue Team Universal Weather and Aviation, Inc. Agenda Session Objective Discuss current hot topics
JAR-23: NORMAL, UTILITY, AEROBATIC, AND COMMUTER CATEGORY AEROPLANES. Please find attached a copy of JAR-23 Amendment 3 dated February 2007.
 oint Aviation Authorities Postal Address: P.O. Box 3000 2130 KA Hoofddorp Visiting Address: Saturnusstraat 50 The Netherlands Tel.: 31 (0)23-5679700 Fax: 31 (0)23-5621714 Our reference number: 00306evd
Slide 1. Slide 2. Slide 3 FLY AMERICA / OPEN SKIES OBJECTIVES. Beth Kuhn, Assistant Director, Procurement Services
 Slide 1 FLY AMERICA / OPEN SKIES Research Administrator Conference April 9, 2014 Clayton Hall Slide 2 Beth Kuhn, Assistant Director, Procurement Services Cindy Panchisin, Sponsored Research Accountant,
O 2 Call Options Explained
 March 2013 www.nimans.net/networkservices Tel: 01937 847 500 O 2 Call Options Explained International & Roaming UK To Abroad (UK based calls) International Favourites DISE Only The International Favourites
COMMISSION OF THE EUROPEAN COMMUNITIES REPORT FROM THE COMMISSION
 COMMISSION OF THE EUROPEAN COMMUNITIES Brussels, 24.02.2000 COM(2000) 99 final REPORT FROM THE COMMISSION THIRD REPORT ON THE IMPLEMENTATION OF COUNCIL REGULATION 3577/92 APPLYING THE PRINCIPLE OF FREEDOM
ELEVENTH AIR NAVIGATION CONFERENCE. Montreal, 22 September to 3 October 2003
 4/8/03 English, French, Russian and Spanish only * ELEVENTH AIR NAVIGATION CONFERENCE Montreal, 22 September to 3 October 2003 Agenda Item 3: 3.1 : Air traffic management (ATM) performance targets for
Adequate information for tourism will help us to:
 1 Adequate information for tourism will help us to: Provide a realistic diagnosis of the baseline situation: Statistics are required to define the characteristics of our destination, the number of tourists
The World Pasta Industry in 2011
 The World Pasta Industry in 2011 Survey The World Pasta Industry in 2011 25 October 2012 1 Like every year, we have completed our Annual Survey on the World Pasta Industry. We would like to thank all the
Fuel consumption & fuel cost for different vessel types and Member States Key message
 Fuel consumption & fuel cost for different vessel types and Member States Key message It is difficult to compare the use of fuel between the different fleets in different Member States without a very detailed
Tourist arrivals and overnight stays in collective accommodation 1 July 2017 (p)
") Jul-16 Aug-16 Sep-16 Oct-16 Nov-16 Dec-16 Jan-17 Feb-17 Mar-17 Apr-17 May-17 Jun-17 Jul-17 MONTENEGRO STATISTICAL OFFICE R E L E A S E No: 158 Podgorica, 31 August 2017 When using the data please name
Jul-16 Aug-16 Sep-16 Oct-16 Nov-16 Dec-16 Jan-17 Feb-17 Mar-17 Apr-17 May-17 Jun-17 Jul-17 MONTENEGRO STATISTICAL OFFICE R E L E A S E No: 158 Podgorica, 31 August 2017 When using the data please name
EU Report. Europe SEPTEMBER 2018
 H EU Report Europe SEEMR 2018 ANALYSIS OF HOTEL RULTS SEEMR 2018 An Indian summer for hotels Hospitality activity is good this Fall 2018, confirming the stability of all destinations since the beginning
Chit Chats clients save up to 70% on U.S. and international postage.
 ATLANTIC CANADA RATE CARD 2018 Prices are valid from January 21, 2018 Chit Chats clients save up to 70% on U.S. and international postage. Ship your package to the U.S. as if you were in the U.S. Packages
European Performance Scheme
 European Performance Scheme Global Challenges to Improve Air Navigation Performance Asilomar Conference Grounds, Pacific Grove, CA 12 February 2015 Rolf TUCHHARDT European Commission, DG MOVE The SES policy
TAIEX. Institution Building support for Agriculture and Rural Development by Twinning and TAIEX. Institution Building Unit DG Enlargement
 TAIEX Institution Building support for Agriculture and Rural Development by Twinning and TAIEX Institution Building Unit DG Enlargement Our Mission Statement Support beneficiary countries in understanding,
SES Performance Scheme
 SES Performance Scheme 12 th Florence Rail Forum 2 May 2016 Rolf TUCHHARDT European Commission, DG MOVE The Single European Sky policy initiative to improve the overall performance of air traffic management
INTERNATIONAL TRAVEL AND TOURISM
 INTERNATIONAL TRAVEL AND TOURISM YEAR 2014 1. INTRODUCTION This issue of the Economic and Social Indicators presents data on International Travel and Tourism for the year 2014. A brief on the compilation
European General Aviation Conference Schonhagen Airport. Martin Robinson CEO AOPA UK Deputy Vice President IAOPA Europe Berlin 15 th May 2006
 European General Aviation Conference Schonhagen Airport Martin Robinson CEO AOPA UK Deputy Vice President IAOPA Europe Berlin 15 th May 2006 Content What is General Aviation & Aerial Work Operations? Who
Industrial Statistics of Lifts and Escalators. Ebru Gemici-Loukas, VDMA ASANSÖR, Istanbul 27. March 2015
 Industrial Statistics of Lifts and Escalators Ebru Gemici-Loukas, VDMA ASANSÖR, Istanbul 27. March 2015 Basic and Industrial Statistics 2013 BASIC STATISTICS 2013 ESTIMATED TOTAL MARKET (*) 2012 2013 Country
Global Travel Trends 2005
 Preliminary World Travel Monitor Results from IPK international for the ITB Berlin Message, 03/10/06 Global Travel Trends 2005 Based on the new data from the 2005 World Travel Monitor, and as it does every
Institute for Leisure Economics
 Institute for Leisure Economics Tourist Impulse Monitor (TIM) Europe 2006 Image, attractiveness, prospects of European countries in the mind of German tourists Speakers: Jens-Jörgen Middeke (General Manager)
Tourism in Israelan. & Employment in Tourism Industries. outline
 & Employment in Tourism Industries Tourism in Israelan outline "Committee on Statistics and Macroeconomic Analysis in Tourism" 8th meeting 26-28/3/2007 Esther Sultan Israel Ministry of Tourism, Tilda Khait
KLAIPEDA GATEWAY TO THE EUROPEAN MARKET
 KLAIPEDA GATEWAY TO THE EUROPEAN MARKET KLAIPEDA VAIDAS VELYKIS BUSINES S D E V E LO P M E N T M A N A G E R EXCELLENT COMBINATION FAST DISTRIBUTION LOW COSTS HIGH QUALITY WHERE ONE BELT MEETS ONE ROAD
EUROCONTROL Short- and Medium-Term Forecast of Service Units: February 2011 Update
 Summary: This document presents the forecast of total service units in Europe 1 for 2011-2015 prepared by EUROCONTROL\STATFOR (Statistics and Service of EUROCONTROL). This forecast aims principally to
Aerodays 2011 Madrid, 30 March Dr. Mathias Stranznbach The Federal Ministry of Economics and Technology - BMWi
 Aerodays 2011 Madrid, 30 March 2011 Dr. Mathias Stranznbach The Federal Ministry of Economics and Technology - BMWi Key data: Duration: 3 years (01.01.2010-31.12.2012) Budget: 1,9 Mio EUR Consortium: Participating
Call Type PAYU1 PAYU2 PAYU3 Out Of Bundle
 Jan-18 Mobile Tariff Information Headline Rates Call Type PAYU1 PAYU2 PAYU3 Out Of Bundle Calls to Own Mobiles 1p 1p 1p 1p Calls to Own Landlines 1p 1p 1p 1p Calls to UK Landlines (Starting 01, 02, 03)
Context Scope Procurement approach Topics for discussions Timeline. EDA/ESA UAS Workshop May
 Upcoming feasibility studies Context Scope Procurement approach Topics for discussions Timeline EDA/ESA UAS Workshop May 2009 1 Context now 2 Satellite-UAS cooperative missions study Letter of Exchange
Sustainable Mobility in the Danube region From Coordination and Cooperation to Co-Action
 The EU Strategy for the Danube Region Priority Area 1b Sustainable Mobility in the Danube region From Coordination and Cooperation to Co-Action Franc Žepič, PAC 1b Ministry of Infrastructure, Slovenia
Filoxenia Conference Centre Level 0
 Filoxenia Conference Centre Level 0 Stair 3/Lift 2 First Aid Board of Governors Secretariat Stair 3 Stair 4 Stair 4 (to level 1 only at Level -1) Lift 2 CSO Team Office Zenon Kitievs A Zenon Kitievs B
LifeWatch, costing and funding. The LifeWatch e-infrastructure financial issues
 LifeWatch, costing and funding The LifeWatch e-infrastructure financial issues LIFEWATCH architecture providing infrastructure services to users User groups can create their own e- laboratories or e-services
IUMI 2005 Amsterdam Facts & Figures Committee
 Report on Marine Insurance Premium 23 and 24 IUMI 25 Amsterdam Facts & Figures Committee Tore Forsmo, Managing Director Astrid Seltmann, Analyst The Central Union of Marine Underwriters, Oslo, Norway Thanks