AMSTERDAM. Yearbook: Summary Results 180
|
|
|
- Bonnie May
- 6 years ago
- Views:
Transcription
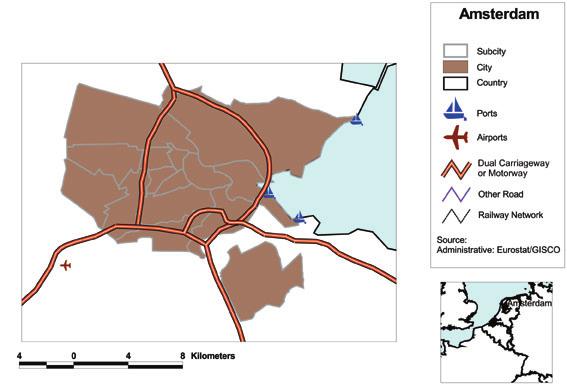
1 AMSTERDAM Amsterdam is the capital of the Netherlands and the country's cultural, financial and commercial services centre. The NUTS 3 Greater-Amsterdam region is located in the northern part of the predominantly urban agglomeration of Randstad. Of its 1.3 million inhabitants, 720,000 live in the city of Amsterdam. In 1998, Amsterdam and its region provided employment to 800,000 people, of which about 60% worked in the city itself. Banking, business and related services, the tourism industry and publishing are major employers in Amsterdam, together with transport/distribution and the public sector. In the service industry, information science and telematics are the growing sectors. Amsterdam also has almost 40 pan-european telephone call-centres. The greater Amsterdam Area includes approximately 1,400 foreign companies as well as major Dutch companies such as Philips, Heineken, KLM Royal Dutch Airlines, ABN AMRO Holding and ING Group. In the Amsterdam region, the unemployment rate is greater than the national average. Unemployment, however, has decreased in the city of Amsterdam. A further fall in unemployment is expected, due to the anticipated job growth and the substantial replacement of full-time jobs by part-time work. This improvement is expected to be stronger in Amsterdam than at the national level. Due to the presence of two universities, many students live in Amsterdam. In 1998, the city experienced a population growth, which was mainly due to inward migration of non-nationals. Non-nationals have become the predominant population in some districts of the city, creating ethnic and cultural diversity. Transport links within the region are extensive but congested. Projects are under way, or have been completed, to expand the rail network on the southern rim and to restrict the use of cars in the city centre. The government is also expanding the underground metro system. International transport and distribution links are well developed. As well as the international airport of Schiphol, Amsterdam has the largest non-tidal harbour in Europe. There are projects to construct a high-speed rail links with France and Germany. Amsterdam has many cultural facilities such as museums, theatres, cinemas and concerts. Many of the most important Dutch museums are in Amsterdam, including the Rijksmuseum, the Vincent van Gogh Museum and the nationally renowned Municipal Museum. In addition, several venues like the Royal Palace and the Nieuwe Kerk, with many art exhibitions, are also popular. Artis is a major Dutch zoo. Local authorities in the Netherlands are responsible for water, rail, road and public transport infrastructure, and social and community services. The City of Amsterdam is divided into 14 sub-city districts each with their own administration. The `stadsdelení have responsibilities mainly in the field of administrative duties, local spatial planning and maintenance of public areas. The city is governed by the City Council, which is led by the Mayor and Aldermen. The Mayor is not democratically chosen, but is appointed by the Queen. The Aldermen are chosen from the elected councillors. Yearbook: Summary Results 180
2
3 Individual City Audit Summary Amsterdam INDICATORS CITY LEVEL SUB-CITY 1 DATA QUALITY/ Comparison with UA cities 3 COMPARABILITY Score cases 4 Area 1 Area 2 Range/ Ratio 5 DQ 6 CNC 7 Total resident population (1996) Population change ( ) (%) Proportion of population less than 16 years old and above retirement age (%) (1996) pp Proportion of non-nationals (%) (1996) Proportion of non-eu nationals (%) (1996) Average size of households (1996) Female activity rate (%) (1996) Proportion of population of working age in employment (%) (1996) Unemployment rate (%) (1996) N.Av1 N.Av1 N.Av1 pp Proportion of unemployed who are less than pp years old (%) (1996) 313 Median weekly household income (1996) (euro, 1998 prices) Proportion of households receiving less than half of the national average household income (%) (1996) Proportion of households owning or buying their own dwellings (%) (1994) Ratio of average house prices to average annual household income (1994) : 1.43 ra (NET) pp 6.9:1 18 Life expectancy at birth (years) N.Av1 32 N.Av1 N.Av1 N.Av1 ra Total recorded crimes per 1,000 population per 48 N.Av1 N.Av1 N.Av1 ra year (1997) Proportion of employment in manufacturing (%) (1997) Proportion of employment in services (%) (1997) Employment change ( ) GDP per capita (1996) (euro, 1998 prices)) Proportion of registered electorate voting in last municipal election (%) N.Av1 55 Proportion of elected city representatives who are 40.0 women (%) (1998) 54 Annual expenditure by municipality per capita 4812 (1996) (euro, 1998 prices) 43 Proportion of students completing compulsory N.Av5 27 education with minimum qualifications (%) Total places in crèches (per 1,000 population) N.Av Scores are provided for two contrasting areas within the city 2 Categories of Not Available: N.Ap: Not applicable; N.Av1: Not available; N.Av2: No approval to publish; N.Av3: Available but the data has not been processed/ purchased for the Urban Audit; N.Av4: Has not been provided in time to be included; N.Av5: Missing for another reason. 3 1,2,3,4,5, reflects the fifth position of the city s relative to the other cities for which information is available (where 29 or more s are available) 1 is the highest and 5 the lowest. 4 Number of cities for which indicator s are available. 5 Results are expressed as percentage point differences (pp) or ratio (ra) of lower to higher s for the two selected sub-areas 6 DQ : Quality of Data : good : adequate 7 CNC : Cross-National Comparability of Data : good :adequate : poor Yearbook: Summary Results for Each City
4 Individual City Audit Summary Amsterdam INDICATORS CITY LEVEL SUB-CITY 1 DATA QUALITY/ Comparison with UA cities 3 COMPARABILITY Score cases 4 Area 1 Area 2 Range/ Ratio 5 DQ 6 CNC 7 Places in further education and university establishments (number per 1000 population) (1996) Proportion of male residents qualified at upper secondary education (%) (1997) Proportion of female residents qualified at upper secondary education (%) (1997) Days per year that NO2 concentrations reach 200mg/m³ (1h averaging time) Proportion of population exposed to outdoor noise level above 65 db (24 hr averaging time) (%) (1993) Consumption of water (m³ per annum per inhabitant) (1995) Total solid waste collected (kg per capita per year) (1996) Proportion of solid waste incinerated and/or recycled (%) N.Av N.Av4 44 Population density (pop. per km²) (1996) :2.25 ra Green space to which public has access (sq m per person) 8 N.Av1 35 N.Av1 N.Av1 N.Av1 pp Proportion of journeys to work by public transport (rail/metro/bus/tram) (%) (1997) Total electricity use per person (toe) N.Av1 19 Cinema attendances per resident per year N.Av4 45 Theatre attendances per resident per year N.Av5 35 Visitors to museums per resident per year (1997) For city level indicator is in square meters; for sub-city, it is the proportion of area in green space. Yearbook: Summary Results for Each City
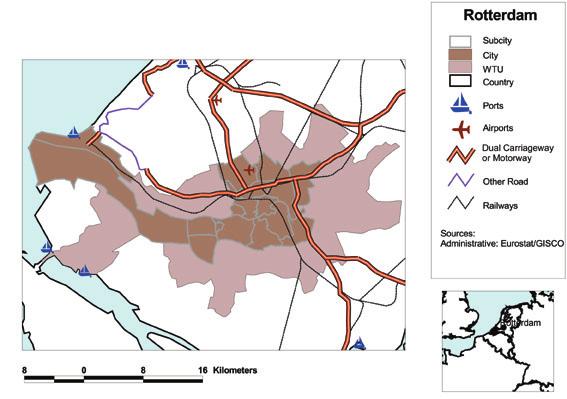
5 ROTTERDAM Rotterdam is a major industrial centre in the Netherlands with a population of 590,000. The Rotterdam region, known as the Rijnmond, which is the Wider Territorial Unit for the Urban Audit, is located at the centre of the southern part of a major urban agglomeration called Randstad. Nearly half of the region's 1.2 million inhabitants live in Rotterdam itself. Its favourable position relative to the Rhein river on the North Sea has made it the largest seaport in the world. In 1998, Rotterdam and its region provided employment for 442,000 people, around 284,000 of whom were based in the city itself. The port, chemical industry, transport and distribution sectors are major employers in Rotterdam, which is home to 23,000 companies, including many foreign companies. Major Dutch companies such as Royal Dutch Shell, Unilever, Nedlloyd and insurance companies such as Nationale Nederlanden and Stad Rotterdam, are based in the city. Culture has become a growth sector in Rotterdam and the selection of the city, together with Oporto, as a European cultural capital in 2002, confirms this development. Major cultural institutions include the Museum Boymans-van Beuningen, the Kunsthal, the Dutch Architectural Institute (NAI), the Dutch Photo Institute (NFI), the Concert Hall De Doelen and the Maritime Museum. Major international cultural events include the Rotterdam International Film Festival and the traditional World Port Festival. Rotterdam is not only the largest port in the world, it is also the main gateway to the European Union and a strategic entry point into Eastern Europe. Antwerp and the Ruhr-area constitute major markets. Approximately 60% of the added value of the port of Rotterdam is generated outside the Rotterdam region. The population of Rotterdam has only increased slightly over the last few years. This is mainly due to the continuing departure of families with children. An increasing proportion of the city's population now consists of nonnationals, particularly in some districts. This has created ethnic and cultural diversity. One-person households are strongly represented throughout the city, whilst single-parent households have also increased. Local authorities in the Netherlands have extensive responsibilities. The main responsibilities concern water, rail, road and public transport infrastructure, as well as social and community services. The City of Rotterdam is divided into 13 sub-city districts each with their own administration. The 'deelgemeenten' have responsibilities mainly in the fields of administrative duties, local spatial planning and maintenance of public areas. In addition to transfers from national government, the main sources of income for the municipality are derived from property and waste collection taxes. The city is governed by the City Council, which is lead by the Mayor and Aldermen. The Mayor is not democratically chosen, but is appointed by the Queen. The Aldermen are chosen among the 45 councillors. In 1998 around half of the citizens voted in the local elections. Yearbook: Summary Results 184
6
7 Individual City Audit Summary Rotterdam CITY LEVEL Comparison with UA cities 4 WTU 1 SUB-CITY 2 DATA QUALITY/ COMPARABILITY INDICATORS Score cases 5 SCORE Divergence from City level 6 Area 1 Area 2 Range/ Ratio 7 DQ 8 CNC 9 Total resident population (1996) !! Population change ( ) (%) N.Av1!! Proportion of population less than 16 years old and above retirement age (%) (1996) " pp!! Proportion of non-nationals (%) (1996) !! Proportion of non-eu nationals (%) (1996) !! Average size of households (1996) "!! Female activity rate (%) (1996) "! # Proportion of population of working age in employment (%) (1996) "!! Unemployment rate (%) (1996) " pp! # Proportion of unemployed who are less than years old (%) (1996) " pp! # Median weekly household income (1996) (euro, 1998 prices) " : 1.43 ra # $ # Proportion of households receiving less than half of the national average household income (%) (1996) pp # # Proportion of households owning or buying their own dwellings (%) (1994) Ratio of average house prices to average annual household income (1994) 4.82: :1 # Life expectancy at birth (years) N.Av1 32 N.Av1 N.Av1 N.Av1 N.Av1 pp! Total recorded crimes per 1,000 population per year (1996) " :1.76 ra # # Proportion of employment in manufacturing (%) (1997) 12.2 "!! Proportion of employment in services (%) (1997) "!! Employment change ( ) (%) ! # GDP per capita (1996) (euro, 1998 prices) " # # Proportion of registered electorate voting in last municipal election (%) Proportion of elected city representatives who are women (%) (1998) Annual expenditure by municipality per capita (1996) (euro, 1998 prices) N.Av1 55 N.Ap # N.Ap!! # # 1 WTU: Wider Territorial Unit 2 Scores are provided for two contrasting areas within the city. 3 Categories of Not Available: N.Ap: Not applicable; N.Av1: Not available; N.Av2: No approval to publish; N.Av3: Available but the data has not been purchased/processed for the Urban Audit; N.Av4: Has not been provided in time to be included; N.Av5: Other, missing for another reason. 4 1,2,3,4,5, reflects indicator s quintile position relative to other city where 29 or more s are available for the indicator. 1 is the highest and 5 the lowest. 5 Number of cities for which indicator s are available. 6 : WTU 20% more than the City level, : WTU 20% less than the city level, " : WTU within 20% of the city level 7 Results are expressed as percentage point differences (pp) or ratio (ra) of lower to higher s for the two selected sub-areas 8 DQ : Quality of Data!: good #: adequate 9 CNC : Cross-National Comparability of Data!: good #:adequate $: poor Yearbook: Summary Results for Each City
8 Individual City Audit Summary Rotterdam CITY LEVEL Comparison with UA cities 4 WTU 1 SUB-CITY 2 DATA QUALITY/ COMPARABILITY INDICATORS Score cases 5 SCORE Divergence from City level 6 Area 1 Area 2 Range/ Ratio 7 DQ 8 CNC 9 Proportion of students completing compulsory N.Av5 27 N.Av1 education with minimum qualifications (%) (1995) Total places in crèches (per 1,000 population) N.Av2 33 N.Av1 $ Places in further education and university establishments (number per 1000 population) (1996) Proportion of male residents qualified at upper secondary education (%) (1997) Proportion of female residents qualified at upper secondary education (%) (1997) Days per year that NO2 concentrations reach 200mg/m³ (1h averaging time) (1996) Proportion of population exposed to outdoor noise level above 65 db (24 hr averaging time) (%) (1991) Consumption of water (m³ per annum per inhabitant) Total solid waste collected (kg per capita per year) (1996) # " # # # # " # $ N.Av1 # N.Av1 39 N.Av1 # " # # Yearbook: Summary Results for Each City
Puerto Ricans in Connecticut, the United States, and Puerto Rico, 2014
 Issued April 2016 Centro DS2016US-8 Puerto Ricans in Connecticut, the United States, and Puerto Rico, 2014 In 2014, Connecticut was the 6th state with most Puerto Ricans (301,182) in the United States.
Chapter 1: The Population of NHS Greater Glasgow and Clyde
 Population Estimate (thousands) Chapter 1: The Population of NHS Greater Glasgow and Clyde Population Trends and Projections National Records of Scotland estimated (NRS SAPE) 1 the 2013 NHS Greater Glasgow
DOING CONVENTIONS THE UNCONVENTIONAL WAY. Postillion Hotels
 Amsterdam DOING CONVENTIONS THE UNCONVENTIONAL WAY Postillion Hotels Amsterdam The Netherlands Ranked top 15 in ICCA s Conference Destination list UNESCO heritage Amsterdam Canal District Paul van Vlissingenstraat
FUNDACIÓN BIT PARCBIT
 FUNDACIÓN BIT PARCBIT ILLES BALEARS BACKGROUND INFORMATION S3 platform peer review workshop Palma de Mallorca 7/8 February 2013 SOCIO ECONOMIC DIAGNOSIS The main socio-economic dimensions of the Balearic
Devonport-Takapuna Local Board Profile
 Devonport-Takapuna Local Board Profile - Initial results from the Census February 2014 Social and Economic Research Team Research, Investigations and Monitoring Unit Auckland Council Map of Devonport-Takapuna
LISBURN CASTLEREAGH BELFAST
 LISBURN CASTLEREAGH BELFAST Northern Ireland s best connected investment location INVEST LISBURN CASTLEREAGH PREMIER INVESTMENT LOCATION, VAST POTENTIAL is located on the edge of Northern Ireland s (NI)
North Lanarkshire. Skills Assessment January SDS-1163-Jan16
 North Lanarkshire Skills Assessment January 2016 SDS-1163-Jan16 Acknowledgement The Regional Skills Assessment Steering Group (Skills Development Scotland, Scottish Enterprise, the Scottish Funding Council
Tourism Statistics
 Tourism Statistics 2006-2010 TABLE OF CONTENTS FOREWORD 4 DEFINITIONS 5 STATISTICAL SUMMARY FOR 2010 6 INTERNATIONAL TOURIST ARRIVALS 7 International Tourist Arrivals: 1994-2010 7 International Tourist
East Lothian. Skills Assessment January SDS-1154-Jan16
 East Lothian Skills Assessment January 2016 SDS-1154-Jan16 Acknowledgement The Regional Skills Assessment Steering Group (Skills Development Scotland, Scottish Enterprise, the Scottish Funding Council
A COMPARISON OF THE MILWAUKEE METROPOLITAN AREA TO ITS PEERS
 KRY/WJS/EDL #222377 (PDF: #223479) 1/30/15 PRELIMINARY DRAFT Memorandum Report A COMPARISON OF THE MILWAUKEE METROPOLITAN AREA TO ITS PEERS EXECUTIVE SUMMARY This memorandum report provides a statistical
Regional Authority of Central Macedonia
 Greece Regional Authority of Central Macedonia Urban area of Thessaloniki What we HAVE -Municipality of Thessaloniki (city centre) of 325.182 people -An Urban Area of 790.824 inhabitants and an area of
De luchtvaart in het EU-emissiehandelssysteem. Summary
 Summary On 1 January 2012 the aviation industry was brought within the European Emissions Trading Scheme (EU ETS) and must now purchase emission allowances for some of its CO 2 emissions. At a price of
List of Figures List of Tables. List of Abbreviations. 1 Introduction 1
 Contents List of Tables Preface List of Abbreviations page x xv xvii xix 1 Introduction 1 part i. the caribbean in the age of free trade: from the napoleonic wars to 1900 2 The Core and the Caribbean 21
IT S YOUR AREA. what s important? TYWYN AREA. WELL-BEING ASSESSMENT GWYNEDD AND MÔN Gwynedd and Môn Public Services Board
 IT S YOUR AREA. what s important? TYWYN AREA WELL-BEING ASSESSMENT GWYNEDD AND MÔN Gwynedd and Môn Public Services Board 2016 well-being assessment Gwynedd WANT to HAVE YOUR SAY? and Môn The new act has
Puerto Ricans in Ohio, the United States, and Puerto Rico, 2014
 Issued April 2016 Centro DS2015US-12 Puerto Ricans in Ohio, the United States, and Puerto Rico, 2014 In 2014, Ohio had the tenth largest number of Puerto Ricans in the United States with 108,174 residents,
QATAR. Its total population is 2,123,160(2014) and it is at number 146 in the world.
 and it is at number 146 in the world.") QATAR Qatar, officially the State of Qatar, is a sovereign Arab country located in Southwest Asia. Its sole land border is with Saudi Arabia to the south with the rest of its territory surrounded by the
QATAR Qatar, officially the State of Qatar, is a sovereign Arab country located in Southwest Asia. Its sole land border is with Saudi Arabia to the south with the rest of its territory surrounded by the
Manawatu District Economic Profile
 Manawatu District Economic Profile Our community Population has grown by 1,000 residents since 2014 to reach 29,800. Population is 86.4% European, with Maori 14.3% of the population. This compares with
Future Economy. Future Econo. Conditions for Growth. Conditions for Growth. Growth for Business. Growth for Business. Isles of Scilly.
 Isles of Scilly Evidence Base Future Economy Future Economy Conditions for Growth Conditions for Growth Growth for Business Growth for Business Future Econo CONTENTS Introduction... 3 Economic Overview...
South Aegan Region (Greece)
") South Aegan Region (Greece) South Aegan Region 1. Introduction The South Aegean Region is situated in the south-eastern border of Greece and constitutes at the same time, along with Cyprus, the south-eastern
South Aegan Region (Greece) South Aegan Region 1. Introduction The South Aegean Region is situated in the south-eastern border of Greece and constitutes at the same time, along with Cyprus, the south-eastern
10 reasons to invest in France February 2012 IFA
 10 reasons to invest in France February 2012 IFA 1 France: A global economic power The 2 nd largest economic power in the European Union. Source: IMF, 2011 The world s 6 th largest exporter of goods and
2017 China-Europe Tourism Market Data Report China Tourism Academy Ctrip Group
 2017 China-Europe Tourism Market Data Report China Tourism Academy Ctrip Group Since the signing of the ADS agreement, the number of China-Europe tourism exchanges has increased at an average annual rate
Contents. Executive summary 5
 N 06/July 2018 Rilasciato il 19 31 febbraio luglio 2018 2018 / Issued / on on 3119 July February 2018 2018 Questo booklet è stato chiuso con le le informazioni disponibili al al 3130 January luglio 2018
Ontario Arts and Culture Tourism Profile Executive Summary
 Ontario Arts and Culture Tourism Profile Executive Summary Prepared by for Ontario Arts Council November 2012 ONTARIO ARTS AND CULTURE TOURISM PROFILE EXECUTIVE SUMMARY The Ontario Arts Council (OAC) commissioned
Puerto Ricans in Rhode Island, the United States, and Puerto Rico, 2013
 Issued September 2016 Centro DS2015US-07 Puerto Ricans in Rhode Island, the United States, and Puerto Rico, 2013 In 2013 an estimated 36,217 Puerto Ricans lived in Rhode Island and accounted for at least
Economic benefits of European airspace modernization
 Economic benefits of European airspace modernization Amsterdam, February 2016 Commissioned by IATA Economic benefits of European airspace modernization Guillaume Burghouwt Rogier Lieshout Thijs Boonekamp
The Mayor. City of Cologne. Cologne Facts & Figures. Cologne Facts & Figures
 The Mayor City of Cologne Cologne Facts & Figures Cologne Facts & Figures Population Inhabitants 1,069,192 1,081,701 On the left bank of the Rhine 673,224 681,559 On the right bank of the Rhine 395,968
East Dunbartonshire Area Profile
 East Dunbartonshire Area Profile May 2014 Contents Executive Summary.. page 3 Introduction.. page 6 Population page 7 Age Structure. page 9 Population Projections page 11 Life Expectancy page 12 Ethnicity.
Population, Territory and Sustainable Development The Case of the Caribbean Sub Region
 Population, Territory and Sustainable Development The Case of the Caribbean Sub Region Author: Godfrey St. Bernard Sir Arthur Lewis Institute of Social and Economic Studies The University of the West Indies
III. TRADE IN COMMERCIAL SERVICES BY CATEGORY
 .. TRADE IN COMMERCIAL SERVICES BY CATEGORY Transportation services China records impressive growth Exports of world transportation services reached $750 billion in 2007, an increase of 19 per cent, following
Location Report. Coffs Harbour U Retire ( ) Retire with Property
 Retire with Property") Location Report Coffs Harbour Retire with Property 1300 U Retire (873 847) www.superannuationproperty.com Coffs Harbour Location Coffs Harbour is a regional town on the North Coast of New South Wales
Location Report Coffs Harbour Retire with Property 1300 U Retire (873 847) www.superannuationproperty.com Coffs Harbour Location Coffs Harbour is a regional town on the North Coast of New South Wales
Puerto Ricans in Massachusetts, the United States, and Puerto Rico, 2014
 Issued April 2016 Centro DS2016US-07 Puerto Ricans in Massachusetts, the United States, and Puerto Rico, 2014 In 2014, Massachusetts was the fifth state with most Puerto Ricans in the United States. In
Transport Indicators Report June 2018
 Transport Indicators Report June 2018 Board Meeting 21 August 2018 Recommendation That the Board: i. Receives this report. Executive summary 1. The attached Monthly and Quarterly Indicator Reports provide
APPENDIX 8. Leeds Socio-Economic Baseline Report. Report. July Metro and Leeds City Council
 APPENDIX 8 Leeds Socio-Economic Baseline Report Report July 2009 Prepared for: Prepared by: Metro and Leeds City Council Steer Davies Gleave West Riding House 67 Albion Street Leeds LS1 5AA +44 (0)113
Provincial Review 2016: KwaZulu-Natal KwaZulu-Natal
 Provincial Review 2016: KwaZulu-Natal KwaZulu-Natal KwaZulu-Natal has a strong role in South Africa s manufacturing and agriculture, and has its largest port and main North-South freight corridor. Its
Westbrook Station. Transit Oriented Development Opportunity
 DEVELOPM Westbrook Station Transit Oriented Development Opportunity OPPOR Table of Contents Prime Real Estate Development Opportunity page 1 Calgary City of Opportunity page 3 What is Transit Oriented
Tourist satellite account for Poland for the years 2005 simplified version
 Tourist satellite account for Poland for the years 2005 simplified version Department of Tourism Ministry of Sport and Tourism of Poland - In 2005 tourism consumption within the economic territory of Poland
International Visitation to the Northern Territory. Year ending September 2017
 International Visitation to the Northern Territory Year ending September 2017 The following is a summary of information relevant to the Northern Territory (NT) tourism industry including visitation results
The Mayor. City of Cologne. Cologne Facts & Figures. Cologne Facts & Figures
 The Mayor City of Cologne Cologne Facts & Figures Cologne Facts & Figures Population Inhabitants 1,081,701 1,084,795 On the left bank of the Rhine 681,559 684,445 On the right bank of the Rhine 400,142
Economic benefits of European airspace modernization
 Economic benefits of European airspace modernization Amsterdam, February 2016 Commissioned by IATA Economic benefits of European airspace modernization Guillaume Burghouwt Rogier Lieshout Thijs Boonekamp
HIGH-END ECOTOURISM AS A SUSTAINABLE LAND USE OPTION IN RURAL AFRICA:
 HIGH-END ECOTOURISM AS A SUSTAINABLE LAND USE OPTION IN RURAL AFRICA: THE ROLE OF EMPLOYMENT IN POVERTY REDUCTION & SOCIAL WELFARE Sue Snyman, March 2011 sues@wilderness.co.za INTRODUCTION Rural Communities
Socio-demographic and Economic Profiles of the Regions in the Republic of Macedonia
 Spatial demography of the Balkans: trends and challenges IV th International Conference of Balkans Demography Session 5: Planning and development challenges -----------------------------------------------------------------------------------------------
IT S YOUR AREA. what s important? ffestiniog AREA. WELL-BEING ASSESSMENT GWYNEDD AND MÔN Gwynedd and Môn Public Services Board
 IT S YOUR AREA. what s important? ffestiniog AREA WELL-BEING ASSESSMENT GWYNEDD AND MÔN Gwynedd and Môn Public Services Board 2016 well-being assessment Gwynedd WANT to HAVE YOUR SAY? and Môn The new act
EU / CZECH REPUBLIC RELATIONS
 MEMO/98/69 Brussels, 29 September 1998 EU / CZECH REPUBLIC RELATIONS GENERAL DATA Population 10.3 million Total Area 78 864 km2 Density 131 inhabitants per km2 Neighbouring countries Austria, Germany,
IT S YOUR AREA. what s important? DOLGELLAU AREA. WELL-BEING ASSESSMENT GWYNEDD AND MÔN Gwynedd and Môn Public Services Board
 IT S YOUR AREA. what s important? DOLGELLAU AREA WELL-BEING ASSESSMENT GWYNEDD AND MÔN Gwynedd and Môn Public Services Board 2016 well-being assessment Gwynedd WANT to HAVE YOUR SAY? and Môn The new act
Puerto Ricans in Georgia, the United States, and Puerto Rico, 2014
 Issued September 2016 Centro DS2014GA-14 Puerto Ricans in Georgia, the United States, and Puerto Rico, 2014 In 2014, an estimated 89,462 Puerto Ricans lived in Georgia and accounted for 1.7 percent of
CEDIP&T. Timofeeva Tatiana
 CEDIP&T ST. PETERSBURG TODAY & TOMORROW Timofeeva Tatiana COMMITTEE FOR ECONOMIC DEVELOPMENT DEVELOPMENT, INDUSTRIAL POLICY AND TRADE April 212 HUMAN DEVELOPMENT INDEX Region of Russia 28 1. Moscow,929
2. Recommendations 2.1 Board members are asked to: i. note the content of the May 2018 Renfrewshire Economic Profile.
 To: Leadership Board On: 20 June 2018 Report by: Director of Development and Housing Services Heading: Renfrewshire Economic Profile May 2018 1. Summary 1.1 This report is the second edition of a revised
2. Introduction to Kurunegala Area : 2.1 Location and History : 2.2 Regional Aspects :
 2. Introduction to Kurunegala Area : 2.1 Location and History : Kurunegala town is the capital of Kurunegala district as well as the capital of North Western Province (Fig 2.1). It has been administered
Sole parents: participation and equality
 Sole parents: participation and equality Workshop on Gender Equality in Australia s Tax and Transfer System, 4-5 November 2015 Peter Whiteford, Crawford School of Public Policy peter.whiteford@anu.edu.au
Provincial Review 2016: Limpopo
 Provincial Review 2016: Limpopo Limpopo s growth since 2003 has been dominated by the mining sector, especially platinum, and by national construction projects. As a result, the provincial economy grew
HEALTH SECTOR ECONOMIC INDICATORS REPORT
 HEALTH SECTOR ECONOMIC INDICATORS REPORT For: Mid North Coast Local Health District Report prepared by: April 2013 Table of Contents Introduction 3 Executive Summary 4 Output 5 Value-Added 7 Workforce
Youth Retention: July Value of post secondary education in regional settings. Prepared for Luminosity Youth Summit.
 Youth Retention: Value of post secondary education in regional settings Prepared for Luminosity Youth Summit July 2013 Prepared by MID NORTH COAST NSW Table of contents Table of contents... 2 Introduction...
ISRAEL- COUNTRY FACTS
 ISRAEL- COUNTRY FACTS ISRAEL-NEIGHBOURING COUNTRIES AND POLITICAL MAP Area: 22,072 sq. km Land area: 21,643 sq. km. Fast Facts Area of lakes: 429 sq. km. (Sea of Galilee 164 sq. km., the Dead Sea - 265
East Dunbartonshire Area Profile
 East Dunbartonshire Area Profile May 2015 Contents Executive Summary.. page 3 Introduction.. page 6 Population page 7 Age Structure. page 9 Population Estimates..page 11 Population Projections page 13
Zimbabwe. Provincial Report Manicaland
 Zimbabwe Provincial Report Manicaland ZIMBABWE POPULATION CENSUS 2012 Population Census Office P.O. Box CY342 Causeway Harare Tel: 04-793971-2 04-794756 E-mail: census2012@zimstat.ac.zw Census Results
C. SYKIANAKI, President, Organization for Planning and Environmental Protection of Athens.
 ! GENERAL PRESENTATION OF THE ATHENS METROPOLITAN REGION (AMR) C. SYKIANAKI, President, Organization for Planning and Environmental Protection of Athens. Athens, July 2006 1 ! The capital city of Athens
Demographic Profile 2013 census
 Demographic Profile 2013 census This profile provides basic population and demographic information on the residents of the Hauraki District. Population and demographic information is important for targeting
Economic Contribution of Tourism to NSW
 Economic Contribution of Tourism to NSW 2013-14 Tourism is a significant part of the NSW economy. In 2013-14, tourism contributed $34.9 billion (Tourism Consumption) to the NSW economy and employed 272,000
Salt Lake Downtown Alliance. June 2018
 Salt Lake Downtown Alliance June 2018 2 SURVEY DETAILS Short telephone survey updating previous benchmark data around key topics 609 respondents ±4% margin of error Trending is provided for all questions
MONTRÉAL IN NORTH AMERICA
 MONTRÉAL IN NORTH AMERICA GREATER MONTRÉAL 82 municipalities Territory of 1,600 square miles 3.9 million residents (half of Québec s population) $127 billion GDP (half of Québec s GDP) GREATER MONTRÉAL:
58% Estimated GDP per capita (2012) $9,095 USD. 5% GDP growth (2011) 9.3% 20% GDP growth (2012) 7.7% 23% Forecasted GDP growth (2013) 7.
 $9,095 USD. 5% GDP growth (2011) 9.3% 20% GDP growth (2012) 7.7% 23% Forecasted GDP growth (2013) 7.") China JUNE 2014 Overview China was British Columbia s (BC) second largest international market in terms of direct customs entries in 2013; up two spots from 2012. BC accounted for nearly 6 of China s direct
China JUNE 2014 Overview China was British Columbia s (BC) second largest international market in terms of direct customs entries in 2013; up two spots from 2012. BC accounted for nearly 6 of China s direct
County of Cumberland Plan Sydney Region Outline Plan
 Sydney has been fortunate in having had two ground breaking Strategic Plans to guide its growth. The first was the County of Cumberland Plan 1948, based on the 1944 London Plan, complete with a green belt.
Land area 1.73 million km 2 Queensland population (as at 31 December 2017) Brisbane population* (preliminary estimate as at 30 June 2017)
 Brisbane population* (preliminary estimate as at 30 June 2017)") Queensland - 11 Queensland OVERVIEW Queensland is nearly five times the size of Japan, seven times the size of Great Britain, and two and a half times the size of Texas. Queensland is Australia s second
Queensland - 11 Queensland OVERVIEW Queensland is nearly five times the size of Japan, seven times the size of Great Britain, and two and a half times the size of Texas. Queensland is Australia s second
The Economic Impact of Tourism in North Carolina. Tourism Satellite Account Calendar Year 2013
 The Economic Impact of Tourism in North Carolina Tourism Satellite Account Calendar Year 2013 Key results 2 Total tourism demand tallied $26 billion in 2013, expanding 3.9%. This marks another new high
Frankfurt Hotel 2014/2015. Frankfurt. Market Report. Accelerating success.
 Market Report Frankfurt Hotel 2014/2015 Frankfurt Market Report Accelerating success. Overall information Frankfurt am Main has a population of just under 700,000 and is a major hub of the financial industry
From: OECD Tourism Trends and Policies Access the complete publication at:
 From: OECD Tourism Trends and Policies 2014 Access the complete publication at: http://dx.doi.org/10.1787/tour-2014-en Slovak Republic Please cite this chapter as: OECD (2014), Slovak Republic, in OECD
The Mayor. City of Cologne. Cologne Facts & Figures. Cologne Facts & Figures
 The Mayor City of Cologne Cologne Facts & Figures Cologne Facts & Figures Population Inhabitants 1,053,528 1,069,192 On the left bank of the Rhine 663,888 673,224 On the right bank of the Rhine 389,640
BUILT FOR CONVENTIONS
 ROTTERDAM CONFERENCES ROTTERDAM AHOY BUILT FOR CONVENTIONS THE LARGEST AUDITORIUM IN THE NETHERLANDS: 2,750 SEATS A 250 ROOM HOTEL NEXT TO AHOY ALMOST 50 YEARS OF EXPERIENCE IN HOSPITALITY < 10 MINUTES
Chapter 1: Kosovo and its Population
 Chapter 1: Kosovo and its Population The Territory Kosovo is a small and landlocked territory in the center of the Balkan Peninsula. Kosovo borders Macedonia (FYROM), Albania, Serbia and Montenegro. Its
Economic Contribution of Tourism to NSW
 Economic Contribution of Tourism to NSW 2015-16 Tourism is a significant part of the NSW economy. In 2015-16, tourism contributed $38.1 billion (Tourism Consumption) to the NSW economy and employed 261,100
City tourism: a successful product
 City tourism: a successful product Observation and analytical units. Tourist Destination Management (area 16) Inmaculada Gallego Galán and Ana Moniche Bermejo Department of Statistics and Market Research.
Contents Manningham at a Glance... 6 Location and Area... 6 Manningham Activity Centres... 6 Manningham Suburbs... 6 Population... 8 Forecast... 9 For
 Contents Manningham at a Glance... 6 Location and Area... 6 Manningham Activity Centres... 6 Manningham Suburbs... 6 Population... 8 Forecast... 9 Forecast 2011 2036... 9 Population Forecast... 9 Gross
Norfolk s Story October 2017
 Norfolk s Story October 2017 Version 8.0 Page 1 of 55 Contents 1 Key findings 3 2 Introduction 7 2.1 Purpose of Norfolk s Story 7 2.2 Statement on data 7 2.3 Norfolk the place an overview 8 3 Norfolk s
Economic impact of the Athens International Airport
 FOUNDATION FOR ECONOMIC & INDUSTRIAL RESEARCH 11 T. Karatassou St, 11742 Athens, Greece, Tel: (+30) 210 9211 200-10, Fax: (+30) 210 9233 977, www.iobe.gr Economic impact of the Athens International Airport
Key Stats. Of 11 peer cities assessed, Calgary has the second highest level of economic power comparing GDP per capita
 economy 20 Key Stats Of 11 peer cities assessed, Calgary has the second highest level of economic power comparing GDP per capita - Deloitte, Benchmarking Calgary s Competitiveness, 2015 Of 11 peer cities
Annual Gross Domestic Product (Production Measure)
") June 2017 Executive Summary Page 2 Latest Quarter Economic Trends page 3 Economic Outlook page 4 Labour Force page 5 Retail Activity page 6 Building Activity page 7 Tourism Trends page 8 Local Authorities
June 2017 Executive Summary Page 2 Latest Quarter Economic Trends page 3 Economic Outlook page 4 Labour Force page 5 Retail Activity page 6 Building Activity page 7 Tourism Trends page 8 Local Authorities
TENDENCIES, PERSPECTIVES AND INVESTMENT POSSIBILITIES IN THE HUNGARIAN TOURISM
 TENDENCIES, PERSPECTIVES AND INVESTMENT POSSIBILITIES IN THE HUNGARIAN TOURISM Brussels, 6th June 2007 Dr. Ujhelyi István State Secretary Ministry of Local Government and Regional Development OPERATIONAL
GEOGRAPHICAL LOCATION OF colombia
 GEOGRAPHICAL LOCATION OF colombia Population: 48 Million inhabitants Urban: 37 million inhabitants rural: 11 million inhabitants GDP PER CAPITA: USD 7.930 Unemployment: 8,8% poverty: 28.5% Santa Marta
International Visitation to the Northern Territory. Year ending March 2018
 International Visitation to the Northern Territory Year ending March 2018 The following is a summary of information relevant to the Northern Territory (NT) tourism industry including visitation results
International Visitation to the Northern Territory. Year ending December 2017
 International Visitation to the Northern Territory Year ending December 2017 The following is a summary of information relevant to the Northern Territory (NT) tourism industry including visitation results
Page 1. Economic Impact Assessment of the Palm Island Community Company
 Page 1 Economic Impact Assessment of the Palm Island Community Company INCORPORATING: Empower North is a group of expert consultants providing select clients with an integrated service across the specialist
INTRODUCTION GEOGRAPHY
 COUNTRY DATA: Cyprus : Information from the CIA World INTRODUCTION A former British colony, Cyprus became independent in 1960 following years of resistance to British rule. Tensions between the Greek Cypriot
LIST OF CONTENTS. EXECUTIVE SUMMARY IMPACT ANALYSIS World Wrestling Championships September 2009 City of Herning, Denmark. Preface...
 LIST OF CONTENTS EXECUTIVE SUMMARY IMPACT ANALYSIS World Wrestling Championships 21 27 September 2009 City of Herning, Denmark Preface... 1 Public contributions... 2 Contents... 2 Structure... 2 Chapter
Key Indicators for South Sudan
 Key Indicators for South Sudan National Bureau of Statistics Fast Facts Total Population of South Sudan is 8.26 million Total Area of South Sudan is 644,329 sq. km More than half (51%) of the population
A COMPARISON OF THE MILWAUKEE METROPOLITAN AREA TO ITS PEERS
 KRY/WJS/EDL #222377 v4 (PDF: #223479v2) 4/1/15 APPENDIX D REVISED DRAFT Memorandum Report A COMPARISON OF THE MILWAUKEE METROPOLITAN AREA TO ITS PEERS EXECUTIVE SUMMARY This report provides a statistical
monitoring of egnatia motorways spatial impacts
 monitoring of egnatia motorways spatial impacts MINISTRY OF ENVIRONMENT, PHYSICAL PLANNING AND PUBLIC WORKS 1 A TOOL AT THE SERVICE OF SPATIAL DEVELOPMENT The Egnatia motorway Observatory monitors, and
NOVEMBER YEAR III LATIN AMERICA&CARIBBEAN MID-MARKETS: OPPORTUNITIES IN THE REGION
 NOVEMBER 2011 - YEAR III MARKETWATCH LATIN AMERICA&CARIBBEAN MID-MARKETS: OPPORTUNITIES IN THE REGION THE REGION IN PERSPECTIVE LAC in Perspective - 2011 Facts % of the world 595 mi people 9,3 $ 5,8 tri
 CONTENTS FOREWORD... 3 1. INTRODUCTION... 4 1.1. General information... 4 1.2. The sample... 4 1.3. Questionnaires... 5 1.4. Changes in the 2007 questionnaire compared to 2004... 5 1.5. Data entry... 6
2. Good Practice Example: Renovation of Village Block (Óbuda / Budapest, Hungary)
") 2. Good Practice Example: Renovation of Village Block (Óbuda / Budapest, Hungary) Village Block Renovation Project, Óbuda (District III), Budapest, Hungary Project Contributor: FŐTÁV Zrt. Budapest District
2. Good Practice Example: Renovation of Village Block (Óbuda / Budapest, Hungary) Village Block Renovation Project, Óbuda (District III), Budapest, Hungary Project Contributor: FŐTÁV Zrt. Budapest District
Importance and Developments
 Promoting Economic Diversity in Macedonia: the role of skills in the tourism sector Skills Policies for Economic Diversification in Republic of Macedonia Senior consultant : Nikica Mojsoska-Blazevski,
CAMPBELTOWN PROFILE May 2014
 www.hie.co.uk CAMPBELTOWN PROFILE May 2014 CAMPBELTOWN PROFILE INTRODUCTION The Campbeltown profile uses 2011 Census data and other available data sources to present an up-to-date analysis of its population
State of the Industry Report. Presented by Hon. Beverly Nicholson-Doty. Chairman, Caribbean Tourism Organization. Government House.
 State of the Industry Report Presented by Hon. Beverly Nicholson-Doty Chairman, Caribbean Tourism Organization Government House Charlotte Amalie St. Thomas, USVI Mon 10 Feb 2014 The state of the Caribbean
Rotterdam Refreshingly Dutch Remarkably International. Looking for a different congress or event destination? Then Rotterdam is your answer!
 Rotterdam Refreshingly Dutch Remarkably International Looking for a different congress or event destination? Then Rotterdam is your answer! Looking for a different congress or event destination? Somewhere
TRANSPORT AFFORDABILITY INDEX
 TRANSPORT AFFORDABILITY INDEX Report - December 2016 AAA 1 AAA 2 Table of contents Foreword 4 Section One Overview 6 Section Two Summary of Results 7 Section Three Detailed Results 9 Section Four City
THE ECONOMIC IMPACT OF ABERDEEN AIRPORT
 York Aviation BAA ABERDEEN THE ECONOMIC IMPACT OF ABERDEEN AIRPORT Executive Summary July 2010 EXECUTIVE SUMMARY Introduction and Background In December 2009 BAA Aberdeen commissioned York Aviation to
URBAN DYNAMICS WESTERN CAPE 67
 URBAN DYNAMICS WESTERN CAPE 67 5. SOCIO-ECONOMIC CONTEXT 5.1 Demographic Profile 5.1.1 Introduction The demographic information contained in the synopsis is derived from the supposedly inaccurate 2001
Aqqaba Village Profile
 Aqqaba Village Profile Produced by The Applied Research Institute - Jerusalem In cooperation with Funded by February, 2006 This document has been produced with the financial assistance of the European
CROATIA Business climate and opportunities for cooperation with Finland. Helsinki, 14th December 2015
 CROATIA Business climate and opportunities for cooperation with Finland Helsinki, 14th December 2015 CROATIA...... in numbers CROATIA 2014 Area: 56,594 km² Population: 4.3 million Capital: Zagreb (800,000
Report of the Independent and Parish Remuneration Panel on the Review of Parish Members Allowances for the 2018/2019 Financial Year
 Report of the Independent and Parish Remuneration Panel on the Review of Parish Members Allowances for the 2018/2019 Financial Year For Parish Councils in the Cherwell District December 2017 1 REPORT OF
Travel and Tourism in Ukraine: Key Trends and Opportunities to 2016
 Travel and Tourism in Ukraine: Key Trends and Opportunities to 2016 Reference code: TT0037MR_SP Published: July 2012 www.timetric.com Timetric John Carpenter House 7 Carmelite Street London EC4Y 0BS United