ICG Profile 67% 22% 11% Leading ferry company operating between UK / Continent and Republic of Ireland. Capital Employed. 1.
|
|
|
- Alexis Tucker
- 5 years ago
- Views:
Transcription
1 ICG Profile 1. Irish Ferries Leading ferry company operating between UK / Continent and Republic of Ireland. Capital Employed 67% 2. Ship Chartering Division 22% 3. Container Division Container stevedoring terminals in Dublin & Belfast Leading container operator between Ireland and the Continent 11% 1
2 ICG - Group Performance H1 H Turnover 163.2m 141.8m 312.1m EBITDA* 32.6m 15.6m 59.7m Trading Profit * 16.4m 2.6m 32.2m Non recurring items (net) (16.5)m - 0.7m Adjusted EPS** 50.8c (1.7)c 108.5c Basic EPS (6.8)c 10.2c 137.4c Equity 175.9m 141.1m 178.3m Net debt 121.2m 132.4m 113.8m * Restated ** Before non recurring items and net expected return on defined benefit pension assets less liabilities 2
3 Container Division H1 H m m m Turnover EBITDA Depreciation/Amortisation (1.5) (1.5) (3.3) Operating Profit Start up costs Belfast (0.8) 3.6 3
4 Operations & Highlights Container Routes Ireland / Continent - Door to Door plus Quay to Quay UK / Continent - Quay to Quay container movement Port Ownership Container Terminal in Dublin, 30m expansion, completion 2008 Belfast Container Terminal commenced in October 2006, meeting expectations Highlights 4 Dublin Terminal expansion superstructure on target, infrastructure delays Belfast Terminal - meeting expectations Dublin Port Tunnel Enhancing connectivity Entry to refrigerated container market

5 Container Routes Grangemouth Belfast Dublin Cork Cork Waterford South Shields Liverpool Holyhead Holyhead Immingham Pembroke Pembroke Felixstowe Tilbury Southampton 15 ships 11 ports 16 routes Rotterdam Antwerp Rotterdam 5 Le Havre
6 Market Share LoLo 2006 All Ireland (UK & Continent) % Peel Holdings 30 ICG 22 Samskip 16 DFDS 9 C2C 8 Others 15 Total 100 6

7 Container Terminal Market 1.3 Million Teu in Million Teu in Picture courtesy of The Irish Times
8 Container handling in Ireland Market Share 22% 2006 CAGR Volume % % 12 11% % 5% 8% 7% 9% 9% 7% Market ICG Last 10 Yrs Last 5 Yrs Last 3 Yrs 2006
9 Ferries & Ship Chartering H1 H m m Turnover m EBITDA Depreciation/Amortisation (14.7) (11.5) (24.2) Operating Profit/Loss
10 Operations Ship Chartering 2 ferries on charter to P&O firm to ferry on charter to Color Line February September 2007 prior to entering service with Irish Ferries Irish Ferries 4000 departures to and from UK 250 departures to and from France 10
 with shipbrokers for sale")
11 Replacement Vessel Ireland France Oscar Wilde Commences 30 November 2007 Replacement capex to upgrade product standard Cost 45 million Initial charter 8 months Additional annual depreciation and interest 5.5 million 11 Normandy (existing vessel built in 1982) with shipbrokers for sale

12 Distribution Car Booking Report 2006 All Markets Share % % Call Centres At our Ports Internet Direct Travel Trade Total
13 Cash Flow H1 H1 Year M M m Operating Profit before restructuring Deprecation EBITDA (before restructuring) Working Capital Movement (6.1) Operating Cash Flow Interest (net) (3.8) (2.6) (5.7) Tax (0.2) (1.0) (1.7) Capex (51.3) (8.4) (11.8) Restructuring Payments - (36.3) (35.4) Free Cash Flow (8.0) (23.8) (1.0) Dividends/Redemptions (0.0) (4.5) (7.2) Net Flow (8.0) (28.3) (8.2) Operating Debt (113.8) (105.9) (105.9) Translation/Other Closing Debt (121.2) (132.4) (113.8) 13
14 Passenger Car Market UK Ireland Market REPUBLIC OF IRELAND Volumes (Cars) Market Irish Irish Ferries Ferries Share H1: Jan - June % +19% 47% Weak car market due to Stena reducing their HSS Fast Craft capacity 2007 V 2006 Average yield slightly up on last year 14
15 Market Share Cars 2007 v 2006 Republic of Ireland UK % % Irish Ferries Stena Line P&O Irish Sea 1 2 Swansea Cork 0 4 Norfolkline 3 3 Total
16 RoRo Freight Market UK-Ireland 2007 REPUBLIC OF IRELAND Volumes Market Irish Market (Freight Units) Ferries Share Jan - June % 18% 30% Irish Ferries benefited from earlier drydock so increased capacity in Jan & Feb. Stena s operational problems HSS & Stena Adventurer P&O - an additional ship 16
17 Market Share RoRo 2007 V 2006 Rep. of Ireland - UK % % Irish Ferries Stena Line *Norfolkline P&O Irish Sea *Celtic Link 2 1 Swansea Cork 0 0 Total *Market figures for Norfolkline & Celtic Link are estimates 17


18 Ship Chartering Division Pride of Bilbao Night Ferry; 2400 beds, 580 cars, built 1986 Day Ferry; 600 cars or 108 trucks built Challenger Pride of Cherbourg
19 Ship Chartering Division Both vessels on charter to Charter Income m m* m m *Excludes short term charter to Color Line 19

20 Irish Ferries - Ships 20

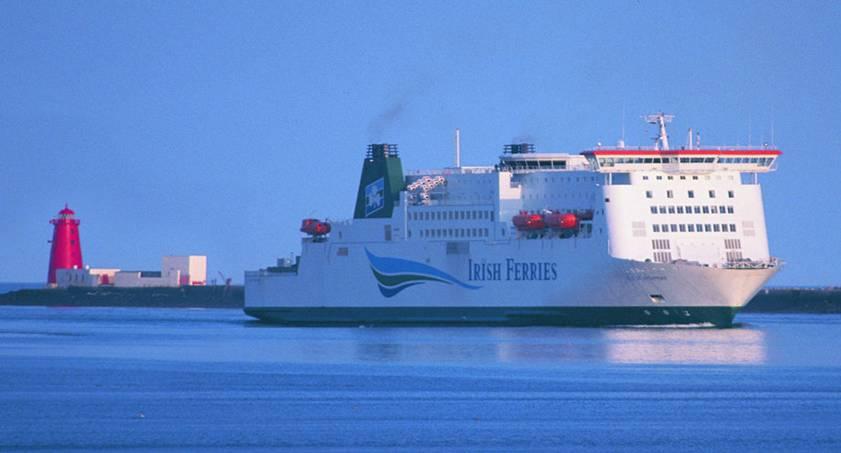
21 Irish Ferries - Ships 21
22 Irish Ferries Route Structure Larne Belfast Stranraer Cairnryan Dublin Rosslare Holyhead Liverpool Pembroke Rotterdam 22 Roscoff Cherbourg
23 Total Passenger Market Cumulative Last 3 Years Irish Ferries -19% -6% -7% -7% Republic of Ireland -15% -4% -6% -5% All Ireland -15% -3% -6% -5% 23
24 Car Market Cumulative Last 3 Years Irish Ferries -13% -3% -4% -4% Republic of Ireland -13% -3% -5% -5% All Ireland -12% -2% -5% -4% 24
25 RoRo Market Cumulative Last 3 Years Irish Ferries 18% 13%* 8% 6% Republic of Ireland 20% 8% 6% 6% All Ireland 18% 7% 5% 5% * Strike in 2005 flatters 2006 figures 25

26 RoRo Freight Traffic Key Slots 26
27 RoRo Market Analysis Greater integration between Ireland & UK/Continent *(e) CAGR % % Value of Imports & Exports 45.1bn 264.2bn 13.5% GDP 40.0bn 177.9bn 11.2% Imports & Exports as % of GDP 113% 150% *ESRI Estimate
28 Irish Ferries Revenue Mix
29 Irish Ferries Cost Analysis 2006 Payroll 15% Port Charges 30% 29
30 Fuel Costs (f) Consumption (000 tons) Heavy Fuel Oil Marine Diesel Price ( per ton) Heavy Fuel Oil Marine Diesel Cost (2006 V s 2005) +14% 33m 29m 20m (2006 V s 2004) +65%
31 Employment Dec Dec Dec Irish Ferries Seagoing (incl. agency) Shore (incl. ports) Total Container & Terminal & Group
32 Market Share Cars 2006 v 2005 (H1) Republic of Ireland - UK % % Irish Ferries Stena Line P&O Irish Sea 2 1 Irish Sea Express / IOMSPC 0 2 Swansea Cork 4 4 Norfolkline 3 1 Total
ICG Profile 63% 26% 11%
 ICG Profile 1. Irish Ferries Leading ferry company operating between UK / Continent and Republic of Ireland. Modern fleet of large ships Major barriers to entry Significant operational gearing Very strong
IRISH CONTINENTAL GROUP, plc. Interim Update 8th September 2005
 IRISH CONTINENTAL GROUP, plc Interim Update 8th September 2005 ICG Profile 1. Irish Ferries Biggest ferry company operating between UK / Continent and Republic of Ireland. Modern fleet of large ships Major
ICG Profile. Capital Employed 2003 % 1. Irish Ferries
 1. Irish Ferries ICG Profile Biggest ferry company operating between UK / Continent and Republic of Ireland. Modern fleet of large ships Major barriers to entry Significant operational gearing Very strong
Irish Continental Group plc Results Presentation, 23 March 2010
 Irish Continental Group plc 2009 Results Presentation, 23 March 2010 1 ICG Profile Capital Employed 1. Ferries Division Leading ferry company operating between UK/Continent and Republic of Ireland 85%
2018 Half Year Results Presentation 30 th August 2018
 2018 Half Year Results Presentation 30 th August 2018 Half Year 2018 Performance Summary 2018 2017 2018 2017 2018 2017 Revenue 157.2m +0.7% EBITDA 26.1m -11.8% Net Cash 54.6m Revenue for the year grew
Company Presentation. 05 January 2018
 Company Presentation 05 January 2018 Half Year 2017 Performance Summary Revenue 156.1 m +3.7% EBITDA 29.6 m 3.0% Net Cash 26.7 m +170.4% Basic EPS 22.8 c +121.4% Revenue for the first half of the year
DFDS A/S H Analyst meeting 30 August 2006
 DFDS A/S H1 2006 Analyst meeting 30 August 2006 DFDS A/S Contents The half-year in brief Strategy on track DFDS Seaways DFDS Tor Line Half-year accounts & profit forecast 2006 DFDS A/S H1 2006 in brief
Freight Timetable. Scandinavia 11 January Göteborg - Frederikshavn Varberg - Grenaa. For Reservations, please call:
 Freight Timetable Scandinavia 11 January 2010 For Reservations, please call: Sweden +46 31 7040800/900 Denmark +45 96 200222 Norway +47 23179160 Germany Kiel +49 (0)431 9096 Germany Travemünde +49 (0)45024030
PORT MARKETS IN NUMBERS STEPHEN TAYLOR
 PORT MARKETS IN NUMBERS STEPHEN TAYLOR PORT MARKETS IN NUMBERS 1 International trade trends 2 UK ports traffic 3 Summary of key indicators Data sources include: DfT mari3me sta3s3cs, HMRC trade sta3s3cs,
Western Channel crossings
 We are agents for the leading Cross-Channel ferry operators and also offer Eurotunnel. Our inclusive prices include the cost of a car and 2 adults on most Dover/Calais crossings with P&O Ferries. There
PRESS RELEASE Financial Results. Rising passenger traffic at 12.5m Exceeding 1bn in consolidated revenue
 PRESS RELEASE 2016 Financial Results Rising passenger traffic at 12.5m Exceeding 1bn in consolidated revenue Kifissia, 23 March 2017 AEGEAN reports full year 2016 results with consolidated revenue at 1,020m,
WÄRTSILÄ S STRONG FINANCIAL POSITION. RAIMO LIND Executive Vice President, CFO
 WÄRTSILÄ S STRONG FINANCIAL POSITION Executive Vice President, CFO 1 Wärtsilä 29 March 212 Contents Topic 3 Growth over the cycle fulfils targeted levels 4 Net sales emphasis on high growth areas 5 Net
Annual General Meeting. 13 June 2017
 Annual General Meeting 13 June 2017 Agenda 1. Approval of the Annual Report of the financial year 2016 of AS Tallink Grupp 2. Proposal on distribution of profits 3. Extension of authorities of the members
FIRST QUARTER 2017 RESULTS. 4 May 2017
 FIRST QUARTER 2017 RESULTS 4 May 2017 A resilient start of the year, traffic up 4.2% 20.9 million passengers carried, up 5.2%, traffic (RPK) up 4.2%, capacity (ASK) up 3.3% and load factor up 0.7pts Confirmation
Finnair Group Annual Report 1 January 31 December 2006
 Finnair Group Annual Report 1 January 31 December 2006 2006: A year for restructuring Scheduled Passenger Traffic transforming to meet Asian traffic demands Labour negotiations to cut 670 jobs 80 million
UK Port Infrastructure Project Pipeline Analysis Report
 UK Port Infrastructure Project Pipeline Analysis Report Prepared by Moffatt & Nichol, for the British Ports Association, March 2018 Following release of the Analysis of the National Infrastructure and
NORWEGIAN AIR SHUTTLE ASA QUARTERLY REPORT SECOND QUARTER 2006 [This document is a translation from the original Norwegian version]
![NORWEGIAN AIR SHUTTLE ASA QUARTERLY REPORT SECOND QUARTER 2006 [This document is a translation from the original Norwegian version]](/thumbs/74/71229964.jpg "NORWEGIAN AIR SHUTTLE ASA QUARTERLY REPORT SECOND QUARTER 2006 [This document is a translation from the original Norwegian version]") NORWEGIAN AIR SHUTTLE ASA QUARTERLY REPORT SECOND QUARTER 2006 SECOND QUARTER IN BRIEF had earnings before tax of MNOK 24.8 (20.6) in the second quarter. The operating revenue increased by 44 % this quarter,
NORWEGIAN AIR SHUTTLE ASA QUARTERLY REPORT SECOND QUARTER 2006 SECOND QUARTER IN BRIEF had earnings before tax of MNOK 24.8 (20.6) in the second quarter. The operating revenue increased by 44 % this quarter,
SAS Q1 2016/
 SAS Q1 2016/2017 08.03.2017 Weak Q1 as expected new structural actions underway Q1 in summary Positives + Currency adjusted passenger revenue up 5% + Strong development of ancillary revenues + Passengers
Finnair Group Interim Report 1 January 30 September 2008
 Finnair Group Interim Report 1 January 30 September 2008 1 31/10/2008 Presentation name / Author Airline industry at a historical turning point Expensive fuel price in the beginning of 2008 has dramatical
NORWEGIAN AIR SHUTTLE ASA QUARTERLY REPORT FIRST QUARTER 2004 [This document is a translation from the original Norwegian version]
![NORWEGIAN AIR SHUTTLE ASA QUARTERLY REPORT FIRST QUARTER 2004 [This document is a translation from the original Norwegian version]](/thumbs/87/95085804.jpg "NORWEGIAN AIR SHUTTLE ASA QUARTERLY REPORT FIRST QUARTER 2004 [This document is a translation from the original Norwegian version]") NORWEGIAN AIR SHUTTLE ASA QUARTERLY REPORT 2004 IN BRIEF At the start of 2003, Norwegian has become a pure low-fare airline. The Fokker F-50 operations have been terminated, and during the quarter the
NORWEGIAN AIR SHUTTLE ASA QUARTERLY REPORT 2004 IN BRIEF At the start of 2003, Norwegian has become a pure low-fare airline. The Fokker F-50 operations have been terminated, and during the quarter the
2012 Result. Mika Vehviläinen CEO
 2012 Result Mika Vehviläinen CEO 1 Agenda Market environment in Q4 Business performance and strategy execution Outlook Financials 2 Market Environment According to IATA, Global air travel continues to
SAS Group Q Teleconference
 SAS Group Q4 2012 Teleconference December 12, 2012 1 Break-even result in 2012 despite 1.6 bn SEK higher fuel cost 23 MSEK EBT (before non-recurring items) despite 1.6 bn SEK higher fuel cost Positive
Third Quarter 2014 Results. 29 October 2014
 Third Quarter 2014 Results 29 October 2014 Highlights of the Third Quarter Operating environment Air France-KLM Economic environment remains weak Further currency volatility affecting revenues and results
INDEPENDENT NEWS & MEDIA PLC
 INDEPENDENT NEWS & MEDIA PLC 2014 INTERIM RESULTS 28 August 2014 2014 INM PLC inmplc.com Page 1 INTERIM RESULTS Key Highlights (Continuing Group*) Net Profit ** doubled from 6.9 million to 14.0 million;
PRELIMINARY ACCOUNTS FOR 2012
 INTERIM REPORT FOR Q4 2012 AND INTERIM REPORT FOR Q4 2012 AND PRELIMINARY ACCOUNTS FOR 2012 HIGHLIGHTS Q4 with growth in volume and improved normalized EBITDA MNOK 261 improvement in normalized EBITDA
2006 Preliminary Results. 7 March 2007
 2006 Preliminary Results 7 March 2007 Anthony Rabin 16 Headline numbers 2005 2006 Revenue 4,938m 5,852m +19% Pre-tax profit* 134m 152m +13% Adjusted eps* 24.1p 27.3p +13% Full-year proposed dividend 8.1p
Annual Results. Year ended 28 April June 2018
 1 Annual Results Year ended 28 April 2018 28 June 2018 Cautionary statement 2 This document is solely for use in connection with a briefing on the group headed by Stagecoach Group plc ( the Group ). This
Final Results 31 December 2013
 Final Results 31 December 2013 Clarkson PLC 10 March 2014 www.clarksons.com Agenda Headline results Divisional performance Business Model & Strategy The market Outlook 10 March 2014 Final Results www.clarksons.com
1 st Quarter Results FY
 1 st Quarter Results FY 2004-05 05 Q1 Highlights p Context 8Improving economic context 8Strong economic growth in Americas and Asia 8Modest economic recovery in Europe 8Soaring fuel prices 8IPE Brent up
Analyst and Investor Conference Call Q Ulrik Svensson, CFO and Member of the Executive Board
 Analyst and Investor Conference Call Q2 2017 Ulrik Svensson, CFO and Member of the Executive Board Frankfurt, 2 August 2017 Disclaimer The information herein is based on publicly available information.
Management Presentation. November 2018
 Management Presentation November 2018 Forward looking statements This presentation as well as oral statements made by officers or directors of Allegiant Travel Company, its advisors and affiliates (collectively
SAS Group Q2 2012/13. Q2 Restructuring programme moving KPIs in the right direction
 SAS Group Q2 2012/13 1 Q2 Restructuring programme moving KPIs in the right direction Operating revenues +1.6%* Yield improvement of +2.7%* Forceful implementation of 4XNG plan: Unit cost down by 10.7%
First Half 2013 Results. 16 mai 2013
 First Half 2013 Results 16 mai 2013 26 July 2013 Results Increasing effects of Transform 2015 Highlights of the First Half A difficult global economic environment Transform 2015 plan roll-out on track
 Standard Information General Achieved Room Rate Hotel accommoda0on income divided by the (ARR) number of rooms occupied by guests Income before fixed costs Hotel opera0ng profit before directly a?ributable
TUI GROUP FACTBOOK. May 2015
 TUI GROUP FACTBOOK May 2015 Pro Forma Turnover 2012/13 & 2013/14 m FY 12/13 Q1 13/14 Q2 13/14 Q3 13/14 Q4 13/14 FY 13/14 Northern Region 6,037.2 1,047.6 922.0 1,660.0 2,571.2 6,200.8 Central Region 5,524.8
SAS Q3 2017/ August 2018
 SAS Q3 2017/2018 31 August 2018 Strong earnings in peak season POSITIVES Record number of passengers Total revenue up MSEK 936 vs. LY Currency adjusted yield up 1.1% vs. LY EB point sale up 27% vs. LY
2017 Half-year Results
 2017 Half-year Results A MULTI-LOCAL SPECIALIST STORAGE RETAIL DISTRIBUTION SUPPORT AND SERVICES OF FUEL PRODUCTS 2 KEY FACTS As of june 30, 2017 Purchase of Dinasa and of its subsidiary Sodigaz, leading
SAS Q1 2017/2018. Q1 in Summary: Improved earnings CHANGE VS. Q1 FY17
 SAS 2017/2018 27.02.2018 in Summary: Improved earnings POSITIVES + Passenger revenue up 1% (FX adj.) + Cargo and EB-point sale revenue increased MSEK 109 + Efficiency program delivered MSEK 165 + Positive
2006 Interim Results. 16 August 2006
 2006 Interim Results 16 August 2006 Sir David John Anthony Rabin Headline numbers First half 2005 First half 2006 Revenue 2,308m 2,773m +20% Pre-tax profit* 52m 60m +15% Adjusted eps* 9.3p 11.4p +23% Interim
SAS Q2 2017/2018 TELECONFERENCE
 SAS Q2 2017/2018 TELECONFERENCE 30 May 2018 Earnings as expected despite negative currency effect POSITIVES + Total revenue up MSEK 73 vs. LY + Currency adjusted yield up 0.6% vs. LY + EB-point sale revenue
SAS Group Presentation Carnegie, May 22, 2012 Sture Stölen, Head of IR
 SAS Group Presentation Carnegie, May 22, 2012 Sture Stölen, Head of IR 1 This is the SAS Group 128 destinations 27,2 million passengers 28 new routes to be launched 2012 1,085 daily flights Revenues 2011,
Airline industry outlook remains fragile
 Airline industry outlook remains fragile June 2009 www.iata.org/economics To represent, lead and serve the airline industry Airline industry outlook remains fragile Green shoots starting to appear Recovery
Heathrow (SP) Limited
 Limited") Draft v2.0 10 Feb Heathrow (SP) Limited Results for year ended 31 December 2013 24 February 2014 Strong operational and financial performance in 2013 Passenger satisfaction at record high and over 72 million
Draft v2.0 10 Feb Heathrow (SP) Limited Results for year ended 31 December 2013 24 February 2014 Strong operational and financial performance in 2013 Passenger satisfaction at record high and over 72 million
Golden Ocean Group Limited Q results March 1, 2007
 Golden Ocean Group Limited Q4 2006 results March 1, 2007 PROFIT & LOSS 2005 2006 (in thousands of $) 2006 2005 Oct-Dec Oct-Dec Jan - Dec Jan - Dec Operating Revenues 37 292 91 253 Time charter revenues
FIRST HALF 2016 RESULTS. 27 July 2016
 FIRST HALF 2016 RESULTS 27 July 2016 Highlights of the Second Quarter 2016 Environment Operations Financial highlights High level of geopolitical uncertainties, including Brexit Terrorist attacks in Europe
Current BAF ROUTES DATE MARPOL/ ISPS
 ANEK LINES ANCONA-IGOUMENITSA 155.00 / UNIT 01/01/2019 ANCONA-PATRAS 155.00 / UNIT 01/01/2019 BARI-IGOUMENITSA 85.00 / UNIT 01/01/2019 BARI-PATRAS 85.00 / UNIT 01/01/2019 BRITTANY FERRIES PORTSMOUTH-CAEN
TUI Group Factbook. December 2017
 TUI Group Factbook December 07 TUI GROUP REASONS TO INVEST & BUSINESS MODEL TUI GROUP FY7 Factbook December 07 Strong TUI investment case 3 reasons to be invested / to invest STRONG STRATEGIC POSITION
The Irish Maritime Transport Economist
 The Irish Maritime Transport Economist VOLUME 6 April, 29 ISSN 1649-5225 The Irish Maritime Development Office The Irish Maritime Development Office (IMDO) was established by statute in December 1999.
PRESS RELEASE. First Half 2017 Financial Results Higher Load Factors and traffic lead to a significant rebound in second quarter profitability
 PRESS RELEASE First Half 2017 Financial Results Higher Load Factors and traffic lead to a significant rebound in second quarter profitability Kifissia, 12 September 2017 AEGEAN announces first half 2017
WÄRTSILÄ CORPORATION
 WÄRTSILÄ CORPORATION INTERIM REPORT JANUARY-SEPTEMBER 21 OLE JOHANSSON, PRESIDENT & CEO 2 OCTOBER 21 1 Wärtsilä Q3/1 Highlights Order intake EUR 1,4 million (+38%) Net sales EUR 1,39 million (-11%) Operating
Finnair Group Interim Report 1 January 30 June 2008
 Finnair Group Interim Report 1 January 30 June 2008 1 08/08/2008 Presentation name / Author Airline industry at a historical turning point Fuel price has a stranglehold on the business Average ticket prices
Full Year 2017 RESULTS 16 th of February 2018
 Full Year 2017 RESULTS 16 th of February 2018 2017 FULL YEAR 2017 MAIN ACHIEVEMENTS Robust traffic statistics Strong Full Year results +5.6% +2.0% 42% +101% 1,049 1,488 347 696 FY 2016 FY 2017 Passengers
Cathay Pacific Airways Interim Results 04 August Cathay Pacific Airways Interim Results 6 August 2008
 Cathay Pacific Airways 2010 Interim Results 04 August 2010 Cathay Pacific Airways 2008 Interim Results 6 August 2008 Interim Result 1H 2010 1H 2009 Group Profit/(Loss) HK$6,840m HK$812m Group Turnover
Agenda. Conclusion of Transform Key Perform 2020 initiatives. Perform 2020 financial framework. Information meeting
 Information meeting Agenda Conclusion of Transform 2015 Key Perform 2020 initiatives Perform 2020 financial framework 2 Transform 2015: first phase of group turnaround accomplished Strict capacity discipline
TRAFFIC GROWS BY 35%, PROFITS INCREASE BY 44% TO 104.5M
 TRAFFIC GROWS BY 35%, PROFITS INCREASE BY 44% TO 104.5M Ryanair, Europe s largest low fares airline today (25 June 2001) announced a strong set of results for the year end March, 2001. Traffic for the
Annex B FREIGHT IN WALES STATISTICS
 Annex B FREIGHT IN WALES STATISTICS Ports Table 1 shows the weight of freight traffic handled by Welsh ports in 212. Bristol and Liverpool are included for comparison purposes. The busiest ports in Wales,
Globus Maritime Limited Trading Update and Financial Highlights for the Three Months and Nine Months Ended September 30, 2007.
 Globus Maritime Limited Trading Update and Financial Highlights for the Three Months and Nine Months Ended September 30, 2007. Athens, Greece, November 15, 2007. Globus Maritime Limited (AIM: GLBS), a
Part 1 Performance Highlights. Part 2 Business Overview. Part 3 Financial Review
 August 216 1 Part 1 Performance Highlights Part 2 Business Overview Part 3 Financial Review Part 4 Outlook 2 Under IFRS 3 Part 1 Performance Highlights Performance Highlights - Key Operational Metrics
Air China Limited Annual Results. March Under IFRS
 Air China Limited 21 Annual Results Under IFRS March 211 Agenda Part 1 Highlights Part 2 Business Overview Part 3 Financial Overview Part 4 Outlook 2 Part 1 Highlights Steady Economic Growth; Asia Pacific
Interim results. 11 May 2010
 Interim results 11 May 2010 Introduction Andy Harrison Chief Executive Officer Strong performance despite disruption Improvement in revenue, margins and cash Continued network improvement has driven better
RYANAIR ANNOUNCES RECORD Q1 PROFIT INCREASE
 RYANAIR ANNOUNCES RECORD Q1 PROFIT INCREASE Ryanair, Europe s largest low fares airline today (Tuesday, 6 Aug 2002) announced its biggest increase in Q1 profits (end 30 Jun 02). Passenger traffic during
THIRD QUARTER 2016 RESULTS. 3 November 2016
 THIRD QUARTER 2016 RESULTS 3 November 2016 Highlights of the Third Quarter 2016 Environment Operations Financial highlights Strong increase in airline industry capacity Terrorist attacks in Europe resulting
Consolidated Statement of Financial Position as at December 31, 2017
 86 Key Figures Consolidated Statement of Financial Position as at December 31, 2017 Assets in million December 31, 2017 December 31, 2016 Non-current assets Goodwill 19.3 19.3 Investments in airport operating
EADS: New Stage of Maturity. Nathalie Errard VP Investor Relations
 EADS: New Stage of Maturity Nathalie Errard VP Investor Relations Lagardere Investor Day, June 1 st, 2006 1 Content Integration and Rise to Leadership 2005 Group Financials New Challenges, New Growth 2
SAS AB:s Press Conference. Augusti 14 th 2008
 SAS AB:s Press Conference Augusti 14 th 2008 1 Weak second quarter due to unprecedented challenging market conditions Combination of record high fuel prices and economic slowdown probably largest industry
M.A.G INTERIM REPORT AND ACCOUNTS. magworld.co.uk. Six months ended 30 September 2013
 2013-14 M.A.G INTERIM REPORT AND ACCOUNTS Six months ended 30 September 2013 magworld.co.uk 02 Contents CONTENTS OUR BUSINESS 04 FINANCIAL AND BUSINESS HIGHLIGHTS Chief Executive s review 06 Financial
Highlights from the Annual Results December 2007
 Highlights from the Annual Results December 2007 Disclaimer The information in this document is taken from the BAA 2007 Annual Results ( the Results ) which were published on 11 March 2008 and other public
SAS Group Q Teleconference August 8, 2012
 SAS Group Q2 2012 Teleconference August 8, 2012 1 Q2 4Excellence delivers tangible results Unit cost down 4% EBT (before non rec.) MSEK 137 EBT MSEK 371 Positive cash flow from operating activities MSEK
Investment Highlights
 Third Quarter 2014 Investment Highlights 1 Mexican airport portfolio positioned to take full advantage of global growth. 2 Diversified business model contributing to earnings resilience. 3 Well-defined
Hotel Market Performance and Expansion Opportunities Aiden Murphy, Crowe Horwath. 8 th November 2016 Audit Tax Advisory Audit Tax Advisory
 Hotel Market Performance and Expansion Opportunities Aiden Murphy, Crowe Horwath 8 th November 2016 Audit Tax Advisory Audit Tax Advisory 1 Introduction Ireland Hotel Supply Current hotel performance 2016
United Continental Holdings, Inc (NYSE: UAL) ONE YEAR PRICE RANGE : $ LAST PRICE: $ ANALYST RATING: Sell
 ONE YEAR PRICE RANGE : $ LAST PRICE: $ ANALYST RATING: Sell") United Continental Holdings, Inc (NYSE: UAL) ONE YEAR PRICE RANGE : $61.91 68.76 LAST PRICE: $68.39 ANALYST RATING: Sell VALUATION DATE: August 3, 2017 NEXT EARNINGS DATE: October 17, 2017 Investment Thesis:
United Continental Holdings, Inc (NYSE: UAL) ONE YEAR PRICE RANGE : $61.91 68.76 LAST PRICE: $68.39 ANALYST RATING: Sell VALUATION DATE: August 3, 2017 NEXT EARNINGS DATE: October 17, 2017 Investment Thesis:
THE GO-AHEAD GROUP PLC HALF YEAR RESULTS FOR THE SIX MONTHS ENDED 29 DECEMBER 2018
 THE GO-AHEAD GROUP PLC HALF YEAR RESULTS FOR THE SIX MONTHS ENDED 29 DECEMBER 2018 BUSINESS OVERVIEW Continued good progress made in all three strategic pillars: protect and grow the core; win new bus
Finnair Q Result
 Finnair Q1 2015 Result 7 May 2015 CEO Pekka Vauramo, Interim CFO Mika Stirkkinen 1 Turbulent market environment The weakness of the Finnish economy continued to be reflected in the demand in the first
Annual General Meeting May 3 rd FULL YEAR RESULTS DELIVERING OUR PROMISE
 Annual General Meeting May 3 rd 2018 2017 FULL YEAR RESULTS DELIVERING OUR PROMISE Key Value Drivers By focusing on our customers, our people, our brands and our growth strategy: We continue to outperform
Management Presentation. March 2016
 Management Presentation March 2016 Forward looking statements This presentation as well as oral statements made by officers or directors of Allegiant Travel Company, its advisors and affiliates (collectively
Summary of Results for the First Quarter of FY2015/3
 Summary of for the First Quarter of FY2015/3 August 8, 2014 Tokyu Corporation (9005) http://www.tokyu.co.jp/ Contents Ⅰ.Executive Summary 2 Ⅱ.Conditions in Each Business 4 Ⅲ.Details of Financial for the
Analysts and Investors conference call. Q results. 15 May 2013
 Analysts and Investors conference call Q1 2013 results 15 May 2013 Management summary Key messages of Q1 2013 +6% +9% +3.3%p. Q1 2013 operational KPIs are in line with 109.7 116.2 6.5 7.1 82.3 85.6 expectations,
COACH & GROUP TRAVEL EUROPEAN FERRY GUIDE PRICE LIST 2019
 COACH & GROUP TRAVEL EUROPEAN FERRY GUIDE PRICE LIST 2019 WELCOME TO EUROPE S LARGEST FERRY ROUTE NETWORK NORWAY Oslo Nynäshamn Frederikshavn Grenaa DENMARK SWEDEN Gothenburg Varberg Karlskrona Trelleborg
Heathrow (SP) Limited
 Limited") 28 April 2014 Heathrow (SP) Limited Results for three months ended 31 March 2014 Strong operational and financial performance at the outset of the new regulatory period Highest ever passenger satisfaction
28 April 2014 Heathrow (SP) Limited Results for three months ended 31 March 2014 Strong operational and financial performance at the outset of the new regulatory period Highest ever passenger satisfaction
Flughafen Wien AG results in Q1 2015: Increased revenue and earnings despite passenger decline
 Flughafen Wien AG results in Q1 2015: Increased revenue and earnings despite passenger decline REVENUE up slightly to 140.7 million (+0.9%), EBITDA improved to 54.0 million (+1.4%) and EBIT rose to 21.9
Air China Limited 2014 Annual Results Under IFRS
 Air China Limited 2014 Annual Results Under IFRS March 2015 Agenda Part 1 Results Highlights Part 2 Business Overview Part 3 Financial Overview Part 4 Outlook Part 1 Results Highlights Gradual Global Economic
SHAPING A SUSTAINABLE FUTURE
 SHAPING A SUSTAINABLE FUTURE Full Year Results Year ended 31 March 2017 Analyst and Investor Presentation 8 June 2017 Agenda Introduction Christine Ourmieres-Widener Financial Review Philip de Klerk Performance
Ryannair Holdings plc. Sample 8
 GCE Business Studies Aer Lingus plc Ryannair Sample 8 GCE Business Study the information below and answer the questions that follow. The following are two public limited companies that operate within the
BAA (SP) Limited Results for six months ended 30 June July 2011
 Limited Results for six months ended 30 June July 2011") BAA (SP) Limited Results for six months ended 30 June 2011 July 2011 Record Q2 Heathrow traffic Good overall service standards Strong financial results Successful dollar and sterling financings H1 2011
BAA (SP) Limited Results for six months ended 30 June 2011 July 2011 Record Q2 Heathrow traffic Good overall service standards Strong financial results Successful dollar and sterling financings H1 2011
Morgan Stanley 2011 Emerging Companies Conference 9 June 2011
 Morgan Stanley 2011 Emerging Companies Conference 9 June 2011 Company Overview Mermaid Marine Australia Limited (MMA) is Australia s largest integrated marine services provider to the offshore oil and
Air China Limited Interim Results. August Under IFRS
 Air China Limited 21 Interim Results Under IFRS August 21 1 Agenda 21 Interim Results Overview Business Overview Financial Overview Outlook 2 2 2 21 Interim Results 3 21 Interim Results Overview 4 4 4
TUI Group Investor Presentation
 TUI Group Investor Presentation WestLB Deutschland Conference Frankfurt, 18-19 November 2009 TUI AG Investor Relations Seite 1 Agenda I. Group overview II. Financials III. Outlook 2009 IV. Financing update
2017 results: REVENUE up to million (+1.6%), NET PROFIT FOR THE PERIOD 1 shows significant increase to million (+12.
, NET PROFIT FOR THE PERIOD 1 shows significant increase to million (+12.") Business Results in 2017: Significant Rise in Profits of the Flughafen Wien Group Management Board Announces Substantial Upward Revision of Earnings Guidance and Traffic Figures for 2018 2017 results:
Business Results in 2017: Significant Rise in Profits of the Flughafen Wien Group Management Board Announces Substantial Upward Revision of Earnings Guidance and Traffic Figures for 2018 2017 results:
Half-yearly Report 2013
 Half-yearly Report 2013 Financial result unchanged PORT OF ROTTERDAM THROUGHPUT DECREASED SLIGHTLY Throughput in the port of Rotterdam in the first half of the year decreased by 0.9% compared to the first
Six Continents PLC. Preliminary Results. For the Year ended 30th September 2001
 1 2 Six Continents PLC Preliminary Results For the Year ended 30th September 2001 3 SIR IAN PROSSER Chairman Business Results Operating Profit ( m)( 4 Six Continents Hotels 427 Up 13.6% Six Continents
INTERIM REPORT JANUARY-JUNE 2012 BJÖRN ROSENGREN, PRESIDENT & CEO 18 JULY 2012
 INTERIM REPORT JANUARY-JUNE 212 BJÖRN ROSENGREN, PRESIDENT & CEO 18 JULY 212 Highlights Q2/212 Order intake EUR 1,198 million, +2% Net sales EUR 1,99 million, +6% Book-to-bill 1.9 (1.13) EBIT EUR 113 million,
SAS Group 1 st interim report 2011
 SAS Group 1 st interim report 2011 Media/analyst presentation May 10, 2011 Q1 Improved earnings driven by Core SAS cost reductions Continued strong macro development in Scandinavia Additional capacity
Strengthened SAS delivers positive result in Q3
 SAS Group Q3 2012/13 1 Strengthened SAS delivers positive result in Q3 Passenger revenues up 5.3% (FX adjusted) 32 new routes introduced Capacity up 7.7% Traffic up 5.6% Yield down 0.6% Restructuring status
Interim Report 6m 2014
 August 11, 2014 Interim Report 6m 2014 Investors and Analysts Conference Call on August 11, 2014 Joachim Müller, CFO Latest ad-hoc release (August 4, 2014) Reduction of forecast, primarily due to a further
Managing through disruption
 28 July 2016 Third quarter results for the three months ended 30 June 2016 Managing through disruption 3 months ended Like-for-like (ii) m (unless otherwise stated) Change 30 June 2016 30 June 2015 change
1.3% millionn euros. Net debt of 5.4 improvement. euros to. Financial Year. the Air. operating. equipped. ness and. also focus on.
 25 th July 2014 Financial Year 2014: First Half results SECOND QUARTER Revenues of 6.45 billion euros, upp 1.7% like-for-like; passenger unit revenue up 1.3% at constant currency thanks to strict capacity
More cruise nights and marginally improved result
 INTERIM REPORT FOR Q1 2011 HIGHLIGHTS More cruise nights and marginally improved result Pre-tax result improved by NOK 7 million from Q1 2010 8.6% more cruise nights improved the capacity utilization to
Presentation to Analysts. 20 August
 Presentation to Analysts 20 August 2015 1 2015 Result Highlights Parent NPAT up 2.9% to $64.7M Underlying Group NPAT up 1.0 % to $79.0M Group EBITDA up 1.7% to $145M Final dividend of 30 cents per share
TUI Group Factbook. December 2016
 TUI Group Factbook December 2016 TUI Group at a glance A clear structure to deliver growth and value Tourism Marketing & Sales in Source Markets Tour operator Travel Agencies Internet Portals Mobile Services
RYANAIR ANNOUNCES RECORD Q3 RESULTS NET PROFIT RISES 30% TO 48M FULL YEAR GUIDANCE RAISED FROM 350M TO 390M
 RYANAIR ANNOUNCES RECORD Q3 RESULTS NET PROFIT RISES 30% TO 48M FULL YEAR GUIDANCE RAISED FROM 350M TO 390M Ryanair, Europe s biggest low fares airline, today (5 th Feb) announced record Q3 results. Net