Circumnavigation HELM PwC Economy of the Sea Barometer (World)
|
|
|
- Amber Allison
- 5 years ago
- Views:
Transcription

1 HELM PwC Economy of the Sea Barometer (World) In-depth HELM December 2017 Edition nº3
2 2
3 One simply needs to grab an old conch shell to distinctly hear the great voice of the sea. The conch was born with the sea and has retained its voice ever since. - I have never forgotten its voice... Raul Brandão 3
4 This communication is of informative nature and intended for general purposes only. It does not address any particular person or entity nor does it relate to any specific situation or circumstance. PwC will not accept any responsibility arising from reliance on information hereby transmitted. which is not intended to be a substitute for specific professional business advice. 4
5 Index Introduction 7 Executive summary HELM PwC Economy of the Sea Barometer (World) International context Maritime transport. ports and logistics Shipbuilding, maintenance and equipment Offshore energy Naval security power, piracy and maritime disasters (oil spills) Fishing and aquaculture Entertainment, sports, tourism and culture 99 Economy of the sea map List of Tables, Figures and Acronyms
6 : HELM PwC Economy of the Sea Barometer (World) 3 rd Edition- December 2017 is a PwC social responsibility and thought leadership initiative that includes three documents: - : HELM PwC Economy of the Sea Barometer (World) Summary - : HELM PwC Economy of the Sea Barometer (World) In-depth - Economy of the Sea Map The economy of the sea is an integrated approach to sea activities with the aim to promote growth and development in a sustainable way. Please see PwC social responsibility and thought leadership projects about the economy of the sea in 6
7 Introduction 7
8 8
9 Introduction The sea is a valuable global asset that needs to be preserved and valued. Only with greater knowledge and an integrated view of this extensive resource are we able to ensure development in line with the principles of environmental, economic and social sustainability of marine resources. PwC s social responsibility project, HELM PwC Economy of the Sea Barometer (World), systematizes, in a summarized form, quantitative information on various industries of the sea, enabling the identification of trends of ocean-related industries, and rankings, overlapped on a world map, to help identify the intensity of ocean use in every region of the world. The results of this exercise are clear. In the period 2005 to 2016, in which there was a profound financial and economic crisis on a global scale, during which time Asia - and in particular the China - took the lead in fisheries, aquaculture, cargo handling at ports and shipbuilding. The world's top 10 container ports are in Asia and seven of these are in China. In 2014, Chinese fisheries and aquaculture represented, respectively, 18.2% and 61.6% of total world output of these sectors. Only in the production of offshore energy, the ownership and operation of merchant ships, tourism (cruise) and sports does America and Europe remain ahead of Asia. Africa and South America are regions that will yet reveal important future economy of the sea opportunities. Australia and New Zealand, in particular, are key in the economy of the sea in Oceania and in the World. The period was also one of increased environmental stress (particularly oil spills) and sea piracy (more than 4,000 people were subjected to maritime piracy attacks, more than 3,700 were taken hostage and 28 were killed - Somalia, Nigeria and Indonesia had the greatest incidence of attacks). In regards to national defence, United States of America, China and Russia are the three main naval powers. The five principal oceans: the Atlantic Ocean, the Indian Ocean, the Pacific Ocean, the Arctic Ocean and the Southern Ocean, together with the other seas of the world, are valuable assets that should be enjoyed by mankind sustainably. Several industries operate in or on this huge natural resource, producing wealth and generating jobs. In order to exploit all this wealth sustainably, it is essential to understand it better, becoming familiar with each of the industries, how they interact with each other, their evolution and how intensively they use the sea around the world. The HELM PwC Economy of the Sea Barometer (World) is a contribution of reference about the economy of the sea in the world. It may be also seen as a voyage around the world in which the key countries for each sea industry are identified, this is why this publication has been entitled. José Bernardo Territory Senior Partner (Portugal) Miguel Marques Economy of the Sea Partner Stephanie Hyde Global Clients and Industries Leader Ricardo Filipe Pinho Economy of the Sea Manager 9
10 10
11 Executive summary 11
12 Executive summary The HELM PwC Economy of the Sea Barometer (World) in-depth has two parts: 1. A summary of quantitative information on various subsectors that make up the economy of the sea in the world, including trend analysis and a number of rankings of countries by industry; 2. An economy of the sea map made by overlapping different rankings of countries by industry on a map of the world. The economy of the sea is a significant part of the world economy and, as such, is affected by the general evolution of macroeconomics. Taking into account growth rates of the various countries, it may be said that recent years have not been easy. In particular, the year 2009 was a particularly negative year in which the growth rate of global gross national product was negative (-2.1%), and the major contributors to this poor result were the developed economies (their gross domestic product fell in the order of -3.6%). In 2009, the low growth rate of gross domestic product in developing countries (+ 2.4%) was not enough to offset the negative growth in developed countries. The high growth rates of GDP recorded in 2007 (4.0%) have not yet been restored; the growth rate in 2015 and projected to 2016 were a mere 2.5% and 2.6%, respectively. 12
13 Executive summary Maritime transport, ports and logistics Recent years have seen a slowdown in global economic growth, which have negatively impacted the growth rate exports and imports. As most of the load volume is transported by sea, the maritime transport sector has been considerably affected. Although oil and gas, as well as bulk, are the load types most transported by sea, containerized cargo has been growing. Between 2006 and 2015 there was a change in the relative importance of maritime trade in developed economies compared to developing economies. In 2006, developed economies accounted for approximately 53% of the tonnage of cargo transported by sea, a figure which fell to 37% in However, the share of developing economies in 2006 was 46% and increased to 62 % in This was primarily because Europe dropped from 54% in 2006 to 38% in 2015, while Asia rose from a 37% in 2006 to 51% in Between 1980 and 2016, bulk shipping and container shipping gained weight compared to oil tankers and general load. Greece, Japan, China and Germany have the greatest concentration of ship ownership. Switzerland, Denmark, France, China and Taiwan are where the headquarters of the leading transportation companies are primarily located. Panama, Liberia, The Marshall Islands, China and Singapore have the largest ship registers. The world's ten largest container ports are Asian, and seven of these are Chinese. The world s five largest operators of ports have their headquarters in China or Singapore. 13
14 Executive summary Shipbuilding, maintenance and equipment The order backlog in global shipyards grew between 2002 and 2008; thereafter, orders decreased until from 2013 to 2015 there was an increase in the amount of orders and was followed by a decrease in At the end of 2016, 36% of ship orders were for solid bulk transport ships, immediately followed by orders for tankers for the transport of crude oil (28.4%). In 2016, China had the highest volume of orders for ships (35.6%), followed by South Korea (23%) and Japan (21.6%). European Union 28+Norway was in fourth place (9.4%). In 2016, Asia (China, South Korea and Japan), completed 84.8% of the production of ships in that year (32.1%, 33.1% and 19.6% respectively). Ship production was reduced around the world from China, India, Bangladesh and Pakistan were the locations where there was the most dismantling of bulk volume ships. Offshore energy In 2004, after the Middle East and North America and, Europe was the third largest oil and natural gas producing region of the world. By 2016, Europe had been relegated to 4th place; the Middle East continued to lead production, followed by South then North America. In 2016, more than 48% of the world's proven gas reserves belonged to Iran, Qatar and Russia. Saudi Arabia, Norway and Qatar were the three main producers of offshore oil & gas, in Since late 2014, the price of a barrel of Brent oil has been below 100 USD; in mid 2017, the price was slightly above 50 USD. The oil price decline has put pressure on the profitability of offshore operations, which are more expensive than onshore operations. Offshore wind power capacity in the world is led by four European countries (United Kingdom, Denmark and Germany), representing 76.2% of total installed capacity in the world. In fourth place, China represents 8.8% of capacity. 14
15 Executive summary Naval security power, piracy and maritime disasters (oil spills) In 2017, the country with the largest naval fleet (aircraft carriers, frigates, destroyers, corvettes and submarines) was China with 190, closely followed by Russia with 166. United States of America was third with 160 large naval craft. In 2016 Indonesia had the greatest incidence of maritime piracy attacks. Between 2010 and 2016, about 4,000 people were subjected to maritime piracy attacks, more than 3,700 were taken hostage and 28 were killed. Accidents involving oil spills have been occurring over time, all over the world. Fishing and aquaculture Between 2004 and 2014, as the world population has grown, there has been an increase in the consumption of fish and other food products per capita. In 2004, per capita consumption was 16.2 kg, rising to a per capita consumption of 20.1 kg in This increase in per capita consumption was met by increased production in aquaculture. In 2004, production in onshore and offshore aquaculture reached about 27.8 and 18.1 million tonnes, respectively, rising to 47.1 and 26.7 million tonnes in Fish caught in the sea continues to represent the largest contribution to the supply of fish, but have not grown in recent years. The top ten countries in terms of fishing, led by China with 18.2% of the catch, represent about 60% of the total of global fishing. The Pacific Ocean is where most of the fishing takes place, accounting for about 58% of the total. The fifteen species most fished represent about 1/3 of all fish caught. In 2014, 89% of world aquaculture was in Asia, and was responsible for the significant growth of aquaculture globally. Onshore aquaculture is the main contributor to the growth of aquaculture and China represents 61.6% of global aquaculture production. From 1974 to 2013, there was increasing pressure on fish stocks, significantly increasing the number of species that are in danger of overfishing. Africa and Latin America are the regions of the world with the lowest per capita consumption of fish and other sea products. 15
16 Executive summary Entertainment, sports, tourism and culture The revenue associated with cruise ships has been increasing. North America and Europe are the most important markets for cruise ships. The Caribbean still holds the largest market share in the business of cruise ships, closely followed by the Mediterranean and the rest of Europe. The number of people participating in cruises has increased. The largest cruise consumers are North Americans, immediately followed by the British and the Germans. The United States of America, Australia, New Zealand, Italy, France and the United Kingdom are the most important countries in terms of the recreational boating and marinas business. In the last four Olympic Games, Europe was the continent with more medals in canoeing, with Germany as the country that led with 32 medals. In sailing, while European countries, led by the United Kingdom, continue well classified, winning 19 medals at the last three Olympic Games, Australia appears in second place in the ranking with 11 medals. In rowing, the United Kingdom leads with 24 medals, soon followed by Australia (15) and New Zealand and Germany (12 each). In recent years, Australia and the United States of America have led in surfing. 16
17 17
18 18
19 HELM PwC Economy of the Sea Barometer (World) 19
20 HELM PwC Economy of the Sea Barometer (World) More than 2/3 of the surface area of our planet is sea. The five principal oceans: the Atlantic Ocean, the Indian Ocean, the Pacific Ocean, the Arctic Ocean and the Southern Ocean, and the other of seas of the world, are valuable assets that should be enjoyed by mankind sustainably. Several industries operate in or on this huge natural resource, producing wealth and generating jobs. In order to enhance this wealth in a sustainable way, it is essential to understand it better, becoming familiar with each of the industries and how they interact with each other, their evolution, and how intensively they use the sea around the world. The idea of the Economy of the Sea relates to the valorisation of the ocean in environmental, social and economic terms, with the aim to achieve a holistic view of all human action on sea. It includes industries like maritime transport, ports and logistics, shipbuilding, ship maintenance and repair, offshore energy, security and defence, fisheries and aquaculture, entertainment, sport, tourism and leisure. Learning more about the oceans, also means learning more about maritime industries, in particular, it is crucial to quantify their economic development in each region. There has been some quantitative information by industry, but there are few studies that quantify the economic development of all the industries related to the sea. With HELM PwC Economy of the Sea Barometer (World), we intend to build a tool that allows us to clarify the current situation in respect to the sea as a resource in the world, as well as its development prospects in the future. The HELM is meant to be a monitoring tool that allows its users to draw useful information, easily and quickly. The HELM is a long-term project, which will act as a compilation of data for monitoring, over time, the evolution of the economy of the sea in the world and simultaneously enable us to analyse trends and the choices that are made by the various economic agents. Several efforts have been made by various entities in order to quantitatively evaluate the importance of the economy of the sea. Progress has been made; however, the weight of economic activities related to the sea in total world economy remains difficult to measure and evaluate. The indicators do not allow us to measure with complete accuracy or continuously, the actual impact of these activities in the global economy. 20
21 HELM PwC Economy of the Sea Barometer (World) The HELM PwC Economy of the Sea Barometer (World) has two parts: 1. A summary of quantitative information on various subsectors that make up the economy of the sea in the world, including trend analysis and a number of rankings of countries by industry; 2. An economy of the sea map made by overlapping different rankings of countries by industry on a map of the world. Sea industries considered Relevant sub-sectors within the sea economy of the world considered in summary quantitative information: - Maritime transport, ports and logistics; - Shipbuilding, ship repair and maintenance; - Offshore energy; - Security and defence; - Fishing and aquaculture; - Entertainment, sport, tourism and leisure. There is another set of sub-sectors, such as offshore mineral resources and blue biotechnology that, although reveal a huge potential, will still take some time to gain importance in the global economy. Rankings Taking into account the existing quantitative information and respective representation that the variable has on the industry analysis, the following variables were selected for the preparation of rankings considered in the Economy of the Sea Map: - Ownership of the world fleet (top countries); - Top container terminals; - Shipbuilding completions (top countries); - Offshore oil & gas production (top countries); - Offshore wind capacity (top countries); - Aircraft Carriers + Frigates + Destroyers + Corvettes + Submarines (top countries); - Pirate attacks locations; - Marine capture fisheries (top countries); - Aquaculture (top countries); - Cruises (top markets); - Olympic medals in sailing (top countries); - Commercial shipping trading track with the highest traffic. 21
22 HELM PwC Economy of the Sea Barometer (World) Update of the quantitative information As mentioned above, quantification and measurement of the economy of the sea remains difficult. However, as time goes by, new sources of information appear and new reliable indicators may be used. In this context, every year we do a careful review of all the variables that compose the quantitative summary information and update it with relevant information, which has since become available. Similarly, every year, reconfirm that the comparative data of information sources quantitative information summary remain stable. In case of restatement, by the issuer, we proceed to the respective update summary quantitative information. 22
23 23
24 24
25 International context 25
26 International context Exclusive Economic Zones Countries with the largest exclusive economic zones have larger potential benefits. Below are the rankings of 25 countries with the largest exclusive economic zones. Table 1: Top 25 Exclusive Economic Zones, 2016 (in millions of km 2 ) EEZ (Millions of Km2) USA 12.2 Federated States of Micronesia 3.0 France 10.1 Denmark 2.6 Australia 9.1 Norway 2.4 Russia 7.6 Papua New Guinea 2.4 United Kingdom 6.8 India 2.3 Indonesia 6.0 Marshall Islands 2.0 Canada 5.7 Philippines 1.8 New Zealand 4.1 Portugal 1.7 Japan 4.0 Solomon Islands 1.6 Brazil 3.7 South Africa 1.5 Chile 3.7 Republic of Mauritius 1.3 Kiribati 3.5 Seychelles 1.3 Mexico 3.3 Source: Marineregions.org 26
27 International context World Economic Growth The economy of the sea is a significant part of the world economy and, as such, is affected by the general evolution of macroeconomics. Taking into account growth rates of the various countries, it may be said that recent years have not been easy. In particular, the year 2009 was a particularly negative year in which the growth rate of global gross national product was negative (-2.1%). and the major contributors to this poor result were the developed economies (their gross domestic product fell in the order of -3.6%). In 2009, the low growth rate of gross domestic product in developing countries (+2.4%) was not enough to offset the negative growth in developed countries. Since then, despite a sharp growth in 20012, in 20012, the world economy showed a slower growth rate, while remaining relatively stable over the next few years. 2.5% in 2015 and 2.3% in Table 2: World GDP growth, (annual percentage change) Region/country ª World 1.5% -2.1% 4.1% 2.8% 2.2% 2.2% 2.5% 2.5% 2.3% a Developed countries 0.1% -3.6% 2.6% 1.5% 1.1% 1.1% 1.7% 2.0% 1.6% of which: Japan -1.0% -5.5% 4.7% -0.5% 1.7% 1.4% 0.0% 0.5% 0.7% USA -0.3% -2.8% 2.5% 1.6% 2.2% 1.7% 2.4% 2.6% 1.6% European Union (EU-28) 0.4% -4.4% 2.1% 1.8% -0.4% 0.3% 1.4% 2.0% 1.8% South-East Europe and CIS 5.4% -6.6% 4.7% 4.6% 3.3% 2.0% 0.9% -2.8% 0.0% b South-East Europe 5.8% -1.9% 1.5% 1.7% -0.6% 2.4% 0.3% 2.0% 2.8% CIS. incl. Georgia 5.3% -6.8% 4.9% 4.8% 3.5% 2.0% 0.9% -3.0% -0.2% of which: Russia 5.2% -7.8% 4.5% 4.3% 3.5% 1.3% 0.7% -3.7% -0.3% Developing countries 5.2% 2.4% 7.8% 5.9% 4.8% 4.6% 4.4% 3.9% 3.8% Africa 5.5% 3.2% 5.2% 1.1% 5.6% 2.0% 3.7% 2.9% 2.0% Latin America and the Caribbean 3.7% -2.1% 5.9% 4.5% 3.0% 2.7% 1.1% 0.2% -0.2% Asia 5.7% 3.8% 8.8% 7.0% 5.2% 5.5% 5.5% 5.1% 5.1% of which: China 9.6% 9.2% 10.6% 9.5% 7.7% 7.7% 7.3% 6.9% 6.7% India 6.2% 5.0% 11.0% 6.1% 4.9% 6.3% 7.0% 7.2% 7.6% Oceania 2.0% 0.8% 4.1% 3.7% 2.7% 2.2% 3.6% 4.7% 2.9% Note: Calculations for country aggregates are based on GDP at constant 2005 dollars. a) Forecasts. b) Albania. Bosnia and Herzegovina. Montenegro. Serbia and the former Yugoslav Republic of Macedonia. Source: UNCTAD Trade and Development Report
28 28
29 Maritime transport, ports and logistics 29
30 Maritime transport, ports and logistics Recent years have seen a slowdown in global economic growth, which resulted in a fall in the growth rate of export volume and import volumes. As shown in the table below, the growth rate of export volume in the world in 2013 was 3.3%. falling to 1.4% in The same goes in the growth rate of the import volume in the world: in 2013, it was 2.7%; by 2015, it was 1.6%. This decline in the growth rate of exports and imports affected all developed countries. In developing countries, the growth rate of imports rose in Table 3: Growth in the volume of merchandise trade, (annual percentage change) Exports Imports Country/Region % 2.3% 1.4% World 2.7% 2.4% 1.6% 2.2% 1.9% 2.2% Developed Economies 0.0% 2.8% 3.3% 1.8% 1.7% 3.2% European Union -0.9% 3.3% 3.6% -1.5% 0.6% -1.0% Japan 0.3% 0.6% -2.8% 2.8% 4.4% -0.2% USA 1.0% 4.3% 4.8% 4.6% 3.1% 0.4% Developing Countries 6.3% 2.5% 0.4% -0.7% 0.0% 2.1% Africa 6.5% 5.7% 1.5% 1.9% 3.3% 2.9% Developing American Countries 3.6% 0.2% -1.8% 5.6% 3.3% -0.1% Developing Asian Countries 6.8% 2.6% 0.7% 6.7% 4.9% -0.5% West Asia 8.9% 2.8% -1.6% 7.7% 6.8% -0.9% China 9.9% 3.9% -2.2% 4.1% 5.2% -0.2% South Asia -0.4% 4.6% 7.2% 8.5% 3.5% -2.1% India -0.3% 3.2% 10.1% 4.7% 3.5% -0.3% Southeast Asia 4.3% 1.7% 2.8% 3.8% -2.3% 2.0% West Asia 7.4% 1.8% 2.0% 2.3% 0.5% 0.9% Economies in transition -0.5% -7.6% -19.4% Note: Data on trade volumes are derived from international merchandise trade values deflated by UNCTAD unit value indices. Source: UNCTAD - Review of Maritime Transport
31 Maritime transport, ports and logistics Most cargo is transported by sea and, Consequently, the maritime transport sector was impacted by slowing growth of exports and imports globally. Although oil and gas, as well as bulk, are the load types most transported by sea, containerized cargo has been growing. Table 4: International seaborne trade, selected years (millions of tonnes loaded) Year Container Other dry cargo Major Bulk Products Oil and gas , , , , , ,125 1,105 2, ,928 1,295 2, ,001 1,975 1,711 2, ,076 2,112 1,814 2, ,193 2,141 1,953 2, ,249 2,173 2,065 2, ,127 2,004 2,085 2, ,280 2,022 2,335 2, ,393 2,112 2,486 2, ,464 2,150 2,742 2, ,544 2,218 2,923 2, ,640 2,393 2,985 2, ,687 2,463 2,951 2,947 Source: UNCTAD - Review of Maritime Transport 2016 Figure 1: International seaborne trade, selected years (millions of tonnes loaded) 12,000 10,000 8,000 6,000 4,000 Oil and gas Five major bulks Other dry cargo Container 2, Source: UNCTAD - Review of Maritime Transport
32 Maritime transport, ports and logistics Between 2006 and 2015 there was a change in the relative importance of maritime trade in developed economies compared to developing economies. In developed economies accounted for approximately 53% of the tonnage of cargo transported by sea, a figure which fell to 37% in However. the share of developing economies in 2006 was 46% and increased to 62% in This was primarily because Europe dropped from 54% in 2006 to 38% in 2015, while Asia rose from a 37% in 2006 to 51% in Table 5: World seaborne trade in , by type of cargo, country group and region (millions of tonnes) Goods unloaded (millions of tonnes) Region/country Year Total Crude Petroleum products and gas Dry cargo Share of the total a World Developed economies Transition economies Developing economies Africa America Asia Europe ,878 1, , % ,033 1,916 1,185 6, % ,165 1, ,347 53% , ,209 37% % % , ,644 46% , ,670 62% % % % % , ,105 37% , ,861 51% ,235 1, ,409 54% , ,262 38% Oceania % % Source: UNCTAD - Review of Maritime Transport
33 Maritime transport, ports and logistics The largest consumers of oil and natural gas worldwide are East Asia and North America. Table 6: Major producers and consumers of oil and natural gas, 2015 (% world market share) World oil production World oil consumption Western Asia 32% Asia Pacific 34% North America 19% North America 23% Transition economies 15% Europe 13% Developing America 11% Developing America 9% Africa 10% Western Asia 11% Asia Pacific 9% Transition economies 6% Europe 4% Africa 4% World natural gas production World natural gas consumption North America 26% North America 25% Transition economies 22% Asia Pacific 20% Western Asia 17% Transition economies 16% Asia Pacific 15% Western Asia 14% Europe 7% Europe 13% Developing America 7% Developing America 8% Africa 6% Africa 4% Note: Oil includes crude oil. shale oil. oil sands and natural gas liquids. The term excludes liquid fuels from other sources such as biomass and coal derivatives. Source: UNCTAD - Review of Maritime Transport
34 Maritime transport, ports and logistics At a global level, shipping containers have increased by a large degree; however, with the 2009 global crisis and a decrease of world gross domestic product, there was a negative growth of containerization in that year. Figure 2: Global containerized trade, (millions of TEUs and annual percentage change) Million TEUs Percentage Change Source: UNCTAD - Review of Maritime Transport
35 Maritime transport, ports and logistics In Terms of Container Transport in 2015 the interregional and South-South routes in 2015 had 40% of the total number of TEUs transported while the east-west Continental route had 29%. Table 7: Distribution of global containerized trade by route (millions of TEUs) Year Intraregional & South- South North-South Trans-Pacific Far East-Europe Secondary East- West Transatlantic (millions of TEUs) (percentage share of TEUs) Year Intraregional & South-South Continent East-West North-South Secondary East-West (% of TEUs) % 30% 17% 13% % 29% 18% 13% Source: UNCTAD - Review of Maritime Transport Table 8: Containerized cargo flows on major East-West container trade routes, (millions de TEUs) Year Transpacific Europe-Asia Transatlantic (millions of TEUs) Source: UNCTAD - Review of Maritime Transport
36 Maritime transport, ports and logistics Asia, and particularly China, is the main importer of iron, coal and grain, while the American Continent and Australia are the main exporters of these strategic products. China produces and consumes the largest amount of steel. Table 9: Some major dry bulks and steel: Main producers, users, exporters and importers, 2015 (% world market share) Steel Producers % Steel Consumers % China 50% China 46% Japan 6% USA 7% India 6% India 5% USA 5% Japan 4% Russia 4% South Korea 4% South Korea 4% Russia 3% Germany 3% Germany 3% Brazil 2% Turkey 2% Turkey 2% Mexico 1% Ukraine 1% Brazil 1% Other 17% Other 24% Iron Ore Exporters % Iron Ore Importers % Australia 54% China 70% Brazil 27% Japan 10% South Africa 5% Europe 8% Canada 3% South Korea 5% Ukraine 1% Outros 7% Sweden 1% Others 9% Coal Exporters % Coal Importers % Australia 33% India 19% Indonesia 32% Japan 16% Russia 9% Europe 15% Colombia 7% China 14% South Africa 7% South Korea 11% USA 5% Taiwan 5% Canada 2% Malaysia 2% Other 5% Thailand 2% Other 16% Grain Exporters % Grain Importers % USA 22% Asia 33% Russia 19% Africa 22% European Union 14% Developing America 19% Ukraine 11% Western Asia 16% Argentina 9% Europe 7% Canada 8% Economies in transition 3% Other 17% Source: UNCTAD - Review of Maritime Transport
37 Maritime transport, ports and logistics From 1980 to 2016 bulk ship and containers have gained relative weight compared to oil and general load tankers. Table 10: World fleet by principal vessel types, (beginning-of-year figures, % share of DWT) Year Other Container General cargo Dry bulk Oil tanker % 1.6% 17.0% 27.2% 49.7% % 3.9% 15.6% 35.6% 37.4% % 8.0% 12.7% 34.6% 35.4% % 13.3% 8.5% 35.8% 35.3% % 12.8% 4.6% 43.1% 28.6% % 13.0% 4.4% 43.5% 28.0% % 13.5% 4.2% 43.1% 27.9% Note: All propelled seagoing merchant vessels of 100 GT and above. excluding inland waterway vessels. fishing vessels. military vessels. yachts. and offshore fixed and mobile platforms and barges (with the exception of FPSOs and drill ships). Source: UNCTAD - Review of Maritime Transport 2016 Figure 3: World fleet by principal vessel types, (beginning-of-year figures, % share of DWT) 100% 90% 80% 70% 60% 50% 40% 30% Oil tanker Dry bulk General cargo Container Other 20% 10% 0% Source: UNCTAD - Review of Maritime Transport
38 Maritime transport, ports and logistics Greece, Japan, China and Germany are the countries with the highest concentration of ship ownership. Table 11: Ownership of the world fleet, as of 1 January 2016 (thousands of DWT and no. of ships) Dead-weight tonnage (thousands of DWT) Beneficial Owner Location ª Number of ships Greece 293,087 4,136 Japan 228,980 3,969 China 158,884 4,960 Germany 119,181 3,361 Singapore 95,312 2,553 Hong Kong SAR (China) 87,375 1,448 South Korea 78,834 1,634 USA 60,279 1,995 United Kingdom 51,441 1,329 Bermuda 48, Norway 48,188 1,854 Taiwan 46, Denmark 38, Monaco 29, Turkey 27,951 1,540 Italy 22, Belgium 22, India 21, Switzerland 20, Russia 18,144 1,680 Iran 17, Note: Vessels of 1,000 GT and above. a Beneficial ownership location indicates the country/economy in which the company that has the main commercial responsibility for the vessel is located. Source: UNCTAD - Review of Maritime Transport 2016 Ranking included in the economy of the sea map. 38
39 Maritime transport, ports and logistics The headquarters of the leading transportation companies are primarily located in Denmark, Switzerland, France, China, Germany and Taiwan. Table 12: The 20 leading liner companies (headquarters country) (number of ships and total shipboard capacity deployed, in TEUs, ranked by TEU) Ranking Headquarters Vessels TEU Denmark ,792,124 3,059,984 3,007,392 2 Switzerland ,495,439 2,703,404 2,661,135 3 France ,691,290 1,873,439 1,829,951 4 China ,524,588 1,608,456 1,554,434 5 Germany , , ,194 6 Taiwan , , ,957 7 Germany , , ,549 8 South Korea , , ,665 9 China , , , Singapore , , , Japan , , , Taiwan , , , Kuwait , , , Japan , , , South Korea , , , Japan , , , Israel , , , Singapore , , , Taiwan , , , Singapore , , ,686 Note: Includes all container transport ships operated by maritime companies. From 2016 to June 31 st Source: UNCTAD - Review of Maritime Transport
40 Maritime transport, ports and logistics Panama, Liberia, The Marshall Islands, China and Singapore have the largest ship registers. Table 13: The 20 flags of registration with the largest registered fleets, as of January 1 st 2016 (DWT) Flag of Registration Number of ships Dead-weight tonnage (thousand DWT) Per cent of world total (DWT) Panama 8,351 8, , , % 18.5% Liberia 3,143 3, , , % 11.4% Marshall Islands 2,580 2, , , % 11.1% China, Hong Kong SAR 2,425 2, , , % 9.0% Singapore 3,689 3, , , % 7.0% Malta 1,895 2,101 82,002 94, % 5.3% Bahamas 1,421 1,450 75,779 79, % 4.4% China 3,941 4,052 75,676 75, % 4.2% Greece 1,484 1,386 78,728 73, % 4.1% Cyprus 1,629 1,053 33,664 33, % 1.8% Japan 5,224 5,320 22,419 31, % 1.8% Isle of Man 1, ,008 22, % 1.2% Norway 1,558 1,561 20,738 20, % 1.1% Indonesia 1,604 7,843 15,741 18, % 1.0% Denmark 7, ,656 17,185 1% 1.0% South Korea 673 1,906 16,825 16,820 1% 0.9% Italy 1,418 1,376 17,555 16,470 1% 0.9% India 1,174 1,625 15,551 16, % 0.9% United Kingdom 1,865 1,167 17,103 15,192 1% 0.8% Tanzania 1, ,703 13, % 0.7% Rest of the World 35,625 38, , , % 12.8% World Total 89,464 90,917 1,749,222 1,806, % 100% Note: Propelled seagoing merchant vessels of 1,000 GT and above; ranked by dead-weight tonnage. For a complete list of all countries for ships of 100 GT and above see NIS: Norwegian International Ship Register; DIS: Danish International Ship Register. Source: UNCTAD - Review of Maritime Transport
41 Maritime transport, ports and logistics Most ship owners register their ships in a different location from the country where they are located, looking for better conditions. Figure 4: Top 20 ship owning nations, beneficial ownership, 1 January 2016 (1,000 DWT, by country/economy of ownership) 300, , ,000 Foreign Flag National Flag 1,000 DWT 150, ,000 50,000 0 Note: Merchant ships of 1,000 GT and above with propulsion. Source: UNCTAD - Review of Maritime Transport
42 Maritime transport, ports and logistics Most ships are registered in developing countries. Table 14: Distribution of DWT capacity of vessel types, by country group of registration, January 2015 (beginning-ofyear figures, % of DWT) Total fleet Oil tankers Bulk carriers General cargo Container ships Others World total 100% 100% 100% 100% 100% 100% Developed countries 22.70% 26.26% 17.82% 28.38% 26.81% 25.75% Countries with economies in transition 0.71% 0.78% 0.26% 5.35% 0.03% 1.22% Developing countries 76.36% 72.91% 81.90% 65.41% 73.14% 71.45% of which: Africa 13.14% 17.18% 9.98% 5.96% 20.19% 9.93% America 26.74% 20.68% 31.93% 22.57% 19.75% 31.53% Asia 26.05% 21.46% 29.46% 33.92% 28.00% 18.92% Oceania 10.42% 13.60% 10.53% 2.95% 5.20% 11.07% Unknown and other 0.24% 0.05% 0.01% 0.86% 0.02% 1.57% Note: Propelled seagoing merchant vessels of 100 GT and above. Source: UNCTAD - Review of Maritime Transport
43 Maritime transport, ports and logistics The years 2011, 2013, 2014 and 2015 were years of decline in freight prices. Table 15: Container freight markets and rates Freight Market Trans-Pacific ($ per FEU) a Shanghai-USA West Coast 2,308 1,667 2,287 2,033 1,970 1,506 Percentage change 68% -28% 37% -11% -3% -24% Shanghai-USA East Coast 3,499 3,008 3,416 3,290 3,720 3,182 Percentage change 48% -14% 14% -4% 13% -14% Far East-Europe ($ per TEU) Shanghai-Northern Europe 1, ,353 1,084 1, Percentage change 28% -51% 54% -20% 7% -46% Shanghai Mediterranean 1, ,336 1,151 1, Percentage change 24% -44% 37% -14% 9% -41% North-South ($ per TEU) Shanghai-South America (Santos) 2,236 1,483 1,771 1,380 1, Percentage change -8% -34% 19% -22% -20% -59% Shanghai-Australia/New Zealand (Melbourne) 1, Percentage change -21% -35% 20% -12% -17% -27% Shanghai-West Africa (Lagos) 2,305 1,908 2,092 1,927 1,838 1,449 Percentage change 3% -17% 10% -8% -5% -21% Shanghai-South Africa (Durban) 1, , Percentage change -1% -33% 6% -23% -6% -9% Intra-Asian ($ per TEU) Shanghai-South-East Asia (Singapore) Percentage change -34% 22% -10% 1% -20% Shanghai-East Japan Percentage change 7% 2% 0% -21% -47% Shanghai-South Korea Percentage change 3% -8% 8% -5% -14% Shanghai-Hong Kong (China) Percentage change 34% -15% -35% -24% -14% Shanghai-Persian Gulf (Dubai) Percentage change 44% -9% 17% -21% 6% -36% Note: Data based on yearly averages. FEU: 40-foot equivalent unit. Source: UNCTAD - Review of Maritime Transport
44 Maritime transport, ports and logistics In the period , the supply of transport in containers grew consistently; however, in 2009, the demand decreased. The growth in demand after 2009, on average, is lower than the growth in demand before Table 16: Growth of demand and supply in container shipping (annual growth rates) Year Demand Supply % 8.5% % 8.0% % 8.0% % 8.0% % 10.5% % 13.6% % 11.8% % 10.8% % 4.9% % 8.3% % 6.8% % 4.9% % 5.0% % 7.0% % 8.0% 2016 (forecast) 4.0% 2.0% Note: Supply data refer to the total capacity of the container-carrying fleet. including multi-purpose and other vessels with some degree of container carrying capacity. Demand growth is based on million TEU lifts. The data for 2014 are projected figures. Source: UNCTAD - Review of Maritime Transport 2016 Figure 5: Growth of demand and supply in container shipping, (annual growth rates) 15.0% 10.0% 5.0% 0.0% -5.0% * Demand Supply -10.0% -15.0% Source: UNCTAD - Review of Maritime Transport
45 Maritime transport, ports and logistics The Baltic Dry Index is a reference index in the analysis of the price of maritime transport. Figure 6: Baltic Exchange Dry Index, (7 August 2017) (Index base year 1985 = 1,000 points) March 2011 June 2011 September 2011 December 2011 March 2012 June 2012 September 2012 December 2012 March 2013 June 2013 September 2013 December 2013 March 2014 June 2014 September 2014 December 2014 March 2015 June 2015 September 2015 December 2015 March 2016 June 2016 September 2016 December 2016 March 2017 June 2017 Note: The BDI is a composite of 3 sub-indices. each covering a different carrier size: Capesize. Panamax. and Supramax. Capesize carriers are the largest ships with a capacity greater than 150,000 DWT. Panamax refers to the maximum size allowed for ships travelling through the Panama Canal. typically 65,000 80,000 DWT. The Supramax Index covers carriers with a capacity of 50,000 60,000 DWT. Source: The date refers to the first day of each month. 45
46 Maritime transport, ports and logistics The world's ten largest container ports are Asian, seven are Chinese. Table 17: Top 20 container terminals and their throughput for 2013, 2014, and 2015 (million TEUs and percentage change) Port Name Country Percentage Change 2015/2014 million TEUs Shanghai China % Singapore Singapore % Shenzhen China % Ningbo e Zhou Shan China % Hong Kong Hong Kong (China) % Busan South Korea % Guangzhou China % Qingdao China % Dubai United Arab Emirates % Tianjin China % Rotterdam Netherlands % Port Klang Malaysia % Kaohsiung Taiwan % Antwerp Belgium % Dalian China % Xiamen China % Tanjung Pelepas Malaysia % Hamburg Germany % Los Angeles USA % Long Beach USA % Total top % Source: UNCTAD - Review of Maritime Transport 2016 Ranking included in the economy of the sea map. 46
47 Maritime transport, ports and logistics The five largest ports operators in the world have their headquarters in China or Singapore. Table 18: World s 10 leading ports by productivity, (millions of tonnes and percentage change) Port Country Total volume (million tonnes) Variation (%) / /2015 Ningbo and Zhoushan China % 1.83% Shanghai China % -5.02% Singapore Singapore % -1.10% Tianjin China % 0.19% Suzhou China % 12.50% Guangzhou China % 3.90% Qingdao China % 4.17% Tangshan China % -2.16% Rotterdam Netherlands % 4.88% Port Hedland Australia % 7.37% Source: UNCTAD - Review of Maritime Transport
48 48
49 Shipbuilding, maintenance and equipment 49
50 Shipbuilding, maintenance and equipment The order backlog in global shipyards grew between 2002 and 2008; thereafter, orders decreased until However, for the following three years (2013, 2014 and 2015), this trend has been reversed, decreasing, again, in Table 19: Summary of activity in World Shipyards (thousands of CGT) Year Order book New orders Completions ,807 41,705 22, ,800 45,128 25, ,200 39,588 29, ,000 57,315 34, ,740 85,277 34, ,160 42,953 41, ,200 16,554 44, ,010 38,581 51, ,440 30,823 51, ,300 24,713 47, ,900 53,839 38, ,140 45,592 36, ,660 39,644 37, ,208 10,689 35,336 Note: CGT - Compensated Gross Tonnage- International unit of measure that facilitates the comparison of different shipyards production regardless of the types of vessel produced. The CGT of a ship is calculated using a table of conversion factors published by OECD. The conversion factors vary with ship type. GT Gross Tonnage; unit of 100 cubic feet or cubic meters. used in arriving at the calculation of gross tonnage. Source: Sea Europe, Shipbuilding Market Monitoring, Report No 42, 2017 Figure 7: Summary of activity in World Shipyards 1,000 CGT 200, , , , , ,000 80,000 60,000 40,000 20, Source: Sea Europe, Shipbuilding Market Monitoring, Report No 42, 2017 Order Book New Orders Completions 50
51 Shipbuilding, maintenance and equipment The evolution of activity in Chinese shipyards has followed the growth trend of shipyards globally, although the growth recorded between 2002 and 2008 was more significant than that of the rest of the world. Table 20: Summary of activity in Chinese shipyards (thousands of CGT) Year Order book New orders Completions ,327 5,235 2, ,589 5,691 2, ,629 6,067 4, ,701 13,366 5, ,221 28,925 6, ,011 13,864 9, ,359 7,113 12, ,923 16,102 18, ,878 8,339 19, ,209 8,555 19, ,649 21,402 13, ,641 16,900 11, ,925 13,228 13, ,781 3,305 11,356 Source: Sea Europe, Shipbuilding Market Monitoring, Report No 42, 2017 Figure 8: Summary of activity in Chinese shipyards 70,000 60,000 50,000 1,000 CGT 40,000 30,000 20,000 10, Order Book New Orders Completions Source: Sea Europe, Shipbuilding Market Monitoring, Report No 42,
52 Shipbuilding, maintenance and equipment Although in general, the activity of South Korean shipyards is below that of Chinese shipyards, at the end of 2016, the number of finished ships was higher. Table 21: Summary of activity in South Korean shipyards (thousands of CGT) Year Order book New orders Completions ,368 18,671 7, ,365 15,806 8, ,243 13,960 10, ,544 21,884 11, ,389 32,969 11, ,357 14,780 14, ,576 3,383 14, ,145 11,915 14, ,529 13,615 15, ,517 7,111 13, ,169 17,437 12, ,244 12,588 11, ,257 10,120 11, ,488 2,067 11,699 Source: Sea Europe, Shipbuilding Market Monitoring, Report No 42, 2017 Figure 9: Summary of activity in South Korean shipyards 70,000 60,000 50,000 1,000 CGT 40,000 30,000 20,000 10, Order Book New Orders Completions Source: Sea Europe, Shipbuilding Market Monitoring, Report No 42,
53 Shipbuilding, maintenance and equipment The order backlog and new orders in Japan has declined in 2016, while the number of completed constructions has increased over the previous year. Table 22: Summary of activity of Japanese shipyards (thousands of CGT) Year Order book New orders Completions ,076 11,779 6, ,113 13,675 7, ,894 8,620 8, ,372 11,193 9, ,714 10,125 8, ,649 7,820 9, ,460 3,877 9, ,836 5,374 9, ,132 4,118 9, ,534 4,396 8, ,615 7,550 7, ,442 10,256 6, ,855 10,312 6, ,276 1,513 6,934 Source: Sea Europe, Shipbuilding Market Monitoring, Report No 42, 2017 Figure 10: Summary of activity of Japanese shipyards 35,000 30,000 25,000 1,000 CGT 20,000 15,000 10,000 5, Source: Sea Europe, Shipbuilding Market Monitoring, Report No 42, 2017 Order Book New Orders Completions 53
54 Shipbuilding, maintenance and equipment European yards also have experienced a recovery of the order book as from The order book did experience a slight decrease in 2016 however represented an increase in the value of completions. Table 23: Summary of activity of EU28 and Norway shipyards (thousands of CGT) Year Order book New orders Completions ,610 3,951 4, ,406 6,798 4, ,738 7,226 3, ,430 5,597 4, ,376 5,257 4, ,209 2,229 4, , , ,495 2,487 4, ,836 1,830 2, ,058 1,859 2, ,705 2,515 1, ,247 3,394 2, ,678 3,258 1, ,645 2,745 2,322 Source: Sea Europe, Shipbuilding Market Monitoring, Report No 42, 2017 Figure 11: Summary of activity of EU28 and Norway shipyards 20,000 18,000 16,000 14,000 1,000 CGT 12,000 10,000 8,000 6,000 4,000 2, Order Book New Orders Completions Source: Sea Europe, Shipbuilding Market Monitoring, Report No 42,
55 Shipbuilding, maintenance and equipment At the end of 2016, 35% of the order ships were for solid bulk load ship, immediately followed by orders for tankers for the transport of crude oil (35.3%). Table 24: Order book by Ship Types 31/12/2016 Types NO. 1,000 GT 1,000 CGT 1,000 DWT % DWT Crude Oil Tanker ,901 10,939 59, % Oil Products Tanker 200 2,940 1,931 4, % Chemical Tanker 434 7,663 5,515 12, % Other Liquids % Tankers ,509 18,395 76, % Bulk Dry ,193 16,554 75, % Bulk Dry / Oil % Self-Discharging Bulk Dry % Other Bulk Dry % Bulk Carriers ,853 16,917 76, % General Cargo 296 2,633 2,396 3, % Container ,008 15,935 36, % Refrigerated Cargo % Ro-Ro Cargo 131 5,206 3,002 1, % Other Dry Cargo % Dry Cargoes ,701 21,988 42, % LNG Tanker ,637 10,467 9, % LPG Tanker 136 3,669 2,633 4, % Gas tankers ,306 13,100 13, % Passenger/Ro-Ro Cargo 109 1,011 1, % Passenger (Cruise) 63 5,877 6, % Other Passenger Vessels/Ferries % Ferries / Passenger Ships 232 6,957 7, % Fish Catching % Other Fishing % Offshore Supply 570 1,538 3, % Other Offshore 267 6,273 5, % Research % Towing / Pushing % Dredging % Other Activities % Other Non Cargo Vessels 1,846 9,195 11, % Total 5, ,522 89, , % Source: Sea Europe, Shipbuilding Market Monitoring, Report No 42,
56 Shipbuilding, maintenance and equipment In 2016, China had the highest volume of orders for ships (35.6%), followed by South Korea (23%) and Japan (21.6%). Fourth, is the European Union 28+ Norway with 9.4%. Table 25: Order book by Country - 31/12/2016 Country NO. 1,000 GT % 1,000 CGT % Croatia % % Finland % % Germany 26 1, % 1, % Italy 33 2, % 2, % Netherlands % % Poland % % Romania 82 1, % % Spain % % United Kingdom % % Other EU , % % EU , % 8, % Norway % % Russia % % Turkey % % Ukraine % % Others % 6 0.0% Other European % 1, % Japan , % 19, % South Korea , % 20, % China 1,893 62, % 31, % Brazil 82 1, % 1, % India % % Indonesia % % Malaysia % % Philippines 75 4, % 1, % Singapore % % Taiwan % % USA % % Vietnam 168 1, % % Others 284 1, % 1, % Rest of the world 1,091 10, % 8, % World Total 5, , % 89, % Source: Sea Europe, Shipbuilding Market Monitoring, Report No 42,
57 Shipbuilding, maintenance and equipment At the end of % of new ship orders where for dry bulk transport ships immediately followed by new orders for oil tanker (33.9%) and container ships (12.8%). Table 26: New Orders by Ship types, 2016 Types NO. 1,000 GT 1,000 CGT 1,000 DWT % DWT Crude Oil Tanker 37 3,523 1,177 6, % Oil Products Tanker , % Chemical Tanker % Other Liquids % Tankers 159 4,772 2,202 7, % Bulk Dry 37 5, , % Self-Discharging Bulk Dry % Other Bulk Dry % Bulk Carriers 50 5,410 1,550 10, % General Cargo % Container 69 2,688 1,467 2, % Refrigerated Cargo % Ro-Ro Cargo % Other Dry Cargo % Dry Cargoes 146 3,568 2,191 3, % LNG Tanker % LPG Tanker % Gas tankers % Passenger/Ro-Ro Cargo % Passenger (Cruise) 26 2,197 2, % Other Passenger Vessels/Ferries % Ferries / Passenger Ships 87 2,763 2, % Fish Catching % Other Fishing % Offshore Supply % Other Offshore % Research % Towing / Pushing % Dredging % Other Activities % Other Non Cargo Vessels , % Total ,920 10,689 22, % Source: Sea Europe, Shipbuilding Market Monitoring, Report No 42,
58 Shipbuilding, maintenance and equipment Table 27: New Orders by Country, 2016 Country NO. 1,000 GT % 1,000 CGT % Croatia % % France % % Germany % % Italy 9 1, % 1, % Netherlands % % Poland % % Romania % % Spain % % United Kingdom % % Other EU % % EU , % 2, % Norway % % Russia % % Turkey % % Other Europe % % Japan 152 2, % 1, % South Korea 73 4, % 2, % China 215 7, % 3, % Brazil % % Indonesia % % Malaysia % % Philippines % % Singapore % 1 0.0% Taiwan % % USA % % Vietnam % % Others % % Rest of the World % % World Total , % 10, % Source: Sea Europe, Shipbuilding Market Monitoring, Report No 42,
59 Shipbuilding, maintenance and equipment At the end of 2016, 52,8% of completed ships worldwide were related to transport dry bulk ships while 29,4% were crude oil tankers. Table 28: Completions by Ship types, 2016 Types NO. 1,000 GT 1,000 CGT 1,000 DWT % DWT Crude Oil Tanker ,925 4,753 25, % Oil Products Tanker % Chemical Tanker 207 4,226 2,711 6, % Other Liquid Tankers % Tankers ,418 7,761 33, % Bulk Dry ,470 10,799 46, % Self-Discharging Bulk Dry % Other Bulk Dry % Bulk carriers ,686 10,960 46, % General Cargo 174 1,164 1,081 1, % Container 130 9,442 4, % Refrigerated Cargo % Ro-Ro Cargo 53 1, % Other Dry Cargo % Dry cargoes ,522 6,735 2, % LNG Tanker 30 3,322 2,562 2, % LPG Tanker 93 2,897 1,966 3, % Gas Tankers 123 6,219 4,528 5, % Passenger/ Ro-Ro Cargo % Passenger (Cruise) 11 1,149 1, % Other Passenger Vessels/ Ferries % Ferries / Passenger Ships 108 1,464 1, % Fish Catching % Other Fishing % Offshore Supply % Other Offshore 70 1,541 1, % Research % Towing / Pushing % Dredging % Other Activities % Other Non Cargo Vessels 870 2,549 3, % Total 2,474 66,858 35,336 88, % Source: Sea Europe, Shipbuilding Market Monitoring, Report No 42,
60 Shipbuilding, maintenance and equipment In 2016, Asia (China, South Korea and Japan), completed 84,8% of the production of ships in that year (32.1%, 33.1% and 19.6% respectively). The European Union 28 and Norway together finished only 6.6% of all finished ships worldwide. Table 29: Completions by Country, 2016 Country NO. 1,000 GT % 1,000 CGT % Finland % % Croatia % % Germany % % France % % Italy % % Netherlands % % Poland % % Romania % % Spain % % Other EU % % EU , % 2, % Norway % % Russia % % Turkey % % Other % 6 0.0% Other European % % Japan , % 6, % South Korea , % 11, % China , % 11, % Brazil % % India % % Indonesia % % Malaysia % % Philippines 33 1, % % Singapore % % Taiwan % % USA % % Vietnam % % Others % % Rest Of the World 504 3, % 2, % World Total 2,474 66, % 35, % Source: Sea Europe, Shipbuilding Market Monitoring, Report No 42, 2017 Ranking included in the economy of the sea map. 60
61 Shipbuilding, maintenance and equipment The ship production has been reduced around the world from 2010 to Figure 12: Completions in global shipyards (in millions of CGT) EU 28 + Norway Japan South Korea China Others Source: Sea Europe, Shipbuilding Market Monitoring, Report No 42,
62 Shipbuilding, maintenance and equipment China, India, Bangladesh and Pakistan dismantled most ships. Table 30: Tonnage reported sold for demolition, major vessel types and countries where demolished in 2014 and 2015 (thousands of GT) China India Bangladesh Pakistan Other Indian Subcontinent Turkey Other World Total Year , Oil Tankers , ,482 1,169 Bulk Carriers 2,771 2,895 1,576 3,136 2,888 5,758 1,458 3, ,098 16,816 General Cargo Ships Container Ships , ,455 1, ,769 2,285 Gas Carriers Chemical Tankers Offshore Ferries and Passenger Ships Other Total 4,873 3,970 6,965 4,940 4,269 7,419 4,127 4, ,051 1,044 22,394 23,037 Note: Propelled seagoing merchant vessels. Source: UNCTAD - Review of Maritime Transport 2015 and
63 63
64 64
65 Offshore energy 65
66 Offshore energy In 2004, after the Middle East and North America and, Europe was the third largest oil and natural gas producing region of the world. By 2016, Europe had been relegated to 4th place; the Middle East continued to lead production, followed by Latin then North America. Table 31: Total onshore and offshore proved reserves of Oil by country 2004 End of year (billion barrels) 2014 End of year (billion Barrels) 2015 End of year (billion Barrels) 2016 End of year (billion barrels) Share of World Total USA % Canada % Mexico % Total North America % Brazil % Ecuador % Venezuela % Other Central & South America % Total Central & South America % Azerbaijan % Kazakhstan % Norway % Russia % United Kingdom % Other Europe and Eurasia % Total Europe & Eurasia % Iran % Iraq % Kuwait % Oman % Qatar % Saudi Arabia % United Arab Emirates % Yemen % Other Middle East % Total Middle East % Algeria % Angola % Egypt % Libya % Nigeria % South Sudan % Other Africa % Total Africa % Australia % China % India % Indonesia % Malaysia % Vietnam % Other Asia Pacific % Total Asia Pacific % Total World 1, , , , % Source: BP Statistical Review
67 Offshore energy In 2016, more than 48% of the world's proven gas reserves belonged to Iran, Qatar and Russia. Table 32: Total proved reserves of natural gas by country Year end 2004 (trillion cubic meters) Year end 2013 (trillion cubic meters) Year end 2014 (trillion cubic meters) Year end 2015 (trillion cubic meters) Year end 2016 (trillion cubic meters) USA Other North America Total North America Venezuela Other S. & Cent. America Total S. & Cent. America Russia Turkmenistan Other Europe & Eurasia Total Europe & Eurasia Iran Iraq Qatar Saudi Arabia United Arab Emirates Other Middle East Total Middle East Algeria Nigeria Other Africa Total Africa Australia China Other Asia Pacific Total Asia Pacific Total World Source: BP Statistical Review
68 Offshore energy Since late 2014, the price of a barrel of Brent oil has been below 100 USD; in mid 2017, the price was slightly above 50 USD. The oil price decline has put pressure on the profitability of offshore operations, which are more expensive than onshore operations. Table 33: Evolution of the Brent s price Date Price Price Price Price Price Date Date Date Date (USD) (USD) (USD) (USD) (USD) Source: Federal Reserve Bank of St. Louis Note: The price corresponds to the last day of the month. Figure 13: Evolution of the Brent s price USD February 2011 April 2011 June 2011 August 2011 October 2011 December 2011 February 2012 April 2012 June 2012 August 2012 October 2012 December 2012 February 2013 April 2013 June 2013 August 2013 October 2013 December 2013 February 2014 April 2014 June 2014 August 2014 October 2014 December 2014 February 2015 April 2015 June 2015 August 2015 October 2015 December 2015 February 2016 April 2016 June 2016 August 2016 October 2016 December 2016 February 2017 April 2017 Note: The date corresponds to the first day of the month. Source: Federal Reserve Bank of St. Louis 68
69 Offshore energy In 2016 the top 3 countries in offshore oil and gas production were Saudi Arabia, Qatar and Norway. Table 34: Offshore Oil & Gas Production (million bbl) Country Saudi Arabia 1, , , , , , ,563.2 Qatar 1, , , , , , ,352.0 Norway 1, , , , , , ,334.2 Iran Brazil USA 1, Mexico United Arab Emirates Angola Nigeria Malaysia United Kingdom Australia China Azerbaijan Indonesia India Russia Thailand Egypt Venezuela Trinidad and Tobago Vietnam Equatorial Guinea Myanmar Other Countries 1, , , , , , ,216.4 Total 15, , , , , , ,551.9 Source: Rystad Energy Ucube Ranking included in the economy of the sea map. 69
70 Offshore energy Offshore wind power capacity in the world is led by three European countries (United Kingdom, Germany and Denmark), representing 76.2% of total installed capacity in the world. In fourth place, China represents 8.5% of world capacity. Table 35: Global cumulative offshore wind capacity Source: Global Wind Report Market update 2016 Total 2011 Total 2012 Total 2013 Total 2014 Total 2015 Total 2016 Share Of Total United Kingdom 2,094 2,948 3,681 4,500 5,067 5, % Germany ,012 3,295 4, % China ,015 1, % Denmark ,271 1,271 1,271 1, % Netherlands , % Belgium % Sweden % Japan % South Korea % Finland % USA % Ireland % Spain % Norway % Portugal % Total 4,119 5,415 7,046 8,724 12,107 14, % (MW) Figure 14: Global cumulative offshore wind capacity MW Ranking included in the economy of the sea map. 10,000 Cumulative Capacity , Cumulative Capacity 2015 Cumulative Capacity 2016 MW Figure 15: Annual cumulative capacity 14,384 12,107 8,724 7,046 5,415 4, Source: Global Wind Report Market update
71 Offshore energy Figure 16: Distribution of wave energy developers in the world, 2016 US UK NO ROW 40% DK EU 60% AU IL NZ BR PT BE ES IT IE FI DE SE Source: 2016 JRC Ocean Energy Status Report 71
72 Offshore energy Figure 17: Distribution of tidal energy developers in the world, 2016 CA UK NO ROW 48% FR EU 52% US NL KR AU CN SE ES IT IE DE AT Source: 2016 JRC Ocean Energy Status Report 72
73 73
74 74
75 Naval security power, piracy and maritime disasters (oil spills) 75
76 Naval security power, piracy and maritime disasters (oil spills) In 2017, the country with the biggest number of heavy naval equipment (aircraft carriers, frigates, destroyers, corvettes and submarines) was China with 190, followed by Russia with 166, the United States of America was third with 160 large naval craft. Table 36: Total Naval Ship Power by Countries (Sum of the number Aircraft Carriers, Frigates, Destroyers, Corvettes and Submarines) Top 25 Total (Aircraft Carriers+ Frigates + Destroyers + Corvettes + Submarines) China Russia USA North Korea Japan India South Korea United Kingdom Iran Turkey Indonesia Italy France Taiwan Algeria Vietnam Greece Germany Peru Australia Singapore Egypt Brazil Canada Argentina Source: Global Firepower September 2017 Ranking included in the economy of the sea map. 76
77 Naval security power, piracy and maritime disasters (oil spills) In 2016, Indonesia was the country with greatest incidence of pirate attacks. Table 37: Locations of actual and attempted attacks ( ) South East Asia Far East Locations Total Indian Sub Continent South America Africa Source: ICC International Maritime Bureau - Piracy and Armed Robbery Against Ships All Incidents with a above are attributed to Somali pirates Indonesia Malaysia Singapore Straits Other Asia South China Sea Vietnam Other Far East Bangladesh India Brazil Colombia Ecuador Guyana Haiti Peru Venezuela Other South America Benin Egypt Guinea Gulf of Aden a Ivory Coast Nigeria Red Sea a Somalia a Togo The Congo Other Africa Rest of the World Total ,127 Ranking included in the economy of the sea map. 77
78 Naval security power, piracy and maritime disasters (oil spills) Between 2010 and 2016, there was a downward trend of pirate attacks at sea. Of the 2,127 attacks recorded between 2010 and 2016, only 366 did not have more serious consequences. In 1,284 cases, the pirates managed to board ships. In 181 of the attacks, there were abductions of people. Table 38: Comparisons of the type of attacks ( ) Category Total Attempted Boarded ,284 Fired upon Hijack Total ,127 Source: ICC International Maritime Bureau - Piracy and Armed Robbery Against Ships Between 2010 and 2016, except 2014, there was a reduction in the level of violence of attacks on ships' crews. Between 2010 and 2015, about 4,000 people were subjected to maritime piracy attacks, more than 3,700 were taken hostage and 28 were killed. Table 39: Types of violence to crew ( ) Types of Violence Total Assaulted Hostage 1, ,729 Injured Kidnap/Ransom Killed Missing Threatened Total 1, ,248 Source: ICC International Maritime Bureau - Piracy and Armed Robbery Against Ships 78
79 Naval security power, piracy and maritime disasters (oil spills) In 2016,the types of ships that were the target of pirate attacks were transport ships of bulk products and chemicals. Table 40: Types of vessels attacked ( ) Type Total Bulk Carrier Container General Cargo Tanker Chem / Product Tanker Crude Oil Trawler/Fishing Tug Other Total at year end ,127 Source: ICC International Maritime Bureau - Piracy and Armed Robbery Against Ships Of the 191 ships attacked in 2016, 46 were sailing under the flag of Panama, 46 of The Marshall Islands and 21 of Singapore. Table 41: Nationalities of ships attacked ( ) Flag State Total Antigua Barbuda Bahamas Hong Kong (SAR) Liberia Malaysia Malta Marshall Islands Panama Singapore Other Total year end ,127 Source: ICC International Maritime Bureau - Piracy and Armed Robbery Against Ships 79
80 Naval security power, piracy and maritime disasters (oil spills) Accidents involving oil spills have been occurring over time, all over the world. Table 42: Location of major shipping oil spills (since 1967) Top 20 Ship name Year Location Spill size (thousand tonnes) 1 Atlantic Empress 1979 Off Tobago, West Indies ABT Summer nautical miles off Angola Castillo de Bellver 1983 Off Saldanha Bay, South Africa Amoco Cadiz 1978 Off Brittany, France Haven 1991 Genoa, Italy Odyssey nautical miles off Nova Scotia, Canada Torrey Canyon 1967 Scilly Isles, United Kingdom Sea Star 1972 Gulf of Oman Irenes Serenidade 1980 Navarino Bay, Greece Urquiola 1976 La Coruna, Spain Hawaiian Patriot nautical miles off Honolulu Independenta 1979 Bosphorus, Turkey Jakob Maersk 1975 Oporto, Portugal Braer 1993 Shetland Islands, United Kingdom Aegean Sea 1992 La Coruna, Spain Sea Empress 1996 Milford Haven, United Kingdom Khark nautical miles off Atlantic coast of Morocco Nova 1985 Off Kharg Island, Gulf of Iran Katina P 1992 Off Maputo, Mozambique Prestige 2002 Off Galicia, Spain 63 Source: ITOPF Oil Tanker Spill Statistics 2015 Table 43: Other relevant offshore spills Description Year Location 1 Deepwater Horizon 2010 Mexican Gulf 2 Ixtoc 1 Oil Well 1979 Bay of Campeche. Mexico 3 Nowruz Oil Field 1983 Persian Gulf Source: The Telegraph 80
81 81
82 82
83 Fishing and aquaculture 83
84 Fishing and aquaculture Between 2004 and 2014, as the world population has grown, there has been an increase in the consumption of fish and other food products per capita. In 2004, per capita consumption was 16.2 kg, rising to a per capita consumption of 20.1 kg in This increase in per capita consumption was met by increased production in aquaculture. In 2004, production in onshore and offshore aquaculture reached about 27.8 and 18.1 million tonnes, respectively, rising to 47.1 and 26.7 million tonnes in Fish caught in the sea continues to represent the largest contribution to the supply of fish, but have not grown in recent years. Table 44: World fisheries and aquaculture production and utilisation (million tonnes) Production Inland Capture Aquaculture Total inland Marine Capture Aquaculture Total marine Total capture Total aquaculture TOTAL WORLD FISHERIES Utilisation 1 1 Human consumption Non-food uses Population (billions) Per capita food fish supply (kg) 1 Data in this section for 2014 are provisional estimates. Source: FAO - The State of the World Fisheries and Aquaculture in Figure 18: Total Capture. Total Aquaculture and Total World fisheries in million tonnes Total Capture Total Aquaculture Total World Fisheries Source: FAO - The State of the World Fisheries and Aquaculture in
85 Fishing and aquaculture The top ten countries in terms of fishing, led by China with 18.2% of the catch, represent about 60% of the total global fishing. Table 45: Marine capture fisheries: major producer countries 2014 Ranking Country Source: FAO - The State of the World Fisheries and Aquaculture in Weight 2014 Percentage Change 2003/2014 (million tonnes) (%) (%) 1 China % 21.3% 2 Indonesia % 39.5% 3 USA % 2.0% 4 Russia % 29.0% 5 Japan % -21.7% 6 Peru % -42.6% 7 India % 13.3% 8 Vietnam % 68.8% 9 Myanmar % 145.5% 10 Norway % -8.0% 11 Chile % -38.9% 12 Philippines % 5.0% 13 South Korea % 6.2% 14 Thailand % -40.7% 15 Malaysia % 15.4% 16 Mexico % 7.7% 17 Morocco % 55.6% Total 17 major countries % 5.5% Rest of the world % -5.7% World total % 2.3% Share 17 major countries (%) Million tonnes Figure 19: Marine capture fisheries: major producer countries Ranking included in the economy of the sea map Source: FAO - The State of the World Fisheries and Aquaculture in
86 Fishing and aquaculture The Pacific Ocean is where most of the fishing takes place, representing about 58% of the total. Table 46: Marine capture: major fishing areas Fishing area name (area code) Source: FAO - The State of the World Fisheries and Aquaculture in Weight 2014 Variation 2003/2014 (million tonnes) (%) (%) Atlantic. Northwest (21) % -21.7% Atlantic. Northeast (27) % -15.5% Atlantic. Western Central (31) % -33.3% Atlantic. Eastern Central (34) % 22.2% Mediterranean and Black Sea (37) % -26.7% Atlantic. Southwest (41) % 20.0% Atlantic. Southeast (47) % -5.9% Indian Ocean. Western (51) % 6.8% Indian Ocean. Eastern (57) % 52.8% Pacific. Northwest (61) % 10.6% Pacific. Northeast (67) % 6.9% Pacific. Western Central (71) % 18.5% Pacific. Eastern Central (77) % 5.6% Pacific. Southwest (81) % -28.6% Pacific. Southeast (87) % -34.9% Arctic and Antarctic areas ( ) % 200.0% World total % Figure 20: Marine capture: major fishing areas Arctic and Antarctic areas (18,48,58,88) Pacific, Southeast (87) Pacific, Southwest (81) Pacific, Eastern Central (77) Pacific, Western Central (71) Pacific, Northeast (67) Pacific, Northwest (61) Indian Ocean, Eastern (57) Indian Ocean, Western (51) Atlantic, Southeast (47) Atlantic, Southwest (41) Mediterranean and Black Sea (37) Atlantic, Eastern Central (34) Atlantic, Western Central (31) Atlantic, Northeast (27) Atlantic, Northwest (21) Source: FAO - The State of the World Fisheries and Aquaculture in
87 Fishing and aquaculture The fifteen species most fished represent about 1/3 of all fish caught. Table 47: Marine capture: major species 2014 Ranking 1 Scientific name Theragra chalcogramma 2 Engraulis ringens FAO English name Alaska pollock (= walleye pollock) Anchoveta (= Peruvian anchovy) Note: nei = not elsewhere included. Catches for single species have been added to those reported for the genus. Source: FAO - The State of the World Fisheries and Aquaculture in Weight 2014 Variation 2003/2014 (million tonnes) (%) (%) % 10.3% % -50.0% 3 Katsuwonus Pelamis Skipjack tuna % 40.9% 4 Sardinella spp. Sardinellas nei % 9.5% 5 Scomber Japonicus Chub mackerel % 0.0% 6 Clupea harengus Atlantic herring % -20.0% 7 Thunnus Albacares Yellowfin tuna % 0.0% 8 Decapterus spp. Scads % 7.1% 9 Scomber scombrus Atlantic mackerel % 100.0% 10 Engraulis Japonicus Japanese anchovy % -26.3% 11 Gadus morhua Atlantic cod % 75.0% 12 Trichiurus Lepturus Largehead hairtail % 8.3% 13 Sardina Pilchardus European pilchard (= sardine) % 9.1% 14 Dosidicus gigas Jumbo flying squid % 200.0% 15 Micromesistius poutassou Blue whiting % 100.0% Total 15 major species and genera % 3.8% Rest of the world % 1.7% World total % 2.4% Share 15 major species and genera (%) Figure 21: Marine capture: major species and genera Million tonnes Source: FAO - The State of the World Fisheries and Aquaculture in
88 Fishing and aquaculture Worldwide, the inland freshwater fish catch is also led by China. Table 48: Inland waters capture: major producer countries 2014 Ranking Country Weight 2014 Variation 2003/2014 (million tonnes) (%) (%) 1 China % 9.5% 2 Myanmar % 366.7% 3 India % 62.5% 4 Bangladesh % 42.9% 5 Cambodia % 66.7% 6 Uganda % 150.0% 7 Indonesia % 33.3% 8 Nigeria % 100.0% 9 United Republic of Tanzania % 0.0% 10 Egypt % -33.3% Total 10 major countries % 50.9% Rest of the world % 16.1% World total % 38.4% Share 10 major countries (%) 64.0% 69.4% 69.0% 68.4% 69.7% Source: FAO - The State of the World Fisheries and Aquaculture in 2016 Figure 22: Inland waters capture: major producer countries in 2014 (% of the total) China Myanmar India Bangladesh Cambodia Uganda Indonesia Nigeria United Republic of Tanzania Egypt Source: FAO - The State of the World Fisheries and Aquaculture in
89 Fishing and aquaculture In 2014, 89% of world aquaculture was in Asia, and was responsible for the significant growth of aquaculture globally. Table 49: Aquaculture production by region: quantity of world total production Regions Weight Weight Variation /2014 (million tonnes) (%) (%) Africa % 2.3% 328% North Africa % 1.6% 235% Sub-Saharan % 0.6% 735% Americas % 4.5% 135% Caribbean % 0.0% -16% Latin America % 3.7% 245% North America % 0.8% -4% Asia % 88.9% 131% Central Asia % 0.0% 281% Eastern Asia % 63.7% 105% South-Eastern Asia % 14.7% 297% Southern Asia % 10.0% 176% Western Asia % 0.5% 181% Europa % 4.0% 43% Eastern Europe % 0.4% 55% North Europe % 2.4% 117% Western Europe % 0.4% -29% Southern Europe % 0.8% -7% Oceania % 0.3% 56% World % 100.0% 128% Notes: Data exclude aquatic plants and non-food products. Data for 2014 for some countries are provisional and subject to revisions. For the purpose of this table. Cyprus. classified as part of Asia by FAO. is included under Europe as one of the 28 members of European Union (Member Organization). Source: FAO - The State of the World Fisheries and Aquaculture in 2016 Figure 23: Aquaculture production by region: quantity of world total production (in million tonnes) 70,000 60,000 50,000 40,000 30,000 20,000 10, Africa Americas Asia Europe Oceania Figure 24: Aquaculture production by region: quantity of world total production (weight in %), 2014 Africa Americas Asia Europe Oceania Source: FAO - The State of the World Fisheries and Aquaculture in
90 Fishing and aquaculture Inland aquaculture is the main contributor to the growth of aquaculture and China represents 61.7% of global aquaculture production of aquatic animals. Table 50: Top 15 producers of farmed aquatic animals, 2014 Producer Inland aquaculture Finfish Marine/Coastal aquaculture Other speciesª Total aquatic animals production Share in total world (million tonnes) (million tonnes) (%) China % India % Indonesia % Vietnam % Bangladesh % Norway % Chile % Egypt % Myanmar % Thailand % Philippines % Japan % Brazil % Republic of Korea % Malaysia % Top 15 subtotal % Rest of the world % World % Note: The symbol means the production data are not available or the production volume is regarded as negligibly low. a Other species includes crustaceans. mollusks and other aquatic animals. Source: FAO - The State of the World Fisheries and Aquaculture in 2016 Figure 25: Farmed food fish production share of the top 15 producers in 2014 (% of the total) China India Indonesia Vietnam Bangladesh Norway Chile Egypt Myanmar Thailand Philippines Japan Brazil South Korea USA Rest of the world Ranking included in the economy of the sea map. Source: FAO - The State of the World Fisheries and Aquaculture in
91 Fishing and aquaculture Asia is responsible for the production of more than 90% of aquaculture algae. Table 51: Aquaculture production of farmed aquatic plants in the world and selected major producers Weight Variation /2014 (million tonnes) (%) (%) China % 91.6% Indonesia % 4,695% Philippines % 111.3% South Korea % 195% North Korea % -24.5% Japan % 900% Subtotal % 202.5% Rest of the world % 39.6% World % 193.2% Source: FAO - The State of the World Fisheries and Aquaculture in 2016 Figure 26: Aquaculture production of farmed aquatic plants in the world per country (in million tonnes) Figure 27: Aquaculture production of farmed aquatic plants in the world and selected major producers, 2014 (weight in %) China Indonesia Philippines South Korea Japan Malaysia Rest of the world Source: FAO - The State of the World Fisheries and Aquaculture in
92 Fishing and aquaculture In 2014, Asian fishermen and aquaculture producers represented 84% of employment in this sector. In addition to the growth registered in Asia (20.4%) between 2000 and 2014, there was growth in Africa (35.9%), in Latin America (37.8%) and a decrease in Europe (-47%). Table 52: World fishers and fish farmers by region Weight Notes: Some statistics provided to FAO by national offices. in particular those for are provisional and may be amended in future editions. and in other FAO publications. Source: FAO - The State of the World Fisheries and Aquaculture in 2016 Variation /2014 (millions) (%) (%) Africa % 35.90% Asia % 20.39% Europe % % Latin America and the Caribbean % 37.77% North America % -6.07% Oceania % % World 46,845 57,667 58,272 56, % 20.89% Of which. fish farmers Africa % % Asia % 47.67% Europe % % Latin America and the Caribbean % 66.36% North America % 50.00% Oceania % 20.00% World % 48.46% Figure 28: World fishers and fish farmers by region Africa Asia Europe Latin America and the Caribbean Source: FAO - The State of the World Fisheries and Aquaculture in
93 Fishing and aquaculture In 2014, 80% of motorized fishing ships were in Asia. Figure 29: Distribution of motorized fishing vessels by region in 2014 (in %) Africa 6% North America 3% Latin America and the Caribbean 7% Europe 3% Pacific and Oceania 1% Asia 80% Source: FAO - The State of the World Fisheries and Aquaculture in

94 Fishing and aquaculture From 1974 to 2013, there has been a significant increase in the pressure on fish stocks, causing overfishing - or at the limit of what is acceptable - of a number of species. Figure 30: Global trends in the state of world marine fish stocks % off stocks assessed Overfished Fully fished Underfished At biologically unsustainable levels Within biologically sustainable levels Source: FAO - The State of the World Fisheries and Aquaculture in
95 Fishing and aquaculture China is currently the largest exporter of food products from the sea, while USA is the largest importer country. Table 53: Top ten exporters and importers of fish and fishery products Exporters Source: FAO - The State of the World Fisheries and Aquaculture in Annual Growth (US$ millions) (%) China 6,637 20, % Norway 4,132 10, % Viet Nam 2,444 8, % Thailand 4,060 6, % USA 3,851 6, % Chile 2,501 5, % India 1,409 5, % Denmark 3,566 4, % Netherlands 2,452 4, % Canada 3,487 4, % Top ten subtotal 34,539 77, % Rest of the World total 37,330 70, % World total 71, , % Importers USA 11,964 20, % Japan 14,560 14, % China 3,126 8, % Spain 5,222 7, % France 4,176 6, % Germany 2,805 6, % Italy 3,904 6, % Sweden 1,301 4, % United Kingdom 2,812 4, % South Korea 2,250 4, % Top ten subtotal 52,119 83, % Rest of the world total 23,583 57, % World total 75, , % 95
96 Fishing and aquaculture Africa and Latin America are the regions of the world with the lowest per capita consumption of fish and other sea products. Table 54: Per capita food fish supply by continent and economic grouping Per capita sea food supply (2010) (kg/year) Per capita sea food supply (2013) (kg/year) World World (excluding China) Africa North America Latin America and the Caribbean Asia Europe Oceania Industrialized countries Other developed countries Least-developed countries Other developing countries LIFDCs - Low-income food-deficit countries Source: FAO - The State of the World Fisheries and Aquaculture in
97 Fishing and aquaculture Since 1970, aquaculture has increased its relative importance in the supply of seafood, reaching a similar weight to the fisheries. Figure 31: Relative contribution of aquaculture and capture fisheries to fish for human consumption 12 Capture fisheries Aquaculture 10 Fish for human comsumption (KG/Capita) Source: FAO - The State of the World Fisheries and Aquaculture in
98 98
99 Entertainment, sports, tourism and culture 99
100 Entertainment, sports, tourism and culture Gross revenue associated with cruise ship activity has been increasing. Figure 32: Revenue of the cruise industry worldwide, (in billion U.S. dollars) Revenue in billion U.S. dollars a Source: Cruise industry Statista Dossier a Forecast 100
101 Entertainment, sports, tourism and culture North America and Europe are the most important markets for cruise ships. Figure 33: Market size of the global cruise industry in 2014, by region (in billion U.S. dollars) Market size in billion U.S. dollars North America Europe Asia 1.80 South America 1.27 Australia and New Zealand 1.13 Middle East and Africa 0.07 Source: Cruise industry Statista Dossier 101
102 Entertainment, sports, tourism and culture The cruise industry had the fastest growth in the leisure travel sector. Since 1980, the industry has had an annual growth rate of 7%. Between 2005 and 2015, the demand for cruises increased by 62%. The number of cruise ship passengers has increased in the last 9 years with a growth rate of 4.75%. It is expected that in 2017 in the number of cruise passengers will reach 25.8 million. Figure 34: Worldwide cruise ship passengers, in millions * Number of Passengers *forecast Source: CLIA - State of the Cruise Industry Outlook 2017 Figure 35: Passengers by region of destination, in % 18.7% Ranking Included in the Economy of the Sea Map. 13.8% 11.7% 9.2% 6.1% 4.1% 2.7% Caribbean Mediterranean Other Europe w/o the Mediterranean Asia Australia, New Zeland Alaska South America 102
103 Entertainment, sports, tourism and culture The number of people participating in cruise travel has increased. Figure 36: Number of cruise passengers worldwide from 2005 to 2015 (in millions) 25 Number of passengers in millions Source: Cruise industry Statista Dossier 103
104 Entertainment, sports, tourism and culture The North American region is the one that dominates the cruise industry, globally. In Europe, the leaders are Germany and the United Kingdom. Figure 37: Market size of global cruise industry, by region, 2014 (In billions (USD)) North America Europe Asia 1.80 South America 1.27 Australia and New Zeland 1.13 Middle East and Africa 0.07 Source: Cruise industry Statista Dossier Figure 38: Size of the European cruise market, by country of origin, 2015 Germany 28% United Kingdom 27% Italy 12% France 9% Spain 7% Other 17% Source: Cruise industry Statista Dossier 104
105 Entertainment, sports, tourism and culture The largest cruise consumers are North Americans, immediately followed by the Germans and the British. Figure 39: Leading passenger source countries in the global cruise industry in 2014 Global passenger share USA 51.0% Germany United Kingdom Australia Italy Canada China France Spain Norway 8.0% 7.3% 4.5% 3.8% 3.6% 3.2% 2.7% 2.0% 0.8% Source: Cruise industry Statista Dossier 105
106 Entertainment, sports, tourism and culture The cruise industry has been increasing its overall capacity. Figure 40: Passenger capacity of the global cruise industry (in thousands) Passenger capacity in thousands Source: Cruise industry Statista Dossier 106
107 Entertainment, sports, tourism and culture By the end of 2014, in terms of business volume, the three biggest companies involved in cruise line activity have their headquarters in Miami (United States of America). The fourth largest company is headquartered in the Switzerland. Figure 41: Leading cruise line companies headquarters location worldwide in 2014, by revenue (in billion U.S. dollars) Revenue in billion U.S. dollars Miami, USA Miami, USA 8.07 Miami, USA 3.13 a Geneva, CH a Miami, USA a Luton, UK a Kowloon, HK a / b Tromsø, Norway a Los Angeles, USA a Monaco a Via Cruise Market Watch b Figure was converted from Norwegian krone to U.S. dollars (exchange rate of 1 krone = 0.17 U.S. dollars was used). Source: Cruise industry Statista Dossier 107
108 Entertainment, sports, tourism and culture In 2015, in a comparison of the "accommodation" on cruises, the ranking of the world's largest companies are headquartered in the US, Italy and Switzerland. Figure 42: Forecast of passenger capacity of the cruise industry worldwide in 2015 by cruise line. Miami, USA 68,478 Miami, USA 62,368 Los Angeles, USA 40,996 Miami, USA 38,546 Genova, IT 37,220 Geneva, CH 30,174 Miami, USA 24,320 Seattle, USA 23,126 Source: Cruise industry Statista Dossier 108
109 Entertainment, sports, tourism and culture The total value of pleasure boats sold in the United States of America has remained constant for the past 3 years, reaching on average, 3,679 billion USD. American consumers prefer vessels between 8 and meters or greater than 24 meters. Figure 43: Total value of leisure boats sold in the United States of America 3,315 3,464 3,733 3,652 3,653 In millions (USD) Source: Recreational Boating in the US Statista Dossier Figure 44: Total value of pleasure boats sold in the United States of America, by vessel length. In millions (USD) 1, <8m 8m-10,67m 10,97m-13,72m 14m-16,76m 17m-24m 24m+ 106
110 Entertainment, sports, tourism and culture In the United States of America the values of sale motor pleasure craft reached an average of 3,128 million USD, in the last 5 years, while the values of sailing boats for sale reached 435 million USD on average in the last 5 years. Figure 45: Total value of power boats sold in the United States of America ,296 3,195 3,243 Millions of USD ,898 3, Source: Recreational Boating in the US Statista Dossier Figure 46: Total value of recreational sailboats sold in the United States of America Millions of USD
111 Entertainment, sports, tourism and culture In 2015 the Americas dominated in the purchase of luxury yachts. It is expected that by 2020, the Europe Middle East and Africa region (EMEA) will lead this market. Although the number of luxury yachts sold has decreased in recent years, it is expected that, with the economic development of China and other emerging economies, both the production and the demand for these luxury items will increase in the coming years. Figure 47: Number of luxury yachts sold * *Forecast Source: Global Luxury Yacht Market 2016 Figure 48: Luxury yachts sold by region * *Forecast Source: Global Luxury Yacht Market 2016 EMEA APAC Americas 111
112 Entertainment, sports, tourism and culture It is expected that the market of Super yachts (yachts with more than 40 meters) will continue to grow in the coming years, with the recovery of the economy and the increase in ultra high net worth individuals (UHNWI) in the Middle East and Asia. In Middle East alone there are about one third of all super yachts in the world. It is expected that this region will continue to be dominant in the market Figure 49: Total value of super yachts sold worldwide Source: Study of the Global Yacht Market 2016 Smart Research Insights Figure 50: Size of the world super yacht fleet 5,362 Figure 51: Number of super yachts sold by region, ,113 4, Source: Study of the Global Yacht Market 2016 Smart Research Insights Italy United Kingdom Taiwan Netherlands USA Source : Study of the Global Yacht Market 2016 Smart Research Insights 112
113 Entertainment, sports, tourism and culture The main builders of pleasure boats in Europe are: Italy, Holland, Germany, United Kingdom and France. The main EU purchasing countries for pleasure craft are Germany, France, United Kingdom, Netherlands and Poland. In 2015, in the United Kingdom, 37% of adults participate in recreational nautical activities at least once a year, 20% are involved in this kind of activity 6 or more times per year. Figure 52: Distribution of participation in recreational boating activities by frequency in the United Kingdom, between 2010 and % 13% 12% 12% 12% 13% 8% 11% 11% 10% 12% 9% 37% 42% 38% 45% 43% 43% 37% 34% 37% 37% 34% 37% One a year 2-5 times a year 6-12 times a year 13+ times a year Source: Recreational Boating in the United Kingdom Statista Dossier 113
114 Entertainment, sports, tourism and culture The United States of America, Australia, New Zealand, Italy, France and the United Kingdom are the countries of reference in terms of the recreational boating and marinas business. According to 2016 edition of Pleasure Boat International Resource Guide Published by the National USA Marine Manufacturers Association, the United States of America exports of recreational marine craft and accessories totalled USD 2.1 billion in The U.S. recreational marine market makes up approximately 75 percent of the entire world market for these products. Table 55: United States of America Exports Top 20 Markets by FAS Value (Recreational Marine Craft, parts and accessories as defined by the Harmonized Tariff System) Top 20 Markets by FAS Value (Annual + Year-To-Date Data from January October. USD Thousands) Country YTD 2015 YTD Source: Pleasure boat International Resource Guide. A Reference for U.S. Exporters Edition Variation YTD 2014/2015 Canada 642, , , , , , % Mexico 84, , , ,775 75,160 91, % Australia 247, , , ,448 62,758 53, % Belgium 92, , , ,151 62,150 88, % Spain 41,467 29,664 44,514 74,878 63,508 52, % Italy 71,652 53,874 53,076 74,791 64,775 57, % Brazil 72,565 85,103 68,894 56,331 28,392 15, % Japan 35,273 61,114 51,271 50,009 25,701 31, % United Arab Emirates 29,916 45,819 35,528 48,624 27,034 19, % Germany 51,268 50,209 43,038 45,556 26,969 22, % Costa Rica 33,581 42,277 24,122 44,932 4,034 3, % China 37,133 36,161 40,710 36,435 17,881 23, % Netherlands 57,193 35,943 32,662 33,731 20,338 12, % France 29,383 26,671 27,200 29,055 18,479 17, % Colombia 26,038 14,597 20,989 28,692 9,023 13, % United Kingdom 38,709 29,585 21,790 27,387 16,981 15, % New Zealand 24,163 35,848 31,585 24,577 8,118 8, % Russia 17,985 30,829 25,340 23,275 19,659 7, % Norway 16,245 15,413 13,701 21,000 13,712 13, % Korea 11,425 14,191 13,881 19,506 10,155 10, % Subtotal 1,661,314 1,707,930 1,680,908 1,720, , , % All others 538, , , , , , % World Total 2,199,506 2,274,393 2,167,656 2,148,475 1,175,881 1,092, % 114
115 Entertainment, sports, tourism and culture Marinas, in United States of America generate on average, billion USD. Between 2008 and Figure 53: Marina Revenue in the United States of America from 2008 to 2016 in millions (USD) 3,793 3,311 3,467 3,558 3,644 3,752 3,789 3,979 3, * 2016* *Forecast Source: Statista 2017 (Website) 115
116 Entertainment, sports, tourism and culture A huge number of luxury marinas in the world are located in Europe. In the Adriatic Sea, Italy has the most moorings, followed by Croatia. Figure 54: Moorings in the Adriatic Sea, in 2016 Italy 47,415 Croatia 20,954 Slovenia 3,232 Montenegro 2,931 Greece 1,855 Albania 80 Bosnia and Herzegovina - Source: Statista 2017 (Website) 116
117 Entertainment, sports, tourism and culture In 2015 there were around 400 luxury marinas. Europe has the highest concentration of luxury marinas. Throughout the world many marinas are beginning to expand their capacity to receive large luxury yachts. China, Taiwan and Japan are increasingly investing in the creation and improvement of its marinas, to match growing demand for mega yachts. In Hong Kong in 2015, there was a deficit of more than 10,000 berths for luxury vessels. Table 56: Important Marinas Globally, 2016 City Tivat Barcelona Valletta Barcelona Limassol Bodrum Castellammare di Stabia St. Kitts Split Loano Country Montenegro Spain Malta Spain Cyprus Turkey Italy Caribbean Croatia Italy Source: Technavio - Global Luxury Yacht Market
118 Entertainment, sports, tourism and culture The Yacht Harbour Association is a leading association in the United Kingdom and abroad in the marinas business. This association has an accreditation process that awards up to five anchors for the best marinas. Table 57: Top countries with five and four gold anchor marinas (2017) Country Number of five gold anchor marinas Country Number of four gold anchor marinas United Kingdom 60 Turkey 11 Portugal 5 Netherlands 5 United Arab Emirates 5 Belgium 3 Ireland 3 Italy 3 Croatia 2 France 2 Spain 2 China 2 Cyprus 2 Singapura 1 Montenegro 1 Greece 1 Thailand 1 Hong Kong 1 Mexico 1 Malaysia 1 Virgen Islands (USA) 1 United Kingdom 32 France 4 Belgium 2 Italy 1 Source: Yacht Harbour Association. September
119 Entertainment, sports, tourism and culture Europe remains the continent with more medals in canoeing, Germany being the country that leads with 32 medals. Table 58: Top 15 countries with gold. silver and bronze medals in canoeing (sum of last four Olympic Games) Country Table 57: Top 15 countries with gold. silver and bronze medals in canoeing (sum of last three Olympic Games) Germany Hungary United Kingdom Slovakia Spain Australia Russia France Canada Belarus Ukraine Czech Republic Italy Poland Norway Medals Athens London Beijing Rio 2016 Gold Silver Bronze Gold Silver Bronze Gold Silver Bronze Gold Silver Bronze Gold Silver Bronze Gold Silver Bronze Gold Silver Bronze Gold Silver Bronze Gold Silver Bronze Gold Silver Bronze Gold Silver Bronze Gold Silver Bronze Gold Silver Bronze Gold Silver Bronze Gold Silver Bronze Note: These results include slalom canoeing and sprint canoeing Source: Graphic of self-elaboration based on the portals data of the Olympic Games. Total
120 Entertainment, sports, tourism and culture In sailing, while European countries, led by the United Kingdom, continue well classified, winning 19 medals at the last four Olympic Games, Australia appears in second place with 11 medals. Table 59: Top 15 countries with gold. silver and bronze medals in sailing (sum of last four Olympic Games) Country United Kingdom Australia France Spain Netherlands Denmark New Zealand Brazil USA China Sweden Greece Argentina Croatia Poland Medals Athens London Beijing Rio 2016 Gold Silver Bronze Gold Silver Bronze Gold Silver Bronze Gold Silver Bronze Gold Silver Bronze Gold Silver Bronze Gold Silver Bronze Gold Silver Bronze Gold Silver Bronze Gold Silver Bronze Gold Silver Bronze Gold Silver Bronze Gold Silver Bronze Gold Silver Bronze Gold Silver Bronze Total Source: Graphic of self-elaboration based on the portals data of the Olympic Games. Ranking included in the economy of the sea map. 120
121 Entertainment, sports, tourism and culture In rowing, the United Kingdom leads with 24 medals, followed by Australia (15) and New Zealand and Germany (12 each). Table 60: Top 15 countries with gold. silver and bronze medals in rowing (sum of last four Olympic Games) Country United Kingdom Australia New Zealand Germany USA Netherlands Canada Denmark France Italy Romania Poland Czech Republic China Belarus Source: Graphic of self-elaboration based on the portals data of the Olympic Games Medals Athens London Beijing Rio 2016 Gold Silver Bronze Gold Silver Bronze Gold Silver Bronze Gold Silver Bronze Gold Silver Bronze Gold Silver Bronze Gold Silver Bronze Gold Silver Bronze Gold Silver Bronze Gold Silver Bronze Gold Silver Bronze Gold Silver Bronze Gold Silver Bronze Gold Silver Bronze Gold Silver Bronze Total
122 Entertainment, sports, tourism and culture In surfing, United States of America, Australia and Brazil have been consistently leading in recent years. Table 61: Top countries with first, second and third places in surf (sum of last three World Surf League championships) Country Positions Total USA Australia Brazil South Africa Note: includes men and women leagues Source: World Surf League First Second Third First Second Third First Second Third First Second Third
123 123
124 124
125 Economy of the sea map 125
126 126
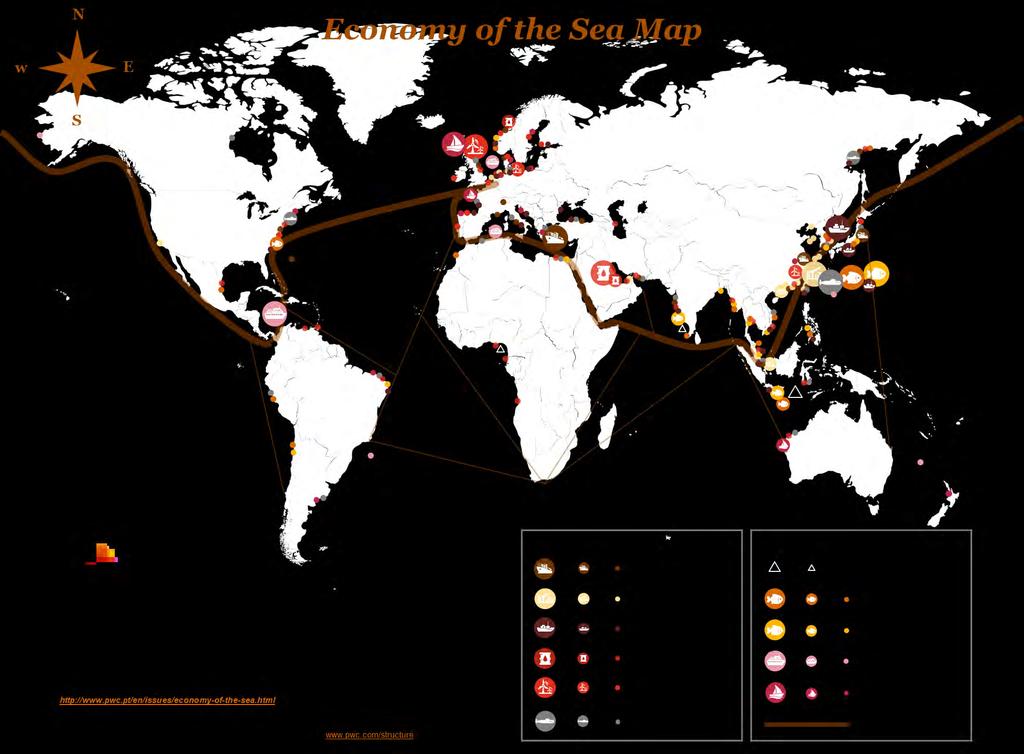
127
128 128

129 List of Tables, Figures and Acronyms 129
Circumnavigation HELM PwC Economy of the Sea Barometer (World)
") www.pwc.pt HELM PwC Economy of the Sea Barometer (World) In-depth HELM December 2015 Edition nº1 2 I really don't know why it is that all of us are so committed to the sea, except I think it's because
www.pwc.pt HELM PwC Economy of the Sea Barometer (World) In-depth HELM December 2015 Edition nº1 2 I really don't know why it is that all of us are so committed to the sea, except I think it's because
I The shipping market contents ISL
 Comment - Charts and Tables concerning The Shipping Market World Merchant Fleet Tanker Market Bulk Carrier Market Tab. 1 Additions/Reductions by Ship Types 2014-2016 and up to June 2017... III Tab. 2 Size
SLOVAKIA. Table 1. FDI flows in the host economy, by geographical origin. (Millions of US dollars)
") Table 1. FDI flows in the host economy, by geographical origin World 1 271 4 095 1 060 1 058 714 4 693 3 267 4 692-6 1 769 3 491 2 825 Developed economies 1 204 4 050 1 036 1 113 485 4 265 1 001 5 084-881
Table 1. FDI flows in the host economy, by geographical origin World 1 271 4 095 1 060 1 058 714 4 693 3 267 4 692-6 1 769 3 491 2 825 Developed economies 1 204 4 050 1 036 1 113 485 4 265 1 001 5 084-881
IUMI 2005 Amsterdam Facts & Figures Committee
 Report on Marine Insurance Premium 23 and 24 IUMI 25 Amsterdam Facts & Figures Committee Tore Forsmo, Managing Director Astrid Seltmann, Analyst The Central Union of Marine Underwriters, Oslo, Norway Thanks
FINLAND. Table 1. FDI flows in the host economy, by geographical origin. (Millions of US dollars)
") Table 1. FDI flows in the host economy, by geographical origin World 3 732 8 046 3 319 2 823 4 750 7 652 12 451-1 144 718 7 359 2 550 4 158 Developed economies 3 638 8 003 2 382 2 863 4 934 7 258 12 450-855
Table 1. FDI flows in the host economy, by geographical origin World 3 732 8 046 3 319 2 823 4 750 7 652 12 451-1 144 718 7 359 2 550 4 158 Developed economies 3 638 8 003 2 382 2 863 4 934 7 258 12 450-855
CROATIA. Table 1. FDI flows in the host economy, by geographical origin. (Millions of US dollars)
") Table 1. FDI flows in the host economy, by geographical origin World 1 307 1 153 2 107 1 210 1 844 3 228 4 928 5 941 3 566 515 1 511 1 370 Developed economies 1 207 1 113 1 719 1 190 1 885 3 093 4 775
Table 1. FDI flows in the host economy, by geographical origin World 1 307 1 153 2 107 1 210 1 844 3 228 4 928 5 941 3 566 515 1 511 1 370 Developed economies 1 207 1 113 1 719 1 190 1 885 3 093 4 775
ROMANIA. Table 1. FDI flows in the host economy, by geographical origin. (Millions of US dollars)
") Table 1. FDI flows in the host economy, by geographical origin World.... 2 196 6 435 6 485 11 333 9 928 13 910 4 843 2 939 2 522 2 746 Developed economies.... 1 521 5 361 6 309 11 445 9 136 13 422 4 812
Table 1. FDI flows in the host economy, by geographical origin World.... 2 196 6 435 6 485 11 333 9 928 13 910 4 843 2 939 2 522 2 746 Developed economies.... 1 521 5 361 6 309 11 445 9 136 13 422 4 812
MONTHLY NATURAL GAS SURVEY. November 2009
 MONTHLY NATURAL GAS SURVEY November 2009 INTERNATIONAL ENERGY AGENCY INTERNATIONAL ENERGY AGENCY Next Release: 12 March 2010 MONTHLY NATURAL GAS SURVEY - 1 CONTENTS TABLE 1 Natural Gas Balances in OECD
III. TRADE IN COMMERCIAL SERVICES BY CATEGORY
 .. TRADE IN COMMERCIAL SERVICES BY CATEGORY Transportation services China records impressive growth of world transportation services reached $750 billion in 2007, an increase of 19 per cent, following
Accounting Basis by Country
 Accounting Basis by Country Egypt Africa Northern Africa Morocco Africa Northern Africa Sudan Africa Northern Africa Western Sahara Africa Northern Africa Angola Africa Sub-Saharan Africa Benin Africa
Financial Reporting Standards Adoption by Country
 Financial Reporting Standards Adoption by Country Egypt Africa Northern Africa Morocco Africa Northern Africa Sudan Africa Northern Africa Western Sahara Africa Northern Africa Angola Africa Sub-Saharan
1.0 Introduction Zambia s Major Trading Partners Zambia s Major Export Markets... 4
 Bank of Zambia CONTENTS 1.0 Introduction... 3 2.0 Zambia s Major Trading Partners... 3 3.0 Zambia s Major Export Markets... 4 4.0 Major Source Countries Of Zambia s Imports... 5 5.0 Direction Of Trade
REPUBLIC OF KOREA. Table 1. FDI flows in the host economy, by geographical origin. (Millions of US dollars)
") Table 1. FDI flows in the host economy, by geographical origin World 4 130 3 395 4 383 8 980 7 050 4 950 2 629 8 409 7 501 8 117 10 247 11 117 Developed economies 3 123 2 385 2 949 7 185 5 743 3 423-275
Table 1. FDI flows in the host economy, by geographical origin World 4 130 3 395 4 383 8 980 7 050 4 950 2 629 8 409 7 501 8 117 10 247 11 117 Developed economies 3 123 2 385 2 949 7 185 5 743 3 423-275
Intra-African Air Services Liberalization
 Intra-African Air Services Liberalization James Wiltshire Senior Economist, www.iata.org/economics To represent, lead and serve the airline industry Aviation connects African businesses to world markets
SOUTHERN AFRICA TRAVEL AND TOURISM BAROMETER REPORT 2015
 SOUTHERN AFRICA TRAVEL AND TOURISM BAROMETER REPORT 2015 1 Contents 1. TOURISM TRENDS: GLOBAL AND SOUTHERN AFRICA S MARKET SHARE IN AFRICA... 4 1.1. TOURIST ARRIVALS... 4 1.1.1. Global Tourist Arrivals
Review of Maritime Transport 2016
 Review of Maritime Transport 2016 Release date 2 nd November 2016 www.unctad.org/rmt V.F.Valentine, UNCTAD, Trade Logistics Branch Contents 1. World Seaborne Trade 2. Merchant Fleet 3. Freight Rates 4.
The Nordic Countries in an International Comparison. Helga Kristjánsdóttir 20. apríl 2012
 The Nordic Countries in an International Comparison Helga Kristjánsdóttir 20. apríl 2012 15 Figure 1. World Bank, GDP growth (annual %) 10 5 0 1961 1963 1965 1967 1969 1971 1973 1975 1977 1979 1981 1983
Republic of Turkey - Ministry of Economy,
 Republic of Turkey - Ministry of Economy, 2012 0 SHIPBUILDING INDUSTRY Turkey is surrounded by sea on three sides, is a natural bridge between Asia and Europe. Turkey borders the Black Sea, the Mediterranean,
Sprint Real Solutions Switched Data Service International Rates from the U.S. Mainland, Hawaii, Puerto Rico, and the U.S.
 1* The international rates below apply to calls from the U.S. Mainland, Hawaii, Puerto Rico, and the U.S. Virgin Islands. The usage rates below reflex the discount found in Section 6.4 of Schedule No.
Sprint Real Solutions Option A SDS International Outbound Rates from the U.S. Mainland, Hawaii, Puerto Rico, and the U.S.
 1* The international rates below apply to calls from the U.S. Mainland, Hawaii, Puerto Rico, and the U.S. Virgin Islands. For additional termination poinst for some countries, see International Termination
1.0 Introduction Zambia s Major Trading Partners Zambia s Major Export Markets... 4
 Bank of Zambia CONTENTS 1.0 Introduction... 3 2.0 Zambia s Major Trading Partners... 3 3.0 Zambia s Major Export Markets... 4 4.0 Major Source Countries Of Zambia s Imports... 5 5.0 Direction Of Trade
KINGDOM OF CAMBODIA NATION RELIGION KING 3
 KINGDOM OF CAMBODIA NATION RELIGION KING 3 TOURISM STATISTICS REPORT June 2014 MINISTRY OF TOURISM Statistics and Tourism Information Department No. A3, Street 169, Sangkat Veal Vong, Khan 7 Makara, Phnom
COUNTRY & TERRITORY PROFILES A Summary of Oil Spill Response Arrangements & Resources Worldwide
 3. COUNTRY & TERRITORY PROFILES (including date of update) A Albania August 2010 Antigua January 2009 Algeria May 2011 Argentina December 2015 Angola May 2009 Aruba April 2008 Anguilla November 2005 Australia
KINGDOM OF CAMBODIA NATION RELIGION KING 3
 KINGDOM OF CAMBODIA NATION RELIGION KING 3 TOURISM STATISTICS REPORT March 2014 MINISTRY OF TOURISM Statistics and Tourism Information Department No. A3, Street 169, Sangkat Veal Vong, Khan 7 Makara, Phnom
KINGDOM OF CAMBODIA NATION RELIGION KING 3
 KINGDOM OF CAMBODIA NATION RELIGION KING 3 TOURISM STATISTICS REPORT September 2014 MINISTRY OF TOURISM Statistics and Tourism Information Department No. A3, Street 169, Sangkat Veal Vong, Khan 7 Makara,
Sprint Real Solutions Switched Data Service International Rates from the U.S. Mainland, Hawaii, Puerto Rico, and the U.S.
 1* The international rates below apply to calls from the U.S. Mainland, Hawaii, Puerto Rico, and the U.S. Virgin Islands. The usage rates below reflex the discount found in Section 6.4 of Schedule No.
Global Travel Trends 2005
 Preliminary World Travel Monitor Results from IPK international for the ITB Berlin Message, 03/10/06 Global Travel Trends 2005 Based on the new data from the 2005 World Travel Monitor, and as it does every
Pistachio Industry Inventory Shipment Report Pounds Crop Year
 Pistachio Industry Inventory Shipment Report Pounds March 2017 Year to Date Summary - Pounds 2016-2017 Crop Year Open Inshell AO Closed Shell Shelling Stock Total 8/31/16 Carryover 46,956,408 41,224,713
Sprint Real Solutions Switched Data Service International Rates from the U.S. Mainland, Hawaii, Puerto Rico, and the U.S.
 1* The international rates below apply to calls from the U.S. Mainland, Hawaii, Puerto Rico, and the U.S. Virgin Islands. The usage rates below reflex the discount found in Section 6.4 of Schedule No.
1.0 Introduction Zambia s Major Trading Partners Zambia s Major Export Markets... 4
 Bank of Zambia CONTENTS 1.0 Introduction... 3 2.0 Zambia s Major Trading Partners... 3 3.0 Zambia s Major Export Markets... 4 4.0 Major Source Countries Of Zambia s Imports... 5 5.0 Direction Of Trade
MGTA Ocean Freight. January 21, 2016
 MGTA Ocean Freight January 21, 2016 Brief History History 1848: Pacific Mail Steamship Company is founded; the company is given a ten-year government contract to deliver mail between Panama and Oregon;
IMD World Talent Report Factor 1 : Investment and Development
 THAILAND 2012 2013 2014 2015 2016 Overall Investment & Development Appeal Rank 2016 37 42 24 Readiness 49 of 61 Factor 1 : Investment and Development Total Public Expenditure on Education Percentage of
KINGDOM OF CAMBODIA NATION RELIGION KING 3
 KINGDOM OF CAMBODIA NATION RELIGION KING 3 TOURISM STATISTICS REPORT October 2015 MINISTRY OF TOURISM Statistics and Tourism Information Department No. A3, Street 169, Sangkat Veal Vong, Khan 7 Makara,
5.3. Cannabis: Wholesale and Street Prices and Purity Levels
 5. Prices: Cannabis 5.3. Cannabis: Wholesale and Street Prices and Purity Levels HERBAL CANNABIS Africa East Africa Ghana 51.0 39.2-62.7 1999 Kenya 0.2 0.1-0.3-2002 119.8-1996 Madagascar 1.3 1.1-1.4 100.0
GBTA BTI Outlook and Economic Forecast for Business Travel in Asia Pacific, Thailand and around the World
 GBTA BTI Outlook and Economic Forecast for Business Travel in Asia Pacific, Thailand and around the World Research Sponsored by: Welf J Ebeling Vice President, Operations - Asia Pacific Global Business
GEOPOLITICAL INDICATORS OF THE OCEANS. World Percentage Earth 29,6 Percentage oceans 36,2. 0,009 million km²
 EXCLUSIVE ECONOMIC ZONE (EEZ) World Percentage Earth 29,6 Percentage oceans 36,2 Highest and lowest value United States Jordan 12,2 million km² 0,009 million km² EEZ by developement level Number of countries
III. TRADE IN COMMERCIAL SERVICES BY CATEGORY
 .. TRADE IN COMMERCIAL SERVICES BY CATEGORY Transportation services China records impressive growth Exports of world transportation services reached $750 billion in 2007, an increase of 19 per cent, following
Sprint Real Solutions VPN SDS International Rates from the U.S. Mainland, Hawaii, Puerto Rico, and the U.S. Virgin Islands 1*
 1* The international rates below apply to calls from the U.S. Mainland, Hawaii, Puerto Rico, and the U.S. Virgin Islands where available. The rates, which are shown below in full minute increments, are
Danish Shipping. Facts and Figures. June 2018
 Danish Shipping Facts and Figures June 2018 2 Table of Contents 1. Danish Shipping Industry 4 The Danish Merchant Fleet 4 Danish Shipping Exports 6 Employment 8 CEO Survey 10 2. Global Merchant Fleet 12
WORLD PRESS FREEDOM INDEX 2012
 WORLD PRESS FREEDOM INDEX 2012 1 Finland -10,00 = - Norway -10,00 = 3 Estonia -9,00 - Netherlands -9,00 5 Austria -8,00 6 Iceland -7,00 - Luxembourg -7,00 8 Switzerland -6,20 9 Cape Verde -6,00 10 Canada
International ISBN Agency - Range Message Printed: Apr 5, Last Change: Apr 4, 2018
 978 International ISBN Agency 0-5 600-649 7-7 80-94 950-989 9900-9989 9999 979 International ISBN Agency 10-12 978-0 English language 00-19 200-227 2280-2289 229-638 6390-6398 6399000-6399999 640-647 6480000-6489999
On the entry into force of HKC
 On the entry into force of HKC Dr Nikos Mikelis Non-executive Director, GMS IndustriALL Global Union Shipbuilding-shipbreaking Action Group Meeting Rotterdam, 30 October - 1 November 2017 Worldwide ship
% change vs. Dec ALL VISITS (000) 2,410 12% 7,550 5% 31,148 1% Spend ( million) 1,490 15% 4,370-1% 18,710 4%
 2,410 12% 7,550 5% 31,148 1% Spend ( million) 1,490 15% 4,370-1% 18,710 4%") HEADLINES FULL YEAR 2012 (PROVISIONAL) 1 Overall visits 31.148 million visits making 2012 the best year for inbound tourism since 2008 but not a record. 1% increase in visits on 2011 (30.798 visits) slightly
HEADLINES FULL YEAR 2012 (PROVISIONAL) 1 Overall visits 31.148 million visits making 2012 the best year for inbound tourism since 2008 but not a record. 1% increase in visits on 2011 (30.798 visits) slightly
STANDARD MULTICARRIER AWARD TICKETS
 STANDARD MULTICARRIER AWARD TICKETS The Standard Multicarrier Award Ticket allows you to reach many destinations around the world, with the possibility to book mixed itineraries combining the Alitalia
Australia. A: Definitions and sources of data
 Australia A: Definitions and sources of data Data on foreign direct investment (FDI) in Australia are reported by the Australian Bureau of Statistics (ABS). The definition of FDI is essentially in line
World Top 20 Ports 2007~2016 (1000TEU)
") TEU World Top 2 Ports, 27~26 (TEU) {Table } Rank 27 28 29 2 2 22 23 24 25 26 Y (26/27) 2 3 4 5 Shanghai 26,5 27,98 25,2 29,69 3,739 32,529 33,67 35,34 36,537 37,33 Singapore 27,936 29,98 25,866 28,43 29,937
TEU World Top 2 Ports, 27~26 (TEU) {Table } Rank 27 28 29 2 2 22 23 24 25 26 Y (26/27) 2 3 4 5 Shanghai 26,5 27,98 25,2 29,69 3,739 32,529 33,67 35,34 36,537 37,33 Singapore 27,936 29,98 25,866 28,43 29,937
Summer Work Travel Season Program Dates by Country
 The program dates are windows of opportunity for program participation. Within this timeframe, students are still subject to their university's official academic break schedule. Even though the window
Membership & Voting Strength - 1 October September 2020
 ship & Voting Strength - 1 October 2016-30 September 2020 Assessment Period - 1 October 2012-30 September 2016 Junior Team Championships Junior - Championships Junior - Championships Junior - Africa 1
THE GROWTH OF THE HOSPITALITY INDUSTRY IN DUBAI
 THE GROWTH OF THE HOSPITALITY INDUSTRY IN DUBAI THE DEFINITION OF TOURISM Tourism is travel for recreational, leisure or business purposes. The World Tourism Organization defines tourists as people "traveling
SHIPBUILDING INDUSTRY
 0 SHIPBUILDING INDUSTRY Turkey is surrounded by sea on three sides, is a natural bridge between Asia and Europe. Turkey borders the Black Sea, the Mediterranean, the Aegean and the Sea of Marmara. The
The challenges of the Mediterranean: economic scenario and forecasts. Alessandro PANARO Head of Mediterranean & Maritime Dept. SRM
 The challenges of the Mediterranean: economic scenario and forecasts Alessandro PANARO Head of Mediterranean & Maritime Dept. SRM The International Propeller Clubs meeting Barcelona, April 25 th, 2016
Anuga 2017 in figures
 Press Release No. 10 / hac / September 2017, Cologne Anuga 2017 in figures Participation from home and abroad Exhibitors Domestic participation 716 Foreign participation 6,689 Total 7,405 The companies
INTERNATIONAL TRAVEL AND TOURISM
 INTERNATIONAL TRAVEL AND TOURISM YEAR 2014 1. INTRODUCTION This issue of the Economic and Social Indicators presents data on International Travel and Tourism for the year 2014. A brief on the compilation
Post Show Report. The 19th China International Pet Show (CIPS 2015) National Exhibition and Convention Center (Shanghai)
 National Exhibition and Convention Center (Shanghai)") 2015.11.4-7 National Exhibition and Convention Center (Shanghai) The 19th China International Pet Show (CIPS 2015) China Great Wall International Exhibition Co. Ltd. November 2015 Content OVERVIEW... 1
2015.11.4-7 National Exhibition and Convention Center (Shanghai) The 19th China International Pet Show (CIPS 2015) China Great Wall International Exhibition Co. Ltd. November 2015 Content OVERVIEW... 1
Summer Work Travel Season Program Dates by Country
 The program dates are windows of opportunity for program participation. Within this timeframe, students are still subject to their university's official academic break schedule. Even though the window
Summer Work Travel 2019 Season Program Dates by Country For External Use - Updated 11/13/2018
 The program dates are windows of opportunity for program participation. Within this timeframe, students are still subject to their university's official academic break schedule. Even though the window
The World Pasta Industry in 2011
 The World Pasta Industry in 2011 Survey The World Pasta Industry in 2011 25 October 2012 1 Like every year, we have completed our Annual Survey on the World Pasta Industry. We would like to thank all the
Central Bank of Different Countries
 Country name Afghanistan Albania Algeria Argentina Armenia Aruba Australia Austria Azerbaijan Bahamas Bahrain Bangladesh Barbados Belarus Belgium Belize Benin Bermuda Bhutan Bolivia Bosnia Botswana Brazil
21st ACI AFRICA REGION ANNUAL ASSEMBLY CONFERENCE AND EXHIBITION
 21st ACI AFRICA REGION ANNUAL ASSEMBLY CONFERENCE AND EXHIBITION LIVINGSTONE, ZAMBIA 28 AUGUST 2012 Angela Gittens Director General ACI World 1 Airports Council International ACI AFRICA ACI World 577 members
Outlook for air travel markets
 Outlook for air travel markets June 2016 Brian Pearce Chief Economist International Air Transport Association Extended period of strong air travel market growth 30% 25% 20% 15% 10% 5% 0% -5% -10% -15%
Copyrights Statistics Botswana 2016
 STATISTICS BOTSWANA TOURISM STATISTICS ANNUAL REPORT 2014 Copyrights Statistics Botswana 2016 Statistics Botswana. Private Bag 0024 Botswana Tel: (267) 367 1300. Fax: (267) 395 2201.Email: info@statsbots.org.bw
Panama Canal Outlook. Jorge L. Quijano Administrator/CEO Panama Canal Authority
 Panama Canal Outlook Jorge L. Quijano Administrator/CEO Panama Canal Authority Japan November 21, 2014 Yesterday PANAMA AT A GLANCE GDP growth rate last 10 years 7.5% GDP (P) 2013 (billion of dollars)
CHILE: A RELIABLE PARTNER FOR ASIA
 CHILE: A RELIABLE PARTNER FOR ASIA I ASIA COPPER WEEK CONFERENCE November 2012 Shanghai, China HERNÁN DE SOLMINIHAC Minister of Mining Santiago de Chile Source:SERNATUR CHILE A reliable partner for Asia
CONTENTS Executive Summary... iii 1. Introduction Major Destinations for Zambia s Exports Major Source Countries for Zambia s
 Bank of Zambia CONTENTS Executive Summary... iii 1. Introduction... 1 2. Major Destinations for Zambia s Exports... 1 3. Major Source Countries for Zambia s Imports... 4 4. Conclusion... 6 ii Executive
Maximizing Economic Benefits of Aviation in the Region
 Maximizing Economic Benefits of Aviation in the Region Boubacar Djibo Director, Air Transport Bureau, ICAO Georgetown, Guyana 21 November 2018 Preamble. THEREFORE, the undersigned governments having agreed
EUROPEAN CENTRE FOR DISEASE PREVENTION AND CONTROLInfluenza A(H1N1)v
v") Table 1: Reported new confirmed cases and cumulative number of influenza A(H1N1)v and cumulative deaths among confirmed cases by country as of August, 1: hours (CEST) in the EU and EFTA countries Confirmed
Table 1: Reported new confirmed cases and cumulative number of influenza A(H1N1)v and cumulative deaths among confirmed cases by country as of August, 1: hours (CEST) in the EU and EFTA countries Confirmed
Summer Work Travel Season Program Dates by Country
 Albania 1-Jul 30-Sep 3 Months Argentina 1-Dec 1-Apr 4 Months Armenia 1-Jun 31-Aug 3 Months Australia 15-Nov 8-Mar 3.5 Months Visa Waiver Country Austria 1-Jul 30-Sep 3 Months Visa Waiver Country Azerbaijan
IATA ECONOMIC BRIEFING MARCH 2011
 IATA ECONOMIC BRIEFING MARCH 2011 WHAT DRIVES THE SIZE OF PREMIUM AIR TRAVEL MARKETS? WHY PREMIUM AIR TRAVEL IS AN IMPORTANT TRAVEL MARKET SEGMENT The premium (first and business class) travel segment
GODINA XI SARAJEVO, BROJ 2 TOURISM STATISTICS. Tourism in BIH, February 2017
 number of nights GODINA XI SARAJEVO, 06.04.2017. BROJ 2 TOURISM STATISTICS Tourism in BIH, February 2017 In February 2017 tourists realised 56,042 tourist arrivals in Bosnia and Hercegovina which represent
An overview of Tallinn tourism trends
 An overview of Tallinn tourism trends August 2015 The data is collected from Statistics Estonia, Tallinn Airport and Port of Tallinn. In August 2015, 179,338 stayed overnight in Tallinn s accommodation
Effective for all tickets issued where American validation is used. IATA-approved locations classified by American as full service.
 Commissions Base Commission Rates Agencies Located in 50 U.S, Puerto Rico, U.S. Virgin Islands and Canada Agencies Located Outside the 50 U.S., Puerto Rico, U.S. Virgin Islands and Canada Offshore/Trans-border
Base Commission To all destinations 0%
 Commissions Offshore/Transborder Ticketing American Airlines does not pay base commission for tickets issued by travel agents on itineraries originating within the territory of the United States, including
Next Release: 13 April Next Release: 13 April December
 43070 Next Release: 13 April 2018 Next Release: 13 April 2018 December Date of publication: 15 March 2018 TABLE OF CONTENTS Charts 1 Gross consumption of natural gas by OECD region 3 2 Indigenous production
FACTS AND FIGURES COMMITTEE Piracy The Figures
 FACTS AND FIGURES COMMITTEE Piracy The Figures Paul TOURRET ISEMAR Institut Supérieur d Economie Maritime Nantes Saint-Nazaire / France 26/09/2011 1 500 450 400 350 300 250 200 150 100 50 0 The Piracy
SHIPPING STATISTICS AND MARKET REVIEW 2016
 STATISTICAL PUBLICATIONS SHIPPING STATISTICS AND MARKET REVIEW 2016 Volume 60 - No. 7 Analytical Focus World Merchant Fleet World Tanker Market World Bulk Carrier Market World Container and General Cargo
assists in the development of airport capacity to meet growing demand supports the development of improved ground access to airports
 ATAG The Air Transport Action Group (ATAG) is a coalition of organisations from throughout the air transport industry, formed to press for economically beneficial aviation capacity improvements in an environmentally
DOMESTIC AND FOREIGN DIRECT INVESTMENT REALIZATION IN QUARTER II AND JANUARY JUNE 2013
 Invest in remarkable indonesia Invest in indonesia Invest in remarkable indonesia Invest in remarkable indonesia Invest in Invest in remarkable indonesia Invest in indonesia Invest in remarkable indonesia
ENGAGING ALUMNI WORLDWIDE
 ENGAGING ALUMNI WORLDWIDE COLUMBIA GLOBAL CENTERS and COLUMBIA ALUMNI ASSOCIATION Columbia University Senate Feb. 27, 2015 Mission Statement: Columbia Global Centers Columbia Global Centers promote and
CONTENTS Executive Summary... iii 1. Introduction Major Destinations for Zambia s Exports Major Source Countries for Zambia s
 Bank of Zambia CONTENTS Executive Summary... iii 1. Introduction... 1 2. Major Destinations for Zambia s Exports... 1 3. Major Source Countries for Zambia s Imports... 3 4. Conclusion... 6 ii Executive
Long Term Trends in Shipbuilding HVB Press Conference. 20 th September 2006 Stephen Gordon, Clarkson Research
 Long Term Trends in Shipbuilding HVB Press Conference 20 th September 2006 Stephen Gordon, Clarkson Research Introduction Background to Shipbuilding Investment The Current Orderbook The Product Mix Regional
Role of Malaysian Ports & Chinese Ports in realizing Maritime Silk Road initiative
 Role of Malaysian Ports & Chinese Ports in realizing Maritime Silk Road initiative Presented by: Dato Sri Che Khalib Mohamad Noh Group Managing Director, MMC Corporation Bhd MMC PORTS: YOUR STRATEGIC MALAYSIAN
INTERNATIONAL REGISTRY IN ORGAN DONATION and TRANSPLANTATION
 INTERNATIONAL REGISTRY IN ORGAN DONATION and TRANSPLANTATION www.irodat.org Final Numbers 2016 December 2017 Dear colleagues On behalf of all IRODaT staff, we are glad to present the 2016 final numbers
Exports of Canadian Grain and Wheat Flour
 Canadian Grain Commission Commission canadienne des grain MAY 2011 CROP YEAR Exports of Canadian Grain and Wheat Flour date Tonnes (millions) 14.0 12.0 10.0 8.0 6.0 4.0 2.0 0.0 7.0 6.0 5.0 4.0 3.0 2.0
TRIPS OF BULGARIAN RESIDENTS ABROAD AND ARRIVALS OF VISITORS FROM ABROAD TO BULGARIA IN NOVEMBER 2018
 TRIPS OF BULGARIAN RESIDENTS ABROAD AND ARRIVALS OF VISITORS FROM ABROAD TO BULGARIA IN NOVEMBER 2018 In November 2018, the number of the trips of Bulgarian residents abroad was 426.3 thousand (Annex,
1.4: Premium Air Travel: An Important Market Segment
 CHAPTER 1.4 Premium Air Travel: An Important Market Segment SELIM ACH BRIAN PEARCE International Air Transport Association (IATA) The premium (first and business class) travel segment is an important market,
Exports of Canadian Grain and Wheat Flour
 Canadian Grain Commission Commission canadienne des grain FEBRUARY CROP YEAR 2012 Exports of Canadian Grain and Wheat Flour date Tonnes (millions) 10.0 9.0 8.0 7.0 6.0 5.0 4.0 3.0 2.0 1.0 0.0 6.0 5.5 5.0
Exports of Canadian Grain and Wheat Flour
 Canadian Grain Commission Commission canadienne des grain JULY CROP YEAR 2012 Exports of Canadian Grain and Wheat Flour date Tonnes (millions) 14.0 12.0 10.0 8.0 6.0 4.0 2.0 0.0 9.0 8.0 7.0 6.0 5.0 4.0
PRESS RELEASE November 18, 2002 STAR CRUISES GROUP ANNOUNCES IMPROVED EARNINGS FOR THIRD QUARTER AND FIRST NINE MONTHS OF 2002
 PRESS RELEASE November 18, 2002 FOR IMMEDIATE RELEASE INTERNATIONAL STAR CRUISES GROUP ANNOUNCES IMPROVED EARNINGS FOR THIRD QUARTER AND FIRST NINE MONTHS OF 2002 Key points for the quarter and in comparison
Weekly Dry Bulk Report
 5 ly Dry Bulk Report 22 May 3th 214 15 85 65 45 25 HIGHLIGHTS Capesize: Few shipments into China Panamax: Rates still declining L&S INDEX OF DRY BULK STOCKS* Index 214 Index 215 CAPESIZE PANAMAX Rates
Tourism Trends, Outlook and Issues. John G.C. Kester. 6th UNWTO/PATA Forum on Tourism Trends and Outlook. Guilin, China October 2012 day 1
 Tourism Trends, Outlook and Issues 6th UNWTO/PATA Forum on Tourism Trends and Outlook Guilin, China 11-13 October 212 day 1 John G.C. Kester Programme Manager, Tourism Trends and Marketing Strategies World
DOMESTIC AND FOREIGN DIRECT INVESTMENT REALIZATION IN QUARTER I 2018
 DOMESTIC AND FOREIGN DIRECT INVESTMENT REALIZATION IN QUARTER I 2018 Jakarta, 30 th April 2018 Indonesia Investment Coordinating Board LIST OF CONTENTS I. QUARTER I 2018: In Comparison with 2017 II. QUARTER
TRIPS OF BULGARIAN RESIDENTS ABROAD AND ARRIVALS OF VISITORS FROM ABROAD TO BULGARIA IN FEBRUARY 2018
 TRIPS OF BULGARIAN RESIDENTS ABROAD AND ARRIVALS OF VISITORS FROM ABROAD TO BULGARIA IN FEBRUARY 2018 In February 2018, the number of the trips of Bulgarian residents abroad was 379.5 thousand (Annex,
Exports of Canadian Grain and Wheat Flour
 Canadian Grain Commission Commission canadienne des grain JANUARY CROP YEAR 2011 Exports of Canadian Grain and Wheat Flour date Tonnes (millions) 8.0 7.0 6.0 5.0 4.0 3.0 2.0 1.0 0.0 4.0 3.5 3.0 2.5 2.0
PATA Strategic Intelligence Centre. Tsunami Recovery Update. Wednesday June 22, 2005
 PATA Strategic Intelligence Centre Tsunami Recovery Update Wednesday June 22, 2005 Page 1 of 6 Y-T-D Inbound (Source: Relevant NTOs, Airport Authorities) Year Destination Period 2004 2005 Change The Americas
TRIPS OF BULGARIAN RESIDENTS ABROAD AND ARRIVALS OF VISITORS FROM ABROAD TO BULGARIA IN OCTOBER 2017
 TRIPS OF BULGARIAN RESIDENTS ABROAD AND ARRIVALS OF VISITORS FROM ABROAD TO BULGARIA IN OCTOBER 2017 In October 2017, the number of the trips of Bulgarian residents abroad was 439.0 thousand (Annex, Table
Global robot installations: high double digit growth rates
 ' of units Global robot installations: high double digit growth rates 5 45 4 35 3 25 2 15 1 5 113 6 Estimated annual worldwide supply of industrial robots 28-216 and 217-22* +15% on average per year 121
TRIPS OF BULGARIAN RESIDENTS ABROAD AND ARRIVALS OF VISITORS FROM ABROAD TO BULGARIA IN NOVEMBER 2017
 TRIPS OF BULGARIAN RESIDENTS ABROAD AND ARRIVALS OF VISITORS FROM ABROAD TO BULGARIA IN NOVEMBER 2017 In November 2017, the number of the trips of Bulgarian residents abroad was 417.6 thousand (Annex,
TRIPS OF BULGARIAN RESIDENTS ABROAD AND ARRIVALS OF VISITORS FROM ABROAD TO BULGARIA IN JANUARY 2018
 TRIPS OF BULGARIAN RESIDENTS ABROAD AND ARRIVALS OF VISITORS FROM ABROAD TO BULGARIA IN JANUARY 2018 In January 2018, the number of the trips of Bulgarian residents abroad was 387.6 thousand (Annex, Table
CONTENTS Executive Summary... iii 1. Introduction Major Destinations for Zambia s Exports Major Source Countries for Zambia s
 Bank of Zambia CONTENTS Executive Summary... iii 1. Introduction... 1 2. Major Destinations for Zambia s Exports... 1 3. Major Source Countries for Zambia s Imports... 4 4. Conclusion... 6 ii Executive
Tourism Snapshot A focus on the markets that the CTC and its partners are active in
 Tourism Snapshot A focus on the markets that the CTC and its partners are active in www.canada.travel/corporate February 2011 Volume 7, Issue 2 Key highlights In the first two months of 2011 overnight