2006 Port Everglades Master Plan Update Public Participation Program 2 nd Meeting December 6, 2006
|
|
|
- Edwina Richardson
- 6 years ago
- Views:
Transcription

1 2006 Port Everglades Master Plan Update Public Participation Program 2 nd Meeting December 6,
2 Where We are Today.... Public participation program, 2 nd meeting: December 6 Stakeholder meetings, 2 nd meeting: December 7 Conducted one-on-one tenant meetings Conducted facilities assessment Conducted market assessment Conducted capacity assessment subject to berth utilization refinements 2
3 Where We will be Going.... Preparation of Master Plan development with assets and constraints applied First workshop with Board of County Commissioners scheduled for February 20,
4 In Spring Refinement of Master Plan, 10- and 20-year Vision Plans Preparation of 5-year Capital Improvement Program Workshop/presentation with Board of County Commissioners 4
5 Port Everglades Mission Statement The mission of Port Everglades is to manage the county s port-related assets to maximize the economic benefits to the citizens and businesses of Broward County and the State of Florida. The port will manage the county s assets in a financially responsible, environmentally sound manner, consistent with the local, state, and federal rules and regulations which govern international and domestic trade, transportation and the port industry. 5

6 Port Everglades Assets Today 6 N

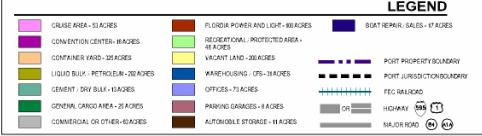
7 Existing Land Uses 7 N
8 Market Assessment Container cargo Non-container cargo; dry bulk & neo bulk cargos (i.e. cement, lumber, etc.) Liquid bulk (petroleum products) Cruise 8
9 Container Cargo Assessment Prepared by Martin & Associates Non-Container Cargo Assessment Liquid Bulk Cruise Prepared by Michael L. Sclar Associates, Inc. Prepared by Purvin & Gertz Prepared by Bermello, Ajamil & Partners, Inc. 9
10 10 Container Market Assessment - Methodology Assess historical containerized growth US port growth Southeast port growth Florida port growth Examine historical container growth of key trading partners Asia Europe Latin America/Caribbean Other world areas Examine historical and future GDP growth of Latin American and Caribbean regions International Monetary Fund Economic Commission for Latin American and the Caribbean (ECLAC) Determine Florida and South Florida population growth and projections Interview PEV terminals and carriers to determine near-term anticipated growth
11 US containerized import cargo has grown at an average annual rate of 9.8% -- driven by Asian imports 140,000, ,000, ,000,000 Tons 80,000,000 60,000,000 40,000,000 20,000, Carib/Central Am S. America Asia Europe Med/ME Australia/NZ Africa All Other 11
12 Southern Florida population growth is expected to average nearly 1.6% annually over planning horizon Florida/southern Florida population growth and estimates ,000,000 25,000,000 20,000,000 15,000,000 10,000,000 5,000, SOUTH FLA TOTAL FLA 12 Source: Demographic Estimating Conference Database, updated July 2006; South FLA counties include: Broward, Charlotte, Collier, De Soto, Glades, Hardee, Hendry, Highlands, Indian River, Lee, Manatee, Martin, Miami-Dade, Monroe, Okeechobee, Palm Beach, St. Lucie and Sarasota
13 Latin American and Caribbean GDP growth rates are expected to maintain levels between 4% and 5% in the near term 6 Percent change in GDP Source: International Monetary Fund, World Economic Outlook, September
14 Percent of Container Imports by Trade Route 2006 comparison with other ports 6% 2% PEV 16% 1% 15% 2% SAVANNAH ASIA/ISC SOUTH AMER 0% 4% ASIA/ISC SOUTH AMER 17% CARIBBEAN CARIBBEAN CENTRAL AMER CENTRAL AMER 52% 7% EUROPE/MED OTHER 78% EUROPE/MED OTHER 4% CHARLESTON 1% MIAMI 44% 40% ASIA/ISC SOUTH AMER CENTRAL AMER EUROPE/MED OTHER 27% 14% 34% ASIA/ISC SOUTH AMER CARIBBEAN CENTRAL AMER EUROPE/MED OTHER 2% 10% 10% 14% 14 Source: PIERS Database, 2006
15 Container Forecast Assumptions Developed LOW and HIGH scenarios LOW scenario assumes modest growth based on historical and projected growth South Florida population growth (import consumption) Statistically closely related to container growth Growth by trade lane Latin American and Caribbean GDP (export) ECLAC and IMF historical and near-term projections South Florida (PEV + Miami) container growth Assumes same carrier composition, NO NEW SERVICE HIGH scenario assumes more robust growth based on historical and projected growth South Florida population growth (import consumption) Growth by trade lane Latin American and Caribbean GDP Terminal and carrier near-term projections New services Latin American/Caribbean Asian/Northern European POTENTIAL 15
16 Low/High Container Forecast Choices will be made under analysis and implementation will be phased 3,000,000 2,500,000 2,000,000 1,500,000 1,000, , TEU LOW HIGH 2.7 M 1.8 M
17 Non-Container Cargo Market Assessment Overview The overwhelming proportion of dry bulk and neo bulk cargos are related to the Florida construction industry Dry bulk cargos are dominated by cement and aggregates for the cement industry Similarly, the largest proportion of neo bulk cargos are steel (rebar) and lumber 17
18 Other Commodities - Neo Bulk Yachts and autos for export represent the two other significant neo bulk commodities Yacht imports are projected to increase significantly with the potential to double every 5 years (until the market is saturated) Autos handled in Port Everglades are primarily used automobiles for export; new cars are routed via Jacksonville 18
19 Primary Forecast Drivers Over the long-term, the growth of the Florida construction industry will approach the growth rates for Florida population The economic cycles impacting construction growth rates will dominate the long-term trends Changes in inventory levels (e.g. resulting from steel import cycles and cement plant capacity growth) will further impact short-term trends Specific events such as court ordered limitations on crushed rock mining at the Lake Belt mines could create a significant opportunity for Port Everglades 19
20 High, Baseline, Low and Needs Assessment Forecasts Dry bulk and neo bulk tonnage for Port Everglades 20 9,000,000 8,000,000 7,000,000 6,000,000 5,000,000 4,000,000 3,000,000 2,000,000 1,000, BaseForecast HighForecast LowForecast Needs Forecast
21 Conclusions Cement represents the most stable market Lumber and steel volumes are limited in growth potential Growth in yachts and a stable used car market round out the neo bulk market The dry bulk and neo bulk markets for Port Everglades are relatively flat with limited downside The addition of 2-4 million tons of aggregate represents the most significant potential upside, if feasible 21
22 Cruise Market Assessment Factors Very successful in developing new products that generate sustained interest in cruising New, larger, exciting vessels, diverse onboard products and services New regions, itineraries and on shore product offerings Products deliver a high level of passenger satisfaction, leading to repeat clientele and lower conversion costs Several lines report repeat levels of over 45% Lines have learned to adapt quickly to changing market conditions and shift business models accordingly 22

23 Evolution of Cruise Vessels Period Length Draft PAX Characteristics of the Period ft. 36 ft. 500 Vessels acquired & refurbished. Fantasy Class ft. 32 ft ft ft. 1, ft ft. 2, ft ft. 3, ,000 ft ft. 3,000 Standard business model used with profitable results until the fuel crisis. Change in business model; experimentation with larger ships and operating itineraries. Larger ships becoming the destination. Shallower drafts. Mega-ships that are floating cities. Focus on maximizing passenger capacity. One-region vessels not capable of Panama Canal Transit. Larger ship volume concentrating on creating efficiencies with ship design, outside cabin development, ship services and flexible deployment. Grand Class Radiance Class ,000 ft ft. 4,000 Next Generation (Genesis) 1,100 1,400 ft ft. 5,000+ Freedom class, 160,000-GT. Allows for increased onboard revenue areas, largest ship in world status (ego / marketing boost), economies of scale. Product and service led design; new innovative marine hull design to support more above water structure. Separate apartment towers, entertainment zones and amenities. Limited port deployment options. Freedom Class


24 24 Cruise Overview Strengths include: Access to regional consumers; High quality tourism infrastructure demand Convenient marine access Number and length of cruise berths Improvement foreseen in cruise terminal facility offerings Capability of Terminals to receive largest cruise vessels Availability of additional berthing areas on peak days of operation Ingress/egress issues impacting cruise operations and parking
25 Cruise Target Regions Western Caribbean Eastern Caribbean Lower Southern Caribbean Grand Caribbean Bahamas Transcanal Extended Caribbean/South America Transatlantic World cruises US East Coast repositioning Daily and non-conventional cruise 25
26 Caribbean Growth Factors Cuba to provide increased port of call options, not necessarily increased regional capacity (shifting) Port infrastructure needed for next ship generation Expansion of out-islands and destinations key Larger ships on shorter sailings 26
27 27 Cruise Revenue Passenger Growth FY1996-FY2006 2,100,000 2,500,000 2,250,000 2,390,000 2,730,000 3,400,000 3,500,000 3,400,000 4,000,000 3,800,000 3,450,000 4,000,000 3,500,000 3,000,000 2,500,000 2,000,000 1,500,000 1,000, , Source: B&A, 2006.
28 Regional Homeport Passenger Throughput 5,000,000 4,500,000 4,000,000 3,500,000 3,000,000 2,500,000 2,000,000 1,500,000 1,000, , Port Canaveral Port Everglades Port of Miami Port of Palm Beach Port of Tampa 28 Source: B&A, 2006.
29 29 Attractiveness of Port Everglades to Cruise Market Marine Access Terminal Location(s) Pier / Berthing Apron Gangways Terminal Operations Criteria Ground Transportation Areas (GTA) Parking Provisioning Security Landside Access Airport and Airlift Lodging Attractions and Venues Access to Consumers General Appeal Marketing / Communications Key: Strong ( ), Fair ( ), Weak ( ) Assessment (short channel for large ships) / (length of berths) / (new systems installed) / / (proximity to terminals) / (gate and roadway access) / (proximity and capacity) / / Source: B&A, 2006.
30 Range of Revenue Total Passenger Projections 10,000,000 9,000,000 8,000,000 7,000,000 6,000,000 5,000,000 4,000,000 3,000,000 2,000,000 1,000, Historical A B LOW B HIGH B MID C1 C2 C3 Source: B&A, 2006.
31 Monthly Passenger Traffic 500, , , , , , , , ,000 OCT NOV DEC JAN FEB MAR APR MAY JUN JUL AUG SEP Source: B&A, 2006.
32 Daily Passenger Traffic Comparison 40% 38% 36% 34% 32% 30% 28% 26% 24% 22% 20% 18% 16% 14% 12% 10% 8% 6% 4% 2% 0% MON TUE WED THU FRI SAT SUN Source: B&A, 2006.
33 Berths vs. Volumes Mid Projection Projection B MID 15 8,000, ,000, ,000,000 Number of berths ,000,000 4,000,000 3,000,000 2,000,000 1,000,000 TOTAL BERTHS DEMANDED TOTAL +/- 1,100 LOA DEMANDED PASSENGERS 0 Passengers Source: B&A, 2006.
34 Conclusions Its all about the berths More passengers, longer berths New terminals/berths are needed in the next 2 to 5 years to support larger ships more passengers Landside infrastructure must be modified to meet demand of more passengers, baggage, vehicles Expansion through planning, technology, partnerships 34

35 35 Port Everglades Petroleum Industry serves a 12-County Region Primary Market: Broward, Miami-Dade, Palm Beach, Martin Counties Secondary Market: Collier, Glades, Hendry, Indian River, Lee, Monroe, Okeechobee, and St. Lucie Port supplies 87 percent of gasoline demand in region and 37 percent of Florida s gasoline requirements Port supplies jet fuel to FLL and MIA
36 Petroleum Product Diversity Regional petroleum product demand is growing at about 2.7 percent annually Gasoline predominates, but Port also supplies diesel, asphalt, jet fuel, fuel oil for the power plants, propane, and some biodiesel fuels Industry services include Selling gasoline to retail gas stations in the region supplying the region s international airports Fueling the Port s cargo and cruise ships Serving military needs Providing emergency storage 36
37 Market Characteristics Percentage of vessel calls is shifting from barge to tanker, with more product coming from international sources Tankers coming from international markets are larger than those from domestic sources Existing petroleum berths are utilized to capacity. Fully loaded larger tankers can experience constraints (berth length, slip width, water depth) Emergency situations such as hurricanes during peak seasonal demand can stress tenants storage and distribution capabilities 37
38 What is Needed to meet Market Forecasts.... Container Cargo Increase berth and yard utilization Add Berths/Terminal Yards Increase Efficiencies Increase berth occupancy Increase lifts per call Use higher density stacking equipment Deepen and widen channel Non-Container Cargo Determine feasibility of aggregate as major import commodity Cruise Have 9 berths to handle foot LOA ships Increase cruise season/weekday use Continue dual use of berths for cargo and cruise Petroleum Increase receiving system efficiencies Add berth capacity 38
39 Conclusion Berth Capacity is the primary limiting factor to Port growth NEXT STEPS Balance capital improvements with operational efficiencies and environmental stewardship to achieve optimum Master Plan 39
MAXIMIZING INVESTMENT AND UTILIZATION
 MAXIMIZING INVESTMENT AND UTILIZATION November 2013 Luis Ajamil Bermello, Ajamil & Partners Two perspectives How to increase use of the facility OPTIMIZATION How to improve the capacity of the facility
Port Everglades Master/Vision Plan Update
 Port Everglades Master/Vision Plan Update Public Meeting June 24, 2013 Agenda Port Everglades Overview Project Background Infrastructure Needs Identified in 2009 Plan Review of Priority Projects Review
Statistics of Air, Water, and Land Transport Statistics of Air, Water, and Land. Transport Released Date: August 2015
 Statistics of Air, Water, and Land Transport 2014 2013 1 Released Date: August 2015 Table of Contents Introduction... 4 Key Points... 5 1. Air Transport... 6 1.1 Aircraft movements... 6 1.2 Number of passengers...
Annual Port Review. June 22, 2016
 Annual Port Review June 22, 2016 2 Port Everglades by the Numbers (FY2015 unless indicated) #1 Seaport in Florida by Revenue - $153 million #1 Container Port in Florida - (#10 in U.S.) by volume 1,060,507
Port Everglades Master/Vision Plan Update
 1 Port Everglades Master/Vision Plan Update 3 rd Tenant & Stakeholder Meeting November 21, 2013 2 Agenda Project Process Overview Summary of the Market Assessments October 30 th Charrette Summary Industry
Tampa Bay Cruise Study Pre-Feasibility. Final Report July 8, 2014
 Final Report July 8, 2014 Table of Contents Contents 1 EXECUTIVE SUMMARY... 1 2 WORLDWIDE CRUISE INDUSTRY... 2 3 TAMPA BAY CRUISE BUSINESS AND OUTLOOK... 9 Projections... 13 Berth Demand... 18 Economic
Port Everglades. Presented to FMPOAC Freight Committee. July 23, 2015
 Port Everglades Presented to FMPOAC Freight Committee July 23, 2015 Port Overview Dania Beach Fort Lauderdale Hollywood Broward County Municipal Services District Port Everglades Overview Enterprise Fund
AAPA Smart Ports. Business Intelligence. March 7 th, 2018 Oakland, CA. Nicholas van den Heiligenberg Business Development Manager
 AAPA Smart Ports Business Intelligence March 7 th, 2018 Oakland, CA Nicholas van den Heiligenberg Business Development Manager #1 Seaport in Florida by Revenue $161.7 million (FY2017) #1 Container Port
Panama Canal Stakeholder Working Group Meeting
 Panama Canal Stakeholder Working Group Meeting POHA, Bayport Container Terminal, Houston, Texas August 27, 2012 TOTAL ECONOMIC IMPACT 9,749 Texas jobs are in some way related to the Port Of the 9,749
Port Everglades 2014 Master/Vision Plan Update
 1 Port Everglades 2014 Master/Vision Plan Update Public Meeting May 28, 2014 2 Agenda Port Everglades Mission Project Background 2014 Master/Vision Plan Update Process Status of 2009 5-Year Master Plan
Panama Canal Expansion Antecedents
 Panama Canal Expansion Antecedents May 1879: Baron Godin de Lepinay Canal Lock proposal at the International Congress for Study of an Interoceanic Canal ignored. January 1906: Report of the Consulting
Industry Update. ACI-NA Winter Board of Directors Meeting February 3, 2016 Orlando, FL
 Industry Update ACI-NA Winter Board of Directors Meeting February 3, 2016 Orlando, FL U.S. & Canadian GDP 8% 6% 4% U.S.* Canada** Estimate by BEA as of 02/11/16 2% 0% -2% -4% -6% -8% -10% The U.S. economy
Port Everglades Master/Vision Plan Update
 Port Everglades Master/Vision Plan Update Environmental Stakeholder Meeting June 15, 2009 Discussion to Focus On: Updating the 2006 Port Everglades Master Plan Issues dealing with the Turning Notch Potential
PORT DEVELOPMENT STRATEGIES & SUCCESS STORIES. PORTMIAMI AN EVOLVING GATEWAY Juan M. Kuryla, PPM PortMiami Director and CEO
 PORT DEVELOPMENT STRATEGIES & SUCCESS STORIES PORTMIAMI AN EVOLVING GATEWAY Juan M. Kuryla, PPM PortMiami Director and CEO PORTMIAMI: AN EVOLVING GLOBAL GATEWAY PORT MISSION PortMiami s goal is to operate
The Panama Canal Expansion: Myths and Realities for the North American Economy
 2015 Center for Transportation Studies Research Conference, University of Minnesota The Panama Canal Expansion: Myths and Realities for the North American Economy Jean-Paul Rodrigue Professor, Dept. of
Measures & Projections October 31, GoToBermuda.com
 Measures & Projections October 31, 2015 GoToBermuda.com October Total Vacation Visitor Arrivals Vacation Arrivals Oct-14 Oct-15 2015 Air Vacation 9,203 10,344 1,141 12.40 126,842 127,044 202 0.16 Cruise
TABLE OF CONTENTS. Washington Aviation System Plan Update July 2017 i
 TABLE OF CONTENTS Chapter 1 Overview... 1-1 1.1 Background... 1-1 1.2 Overview of 2015 WASP... 1-1 1.2.1 Aviation System Performance... 1-2 1.3 Prior WSDOT Aviation Planning Studies... 1-3 1.3.1 2009 Long-Term
Port Everglades Overview
 Port Everglades Overview Broward County Charter Review Infrastructure Subcommittee June 7, 2017 Steven M. Cernak, P.E., PPM Chief Executive & Port Director Jurisdictional Area Located in the cities of:
Study Design Outline. Background. Overview. Desired Study Outcomes. Study Approach. Goals (preliminary) Recession History
 Recession History") MIA BASELINE ACTIVITY FORECASTS, DERIVATIVE DATA AND FLEET MIX PROJECTIONS RESULTS SUMMARY ACCEPTANCE BRIEFING FOR THE AIRPORT AND SEAPORT COMMITTEE (ASC) JULY 15, 2010 Study Design Outline Background
MIA BASELINE ACTIVITY FORECASTS, DERIVATIVE DATA AND FLEET MIX PROJECTIONS RESULTS SUMMARY ACCEPTANCE BRIEFING FOR THE AIRPORT AND SEAPORT COMMITTEE (ASC) JULY 15, 2010 Study Design Outline Background
July 2012 Passenger and Cargo Traffic Statistics Reno-Tahoe International Airport
 July 2012 Passenger and Cargo Traffic Statistics Reno-Tahoe International Airport August 31, 2012 U.S. DOMESTIC INDUSTRY OVERVIEW FOR JULY 2012 All RNO Carriers Systemwide year over year comparison Average
Port Everglades Master Plan Update Tenant Workshop. July 12, Port Everglades Master Plan Update 2006
 Tenant Workshop July 12, 2007 1 Original 2026 Year Vision Plan DYNEGY PROPERTY SHARED AIRPORT/SUPPORT FACILITY 12 12 2 Input from Tenants Northport Convention Center carve out Expanded cruise berth at
PortMiami Director and CEO Juan M. Kuryla PUBLIC-PRIVATE PARTNERSHIPS (P3)
") PortMiami Director and CEO Juan M. Kuryla PUBLIC-PRIVATE PARTNERSHIPS (P3) PORTMIAMI QUICK FACTS PortMiami is located in Miami-Dade County, one of the most diverse, multilingual populations in the U.S.
PortMiami Director and CEO Juan M. Kuryla PUBLIC-PRIVATE PARTNERSHIPS (P3) PORTMIAMI QUICK FACTS PortMiami is located in Miami-Dade County, one of the most diverse, multilingual populations in the U.S.
Westover Metropolitan Airport Master Plan Update
 Westover Metropolitan Airport Master Plan Update June 2008 INTRODUCTION Westover Metropolitan Airport (CEF) comprises the civilian portion of a joint-use facility located in Chicopee, Massachusetts. The
APPENDIX B SOCIO-ECONOMICS
 APPENDIX B SOCIO-ECONOMICS FINAL FEASIBILITY REPORT AND ENVIRONMENTAL IMPACT STATEMENT PORT EVERGLADES HARBOR NAVIGATION STUDY BROWARD COUNTY, FLORIDA Executive Summary Port Everglades is a port of national
Oct-17 Nov-17. Sep-17. Travel is expected to grow over the coming 6 months; at a slightly faster rate
 Analysis provided by TRAVEL TRENDS INDEX SEPTEMBER 2018 CTI reading of.8 in September 2018 indicates that travel to or within the U.S. grew 1.6% in September 2018 compared to September 2017. LTI predicts
AUCKLAND DESTINATION OVERVIEW
 AUCKLAND DESTINATION OVERVIEW September 218 An in-depth overview of Auckland s visitor economy from the latest arrival, accommodation, spend, cruise and event data through to past five- commentary. Prepared
PLU Airport Master Plan. Master Plan Advisory Committee (MPAC) Meeting #2 October 16, 2016
 Meeting #2 October 16, 2016") PLU Airport Master Plan Master Plan Advisory Committee (MPAC) Meeting #2 October 16, 2016 Meeting Agenda 1. Introductions and Contacts [10 Minutes] 2. Plan Overview and MPAC Role [20 Minutes] 3. MPAC Visioning
PLU Airport Master Plan Master Plan Advisory Committee (MPAC) Meeting #2 October 16, 2016 Meeting Agenda 1. Introductions and Contacts [10 Minutes] 2. Plan Overview and MPAC Role [20 Minutes] 3. MPAC Visioning
Yukon Tourism Indicators Year-End Report Yukon Tourism Indicators Year-End Report 2015
 Yukon Tourism Indicators Overview The Yukon Tourism Indicators is published by the Department of Tourism and Culture as a companion to the monthly Yukon Tourism Visitation Report. This document is intended
Port Everglades: Making The Last Mile Count. AAPA Annual Convention November 3, 2015
 Port Everglades: Making The Last Mile Count AAPA Annual Convention November 3, 2015 Port Everglades Overview Enterprise Fund of Broward County Government Operations are supported 100% by user fees; no
Evaluating Lodging Opportunities
 Evaluating Lodging Opportunities This section explores market opportunities for new lodging accommodations in the downtown area. It will help you understand travel and visitation trends, existing competition,
American Institute of Marine Underwriters
 American Institute of Marine Underwriters Mr. Scott Bergeron Chief Executive Officer, Liberian Registry Commissioner, Virginia Port Authority May 8, 2013 1 Existing Lock Dimensions vs. Expanded Lock Dimensions
Jan-18. Dec-17. Travel is expected to grow over the coming 6 months; at a slower rate
 Analysis provided by TRAVEL TRENDS INDEX DECEMBER 2018 CTI reading of 51.8 in December 2018 indicates that travel to or within the U.S. grew 3.6% in December 2018 compared to December 2017. LTI predicts
January 2018 Air Traffic Activity Summary
 January 2018 Air Traffic Activity Summary Jan-2018 Jan-2017 CY-2018 CY-2017 Passengers 528,947 505,421 4.7% 528,947 505,421 4.7% Passengers 537,332 515,787 4.2% 537,332 515,787 4.2% Passengers 1,066,279
Airline industry outlook remains fragile
 Airline industry outlook remains fragile June 2009 www.iata.org/economics To represent, lead and serve the airline industry Airline industry outlook remains fragile Green shoots starting to appear Recovery
Airline Current Business Environment Alex Heiter
 Airline Current Business Environment Alex Heiter Istanbul Technical University Air Transportation Management M.Sc. Program Network, Fleet and Schedule Strategic Planning Module 2: 28 March 2016 The underlying
The Economic Contribution of Cruise Tourism to the Southeast Asia Region in Prepared for: CLIA SE Asia. September 2015
 BREA Business Research & Economic Advisors The Economic Contribution of Cruise Tourism to the Southeast Asia Region in 2014 Prepared for: CLIA SE Asia September 2015 Business Research & Economic Advisors
IATA ECONOMIC BRIEFING FEBRUARY 2007
 IATA ECONOMIC BRIEFING FEBRUARY 27 NEW AIRCRAFT ORDERS KEY POINTS New aircraft orders remained very high in 26. The total of 1,834 new orders for Boeing and Airbus commercial planes was down slightly from
October 2013 Passenger and Cargo Traffic Statistics Reno-Tahoe International Airport
 October 2013 Passenger and Cargo Traffic Statistics Reno-Tahoe International Airport December 4, 2013 U.S. DOMESTIC INDUSTRY OVERVIEW FOR OCTOBER 2013 All RNO Carriers Systemwide year over year comparison
DISTRICT EXPRESS LANES ANNUAL REPORT FISCAL YEAR 2017 JULY 1, 2016 JUNE 30, FloridaExpressLanes.com
 DISTRICT EXPRESS LANES ANNUAL REPORT FISCAL YEAR 2017 JULY 1, 2016 JUNE 30, 2017 FloridaExpressLanes.com This page intentionally left blank. TABLE OF CONTENTS List of Figures... ii List of Tables.... ii
Produced by: Destination Research Sergi Jarques, Director
 Produced by: Destination Research Sergi Jarques, Director Economic Impact of Tourism Oxfordshire - 2015 Economic Impact of Tourism Headline Figures Oxfordshire - 2015 Total number of trips (day & staying)
AUGUST 2008 MONTHLY PASSENGER AND CARGO STATISTICS
 Inter-Office Memo Reno-Tahoe Airport Authority Date: October 2, 2008 To: Statistics Recipients From: Tom Medland, Director Air Service Business Development Subject: RENO-TAHOE INTERNATIONAL AIRPORT PASSENGER
PORT EVERGLADES COMMERCE REPORT FISCAL YEAR 2017
 PORT EVERGLADES COMMERCE REPORT FISCAL YEAR 2017 MISSION STATEMENT Port Everglades is Florida s powerhouse global gateway. A respected leader in trade, travel and financial stability, we create economic
Produced by: Destination Research Sergi Jarques, Director
 Produced by: Destination Research Sergi Jarques, Director Economic Impact of Tourism Epping Forest - 2014 Economic Impact of Tourism Headline Figures Epping Forest - 2014 Total number of trips (day & staying)
PORT OF CORPUS CHRISTI BUILDING FOR THE FUTURE
 Frank C. Brogan P.E., R.P.L.S. Director of Engineering Services PORT OF CORPUS CHRISTI BUILDING FOR THE FUTURE TRANSPORTATION RESEARCH BOARD Galveston, Texas June 25, 2001 PORT OF CORPUS CHRISTI AUTHORITY
Produced by: Destination Research Sergi Jarques, Director
 Produced by: Destination Research Sergi Jarques, Director Economic Impact of Tourism Oxfordshire - 2016 Economic Impact of Tourism Headline Figures Oxfordshire - 2016 number of trips (day & staying) 27,592,106
December 2013 Passenger and Cargo Traffic Statistics Reno-Tahoe International Airport
 December 2013 Passenger and Cargo Traffic Statistics Reno-Tahoe International Airport January 24, 2014 U.S. DOMESTIC INDUSTRY OVERVIEW FOR DECEMBER 2013 All RNO Carriers Domestic Systemwide year over year
AUCKLAND DESTINATION OVERVIEW
 AUCKLAND DESTINATION OVERVIEW October 218 An in-depth overview of Auckland s visitor economy from the latest arrival, accommodation, spend, cruise and event data through to past five- commentary. Prepared
Market Outlook. Michael Warner, Director Market Analysis. Boeing Commercial Airplanes October October 7 10, 2012 Atlanta, Georgia, USA
 Market Outlook Michael Warner Director, Market Analysis Boeing Commercial Airplanes October 2012 Agenda Aviation environment Current products Product strategy & development 2012 719 net orders through
CHINA HOTEL MARKET OUTLOOK
 CHINA HOTEL MARKET OUTLOOK Topics To Cover Key Market Assessment China Hotel Market Sentiment Survey The Big Picture For China In 2010 Key Market Outlook KEY MARKET ASSESSMENT Key Market Occupancy Trends
September 2010 Brian Pearce To represent, lead and serve the airline industry
 Cycle turns up but risks and structural challenges remain September 2010 Brian Pearce www.iata.org/economics To represent, lead and serve the airline industry Confidence was still high in July survey Airline
SYSTEM BRIEF DAILY SUMMARY
 SYSTEM BRIEF SUMMARY * ANNUAL (PEAK HOURS 7:00 AM TO 10:00 PM MON-SAT) MaxTemp NEL (MWH) Hr Ending Hr Ending LOAD ENERGY (MWH) INCREMENTAL COST DAY DATE Civic TOTAL MAXIMUM @Max MINIMUM @Min FACTOR ON
PORT OF TOWNSVILLE NORTHERN AUSTRALIA S TRANSPORT LINK TO THE WORLD TOWNSVILLE PORT EXPANSION PROJECT MAGNETIC ISLAND KNOWLEDGE FORUM 29 APRIL 2017
 PORT OF TOWNSVILLE NORTHERN AUSTRALIA S TRANSPORT LINK TO THE WORLD TOWNSVILLE PORT EXPANSION PROJECT MAGNETIC ISLAND KNOWLEDGE FORUM 29 APRIL 2017 AGENDA: Contents CONTENTS 1 2 3 Port of Townsville Context
AUCKLAND DESTINATION OVERVIEW
 AUCKLAND DESTINATION OVERVIEW AUGUST 218 An in-depth overview of Auckland s visitor economy from the latest arrival, accommodation, spend and cruise data through to past five- commentary. Prepared September
Real Estate and Recreation
 Tim Macy Deputy Executive Director Real Estate and Recreation Welcome Center Update Canaveral Port tauthority October 3, 2013 A Modest Beginning Early Days of Cruising Queen Elizabeth II visits Port Canaveral
Interim Management Report First Half Results 2010/11. October 29, 2010
 Interim Management Report First Half Results 2010/11 October 29, 2010 Disclaimer Certain information included in these statements is forward-looking and involves risks and uncertainties that could cause
With the completion of this project, we would like to follow-up on the projections as well as highlight a few other items:
 TO: FROM: Mayor and Council Interim City Manager Rebecca Underhill, Director of Finance DATE: February 28, 2014 SUBJECT: Water Meter Project Analysis On March 28, 2012, Acting City Manager Mike Loftin
Shanghai Green Port Construction. Shanghai Municipal Transportation Commission
 Shanghai Green Port Construction Shanghai Municipal Transportation Commission 1.Profile of Shanghai 2.Air pollution by vessels of Shanghai Port 3.Shanghai Green Port Construction 4.Implementation of ECA
Port Everglades Master/Vision Plan Update Cruise and Liquid Bulk Charrette Meeting. June 18, 2009
 Port Everglades Master/Vision Plan Update Cruise and Liquid Bulk Charrette Meeting June 18, 2009 1 The purpose of this presentation was to review the progress of the update to the 2006 Master/Vision Plan
Air China Limited Annual Results. March Under IFRS
 Air China Limited 21 Annual Results Under IFRS March 211 Agenda Part 1 Highlights Part 2 Business Overview Part 3 Financial Overview Part 4 Outlook 2 Part 1 Highlights Steady Economic Growth; Asia Pacific
49 May-17. Jun-17. Travel is expected to grow over the coming 6 months; at a slower rate
 Analysis provided by TRAVEL TRENDS INDEX MAY 2018 CTI reading of 51.7 in May 2018 shows that travel to or within the U.S. grew 3.4% in May 2018 compared to May 2017. LTI predicts moderating travel growth
International economic context and regional impact
 Contents I. GDP growth trends in Latin America and the Caribbean in 2012 II. Regional performance in 2012: Inflation, employment and wages External sector Policies: Fiscal and Monetary III. Conclusions
Prospects for international tourism
 Prospects for international tourism Project LINK UN DESA Expert Group Meeting on the World Economy, NYC, USA 24-26 October 211 John G.C. Kester Programme Manager, Tourism Trends and Marketing Strategies
Can Your Port s Current Condition Attract and Increase Cruise Traffic? Juan Kuryla Assistant Port Director
 Can Your Port s Current Condition Attract and Increase Cruise Traffic? Juan Kuryla Assistant Port Director 1 POM s Strategic Plan The Port of Miami is among America's busiest ports. To retain its competitive
Beyond Gateway Ports Navigating New Destinations
 Beyond Gateway Ports Navigating New Destinations Steven Young Director Port Services & Government Affairs Carnival UK Cruise Down Under Conference 4 th 5 th September 2014 The Nautical Challenges for Regional
September 2013 Passenger and Cargo Traffic Statistics Reno-Tahoe International Airport
 September 2013 Passenger and Cargo Traffic Statistics Reno-Tahoe International Airport October 31, 2013 U.S. DOMESTIC INDUSTRY OVERVIEW FOR SEPTEMBER 2013 All RNO Carriers Systemwide year over year comparison
Commissioned by: Economic Impact of Tourism. Stevenage Results. Produced by: Destination Research
 Commissioned by: Produced by: Destination Research www.destinationresearch.co.uk December 2016 Contents Page Introduction and Contextual Analysis 3 Headline Figures 5 Volume of Tourism 7 Staying Visitors
Textile and Apparel Importer Trade and Transportation Conference
 Textile and Apparel Importer Trade and Transportation Conference January 9, 2013 Los Angeles County Orange County Port of Long Beach Port of Los Angeles San Pedro Bay Port Complex Autos TRAPAC - 173 Pasha
Economic Impact of Tourism. Hertfordshire Results. Commissioned by: Visit Herts. Produced by:
 Commissioned by: Visit Herts Produced by: Destination Research www.destinationresearch.co.uk December 2016 Contents Page Introduction and Contextual Analysis 3 Headline Figures 5 Volume of Tourism 7 Staying
Update of the Airport Master Plan. Initial Runway & Land Use Alternatives
 Johannesburg International Airport Update of the Airport Master Plan Initial Runway & Land Use Alternatives 15 February 2006 BACKGROUND JNB current Master Plan Approved by ACSA Board in 1999 20-22 mppa?
APPENDIX K FLORIDA PORTS. Adopted: May 8, 2012, Ord. No A12
 FLORIDA PORTS Adopted: May 8, 2012, Ord. No. 2012-A12 This page left intentionally blank. I. EXISTING FLORIDA SEAPORTS Not including Port Citrus, there are 14 public seaports on Florida s Atlantic and
Post tsunami Recovery of Port and Harbor areas in Japan from the 2011 Great East Japan Earthquake Tsunami
 Date : 18 Nov., 2015 Venue : Furama Ballroom 1 SESSION 1 : A Decade of Partnerships in Sustainable Development of the Seas of East Asia: Synergies and Achievements WORKSHOP 1.1 : Managing Risks in Climate
Passenger and Cargo Statistics Report
 Passenger and Cargo Statistics Report RenoTahoe International Airport December 2015 U.S. DOMESTIC INDUSTRY OVERVIEW FOR DECEMBER 2015 All RNO Carriers Domestic Systemwide year over year comparison Average
The Big Picture of Itinerary Planning Cruise Down Under Conference
 The Big Picture of Itinerary Planning Cruise Down Under Conference Crystal Morgan Princess Cruises Director, Deployment Planning Perth, Western Australia September 4, 2014 Healesville Sanctuary The Big
Oct-17 Nov-17. Travel is expected to grow over the coming 6 months; at a slower rate
 Analysis provided by TRAVEL TRENDS INDEX OCTOBER 2018 CTI reading of 51.6 in October 2018 indicates that travel to or within the U.S. grew 3.2% in October 2018 compared to October 2017. LTI predicts travel
December 2012 Passenger and Cargo Traffic Statistics Reno-Tahoe International Airport
 December 2012 Passenger and Cargo Traffic Statistics Reno-Tahoe International Airport January 29, 2013 U.S. DOMESTIC INDUSTRY OVERVIEW FOR DECEMBER 2012 All RNO Carriers Systemwide year over year comparison
Produced by: Destination Research Sergi Jarques, Director
 Produced by: Destination Research Sergi Jarques, Director Economic Impact of Tourism North Norfolk District - 2016 Contents Page Summary Results 2 Contextual analysis 4 Volume of Tourism 7 Staying Visitors
Produced by: Destination Research Sergi Jarques, Director
 Produced by: Destination Research Sergi Jarques, Director Economic Impact of Tourism Norfolk - 2016 Contents Page Summary Results 2 Contextual analysis 4 Volume of Tourism 7 Staying Visitors - Accommodation
U.S. DOMESTIC INDUSTRY OVERVIEW FOR OCTOBER 2010 All RNO Carriers Systemwide year over year comparison
 Inter-Office Memo Reno-Tahoe Airport Authority Date: November 22, 2010 To: Chairman and Board of Trustees From: Krys T. Bart, A.A.E., President/CEO Subject: RENO-TAHOE INTERNATIONAL AIRPORT OCTOBER 2010
FLL Master Plan Update Technical Advisory Committee (TAC) Briefing #1. September 28, 2016
 Briefing #1. September 28, 2016") FLL Master Plan Update Technical Advisory Committee (TAC) Briefing #1 September 28, 2016 TAC Committee Role: Internal Stakeholders To provide input on the master planning analysis from the technical and
FLL Master Plan Update Technical Advisory Committee (TAC) Briefing #1 September 28, 2016 TAC Committee Role: Internal Stakeholders To provide input on the master planning analysis from the technical and
Delivering the Goods: Ports in the South
 Delivering the Goods: Ports in the South Sujit M. CanagaRetna The Council of State Governments Southern Legislative Conference (SLC) Atlanta, Georgia Presentation to the Southern Economic Development Council
2017/ Q1 Performance Measures Report
 2017/2018 - Q1 Performance Measures Report Contents Ridership & Revenue... 1 Historical Revenue & Ridership... 1 Revenue Actual vs. Planned... 3 Mean Distance Between Failures... 5 Maintenance Cost Quarter
SouthwestFloridaInternational Airport
 SouthwestFloridaInternational Airport SouthwestFloridaInternationalAirportislocatedinLee CountyalongtheGulfCoastofSouthFlorida,tenmiles southeastofthefortmyerscentralbusinessdistrict. Theprimaryhighwayaccesstotheairportfrom
MARKET INSIGHTS UPDATE North America
 SPOTLIGHT ON: THE SHOULDER TRAVEL SEASON PG2 A monthly update including relevant information on travel industry trends, consumer and meetings market research, competitive intelligence, and Hawai i s performance
NBAA 2015 MARKET UPDATE
 NBAA 2015 MARKET UPDATE November 2015 Forward-Looking Statements 2 This report contains forward-looking statements within the meaning of Section 21E of the Securities Exchange Act of 1934. All statements,
Prices are Starting From MARINER OF THE SEAS VOYAGER CLASS TONNAGE :
 MARINER OF THE SEAS SAILING ON MARCH 2018 1-Mar-18 5-Mar-18 9-Mar-18 12-Mar-18 16-Mar-18 19-Mar-18 29-Mar-18 2-Apr-18 6-Apr-18 4 NIGHTS 4 NIGHTS 3 NIGHTS 4 NIGHTS 3 NIGHTS 3 NIGHTS 4 NIGHTS 4 NIGHTS 3
Port Everglades 2014 Master/Vision Plan Update
 1 Port Everglades 2014 Master/Vision Plan Update Environmental Stakeholders Meeting May 27, 2014 2 Agenda 2014 Master/Vision Plan Update Process Status of 2009 5-Year Master Plan Projects Summary of Market
The contribution of Tourism to the Greek economy in 2017
 The contribution of Tourism to the Greek economy in 2017 1 st edition (provisional data) May 2018 Dr. Aris Ikkos, ISHC Research Director Serafim Koutsos Analyst INSETE Republishing is permitted provided
November 2013 Passenger and Cargo Traffic Statistics Reno-Tahoe International Airport
 November 2013 Passenger and Cargo Traffic Statistics Reno-Tahoe International Airport December 26, 2013 U.S. DOMESTIC INDUSTRY OVERVIEW FOR NOVEMBER 2013 All RNO Carriers Domestic Systemwide year over
Airport Preliminary Master Plan Workshop Board of County Commissioners April 18, 2017
 Airport Preliminary Master Plan Workshop Board of County Commissioners April 18, 2017 (PRELIMINARY DRAFT) WORK IN PROGRESS - FOR DISCUSSION PURPOSES ONLY Agenda (PRELIMINARY DRAFT) WORK IN PROGRESS - FOR
Christopher Allen. AVP Global Deployment & Itinerary Planning Royal Caribbean International Celebrity Cruises
 Christopher Allen AVP Global Deployment & Itinerary Planning Royal Caribbean International Celebrity Cruises Today s Itinerary Who we are? Deployment Process Industry Australia & Royal Caribbean 2 OVERVIEW
AirportInfo. ACI-NA 2011 Traffic Report
 AirportInfo ACI-NA 2011 Traffic Report July 2012 2011 ACI World Airport Traffic Summary North America 2011 % Change 2010 Worldwide 2011 % Change 2010 Total Passengers 1.5B Up 1.8% 5.1B Up 5.2% Total International
AIR CARGO RECOVERY DRIVERS AND ROADBLOCKS Airports Council International North America Calgary
 AIR CARGO RECOVERY DRIVERS AND ROADBLOCKS Airports Council International North America Calgary DAN MUSCATELLO Landrum & Brown September 9, 0 Metric Tons (in millions) GLOBAL AIR CARGO VOLUMES Global air
Master Plan of Costa Rica Atlantic Coast Limon - Moin. November, 2008 Costa Rica
 Master Plan of Costa Rica 2009-2030 Atlantic Coast Limon - Moin November, 2008 Costa Rica America Main Maritimes routes Costa Rica is located in a strategic position next to Panama Canal and its future
IATA ECONOMICS BRIEFING AIRLINE BUSINESS CONFIDENCE INDEX OCTOBER 2010 SURVEY
 IATA ECONOMICS BRIEFING AIRLINE BUSINESS CONFIDENCE INDEX OCTOBER SURVEY KEY POINTS Results from IATA s quarterly survey conducted in October show business conditions continued to improve during the third
Reno-Tahoe Airport Authority U.S. DOMESTIC INDUSTRY OVERVIEW FOR FEBRUARY
 Inter-Office Memo Reno-Tahoe Airport Authority Date: March 30, 2009 To: Statistics Recipients From: Krys T. Bart, A.A.E., President/CEO Subject: RENO-TAHOE INTERNATIONAL AIRPORT PASSENGER STATISTICS U.S.
 Existing Conditions AIRPORT PROFILE Passenger Terminal Complex 57 air carrier gates 11,500 structured parking stalls Airfield Operations Area 9,000 North Runway 9L-27R 6,905 Crosswind Runway 13-31 5,276
January 2014 Passenger and Cargo Traffic Statistics Reno-Tahoe International Airport
 January 2014 Passenger and Cargo Traffic Statistics Reno-Tahoe International Airport March 12, 2014 U.S. DOMESTIC INDUSTRY OVERVIEW FOR DECEMBER 2013 All RNO Carriers Domestic Systemwide year over year
Inter-Office Memo Reno-Tahoe Airport Authority
 Inter-Office Memo Reno-Tahoe Airport Authority Date: November 30, 2009 To: Statistics Recipients From: Krys T. Bart, A.A.E., President/CEO Subject: RENO-TAHOE INTERNATIONAL AIRPORT PASSENGER STATISTICS
1.0 Project Background Mission Statement and Goals Objectives of this Sustainable Master Plan
 TABLE OF CONTENTS CHAPTER 1 INTRODUCTION 10 Project Background 1-1 11 Mission Statement and Goals 1-1 12 Objectives of this Sustainable Master Plan 1-2 CHAPTER 2 INVENTORY 20 Airport Background 2-1 201
INTERIM REPORT JANUARY-JUNE 2012 BJÖRN ROSENGREN, PRESIDENT & CEO 18 JULY 2012
 INTERIM REPORT JANUARY-JUNE 212 BJÖRN ROSENGREN, PRESIDENT & CEO 18 JULY 212 Highlights Q2/212 Order intake EUR 1,198 million, +2% Net sales EUR 1,99 million, +6% Book-to-bill 1.9 (1.13) EBIT EUR 113 million,