E u r o p e a n S e a P o r t s O r g a n i s a t i o n w w w. e s p o. b e
|
|
|
- Shonda Short
- 6 years ago
- Views:
Transcription
1
2 Table of Contents Foreword by Victor Schoenmakers, Chairman of ESPO 5 1. Port Governance 7 2. Intermodal Transport and Logistics 9 3. Sustainable Development Marine Affairs and Security Economic Analysis and Statistics Passengers Overview of ESPO Activities in the Period ESPO Structure and Membership Market Developments in Figures 30
3
4


5 Smart cities and regions need intelligent ports. Luís Valente de Oliveira, European Coordinator for Motorways of the Sea P 4

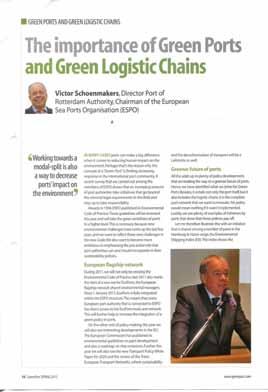
6 Foreword Ports are more than ever on the European maps. The new policy framework for the Trans-European Transport Networks does this in the most literal sense, both as comprehensive and core network. Ports are generally expected to play a key role in meeting the ambitious objectives of the European Commission s Transport Policy White Paper. And, yes, a new ports package is in the making, which will revive some of the well-known regulatory issues we dealt with a few years ago. We have quite a few challenges ahead therefore and I am happy that we have with ESPO a strong organisation that will be able to provide a clear response on behalf of the sector. The time and resources we invested in the past years in developing our network and know-how, be it in the field of port performance, governance or sustainability, will now come in very handy. We owe a lot of this to the efforts of our Technical Committees, which form the backbone of the ESPO structure. They constitute a formidable network of port professionals that all contribute on a voluntary basis to our work, despite the very busy schedules they have in their own ports. I would like to thank them, and the Committee chairmen, for the sense of community they relentlessly demonstrate. The foundations of any organisation are its members, and I think we should do even more in ESPO to reach out to all those individual ports out there. A daunting task given the sheer number of them, but one we should not shy away from. It is essential if we want to continue taking a united, credible and constructive stance on behalf of that great community of European ports that we represent. Victor Schoenmakers Chairman of ESPO P 5


7 Most European port authorities have renaissance ambitions, but the diversity in governance frameworks either limits or enables those. ESPO Port Governance Fact-Finding Report
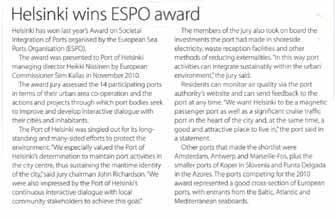
8 1. Port Governance The European Commission s new Transport Policy White Paper announced a review of European ports policy, with a particular focus on restrictions existing in the market of port services. In September this year, Commission Vice-President Siim Kallas confirmed the aim to design a new ports package by the beginning of 2013 which would essentially look at administrative simplification, market access and financial transparency. The preparation of the package would be accompanied by a consultation of stakeholders. In its initial response, ESPO first of all expressed its willingness to constructively contribute to the process. For ESPO, the Ports Policy Communication that followed the withdrawal of the Port Services Directive still forms a good framework for action. The main added value of a new ports package would lie in elaborating certain parts of that Communication, notably where it concerns enhancing the level playing field, creating greater transparency and striking a balance between investment continuity and market openness. In that respect, ESPO continues to favour non-legislative measures and instruments. These match better with the diversity of European ports and would be proportional to the already competitive nature of the ports industry. Clear guidance will help responsible governments, port authorities and service providers to function within the European framework. Meanwhile, the Commission has already started a number of preparatory studies, notably on dock labour, technical-nautical services (in particular pilotage exemption certificates) and State aid. The latter study is being carried out on behalf of DG Competition. The results of these studies are expected for spring Finally, the long-announced social dialogue on ports is also expected to take off in the near future. The formal request to set up the sectoral dialogue has been sent to the European Commission early 2011 and the Commission responded with a request for information to verify the representativeness of the parties concerned. During the past year, ESPO had a number of consultative meetings with the services of DG Markt on their initiative to create a new horizontal instrument on service concessions and its application to the port sector. It is a fact that contractual relationships between port authorities and terminal operators in Europe are varied in nature. Rather than getting in a legalistic dispute about the definition of concessions, ESPO prefers to follow the principle that fairness and transparency obligations must always apply when port authorities decide to entrust a third party with a portion of port land for the provision of cargo-handling services. In this context, ESPO believes first of all that the pragmatic approach taken in the Ports Policy Communication should continue to prevail. It recognises the discretionary powers of port authorities in setting selection criteria and specifies that transparency obligations must only apply where they matter, i.e. in case there is a sufficient connection with the functioning of the internal market. Secondly, ESPO agrees that incumbent terminal operators should not have an unconditional and automatic right of prolongation. Contract durations have to be limited and proportional to depreciation, allowing a reasonable return on investment, but maintaining at the same time a risk inherent in exploitation. However, ESPO believes that if an incumbent operator is performing well and commits itself to continued investments, there should be scope for prolonging its agreement with the port authority. ESPO concretely recommends that prolongation options should be anticipated in the original agreement and that arbitrary modifications should be avoided. In May this year, ESPO published a new version of its Fact-Finding Report on port governance. The report was based on an extensive survey among port authorities and was presented during the ESPO Annual Conference in Cyprus. The Fact-Finding Report provides an overview of the objectives and functions of European port authorities, their institutional frameworks and financial capabilities. The report clearly demonstrates that most port authorities in Europe essentially see themselves as facilitators, both towards the business community and societal stakeholders. The institutional framework is crucial in enabling port authorities to play this role to the fullest extent. Differences in this respect are mainly regionally determined, with port authorities in southern Europe being typically more limited in their autonomy. Finally, in November 2010, the second ESPO Award on Societal Integration of Ports was given to the Port of Helsinki for its project Port as Part of the City. The port authority was awarded thanks to its determination to maintain port activities in the city centre, thus sustaining the maritime identity of Helsinki. The Jury was also impressed by the port s continuous interactive dialogue with local community stakeholders to achieve this goal and the port authority s investments in shore-side electricity, waste reception facilities and other ways to integrate port activities sustainably within the urban environment. P 7


9 When a container is transported from Gdansk to Antwerp by lorry, then that container remains within the EU and the goods do not have to be customs-cleared on arrival or departure. However, when you ship the same container from Gdansk to Antwerp, you first have to clear the goods on departure and then again on arrival, as if that container has left the EU. That is to the detriment of coastal transport and I think the Commission is right in wanting to rectify this disadvantage. Dirk Sterckx, former MEP
10 2. Intermodal Transport and Logistics The beginning of 2011 was marked by the publication of the Commission s Transport Policy White Paper. It consists of a roadmap of 40 concrete initiatives for the next decade to build a competitive transport system that will increase mobility, remove major barriers and stimulate growth and employment. At the same time, the proposals aim to dramatically reduce Europe s dependence on imported oil and cut transport carbon emissions with 60% by To meet this goal, the Commission wants to achieve a ban on conventionally-fuelled cars in cities, 40% use of sustainable low carbon fuels in aviation, at least 40% cut in shipping emissions and a 50% shift of medium distance intercity passenger and freight journeys from road to rail and waterborne transport. For seaports, the White Paper announces initiatives in the field of infrastructure, services, financing, safety and security. Initiatives for infrastructure concern the integration of ports into the Trans-European Transport Networks (TEN-T). The Commission expects that the multimodal TEN-T core network will be fully functional by 2030, with a high quality and capacity network by 2050 and a corresponding set of information services. By that time all core seaports should be sufficiently connected to the rail freight network and, where possible, to the inland waterway system. On infrastructure generally, the Commission wants to streamline procedures for projects of overriding European interest in order to ensure reasonable time limits to complete the whole cycle of procedures, to ensure a communication framework that is in line with the project implementation and to foresee integrated planning which takes environmental issues into account in early stages of the planning procedure. As regards modal share, the Commission expects that, for distances over 300 km, 30% of road freight shifts to other modes such as rail or waterborne transport by 2030, and more than 50% by To facilitate this, the Commission confirmed its ambition to complete the internal market for shipping through the development of a Blue Belt and corresponding Blue Lanes in ports. The European Maritime Safety Agency (EMSA) launched a Blue Belt pilot project in May with the overall objective to facilitate vessel operations on intra-eu trading routes. The pilot project provides local customs authorities with vessel voyage information supplied by the EMSA-operated SafeSeaNet. Upon successful assessment of the pilot project, due at the beginning of 2012, existing procedures may be reviewed and adjusted in favour of a permanent blue belt reporting system. ESPO called for the involvement of port authorities in the project and is contributing to the evaluation of the pilot impact. ESPO expects that the Blue Belt pilot will bring changes to procedures in order to ease administrative burdens for intra-eu trade. The White Paper also outlines a timetable for the internalisation of external costs. In particular, in the longer term (2016 to 2020), the Commission plans measures to internalise costs for local pollution and noise in ports. ESPO believes that a policy framework ensuring that prices applied by service providers reflect all costs, both internal and external, would theoretically favour more environmentally-friendly transport modes such as short-sea shipping, rail and inland navigation. However, pricing is far from being the only factor which determines the choice of a transport mode. A cost-recovery system for externalities for all modes of transport should therefore be integrated in a broader approach, together with the creation of an integrated transport network, administrative simplification and harmonisation and the earmarking of revenues for investment in sustainable infrastructure projects. For ESPO, any initiative leading to increased transport costs should be approached with care and ensure that the result is in the end not counterproductive to Europe s overall competitiveness and more in particular to environmentally friendly transport modes such as waterborne transport. P 9
11 In February this year, the Commission presented a methodology paper for the planning and implementation of the new TEN-T policy. The paper sets out the basic principles for the development of the comprehensive and core network. In its response to the methodology paper, ESPO reiterated its support for the dual layer approach that the Commission proposed earlier. This approach consists of the priority development of a core infrastructure network that is based on a broad underlying comprehensive network. The core network would be based on a selection of nodal points, of which seaports form an essential component. For ESPO, the selection criteria for ports should allow the core network to be futureoriented and be sufficiently robust to anticipate future needs and trends for the next 10 to 20 years. Ports in the core network should have potential for decarbonisation and limitation of external costs. They should also have a gateway function linking the main EU markets with the rest of the world, connect between maritime and land-based networks, be responsive to market needs and be reliable. There needs to be a good spread of core network ports around Europe but, on the other hand, a degree of consolidation is necessary to collect positive economies of scale, also in terms of sustainability. The key challenge in the design of the core network is to find an appropriate balance between these two principles. ESPO sees the review of the TEN-T guidelines also as a good opportunity to review the position of Motorways of the Sea, integrating it as the maritime section of the core network. Motorways of the Sea should no longer be seen as port-to-port connections but as services connecting hinterlands. The actual proposal for the guidelines is expected for October 2011, together with the proposal for the financial framework. Earlier this year, ESPO and EFIP developed a common position paper on EU rail policy, concentrating mainly on the recast of the First Railway Package. The paper identifies the main challenges and concerns European maritime and inland ports are facing today regarding the functioning of European railways. Among these features the improvement of rail links to and from port areas, which should be optimised to guarantee a non discriminatory access for all railway undertakings to the port area. Improving these links is an important element in completing the TEN-T network. Other challenges that need to be addressed relate to the national focus of railways, the lack of demand-driven investments in rail freight infrastructure, the preferential treatment of incumbent undertakings, opaque and unfair pricing regimes and the low reliability levels for non-prescheduled rail freight trains. For ports, there is a clear sense of urgency in achieving a single European railway network which will help guaranteeing an efficient use of existing railway capacity. ESPO and EFIP call for the removal of remaining legal, technical and political barriers without further delay. Prior to the autumn meeting of the Intermodal and Logistics Committee, ESPO organised an internal workshop on EU customs policy. The aim was to identify which role, if any, port authorities can take on the development of E-Customs, the Modernized Customs Code and its implementing provisions and on administrative simplification in general. The workshop also compared views of terminal operators, port community system operators and ship owners. P 10
12 3. Sustainable Development Since 1 January 2011, EcoPorts officially integrated within the ESPO structure. As from that moment, ESPO has been the party responsible for the management of the EcoPorts network of ports and the dissemination of the well established EcoPorts tools Self Diagnosis Methodology (SDM) and Port Environmental Review System (PERS) within Europe and in neighbouring countries. As a result, the EcoPorts tools are now available to the whole ESPO membership and the trends to date clearly demonstrate an increased interest of ports in joining EcoPorts and using the tools through the new online gateway at The integration of EcoPorts within ESPO aims towards extending the progress achieved by the sector on port environmental management through the guiding principles of ports sharing experiences and voluntary self regulation. In line with the same principles, ESPO is working on updating its Environmental Code of Practice which was last reviewed back in The new ESPO Green Guide will be re-establishing the vision on sustainability and will be identifying common ways for implementing environmental ambitions. The Guide will be examining the instruments that are commonly available in the disposition of port authorities. The aim is to develop a common approach towards responsible action, without losing sight of the diversity of ports, their competences and their abilities. The main environmental issues that will be addressed within the Guide are: air quality, energy consumption and climate change, noise, waste and water management. The first outcomes of the work were presented by representatives of the ESPO Sustainable Development Committee during the Greenport Congress in Hamburg, which was held in September this year. They were very well received by the participants. The ESPO Green Guide is expected to be published mid Further in relation to port sector voluntary initiatives, substantial progress has been achieved this year with the Environmental Ship Index (ESI), which is one of the major projects under the World Port Climate Initiative (WPCI) umbrella. Designed by a group of major European ports, and under the coordination of the International Association of Ports and Harbours (IAPH), the index addresses the environmental performance of ships in terms of the emission of major air pollutants (NOx and SOx) and CO2. Ships voluntarily provide their performance data to the ESI website while port authorities voluntarily provide incentives to reward the cleaner ships based on their ESI score. ESPO continues its support and facilitation towards the WPCI projects, endorsing all technical developments and having an informative and disseminative role. Ship exhaust emissions have been high on the political agenda during the course of the year. On 15 July, the European Commission adopted a proposal for amending Directive 1999/32/EC on the sulphur content of marine fuels. The amendment mainly aligns the Directive with the latest IMO provisions, incorporating those in EU law. Under the proposals, the maximum permissible sulphur content of maritime fuels used in sensitive areas (Sulphur Emission Control Areas) will fall from the previous level of 1.5 % to 0.1 %, as of 1 January Other areas are to achieve a cut from 4.5 % down to 0.5 % by 1 January Recognising the challenging nature of the new limits and in order to foster sustainable and competitive shipping, the Commission will develop, in 2012, a series of medium and long-term measures within the framework of a Sustainable Waterborne Transport Toolbox. ESPO is following closely the developments in this field and the ongoing political process. P 11


13 Air pollution does not stop at borders. Land sources have been subject to the attention of regulators for a while, and the time has now come for the maritime sector to deliver its fair share, all the more so as the impacts on air quality are felt far beyond coastal areas. Environment Commissioner Janez PotoČčnik
14 Also in July, the International Maritime Organisation (IMO) adopted mandatory measures to reduce emissions of greenhouse gases (GHGs) from international shipping. The agreement represented the first ever mandatory global GHG reduction regime for an international industry sector. The European Commission congratulated IMO on the adoption of the Energy Efficiency Design Index, however it is not certain whether this may stop unilateral EU action altogether. The Commission has for a while been assessing the impact of regional measures such as mandatory slow steaming through the application of speed limits, the introduction of a bunkering levy, and the introduction of an emission trading scheme in view of fulfilling its international commitments for carbon emissions reduction. The Commission is expected to make a formal recommendation by the end of In addition, the European Commission presented in April this year a proposal to amend its Directive on taxation of energy products and electricity. ESPO particularly welcomed the provision to exempt shoreside electricity from taxation. Together with the European Shipowners Association ECSA, ESPO had lobbied for such a tax exemption. Finally, in the field of sustainable port development, the Commission s guidelines on the implementation of Birds and Habitats Directives in estuaries and coastal zones were published on 15 March this year. The guidelines make particular reference to port development and dredging and are accompanied by a Commission working paper which places the recommendations in a policy context. ESPO welcomed the publication of the guidelines and the accompanying working paper. In particular, ESPO expressed its satisfaction about the preparatory process, which was based on a constructive dialogue with EC services and stakeholders. P 13


15 The simplification of administrative procedures for maritime transport is an important step, not only because it will reduce the costs of maritime transport, which is used to deliver almost 40% of goods within the Internal Market, but also because maritime transport is a cleaner and safer form of transport Siim Kallas, Commission Vice-President responsible for transport
16 4. Marine Affairs and Security The long pending process of reviewing Directive 2000/59/EC which regulates the provision and use of port reception facilities for ship-generated waste and cargo residues got a new boost in spring this year. As part of the ongoing impact assessment, the Commission launched a stakeholder consultation that ran from July till September. The aim of the impact assessment is to identify possible improvements in the implementation of the Directive. The main options include minor amendments to the Directive with parallel provision of guidance or a broader legislative reform. ESPO favours the first option. It feels that better implementation of the Directive s provisions can be achieved through better monitoring and enforcing and through the provision of guidance in certain key areas. ESPO is very willing to contribute to the development of specific guidance, liaising with the European Commission, Member States and other stakeholders. The Commission s new Transport Policy White Paper also outlines actions in the field of marine affairs and security. On port services, the Commission plans to review general restrictions for pilotage and establish a framework for the granting of Pilot Exemption Certificates (PECs) in EU ports. The process started this year already. A consultation meeting has been organised and a study from the European Commission is about to be assigned, aiming to demonstrate the different applied frameworks for granting PECs in Europe and to analyse the pros and cons of pilotage services and PECs frameworks in terms of safety, environment and cost. ESPO closely follows the developments in this field and will be contributing to the study. In addition, within the White Paper the Commission announced the development of SafeSeaNet as the core system for all relevant maritime information tools needed to support maritime safety and security and the protection of the marine environment from ship-source pollution. The issue of electronic data exchange remains high on the agenda also in relation to the implementation of Directive 2010/65/EU on ship reporting formalities. The Directive requires Member States to transpose it into national regulations by May 2012, while as of June 2015 a single window has to be operational. In the beginning of this year an expert group, bringing together specialists from Member States, was established in order to address challenges related to the single window and also to work towards the implementation of the FAL forms in an appropriate electronic format. ESPO participates as observer in the expert group and will continue following up the progress made in this field. Finally, spring 2011 was marked by the Fukushima nuclear power station accident in Japan. The arrival of the first ships from Japan to European ports raised alarming discussions regarding the safe handling of those ships due to the potential danger of high radioactivity levels. A regulation imposing special conditions governing the import of feed and food originating in or consigned from Japan was published in the Official Journal of the European Union on 26 March. In addition, in several European ports inspections were held on board of arriving ships. P 15

17 The idea of publicly comparing performance of ports is still something of a taboo. In other sectors, for instance aviation and railways, it is quite accepted already to publish performance indicators in an open and transparent manner. Also ports in other parts of the world seem to be embracing a culture of benchmarking. Victor Schoenmakers, Chairman of ESPO
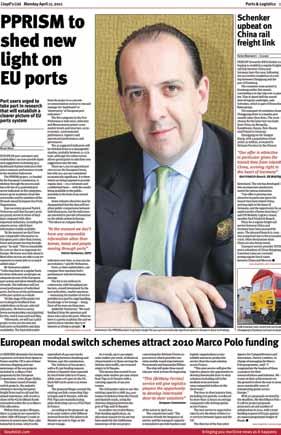
18 5. Economic Analysis and Statistics The PPRISM project, which is developing a series of performance indicators for the European port system, continued its progress during the past working year. The second Work Package, during which internal and external stakeholders assessed the academic pre-selection of indicators, started already in September In a first stage, internal stakeholders (port authorities) were consulted through four PPRISM workshops, combined with the Technical Committee meetings of ESPO. This resulted in a short-list of 39 indicators. As part of the project methodology, a second round of internal assessment of the indicators took place in November and December. In the following phase, launched in January 2011, external stakeholders assessed the proposed indicators. To that end, PPRISM partners prepared an easy-to-use online survey through which external stakeholders could assess those indicators within their own field of expertise or interest. The exercise received numerous responses from business and societal stakeholders. To complete the picture, a meeting with the relevant European stakeholder organisations was held in Brussels on 27 April to gather their views on the project and on the concrete indicators that were currently being assessed. At the annual ESPO Conference in Cyprus, PPRISM was also on top of the agenda. The PPRISM project partners presented the interim results and outlined the development of what is expected to be the outcome of the project, a European dashboard on port performance. With PPRISM, ESPO intends to create a culture of performance measurement and reporting in the sector which today is far from being general practice. As a first step in this learning process, PPRISM is not looking at the performance of individual ports and terminals, but focuses mainly on the performance of the port system as a whole. Work Package 2 resulted in a shortlist of fourteen indicators. Work Package 3, which started in May, aims to test practical implementation requirements for the shortlist of indicators through a European-wide pilot project. Around 400 port authorities associated with ESPO received end of July a user-friendly form with data requirements for the selected indicators, to be completed by 15 September. The pilot was conceived as a crucial test for the actual feasibility of the selected indicators and for data collection at European level. The process is expected to identify data comparability issues and it will allow to further refine calculation methods, data collection procedures and analysis of the indicators. Addressing such problems at this preliminary stage will enable the smooth set-up of a European Port Sector Dashboard once PPRISM is concluded. The last Work Package, which started in September, will indeed provide a concrete proposal on how to set up and articulate the Dashboard, presenting recommendations on its organisational, process-related and financial characteristics. On 19 September, a workshop on port performance measurement was organised by PPRISM partners in cooperation with the Commission to present the project s progress to the Commission services and Member States representations. PPRISM received good appraisal and gained support for its continuation. P 17


19 Cruise lines obviously want premium berthing locations near the city centre. On the one hand this helps in re-establishing a maritime atmosphere in port cities, but on the other hand it creates challenges on air quality, noise, congestion and security. Eeva Hietanen, Chairman of the ESPO Passenger Committee P 18
20 6. Passengers During its first year of operation, ESPO s newly established Passenger Committee focused on the implementation of the ship passenger rights Regulation, which was published in December last year and which will take effect by the end of The Regulation covers the rights of passengers when travelling by sea and inland waterway. Among these rights is the right to information or compensation in case of delay or cancellation of a journey. In addition, the new rules also offer people with a disability or reduced mobility protection when travelling by water. ESPO is concretely monitoring the implementation process in Member States and may develop further guidance to its cruise and ferry ports. The Committee is furthermore developing a policy on the city-port interface. This is particularly crucial for ferry and cruise activities, which are often located close to city centers. The main emphasis will be on operational aspects, such as berth allocation systems, and externalities, mainly emissions, noise and waste. These are being developed in close relation with the Sustainable Development Committee. Other topics on the agenda include administrative procedures and border controls. The Committee maintains a close relation with the cruise port organisations MedCruise and Cruise Europe, as well as with the European Cruise Council (ECC). ESPO was instrumental in setting up the first ECC Port Summit, which was held in Brussels in June this year. The event focused both on operational and strategic aspects, addressing ship-shore interface issues, including berthing requirements and the use of waste reception facilities. The ECC Port Summit was attended by senior executives of global cruise line operators and directors of the principal European cruise ports. P 19
21 7. Overview of ESPO Activities in the Period Events organised, co-organised or supported: ESPO 2010 AGM and Award Ceremony Brussels, 9 November 2010 GreenPort Logistics Venice, February 2011 AAPA-ESPO Trans-Atlantic Port Seminar Washington DC, 23 March 2011 ESPO 2011 Conference Optimising Port Performance and Reviewing Port Policy Limassol, 5-6 May 2011 GreenPort Congress Hamburg, September 2011 Publications: ESPO 2010 Award Brochure November 2010 ESPO Port Governance Fact-Finding Report May 2011 ESPO November 2011 Policy input: Contribution to the EC Consultation on the Future TEN-T Policy September 2010 Contribution to the EC Consultation on Service Concessions September 2010 Response to the EC Staff Working Paper on TEN-T Planning and Implementation Issues March 2011 ESPO-EFIP Joint Position Paper on the Review of the First Railway Package May 2011 Response to the EC Transport Policy White Paper July 2011 Information on the above events, publications and policy statements can be found on the ESPO website: in particular under the sections Events, Publications and Policy Papers. P 20

22 8. ESPO Structure and Membership ESPO membership consists of the port authorities, port administrations and port associations of the seaports of the European Union. The organisation is furthermore open to observer members from countries neighbouring the EU. The membership structure is organised on national level and finds its reflection in the General Assembly of the organisation where each EU member country has three official delegates (and in some instance official proxies or alternates) with voting right. Non-EU countries have one observer delegate each. The General Assembly sets the overall policy of the organisation and meets twice a year. It elects the Chairman and two Vice-Chairmen of ESPO. For the period , ESPO is chaired by Victor Schoenmakers (The Netherlands), assisted by Vice-Chairmen Manuel Gómez Martín (Spain) and Julian Skelnik (Poland). The General Assembly mandates the daily policy-making of the organisation to the Executive Committee which consists of one representative per EU member country and a number of observers. It meets about five times a year. A series of Technical Committees provide technical recommendations to the Executive Committee on specific subjects which fall within their scope of competence. There are seven standing committees, dealing with port governance, intermodality and logistics, sustainable development, marine affairs and security, economic analysis and statistics, passengers and labour and operations. In addition, a horizontal advisory committee for legal matters works on an ad-hoc basis. The ESPO Secretariat is responsible for the overall coordination of the organisation s activities, including policy advice, communication, representation and administrative management. The Secretariat is based in Brussels and consists of Patrick Verhoeven (Secretary General), Isabelle Ryckbost (Senior Advisor), Martina Fontanet and Antonis Michail (Policy Advisors), Cécile Overlau (Events and Office Manager, PA), Ombeline d Hollander (Office Assistant), Daniëlla Arbyn (Communications Assistant) and Jeanette Voosen (Consulting Accountant). ESPO also runs the secretariat of EcoPorts and is holding a joint office with the European Federation of Inland Ports (EFIP). P 21

23 P 22

24 P 23


25 P 24


26 P 25
27 Overview of ESPO Membership Country National Port Body General Assembly Representative Executive Committee Representative Eddy Bruyninckx (Port of Antwerp) Belgium none Joachim Coens (Bruges-Zeebrugge Port Authority) Kate Verslype (Port of Ghent) Daan Schalck (Ghent Port Authority) Georgi Genchev (Bulgarian Ports Infrastructure Company) Bulgaria Bulgarian Ports Infrastructure Company Miroslav Milanov (Bulgarian Ports Infrastructure Company) Evgeniy Moskov (Bulgarian Ports Infrastructure Company) Stefan Neychev Stefan Neychev (Bulgarian Ports Infrastructure Company) Anthia Klerides (CPA) Cyprus Cyprus Ports Authority (CPA) Yiannakis Kokkinos (CPA) Demetris Phellas (CPA) Yiannakis Kokkinos Chrysis Prentzas (CPA) Tom Elmer Christensen (Danish Ports) Denmark Danish Ports Uffe Steiner Jensen (Danish Ports) Bjarne Mathiesen (Port of Aarhus) Tom Elmer Christensen Peter Jens Peters (Associated Danish Ports) Ain Kaljurand (Port of Tallinn) Estonia none Allan Kiil (Port of Tallinn) Alan Kiil Sven Ratassepp (Port of Tallinn) Markku Mylly (Finnish Port Association) Finland Finnish Port Association Henry Lindelöf (Finnish Port Association) Markku Mylly Heikki Nissinen (Port of Helsinki) Geoffroy Caude (UPF) France Union des Ports de France (UPF) Laurent Castaing (Grand Port Maritime du Havre) Philippe Deiss (Grand Port Maritime de Rouen) Geoffroy Caude Patrick Fourgeaud (CCI de Calais) Bettina Linkogel (Freie Hansestadt Bremen) Burkhard Müller (Ministry of Economy, Work and Transport - Lower Saxony) Germany none Jens Zingler (Ministry of Economy - Mecklenburg- Vorpommern) Bernhard Zampolin Bernhard Zampolin (Hamburg Port Authority) Bernd Unger (Ministry for Economy, Labour and Transport Schleswig Holstein) George Anomeritis (Piraeus Port Authority) Greece Hellenic Ports Association (ELIME) Stylianos Aggeloudis (Thessaloniki Port Authority) George Anomeritis Kostas Platikostas (Patras Port Authority) Eamonn O'Reilly (Dublin Port) Ireland Irish Ports Association Brendan Keating (Port of Cork Company) Enda Connellan Enda Connellan (Irish Ports Association) Francesco Nerli (Assoporti) Italy Associazione Porti Italiana - Assoporti Paolo Ferrandino (Assoporti) Francesco Nerli NN Irina Gorbatikova (Freeport of Riga Authority) Latvia none Leonids Loginovs (Freeport of Riga Authority) Leonids Loginovs Vladimirs Makarovs (Freeport of Riga Authority) P 26
28 Country National Port Body General Assembly Representative Executive Committee Representative Eugnieus Gentvilas (Klaipeda State Seaport Authority) Lithuania none Viktoras Lukocevicius (Klaipeda State Seaport Authority) Eugnieus Gentvilas NN Charles Abela (Transport Malta) Malta Transport Malta Jason Bongailas (Transport Malta) David Bugeja David Bugeja (Transport Malta) Dertje Meijer (Port of Amsterdam) The Netherlands none Hans Smits (Port of Rotterdam) David Moolenburgh (Zeeland SeaPorts) Wilko Tijsse Claase (Port of Amsterdam) Ingvar M. Mathisen (Port Authority of Bodo) Norway Norwegian Ports Rune Mjös (Norwegian Ports) Rune Mjös Dag Sem (Port of Oslo) Janusz Jarosinski (Port of Gdynia) Poland none Jaroslaw Siergiej (Port of Szczecin-Swinoujscie) Julian Skelnik (Port of Gdansk) Ryszard Strzyzewicz (Port of Gdansk) Portugal APP - Association Ports of Portugal João Matos Fernandes (APP) Lidia Sequiera (APP) NN Aurelian Andrei Popa (National Company Maritime Ports Administration SA Constantza) Romania none NN Aurelian Andrei Popa NN Tomaz Jamnik (Luka Koper) Slovenia Luka Koper Boris Jerman (Luka Koper) Boris Jerman NN Fernando Gonzales Laxe (Puertos del Estado) Spain Puertos del Estado Ramón Gomez-Ferrer Boldova (Port Authority of Valencia) Manual Morón (Port of Algeciras Bay) Manuel Gómez Martín (Puertos del Estado) Mikael Castanius (Ports of Sweden) Sweden Ports of Sweden Magnus Karestedt (Port of Göteborg) Mikael Castanius Lennart Pettersson (Copenhagen Malmö Port) Richard Bird (UK Major Ports Group) United Kingdom British Ports Association / UK Major Ports Group Paul Davey (Port of Felixstowe) Martin Putman (Portsmouth Commercial Port) Richard Bird and David Whitehead (alternate) David Whitehead (British Ports Association) Observer Members Albania Port of Dürres Emanuela Hysenllari (Port of Dürres) Croatia Croatian Ports Association Bojan Hlaca (Port of Rijeka Authority) Iceland Associated Icelandic Ports Gisli Gislason (Associated Icelandic Ports) Israel Israel Ports Company Dov Frohlinger (Israel Ports Company) Contact details ESPO Secretariat: Treurenberg 6, B-1000 Brussel / Bruxelles Tel Fax mail@espo.be - Web: P 27

29
30
31 9. Market Development in Figures The statistical section of this has been prepared by Prof. Dr. Theo Notteboom of the University of Antwerp / Institute of Transport and Maritime Management Antwerp (ITMMA) with support from Dries Verbraeken and Indra Vonck. The statistics in tonnes are based on figures of Eurostat kindly made available by Mr. Vidar Lund. Container statistics are compiled by ITMMA based on port authority statistics and statistics provided by organisations such as Puertos del Estado, Finnish Ports Association, etc.. Container traffic for selected European ports (in TEU) TEU throughput in selected European ports - ranking based on TEU of 2010 Port Country / /2010 Rotterdam Netherlands 10,783,825 9,743,290 11,145, % 3.4% Antwerp Belgium 8,662,891 7,309,639 8,468, % -2.2% Hamburg Germany 9,737,110 7,007,704 7,895, % -18.9% Bremerhaven/Bremen Germany 5,448,189 4,578,642 4,888, % -10.3% Valencia Spain 3,602,112 3,653,890 4,206, % 16.8% Felixstowe United Kingdom 3,132,000 3,021,000 3,400, % 8.6% Gioia Tauro Italy 3,467,772 2,857,000 2,851, % -17.8% Bahía de Algeciras Spain 3,327,616 3,042,782 2,806, % -15.6% Zeebrugge Belgium 2,209,715 2,328,198 2,499, % 13.1% Marsaxlokk Malta 2,337,000 2,260,000 2,370, % 1.4% Le Havre France 2,488,654 2,240,714 2,358, % -5.2% St-Petersburg Russia 1,983,110 1,343,675 1,931, % -2.6% Barcelona Spain 2,569,549 1,800,662 1,931, % -24.8% Genoa Italy 1,766,605 1,533,627 1,758, % -0.4% Southampton United Kingdom 1,617,000 1,381,000 n.a. La spezia Italy 1,246,000 1,046,063 1,285, % 3.1% Las Palmas Spain 1,312,120 1,007,207 1,113, % -15.2% Marseille France 851, , , % 12.0% Gothenburg Sweden 862, , , % 3.4% Piraeus Greece 433, , , % 99.2% Tilbury United Kingdom 962, ,000 n.a. Leghorn Italy 780, , , % -19.4% Liverpool United Kingdom 672, ,000 n.a. Taranto Italy 786, , , % -26.0% Cagliari Italy 256, , , % 124.5% Constantza Romania 1,380, , , % -59.7% Dublin Ireland 676, , , % -18.0% Naples Italy 481, , , % 10.6% Bilbao Spain 557, , , % -4.6% Lisbon Portugal 556, , , % -7.8% Gdansk Poland 163, , , % 212.7% Gdynia Poland 610, , , % -20.5% Leixos Portugal 450, , , % 7.1% Koper Slovenia 353, , , % 34.7% Aarhus Denmark 458, , , % -2.4% Thamesport United Kingdom 773, ,000 n.a. Kotka Finland 627, , , % -37.1% Venice Italy 379, , , % 3.9% Helsinki Finland 419, , , % -6.4% Sines Portugal 233, , , % 63.9% Santa Cruz Spain 397, , , % -10.1% Málaga Spain 428, , , % -30.5% Klaipeda Lithuania 373, , , % -20.9% Trieste Italy 335, , , % -16.2% Thessaloniki Greece 238, , , % 14.4% Teesport United Kingdom 155, , , % 69.7% Tarragona Spain 47, , , % 438.7% Riga Latvia 207, , , % 22.9% Savona Italy 252, , , % -13.0% Vigo Spain 247, , , % -14.0% Dunkerque France 214, , , % -6.6% Lubeck Germany 214, , , % -8.6% Oslo Norway 190, , , % -2.8% Ravenna Italy 214, , , % -14.6% Hull United Kingdom 262, ,000 n.a. St-Nazaire France 149, , , % 11.4% P 30
32 Port Country / /2010 Copenhagen/Mälmo Denmark/Sweden 194, , , % -21.1% Sevilla Spain 130, , , % 17.0% Tallin Estonia 180, , , % -16.0% Helsingborg Sweden 135, , , % 9.5% Alicante Spain 150, , , % -2.3% Rouen France 142, , , % -8.8% Varna Bulgaria 155, , , % -23.6% Hamina Finland 178, , , % -35.9% Bahía de Cádiz Spain 126, , , % -13.6% Castellón Spain 88,208 67, , % 17.9% Ghent Belgium 61,380 63,657 83, % 35.3% Baleares Spain 176, ,935 78, % -55.5% Amsterdam Netherlands 424, ,084 60, % -85.9% Bordeaux France 55,397 80,018 54, % -1.4% Source: Websites Port Authorities, Puertos del Estado, Finnish Ports Association, etc.. Ports with highest growth in 2010 (compared to 2009) - in % growth Port Country % 2009/2010 Gdansk Poland ,7% Castellón Spain ,0% Sines Portugal ,7% Teesport United Kingdom ,8% St-Petersburg Russia ,7% Riga Latvia ,1% Koper Slovenia ,9% Helsingborg Sweden ,9% Piraeus Greece ,7% Ghent Belgium ,5% Gdynia Poland ,3% La spezia Italy ,9% Bilbao Spain ,8% Klaipeda Lithuania ,1% Sevilla Spain ,6% Aarhus Denmark ,1% Tallin Estonia ,0% Antwerp Belgium ,9% Tarragona Spain ,5% Valencia Spain ,1% Genoa Italy ,7% Rotterdam Netherlands ,4% St-Nazaire France ,1% Kotka Finland ,1% Hamburg Germany ,7% Felixstowe United Kingdom ,5% Rauma Finland ,1% Savona Italy ,1% Alicante Spain ,5% Las Palmas Spain ,5% Helsinki Finland ,0% Ports with highest growth in 2010 (compared to 2009) - in TEU growth Port Country TEU 2009/2010 Rotterdam Netherlands Antwerp Belgium Hamburg Germany St-Petersburg Russia Valencia Spain Felixstowe United Kingdom Bremerhaven/Bremen Germany Gdansk Poland La spezia Italy Genoa Italy Piraeus Greece Zeebrugge Belgium Koper Slovenia Barcelona Spain Sines Portugal Le Havre France Marsaxlokk Malta Gdynia Poland P 31
33 Port Country TEU 2009/2010 Las Palmas Spain Bilbao Spain Teesport United Kingdom Marseille France Riga Latvia Gothenburg Sweden Aarhus Denmark Kotka Finland Klaipeda Lithuania Castellón Spain Helsingborg Sweden Leghorn Italy Helsinki Finland Tarragona Spain Ports with a positive growth in the period Port Country % 2008/2010 TEU 2008/2010 Valencia Spain ,8% Piraeus Greece ,2% Rotterdam Netherlands ,4% Gdansk Poland ,7% Cagliari Italy ,5% Zeebrugge Belgium ,1% Felixstowe United Kingdom ,6% Tarragona Spain ,7% Sines Portugal ,9% Koper Slovenia ,7% Teesport United Kingdom ,7% Marseille France ,0% Naples Italy ,6% Riga Latvia ,9% La spezia Italy ,1% Thessaloniki Greece ,4% Marsaxlokk Malta ,4% Leixos Portugal ,1% Gothenburg Sweden ,4% Sevilla Spain ,0% Ghent Belgium ,3% St-Nazaire France ,4% Castellón Spain ,9% Venice Italy ,9% Helsingborg Sweden ,5% Ports with a negative growth in the period Port Country % Decline 2008/2010 TEU Decline 2008/2010 Hamburg Germany ,9% Constantza Romania ,7% Barcelona Spain ,8% Gioia Tauro Italy ,8% Bremerhaven/Bremen Germany ,3% Bahía de Algeciras Spain ,6% Amsterdam Netherlands ,9% Kotka Finland ,1% Taranto Italy ,0% Las Palmas Spain ,2% Antwerp Belgium ,2% Leghorn Italy ,4% Málaga Spain ,5% Le Havre France ,2% Gdynia Poland ,5% Dublin Ireland ,0% Baleares Spain ,5% Klaipeda Lithuania ,9% Hamina Finland ,9% Trieste Italy ,2% St-Petersburg Russia ,6% Lisbon Portugal ,8% Copenhagen/Mälmo Denmark/Sweden ,1% Santa Cruz Spain ,1% Varna Bulgaria ,6% Vigo Spain ,0% Savona Italy ,0% Ravenna Italy ,6% P 32
34 Port Country % Decline 2008/2010 TEU Decline 2008/2010 Tallin Estonia ,0% Helsinki Finland ,4% Bilbao Spain ,6% Lubeck Germany ,6% Bahía de Cádiz Spain ,6% Dunkerque France ,6% Rouen France ,8% Rauma Finland ,7% Aarhus Denmark ,4% Genoa Italy ,4% Oslo Norway ,8% Alicante Spain ,3% Bordeaux France ,4% -797 Liquid bulk traffic for selected European ports (1000 tonnes) Port Country / /2010 BELGIUM Antwerp ,8% 3,8% Ghent ,8% 8,2% Zeebrugge ,0% -0,8% TOTAL SELECTED PORTS ,6% 3,6% BULGARIA Burgas ,2% -16,0% Varna ,4% 14,8% TOTAL SELECTED PORTS ,5% -13,5% CROATIA Bakar ,9% 13,6% Omišalj ,7% -10,1% Ploce ,2% -29,3% TOTAL SELECTED PORTS ,7% -7,1% CYPRUS Dekeleia (Dhekelia) ,3% -4,6% Larnaca (Larnaka) Oil Terminal ,0% -1,5% Vasiliko (Vasilico) ,4% 23,5% TOTAL SELECTED PORTS ,3% 5,2% DENMARK Aabenraa ,2% -54,0% Aalborg ,7% -16,7% Århus ,7% -11,3% Esjberg ,7% 4,8% Fredericia (Og Shell-Havnen) ,3% -15,3% Københavns Havn ,9% -42,6% Statoil-Havnen ,9% -9,4% TOTAL SELECTED PORTS ,8% -17,3% ESTONIA Tallinn ,5% 24,1% Vene-Balti ,6% -63,9% TOTAL SELECTED PORTS ,0% 21,1% FINLAND Hamina ,9% 9,5% Kemi ,8% -12,3% Kokkola ,5% 7,2% Kotka ,1% -35,6% Naantali ,5% 0,4% Oulu ,1% 10,7% Pori ,8% -24,4% Sköldvik ,3% -4,8% TOTAL SELECTED PORTS ,4% -3,9% P 33
35 Port Country / /2010 FRANCE Bayonne ,5% -34,4% Bordeaux ,8% -4,3% Brest ,4% 3,1% Dunkerque ,0% -62,3% Fort-de France (Martinique) ,3% 15,1% Guadeloupe (Guadeloupe) ,0% -10,1% La Rochelle ,6% 3,5% Le Havre ,0% -13,4% Lorient ,0% -3,6% Marseille ,0% -12,5% Nantes Saint-Nazaire ,4% -8,8% Port-la-Nouvelle ,7% 7,0% Port Réunion (ex Pointe-des- Galets) (Réunion) ,5% 12,5% Rouen ,1% -2,5% Sète ,4% 29,3% TOTAL SELECTED PORTS ,4% -14,5% GERMANY Bremen ,1% -4,6% Brunsbüttel ,0% -29,0% Bützfleth ,3% 15,3% Emden ,0% 21,9% Hamburg ,9% -9,4% Nordenham ,6% -48,6% Rostock ,3% -1,6% TOTAL SELECTED PORTS ,2% -26,5% GREECE Agii Theodori ,8% 18,3% Eleusina ,2% -38,4% Heraklio ,4% -15,5% Lavrio ,7% -63,5% Megara ,1% -13,7% Perama ,7% 84,2% Piraeus ,7% 477,9% Rhodes n.a. n.a. n.a. Thessaloniki ,9% 5,1% TOTAL SELECTED PORTS ,9% -8,4% IRELAND Bantry Bay ,4% 35,2% Cork ,5% -13,8% Dublin ,6% -7,2% Galway ,1% -18,9% Limerick ,7% -27,8% TOTAL SELECTED PORTS ,3% -10,7% ITALY Augusta ,7% -1,5% Barletta ,0% -31,4% Brindisi ,5% 69,1% Cagliari ,3% -71,0% Catania ,5% 36,9% Civitavecchia ,3% -68,6% Falconara Marittima ,8% -14,6% Fiumicino ,2% -20,1% Gaeta ,9% -10,5% Gela ,5% -15,7% Genova ,2% 4,4% La Spezia ,9% -4,6% Lipari n.a n.a. 1,1% Livorno ,9% -39,2% Milazzo ,4% -19,4% Napoli ,1% 52,9% Ortona ,6% 2,7% Other - Italy Palermo ,3% -1,8% Porto Foxi ,4% -9,0% Porto Torres ,5% -41,1% Portovesme ,6% -75,2% Ravenna ,2% 0,6% Santa Panagia ,3% -18,4% Savona - Vado ,1% -16,2% Taranto ,8% -15,9% Trieste ,9% -5,2% Venezia ,1% -3,7% TOTAL SELECTED PORTS ,0% -9,5% P 34
36 Port Country / /2010 LATVIA Liepaja ,9% -37,7% Riga ,2% 24,4% Ventspils ,0% -21,2% TOTAL SELECTED PORTS ,7% -11,6% LITHUANIA Butinge ,5% -0,6% Klaipeda ,7% -10,5% TOTAL SELECTED PORTS ,4% -6,0% MALTA Malta (Valletta) ,6% 13,7% Marsaxlokk ,4% 54,6% TOTAL SELECTED PORTS ,4% 34,9% NETHERLANDS Amsterdam ,4% 10,3% Moerdijk ,4% -18,5% Rotterdam ,4% 10,3% Terneuzen ,4% 21,6% Velsen/Ijmuiden ,2% -94,6% Vlaardingen ,0% 299,7% Vlissingen ,8% 6,9% TOTAL SELECTED PORTS ,8% 9,9% NORWAY Ålesund 545,3 555, ,699-1,7% 0,3% Bergen ,3% -5,6% Bremanger ,8% 144,3% Florø/Flora ,8% 38,6% Fredrikstad/Sarpsborg ,7% 0,1% Kristiansund N/Grip ,6% -5,5% Molde ,1% 1,1% Oslo ,2% 1,6% Tønsberg/Slagentangen/ Valløy ,9% -8,5% Trondheim/Flakk ,6% 2,2% TOTAL SELECTED PORTS ,1% -1,7% POLAND Gdansk 10608, , ,422 47,9% 39,3% Gdynia ,0% 5,1% Swinoujscie ,0% 65,4% Szczecin ,4% 4,8% TOTAL SELECTED PORTS ,9% 35,1% PORTUGAL Aveiro ,0% 47,0% Leixões ,2% -17,3% Lisboa ,7% 17,6% Setúbal ,7% -33,1% Sines ,7% 3,0% TOTAL SELECTED PORTS ,2% -2,1% ROMANIA Constanta ,6% -53,5% Midia ,4% 117,7% TOTAL SELECTED PORTS ,6% -29,8% SLOVENIA Koper ,2% 0,7% TOTAL SELECTED PORTS ,2% 0,7% SPAIN Algeciras ,2% 12,9% Avilés ,7% 20,9% Barcelona ,2% -4,4% Bilbao ,6% -14,2% Cartagena ,5% -24,8% Castellón ,4% -1,2% Ceuta ,1% -15,4% Ferrol ,9% 17,6% Gijón ,3% -15,8% Huelva ,7% 20,7% La Coruña ,3% 1,8% Las Palmas ,4% -4,0% Motril ,6% -9,7% Palma Mallorca ,9% -15,0% Santa Cruz de Tenerife ,4% -13,0% Tarragona ,7% 2,3% Valencia ,3% -13,4% TOTAL SELECTED PORTS ,3% -3,3% SWEDEN Bergs Oljehamn ,8% 16,3% Brofjorden Preemraff n.a. n.a. n.a. Gävle ,7% -36,8% Göteborg ,3% -1,1% Helsingborg ,9% 1,3% Karlshamn ,2% -14,1% Malmö ,9% 11,3% Nynäshamn (ports) n.a. n.a. n.a. Oxelösund (ports) ,9% -18,2% Skellefteå ,9% 0,0% Stenungsund (Ports) ,1% -10,2% Stockholm ,8% -16,9% Sundsvall ,2% -26,8% Västerås ,0% 4,8% TOTAL SELECTED PORTS P 35
37 Port Country / /2010 UNITED KINGDOM Aberdeen ,1% -5,3% Belfast ,3% -1,7% Bristol ,5% -12,0% Cardiff ,6% -30,3% Clydeport ,3% -19,7% Cromarty Firth ,2% 68,0% Dundee ,5% -0,2% Forth ,0% -11,6% Hull ,5% -30,6% Immingham ,6% -11,2% Kirkwall ,8% -19,0% Liverpool ,0% -8,3% London ,3% -5,9% Londonderry ,8% 16,4% Manchester ,8% -4,6% Medway ,2% 77,4% Milford Haven ,8% 20,2% Newhaven ,7% 106,6% Plymouth ,4% -6,5% River Hull & Humber ,5% 8,7% Southampton ,5% -0,1% Sullom Voe ,5% -22,3% Tees & Hartlepool ,6% -7,6% TOTAL SELECTED PORTS ,1% -2,8% Dry bulk traffic for selected European ports (1000 tonnes) Port Country / /2010 BELGIUM Antwerp ,3% -28,4% Ghent ,9% 1,5% Ostend ,6% -13,9% Zeebrugge ,7% -21,2% TOTAL SELECTED PORTS ,6% -16,7% BULGARIA Burgas ,1% -16,8% Varna ,3% -6,6% TOTAL SELECTED PORTS ,2% -9,4% CROATIA Bakar ,7% -72,9% Ploce ,7% -10,3% Rabac n.a. n.a. n.a. Raša - Bršica ,1% -4,9% Rijeka ,6% -18,9% Split ,0% 7,2% TOTAL SELECTED PORTS ,6% -28,9% CYPRUS Larnaka (Larnaca) ,8% -11,2% Vasiliko (Vasilico) ,0% -47,0% TOTAL SELECTED PORTS ,2% -29,4% DENMARK Aabenraa ,4% -22,5% Aalborg ,6% -11,6% Aalborg Portland (Cementfabrikken Rordal) ,7% -45,8% Århus ,1% -34,8% Asnæsværkets Havn ,8% -60,2% Avedøreværkets Havn ,1% -30,5% Enstedværkets Havn ,4% -47,6% Esbjerg ,0% -12,6% Fredericia (Og Shell-Havnen) ,4% 28,7% Kalundborg ,8% 59,8% Kolding ,2% -21,9% Københavns Havn ,3% -24,0% Køge ,9% 33,6% Nordjyllandsværkets Havn ,5% 10,7% Odense ,2% -34,2% Randers ,9% -28,7% Rønne ,9% -30,3% Studstrupværkets Havn ,5% -31,0% Thyborøn ,3% -57,5% TOTAL SELECTED PORTS ,6% -29,3% ESTONIA Kunda ,1% -0,9% Tallinn ,0% 143,3% TOTAL SELECTED PORTS ,4% 113,1% P 36
38 Port Country / /2010 FINLAND Helsinki ,4% -5,7% Inkoo ,4% -26,6% Inland Ports ,7% -18,6% Kaskinen ,6% -57,5% Kemi ,0% 5,3% Kokkola ,2% 11,5% Kotka ,2% 13,7% Koverhar ,4% -7,6% Loviisa ,7% 42,5% Naantali ,2% 2,2% Oulu ,1% -17,6% Parainen ,7% -36,6% Pietarsaari ,0% -20,9% Pori ,2% 2,6% Raahe ,6% -3,5% Rauma ,1% -43,0% Tornio ,3% 23,9% Uusikaupunki ,1% 20,9% Vaasa ,3% -7,6% TOTAL SELECTED PORTS ,6% -5,9% FRANCE Bayonne ,3% -9,2% Bordeaux ,0% -5,3% Brest ,7% 4,3% Caen ,9% 40,0% Dieppe ,6% -28,5% Dunkerque ,8% -15,4% Guadeloupe (Guadeloupe) ,6% -13,9% La Rochelle ,1% 10,9% Le Havre ,8% -27,2% Lorient ,4% -15,5% Marseille ,6% -16,3% Nantes Saint-Nazaire ,3% -3,6% Port-la-Nouvelle ,5% 11,2% Port Réunion (Réunion) ,8% -1,4% Rouen ,7% 31,5% Sète ,7% -15,5% St Malo ,4% 22,6% TOTAL SELECTED PORTS ,4% -6,3% GERMANY Brake ,7% -8,5% Bremen ,3% -1,2% Brunsbüttel ,6% -44,8% Bützfleth ,7% -20,4% Flensburg n.a. n.a. n.a. Hamburg ,6% -3,0% Kiel ,5% 0,0% Lübeck ,5% -15,6% Nordenham ,7% 34,3% Rostock ,4% 0,6% Wilhelmshaven ,8% -12,8% Wismar ,6% 2,1% TOTAL SELECTED PORTS ,8% -10,1% GREECE Aliverio ,4% -39,5% Almyros (Amaliapoli) Volou ,4% -31,8% Antikyra ,3% 8,3% Chalkida ,9% -56,3% Eleusina ,6% -24,3% Heraklio ,6% -46,6% Igoumenitsa ,5% -66,1% Kavala ,6% 13,0% Larymna ,0% -9,6% Milos Island ,0% -34,5% Thessaloniki ,4% -6,7% Volos ,4% -37,8% TOTAL SELECTED PORTS ,6% -26,8% IRELAND Cork ,1% -11,1% Dublin ,5% -38,4% Limerick ,1% -14,7% Waterford ,6% 5,8% TOTAL SELECTED PORTS ,2% -17,3% P 37
39 Port Country / /2010 ITALY Ancona ,1% -32,8% Augusta ,0% -65,5% Bari ,6% 144,7% Barletta ,3% -21,6% Brindisi ,8% -37,2% Chioggia ,6% -2,6% Civitavecchia ,8% 14,7% Gaeta ,9% -35,5% Genova ,9% -29,8% La Spezia ,2% -24,9% Manfredonia 823 n.a. n.a. n.a. n.a. Marina Di Carrara ,6% -26,4% Monfalcone ,1% -62,5% Oristano ,2% -29,6% Other - Italy n.a. n.a. n.a. Piombino ,6% -39,4% Porto Torres ,0% -0,7% Portovesme ,2% -68,5% Pozzallo ,3% -0,1% Ravenna ,6% -42,4% Savona - Vado ,1% -30,9% Taranto ,8% -37,9% Trieste ,4% -41,5% Venezia ,8% -20,6% TOTAL SELECTED PORTS ,2% -34,9% LATVIA Liepaja ,4% 0,8% Riga ,7% -10,6% Ventspils ,9% 1,8% TOTAL SELECTED PORTS ,9% -6,4% LITHUANIA Klaipeda ,7% 20,8% TOTAL SELECTED PORTS ,7% 20,8% MALTA Malta (Valletta) ,8% -26,2% TOTAL SELECTED PORTS ,8% -26,2% NETHERLANDS Amsterdam ,8% -7,8% Delfzijl/Eemshaven ,1% 11,4% Dordrecht ,8% 112,4% Harlingen ,9% 15,0% Moerdijk ,6% -4,9% Rotterdam ,5% -13,6% Terneuzen ,9% 6,4% Velsen/Ijmuiden ,8% -18,6% Vlissingen ,7% -24,4% TOTAL SELECTED PORTS ,4% -11,5% NORWAY Bergen ,1% 11,9% Brønnøy ,8% -3,9% Drammen ,0% -22,1% Fredrikstad/Sarpsborg ,3% -8,1% Haugesund ,5% -20,1% Kristiansund N/Grip ,9% -19,3% Mo i Rana/Rana ,0% 19,5% Molde ,0% -14,3% Narvik ,6% 20,5% Oslo ,6% -27,2% Other - Norway ,1% 6,0% Porsgrunn ,0% -0,6% Stavanger ,8% -28,2% Trondheim/Flakk ,3% -7,8% Verdal/Levanger ,3% 5,5% TOTAL SELECTED PORTS ,3% 2,6% POLAND Gdansk ,9% 65,1% Gdynia ,4% 11,4% Police ,4% -5,0% Swinoujscie ,5% 15,9% Szczecin ,5% 7,9% TOTAL SELECTED PORTS ,9% 20,9% PORTUGAL Aveiro ,1% 20,4% Leixões ,6% 1,9% Lisboa ,2% -12,0% Setúbal ,2% 11,5% Sines ,4% -31,2% TOTAL SELECTED PORTS ,3% -8,0% ROMANIA Constanta ,8% -8,6% TOTAL SELECTED PORTS ,8% -8,6% SLOVENIA Koper ,6% -35,3% TOTAL SELECTED PORTS ,6% -35,3% P 38
40 Port Country / /2010 SPAIN Algeciras ,4% -7,3% Alicante ,6% -33,1% Almería ,3% -34,5% Avilés ,8% -11,8% Barcelona ,7% 0,8% Bilbao ,3% -15,5% Cádiz ,5% -20,3% Cartagena ,9% -32,6% Castellón ,6% -26,8% Ferrol ,8% -24,0% Gijón ,5% -20,6% Huelva ,2% -17,0% La Coruña ,7% -3,0% Las Palmas ,8% -35,9% Málaga ,8% -42,5% Marín-Pontevedra ,2% 13,4% Palma Mallorca ,8% -12,9% Pasajes ,1% -29,6% Santa Cruz de Tenerife ,5% -39,5% Santander ,4% -22,8% Sevilla ,9% -8,9% Tarragona ,0% -24,1% Valencia ,8% -49,8% TOTAL SELECTED PORTS ,6% -22,5% SWEDEN Gävle ,2% 3,4% Halmstad ,2% -15,2% Helsingborg ,0% 9,0% Karlshamn ,8% -25,1% Köping ,0% -16,1% Luleå ,5% 2,4% Malmö ,5% -20,1% Oxelösund (ports) ,9% 16,5% Skellefteå ,4% -10,4% Stockholm ,9% -19,3% Uddevalla ,9% -27,8% Västerås ,9% -12,7% TOTAL SELECTED PORTS ,7% -3,6% UNITED KINGDOM Belfast ,8% 13,9% Bristol ,7% -46,3% Cardiff ,3% 16,7% Clydeport ,6% -7,7% Forth ,8% -2,4% Fowey ,1% -17,3% Glensanda ,6% -7,7% Hull ,9% -39,7% Immingham ,1% -25,6% Ipswich ,5% 27,6% Liverpool ,5% -16,6% London ,1% -16,5% Londonderry ,5% -20,8% Manchester ,6% -6,4% Medway ,3% -50,1% Newport, Gwent ,1% -61,2% Plymouth ,5% -3,3% Port Talbot ,4% 8,4% River Hull & Humber ,1% -9,4% Shoreham ,9% 15,1% Southampton ,8% 17,2% Tees & Hartlepool ,5% -49,3% Trent River ,4% -35,3% Tyne ,6% -54,5% TOTAL SELECTED PORTS ,9% -22,1% P 39
41 Roro traffic for selected European ports Ro Ro, mobile self-propelled units and other Ro Ro, mobile non-self-propelled units (1000 tonnes) Port Country / /2010 BELGIUM Antwerp ,4% -11,3% Ghent ,1% -7,0% Ostend ,4% -50,0% Zeebrugge ,0% -22,2% TOTAL SELECTED PORTS ,2% -25,0% CROATIA Split ,1% -11,2% TOTAL SELECTED PORTS ,1% -11,2% CYPRUS Lemesos (Limassol) ,6% 0,6% TOTAL SELECTED PORTS ,6% 0,6% DENMARK Århus ,7% -20,7% Esbjerg ,0% -1,6% Fredericia (Og Shell-Havnen) ,0% 16,6% Frederikshavn ,7% -11,6% Gedser ,5% -21,2% Grenå ,7% -9,8% Helsingør (Elsinore) ,3% -9,9% Hirtshals ,6% 14,2% Kalundborg ,3% -18,8% Københavns Havn ,2% -9,5% Køge ,2% -6,3% Rødby (Færgehavn) ,7% -5,1% Rønne ,0% -5,1% TOTAL SELECTED PORTS ,9% -10,0% FINLAND Hamina ,0% -19,5% Hanko ,8% -25,4% Helsinki ,8% -5,7% Kemi ,4% 47,3% Kotka ,5% -55,3% Naantali ,3% -22,2% Oulu ,1% 22,4% Turku ,9% -9,8% Vaasa ,0% -6,7% TOTAL SELECTED PORTS ,4% -13,3% FRANCE Ajaccio n.a. n.a. n.a. Bastia ,2% -55,2% Caen ,9% 3,7% Calais ,4% -3,5% Cherbourg n.a. n.a. n.a. Dieppe n.a. n.a. n.a. Le Havre n.a. n.a. n.a. Marseille ,0% 3,0% Nantes Saint-Nazaire ,5% -15,4% St Malo ,1% -16,2% Toulon n.a. n.a. n.a. TOTAL SELECTED PORTS GERMANY Bremerhaven ,9% -95,2% Cuxhaven ,2% -13,4% Emden ,0% -100,0% Hamburg ,7% -98,8% Kiel ,6% 34,2% Lübeck ,1% -15,9% Puttgarden ,7% -2,1% Rostock ,0% -22,6% Sassnitz ,7% -31,0% TOTAL SELECTED PORTS ,5% -26,4% GREECE Antirio ,3% -69,4% Corfu ,2% -40,6% Heraklio ,9% -9,9% Igoumenitsa ,7% -10,5% Megara ,5% -63,8% Paloukia Salaminas ,8% -62,2% Patras ,3% -18,4% Perama ,8% -62,2% Piraeus ,3% -21,9% Rhodes n.a. n.a. n.a. Rio ,3% -69,4% TOTAL SELECTED PORTS ,2% -36,1% P 40
42 Port Country / /2010 IRELAND Dublin ,1% 4,8% TOTAL SELECTED PORTS ,1% 4,8% ITALY Ancona ,8% -0,4% Bari ,0% 44,0% Brindisi ,9% 10,2% Cagliari ,7% -40,3% Civitavecchia ,2% 10,7% Genova ,8% 25,0% Gioia Tauro 843 n.a. n.a. n.a. n.a. Livorno ,6% 32,3% Messina ,6% 182,2% Monfalcone ,4% -20,4% Napoli ,1% 53,8% Olbia ,4% -28,6% Palermo ,5% 9,8% Piombino ,0% 59,7% Porto Torres ,3% 43,1% Salerno ,7% -26,6% Taranto ,8% 39,9% Trapani 810 n.a. 732 n.a. -9,7% Trieste ,8% 129,4% Venezia ,7% -29,3% TOTAL SELECTED PORTS ,5% 18,2% LATVIA Riga ,2% -31,5% Ventspils ,3% -4,7% TOTAL SELECTED PORTS ,7% -12,4% LITHUANIA Klaipeda ,4% 29,0% TOTAL SELECTED PORTS ,4% 29,0% MALTA Malta (Valletta) ,5% -9,1% TOTAL SELECTED PORTS ,5% -9,1% NETHERLANDS Amsterdam ,3% -64,2% Rotterdam ,0% -10,9% Velsen/Ijmuiden ,3% 76,2% Vlaardingen ,5% -6,4% Vlissingen ,7% -24,3% TOTAL SELECTED PORTS ,9% -11,8% NORWAY Haugesund ,2% -3,1% Kristiansand S ,1% -11,2% Larvik ,1% 56,6% Oslo ,7% -19,1% Porsgrunn, Rafnes, Herøya, Brevik, Skien, Langesund, ,3% -33,4% Voldsfjorden Sandefjord ,0% -17,6% Stavanger, Sola/Risavik, Forus, Dusavik, Mekjarvik ,3% -17,5% TOTAL SELECTED PORTS ,9% -11,1% POLAND Gdansk ,3% -40,1% Gdynia ,2% -18,6% Swinoujscie ,4% 22,6% TOTAL SELECTED PORTS ,6% 2,4% PORTUGAL Setúbal ,0% -27,4% TOTAL SELECTED PORTS ,0% -27,4% SPAIN Algeciras ,0% -31,3% Almería ,1% 3,5% Barcelona ,1% -14,2% Cádiz ,3% -21,7% Ceuta ,7% -12,1% Las Palmas ,0% -4,2% Málaga ,6% 4,1% Melilla ,2% 14,1% Palma Mallorca ,1% -21,1% Pasajes ,9% -19,6% Santa Cruz de Tenerife ,6% -4,0% Santander ,8% 60,1% Tarragona ,1% -50,4% Vigo ,2% -23,7% TOTAL SELECTED PORTS ,2% -13,6% P 41
43 Port Country / /2010 SWEDEN Göteborg ,2% -2,5% Helsingborg ,0% -8,3% Kappelskär ,1% -21,4% Karlshamn ,9% 18,2% Karlskrona ,9% -9,5% Malmö ,0% -31,0% Nynäshamn (ports) n.a. n.a. n.a. Oskarshamn ,6% -2,0% Stockholm ,3% 11,3% Trelleborg ,8% -13,4% Umeå ,2% -17,1% Varberg ,5% -10,0% Ystad ,6% 30,8% TOTAL SELECTED PORTS ,5% -10,2% UNITED KINGDOM Aberdeen ,3% 59,7% Belfast ,2% -1,6% Bristol ,9% -36,2% Cairnryan ,4% -10,9% Dover ,6% -1,5% Felixstowe ,7% -15,1% Fishguard ,7% -25,6% Fleetwood ,3% -27,6% Forth ,3% 362,6% Harwich ,5% -22,6% Heysham ,8% 9,7% Holyhead ,9% -17,0% Hull ,3% -25,6% Immingham ,4% -0,7% Ipswich ,7% 7,2% Larne ,7% -10,6% Liverpool ,8% 7,3% London ,8% 51,1% Medway ,3% -38,0% Milford Haven ,4% -10,7% Newhaven ,3% -24,5% Poole ,7% -54,1% Portsmouth ,9% -13,7% Ramsgate ,1% -13,1% Southampton ,0% -18,3% Stranraer ,6% -14,5% Tees & Hartlepool ,9% -27,6% Tyne ,0% -4,3% Warrenpoint ,7% 25,8% TOTAL SELECTED PORTS ,9% -2,0% General non-containerised cargo traffic for selected European ports Other cargo, not elsewhere specified (1000 tonnes) Port Country / /2010 BELGIUM Antwerp ,0% -34,3% Gent (Ghent) ,4% 3,4% Oostende (Ostend) ,9% 6,0% Zeebrugge ,0% 26,5% TOTAL SELECTED PORTS ,2% -24,9% BULGARIA Burgas ,3% -37,5% Varna ,8% -0,3% TOTAL SELECTED PORTS ,9% -26,8% CROATIA Ploce ,3% 47,5% Rijeka ,7% -9,2% TOTAL SELECTED PORTS ,8% 0,4% CYPRUS Larnaka (Larnaca) ,3% -24,9% Lemesos (Limassol) ,8% -32,2% TOTAL SELECTED PORTS ,3% -30,1% DENMARK Aalborg ,9% -20,5% Århus ,4% -55,6% Avedøreværkets Havn ,2% 103,3% Esbjerg ,8% -27,7% Fredericia (Og Shell-Havnen) ,7% -34,2% Grenå ,9% -19,8% Kolding ,6% -27,3% Københavns Havn ,1% 43,2% Køge ,5% 27,6% Odense ,3% -65,1% Randers ,9% 17,9% Vejle ,3% -51,0% TOTAL SELECTED PORTS ,8% -14,6% P 42
44 Port Country / /2010 ESTONIA Kunda ,1% 13,9% Pärnu ,7% 49,7% Tallinn ,2% -90,4% Vene-Balti ,9% 23,4% TOTAL SELECTED PORTS ,6% -53,2% FINLAND Hamina ,5% -31,8% Hanko ,9% 49,3% Helsinki ,9% -33,6% Inkoo ,6% -59,5% Inland Ports ,5% -30,2% Kaskinen ,5% -23,8% Kemi ,1% -8,3% Kokkola ,2% -1,9% Kotka ,6% 58,6% Koverhar ,2% -13,2% Loviisa ,9% -4,0% Naantali ,5% -14,6% Oulu ,4% -7,6% Pietarsaari ,6% 5,7% Pori ,3% -2,1% Raahe ,5% 9,0% Rauma ,7% -9,3% Tornio ,3% 25,5% Turku ,9% -6,7% Uusikaupunki ,2% -20,1% Vaasa ,8% 6,1% TOTAL SELECTED PORTS ,4% 4,0% FRANCE Bayonne ,5% 92,2% Bordeaux ,2% 55,8% Calais ,1% 52,5% Dunkerque ,2% -13,5% La Rochelle ,4% -4,7% Le Havre ,3% -68,1% Marseille ,6% -10,9% Nantes Saint-Nazaire ,1% -16,9% Port-la-Nouvelle ,8% -10,3% Rouen ,7% -30,9% Sète ,2% -14,1% St Malo ,3% -19,4% TOTAL SELECTED PORTS ,9% -6,8% GERMANY Brake ,7% -27,3% Bremen ,3% -20,6% Bremerhaven ,0% 154,8% Cuxhaven ,4% 238,0% Duisburg, Homberg, Walsum ,6% -54,4% Emden ,2% 63,2% Hamburg ,4% 16,6% Kiel ,0% 41,1% Lübeck ,7% 97,1% Nordenham ,0% -71,8% Rostock ,3% 8,9% Wilhelmshaven ,6% -73,4% Wismar ,4% 12,0% TOTAL SELECTED PORTS ,5% 5,0% GREECE Almyros (Amaliapoli) Volou ,2% -5,3% Antikyra ,9% 58,9% Chalkida ,8% -15,4% Corfu ,4% -32,8% Eleusina ,9% -41,3% Heraklio ,4% -22,7% Igoumenitsa ,6% -2,5% Kavala ,3% 8,0% Patras ,0% -34,4% Rhodes n.a. n.a. n.a. Thessaloniki ,9% -10,3% Volos ,4% -39,0% TOTAL SELECTED PORTS ,4% -25,7% IRELAND Cork ,7% -25,2% Drogheda ,0% -81,7% Dublin ,9% -71,2% Limerick ,5% -66,2% Waterford ,4% -58,4% TOTAL SELECTED PORTS ,1% -58,0% P 43
45 Port Country / /2010 ITALY Augusta ,5% -58,4% Bari ,7% -50,7% Barletta ,7% 139,2% Brindisi ,9% 469,2% Cagliari ,5% -97,4% Catania ,1% -54,3% Chioggia ,5% 61,0% Civitavecchia ,7% 322,0% Gaeta ,2% -57,9% Genova ,5% -60,0% La Spezia ,3% -32,9% Livorno ,5% -75,1% Marina Di Carrara ,9% -32,5% Messina ,9% -96,9% Milazzo ,0% -5,8% Monfalcone ,4% -15,9% Napoli ,6% 916,6% Olbia ,3% -86,0% Ortona ,0% -42,6% Piombino ,9% 66,0% Porto Nogaro ,2% -4,6% Pozzallo ,6% 25,4% Ravenna ,4% -7,2% Salerno ,4% 131,5% Savona - Vado ,1% -46,0% Taranto ,9% -42,8% Trieste ,8% 44,0% Venezia ,1% -2,4% TOTAL SELECTED PORTS ,9% -23,9% LATVIA Liepaja ,9% 21,7% Riga ,7% 27,7% Ventspils ,4% 32,2% TOTAL SELECTED PORTS ,9% 26,4% LITHUANIA Klaipeda ,6% -11,1% TOTAL SELECTED PORTS ,6% -11,1% NETHERLANDS Amsterdam ,3% 7,7% Delfzijl/Eemshaven ,1% -12,0% Den Helder ,9% 14,9% Dordrecht ,4% 74,0% Harlingen ,5% 13,9% Moerdijk ,3% 41,8% Rotterdam ,4% 33,5% Terneuzen ,3% -4,8% Velsen/Ijmuiden ,3% -12,6% Vlissingen ,0% -4,9% TOTAL SELECTED PORTS ,3% 12,4% NORWAY Ålesund ,6% 23,6% Bergen ,2% -4,5% Florø/Flora ,0% 17,5% Fredrikstad/Sarpsborg ,5% -19,0% Kristiansand S ,7% -37,0% Kristiansund N/Grip ,6% 3,0% Larvik ,7% -29,2% Måløy ,1% -4,7% Mo i Rana/Rana ,1% -25,8% Oslo ,1% -6,1% Other - Norway ,5% -25,5% Tromsø/Buvik ,4% 0,3% Trondheim/Flakk ,1% -9,0% Verdal/Levanger ,7% -9,3% TOTAL SELECTED PORTS ,5% -13,5% POLAND Gdansk ,8% -20,7% Gdynia ,6% -11,8% Swinoujscie ,3% -6,8% Szczecin ,3% -9,9% TOTAL SELECTED PORTS ,3% -12,4% P 44
46 Port Country / /2010 PORTUGAL Aveiro ,1% -20,9% Leixões ,2% -8,0% Lisboa ,6% -29,2% Setúbal ,1% 4,4% TOTAL SELECTED PORTS ,1% -10,2% ROMANIA Constanta ,0% -25,7% Galati ,9% -16,8% TOTAL SELECTED PORTS ,8% -23,5% SLOVENIA Koper ,1% 12,0% TOTAL SELECTED PORTS ,1% 12,0% SPAIN Algeciras ,7% 16,8% Alicante ,7% -44,5% Almería ,2% -65,5% Avilés ,0% -0,3% Barcelona ,8% -20,0% Bilbao ,7% -10,1% Cádiz ,9% -51,3% Cartagena ,6% -60,2% Castellón ,4% -11,6% Ferrol ,9% -24,6% Gijón ,1% -18,9% Huelva ,3% -37,1% La Coruña ,7% -35,6% Las Palmas ,6% 30,0% Marín-Pontevedra ,5% 8,5% Motril ,3% -25,0% Palma Mallorca ,5% 17,1% Pasajes ,9% -5,3% Santander ,7% -22,6% Sevilla ,4% -16,3% Tarragona ,3% -13,2% Valencia ,7% -7,1% Vigo ,1% -36,7% Villagarcía (de Arosa) ,8% -25,4% TOTAL SELECTED PORTS ,9% -13,0% SWEDEN Gävle ,2% -7,2% Halmstad ,4% -26,6% Helsingborg ,6% 11,8% Husum ,1% -40,5% Jätterssön ,6% 27,2% Kalmar ,3% -34,9% Karlshamn ,2% -37,3% Köping ,8% 10,8% Luleå ,7% 35,3% Oskarshamn ,2% -36,5% Oxelösund (ports) ,3% -13,9% Piteå ,4% -1,7% Skellefteå ,3% -18,8% Sölvesborg ,3% -22,2% Stockholm ,0% -1,8% Sundsvall ,9% -12,7% Uddevalla ,9% 27,6% Umeå ,7% -1,8% Varberg ,8% 11,7% Västerås ,7% 67,4% TOTAL SELECTED PORTS ,2% -11,3% UNITED KINGDOM Aberdeen ,8% -22,3% Belfast ,5% -52,1% Boston ,8% -4,5% Bristol ,0% -6,0% Cardiff ,9% -11,0% Clydeport ,3% -81,2% Dover ,7% 65,6% Forth ,4% -49,2% Goole ,4% -10,1% Great Yarmouth ,7% 23,7% Hull ,7% 8,5% Immingham ,4% -45,4% Ipswich ,6% -23,5% Liverpool ,3% -5,5% London ,3% -30,0% Manchester ,1% 14,8% Medway ,0% -13,8% Newport, Gwent ,9% 3,7% Peterhead ,1% 30,9% Portsmouth ,4% -33,3% River Hull & Humber ,2% 39,2% Shoreham ,7% -20,5% Sunderland ,5% -53,3% Tees & Hartlepool ,5% -67,2% Tyne ,7% -8,8% TOTAL SELECTED PORTS ,3% -25,4% P 45
47
EU transport, seaport and maritime policies
 EU transport, seaport and maritime policies Heading towards the same goal? UN ECE Workshop - Barcelona, 4 October 2007 1 Summary 1. Challenges of the port industry 2. EU policy requirements of seaports
Audit brief. Passenger rights in the EU
 Audit brief Passenger rights in the EU November 2017 1 The European Union (EU) is the only area in the world with a set of rules designed to ensure a minimum level of protection for passengers in the main
PORT OF HELSINKI ALL OF FINLAND WITHIN YOUR REACH
 PORT OF HELSINKI ALL OF FINLAND WITHIN YOUR REACH PORT OF THE ENTIRE FINLAND One of the strengths of the Port of Helsinki is its excellent location at the heart of Finnish production, population and consumption.
Press release. Cruises are still committed to Spanish ports: historic record in 2015 with 8.4 million cruise goers
 "Blue Carpet", the Spain brand as a cruise destination, which gives access to a cultural, gastronomic, scenic and leisure offering with a difference. Cruises are still committed to Spanish ports: historic
The economic impact of ATC strikes in Europe Key findings from our updated report for A4E
 pwc.com The economic impact of ATC strikes in Europe Key findings from our updated report for A4E Prepared for A4E Updates to our analysis since June 2016 Since releasing our Preliminary Findings in June
Press release. Spain consolidates its position as the second European cruise market
 A new historical record could be set in 2015 if the figure of 8 million cruise passengers is exceeded, as expected Spain consolidates its position as the second an cruise market 7.6 million cruise travelers
Context Scope Procurement approach Topics for discussions Timeline. EDA/ESA UAS Workshop May
 Upcoming feasibility studies Context Scope Procurement approach Topics for discussions Timeline EDA/ESA UAS Workshop May 2009 1 Context now 2 Satellite-UAS cooperative missions study Letter of Exchange
International Civil Aviation Organization WORLDWIDE AIR TRANSPORT CONFERENCE (ATCONF) SIXTH MEETING. Montréal, 18 to 22 March 2013
 SIXTH MEETING. Montréal, 18 to 22 March 2013") International Civil Aviation Organization ATConf/6-WP/52 15/2/13 WORKING PAPER WORLDWIDE AIR TRANSPORT CONFERENCE (ATCONF) SIXTH MEETING Montréal, 18 to 22 March 2013 Agenda Item 2: Examination of key
International Civil Aviation Organization ATConf/6-WP/52 15/2/13 WORKING PAPER WORLDWIDE AIR TRANSPORT CONFERENCE (ATCONF) SIXTH MEETING Montréal, 18 to 22 March 2013 Agenda Item 2: Examination of key
Elpida A. Epaminonda. TEN-T and CEF Coordinator Ministry of Transport, Communications and Works
 Elpida A. Epaminonda TEN-T and CEF Coordinator Ministry of Transport, Communications and Works 1 The Trans-European Transport Network (TEN-T) TEN-T: Parts of national networks for all modes of transport
SUSTAINABLE AIR TRANSPORT IN THE FUTURE TEN-T
 SUSTAINABLE AIR TRANSPORT IN THE FUTURE TEN-T This document is part of a series of technical support documents to the green paper "TEN-T : A policy review Towards a better integrated trans-european transport
BRISK Sub-regional risk of spill of oil and hazardous substances in the Baltic Sea
 BRISK Sub-regional risk of spill of oil and hazardous substances in the Baltic Sea Part-financed by the European Union Photo: Nikolay Vlasov / HELCOM Maritime traffic in the Baltic The Baltic Sea today
Shortsea Shipping and Motorways of the Sea in Spain, opportunities and constraints Manuel Carlier President SPC- Spain
 www.shortsea.es Shortsea Shipping and Motorways of the Sea in Spain, opportunities and constraints Manuel Carlier President SPC- Spain Porto 12 March 2015 SSS in Spain Opportunities and constraints SPC
Consumer Council for Northern Ireland response to Department for Transport Developing a sustainable framework for UK aviation: Scoping document
 Consumer Council for Northern Ireland response to Department for Transport Developing a sustainable framework for UK aviation: Scoping document Introduction The Consumer Council for Northern Ireland (CCNI)
BALTIC TO UK COMMERCIAL CONTACTS: Weekly Import Service (+44) KALUM (+44) CARLOS. Revised 11/01/18, version 21
 KALUM (+44) CARLOS. Revised 11/01/18, version 21") BALTIC TO UK COMMERCIAL CONTACTS: CARLOS (+44) 1473 277859 KALUM (+44) 1473 277993 CARLOS ESPANOL-CELIMENDIZ - TRADE DEVELOPMENT MANAGER E: carlos.espanol@msc.com M: (+44) 7484932065 KALUM DUNCAN - INSIDE
BALTIC TO UK COMMERCIAL CONTACTS: CARLOS (+44) 1473 277859 KALUM (+44) 1473 277993 CARLOS ESPANOL-CELIMENDIZ - TRADE DEVELOPMENT MANAGER E: carlos.espanol@msc.com M: (+44) 7484932065 KALUM DUNCAN - INSIDE
Network Management, building on our experience of flow management and network planning.
 Network Management, building on our experience of flow management and network planning. Giovanni Lenti Head of Network Operation Services The European Organisation for the Safety of Air Navigation Air
COMMISSION IMPLEMENTING REGULATION (EU)
") 18.10.2011 Official Journal of the European Union L 271/15 COMMISSION IMPLEMENTING REGULATION (EU) No 1034/2011 of 17 October 2011 on safety oversight in air traffic management and air navigation services
18.10.2011 Official Journal of the European Union L 271/15 COMMISSION IMPLEMENTING REGULATION (EU) No 1034/2011 of 17 October 2011 on safety oversight in air traffic management and air navigation services
ELEVENTH AIR NAVIGATION CONFERENCE. Montreal, 22 September to 3 October 2003
 4/8/03 English, French, Russian and Spanish only * ELEVENTH AIR NAVIGATION CONFERENCE Montreal, 22 September to 3 October 2003 Agenda Item 3: 3.1 : Air traffic management (ATM) performance targets for
MAXIMUM LEVELS OF AVIATION TERMINAL SERVICE CHARGES that may be imposed by the Irish Aviation Authority ISSUE PAPER CP3/2010 COMMENTS OF AER LINGUS
 MAXIMUM LEVELS OF AVIATION TERMINAL SERVICE CHARGES that may be imposed by the Irish Aviation Authority ISSUE PAPER CP3/2010 COMMENTS OF AER LINGUS 1. Introduction A safe, reliable and efficient terminal
Port dues strategies and incentives for cruise line companies for using green port features Jakub Piotrowicz, Maritime Institute in Gdańsk
 Port dues strategies and incentives for cruise line companies for using green Jakub Piotrowicz, Maritime Institute in Gdańsk at the Green Cruise Port Workshop Measurement of regional economic effects caused
Recommendations on Consultation and Transparency
 Recommendations on Consultation and Transparency Background The goal of the Aviation Strategy is to strengthen the competitiveness and sustainability of the entire EU air transport value network. Tackling
Passenger Rights Complaints in 2015
 Passenger Rights Complaints in 2015 19 th October 2016 Commission for Aviation Regulation 3 rd Floor, Alexandra House Earlsfort Terrace Dublin 2 Ireland Tel: +353 1 6611700 Locall: 1890 787 787 Fax: +353
CAA consultation on its Environmental Programme
 CAA consultation on its Environmental Programme Response from the Aviation Environment Federation 15.4.14 The Aviation Environment Federation (AEF) is the principal UK NGO concerned exclusively with the
Barents Euro Arctic Council 11 th Session Rovaniemi, Finland November 2007
 Barents Euro Arctic Council 11 th Session Rovaniemi, Finland 14 15 November 2007 Joint Communiqué The Barents Euro Arctic Council (BEAC) convened its Eleventh Session in Rovaniemi on 14 15 November 2007,
Preparatory Course in Business (RMIT) SIM Global Education. Bachelor of Applied Science (Aviation) (Top-Up) RMIT University, Australia
 SIM Global Education. Bachelor of Applied Science (Aviation) (Top-Up) RMIT University, Australia") Preparatory Course in Business (RMIT) SIM Global Education Bachelor of Applied Science (Aviation) (Top-Up) RMIT University, Australia Brief Outline of Modules (Updated 18 September 2018) BUS005 MANAGING
Preparatory Course in Business (RMIT) SIM Global Education Bachelor of Applied Science (Aviation) (Top-Up) RMIT University, Australia Brief Outline of Modules (Updated 18 September 2018) BUS005 MANAGING
ENVIRONMENT ACTION PLAN
 ENVIRONMENT ACTION PLAN 2015 16 Airservices Australia 2015 This work is copyright. Apart from any use as permitted under the Copyright Act 1968, no part may be reproduced by any process without prior written
Trieste. 11 port in Europe. for total tonnage for rail traffic. port in Italy. port in Italy. oil port in the. for total tonnage.
 Trieste 11 port in Europe th 1 port in Italy st 1 port in Italy st for total tonnage for total tonnage for rail traffic 1 oil port in the st Mediterranean Sea Trieste in the top 20 European ports 1 Rotterdam
There was consensus among the participants that a strong European aviation industry is critical to ensure the right to
 Bruges Declaration Introduction The European aviation industry stands at a crossroads. It is restructuring to face the economic crisis and the growing global competition. The aviation industry is also
Approx. 13,000 merchant ships in transit around EU every day. [Source: SafeSeaNet]
![Approx. 13,000 merchant ships in transit around EU every day. [Source: SafeSeaNet]](/thumbs/76/73271120.jpg "Approx. 13,000 merchant ships in transit around EU every day. [Source: SafeSeaNet]") Approx. 13,000 merchant ships in transit around EU every day 2 [Source: SafeSeaNet] Traffic in the English Channel 3 [Source: SafeSeaNet] Traffic along the Belgian North Sea coast 4 [Source: SafeSeaNet]
Approx. 13,000 merchant ships in transit around EU every day 2 [Source: SafeSeaNet] Traffic in the English Channel 3 [Source: SafeSeaNet] Traffic along the Belgian North Sea coast 4 [Source: SafeSeaNet]
European General Aviation Conference Schonhagen Airport. Martin Robinson CEO AOPA UK Deputy Vice President IAOPA Europe Berlin 15 th May 2006
 European General Aviation Conference Schonhagen Airport Martin Robinson CEO AOPA UK Deputy Vice President IAOPA Europe Berlin 15 th May 2006 Content What is General Aviation & Aerial Work Operations? Who
Terms of Reference: Introduction
 Terms of Reference: Assessment of airport-airline engagement on the appropriate scope, design and cost of new runway capacity; and Support in analysing technical responses to the Government s draft NPS
COMMUNICATION FROM THE COMMISSION TO THE COUNCIL
 EUROPEAN COMMISSION Brussels, 14.10.2016 COM(2016) 652 final COMMUNICATION FROM THE COMMISSION TO THE COUNCIL European Development Fund (EDF): forecasts of commitments, payments and contributions from
Baltic Port Market. BPO Conference Riga, RECIENT FACTS & FIGURES. dr Maciej Matczak
 Baltic Port Market RECIENT FACTS & FIGURES BPO Conference Riga, 3-4.09.2015 Schedule TOTAL CARGO TURNOVER Trends of the last decade 2005-2014 First half of 2015 preliminary results MAIN TYPES OF CARGO
Legal and Institutional Aspects of ATM in Europe. Roderick D. van Dam Head of Legal Service EUROCONTROL
 Legal and Institutional Aspects of ATM in Europe Roderick D. van Dam Head of Legal Service EUROCONTROL EUROCONTROL: European Organisation for the Safety of Air Navigation Coordination and integration -
The PIANC RIS guidelines Edition 4, 2018 Cas Willems (Chairman PIANC WG 125) Smart Atlantis on behalf of Rijkswaterstaat
 Smart Atlantis on behalf of Rijkswaterstaat") The PIANC RIS guidelines Edition 4, 2018 Cas Willems (Chairman PIANC WG 125) Smart Atlantis on behalf of Rijkswaterstaat Jeffrey van Gils (Member of the PIANC WG125) Rijkswaterstaat content Historical
The PIANC RIS guidelines Edition 4, 2018 Cas Willems (Chairman PIANC WG 125) Smart Atlantis on behalf of Rijkswaterstaat Jeffrey van Gils (Member of the PIANC WG125) Rijkswaterstaat content Historical
Regime of.
 The New Inspecton Regime of The Paris MoU www.bimco.org Introduction 2 This guide has been prepared to protect you the crew from unnecessary problems when calling at a port or anchorage within the Paris
EUROCONTROL. Visit of the Transport Attachés. 10 April Frank Brenner. Director General EUROCONTROL
 EUROCONTROL Visit of the Transport Attachés 10 April 2015 Frank Brenner Director General EUROCONTROL One day s traffic EUROCONTROL - Visit of the Transport Attachés - 10 April 2015 2 ATM Today Air Transport
COMMISSION OF THE EUROPEAN COMMUNITIES. Draft. COMMISSION REGULATION (EU) No /2010
 No /2010") COMMISSION OF THE EUROPEAN COMMUNITIES Brussels, XXX Draft COMMISSION REGULATION (EU) No /2010 of [ ] on safety oversight in air traffic management and air navigation services (Text with EEA relevance)
COMMISSION OF THE EUROPEAN COMMUNITIES Brussels, XXX Draft COMMISSION REGULATION (EU) No /2010 of [ ] on safety oversight in air traffic management and air navigation services (Text with EEA relevance)
NATIONAL AIRSPACE POLICY OF NEW ZEALAND
 NATIONAL AIRSPACE POLICY OF NEW ZEALAND APRIL 2012 FOREWORD TO NATIONAL AIRSPACE POLICY STATEMENT When the government issued Connecting New Zealand, its policy direction for transport in August 2011, one
Implementation at National level. Laura Fiumara Gent, 4 July 2018
 1 Implementation at National level Laura Fiumara Gent, 4 July 2018 Legal basis 2 Air passenger rights: Reg. (EC) No 261/2004 Rail passenger rights: Reg. (EC) No 1371/2007 Waterborne passenger rights: Reg.
TAIEX. Institution Building support for Agriculture and Rural Development by Twinning and TAIEX. Institution Building Unit DG Enlargement
 TAIEX Institution Building support for Agriculture and Rural Development by Twinning and TAIEX Institution Building Unit DG Enlargement Our Mission Statement Support beneficiary countries in understanding,
Performance Criteria for Assessing Airport Expansion Alternatives for the London Region
 Performance Criteria for Assessing Airport Expansion Alternatives for the London Region Jagoda Egeland International Transport Forum at the OECD TRB Annual Meeting 836 - Measuring Aviation System Performance:
Position Paper November 2005
 Airport capacity, efficiency and safety in Europe Position Paper November 2005 Submission to the consultation of the European Commission on Airport capacity, efficiency and safety in Europe Submitted by:
Measure 67: Intermodality for people First page:
 Measure 67: Intermodality for people First page: Policy package: 5: Intermodal package Measure 69: Intermodality for people: the principle of subsidiarity notwithstanding, priority should be given in the
GREEN CRUISE PORT (GCP) Sustainable Development of Cruise Port Locations
 Sustainable Development of Cruise Port Locations") GREEN CRUISE PORT (GCP) Sustainable Development of Cruise Port Locations Hans-Ulrich Wolff, GCP Communication Manager April 19th, 2018 Piraeus / Greece GCP Overview (1/3) Basic Information EU Interreg
GREEN CRUISE PORT (GCP) Sustainable Development of Cruise Port Locations Hans-Ulrich Wolff, GCP Communication Manager April 19th, 2018 Piraeus / Greece GCP Overview (1/3) Basic Information EU Interreg
Romanian Joint Booth transport logistic 2019
 Connecting Global Competence Romanian Joint Booth transport logistic 2019 4. 7. Juni 2019 Messe München»www.transportlogistic.de transport logistic - key facts 2017 transport logistic is the world's leading
Traffic Development Policy
 2017-2018 Guidelines Strategy The aims at attracting incremental traffic to Genoa airport through: Point to point connections: development of new direct routes to domestic and international airports, including
MAIS3+ assessment: Current practices around Europe
 MAIS3+ assessment: Current practices around Europe Klaus Machata SafetyCube workshop, The Hague, 24 May 2016 Co-funded by the Horizon 2020 Framework Programme of the European Union 5/31/2016 Data collection
Maritime transport of goods and passengers
 Transport Author: Giuliano AMERINI Statistics in focus 62/2008 Maritime transport of goods and passengers 1997-2006 In 2006, 3 834 million tonnes of goods were handled in the EU-27 maritime ports (3.2%
Adequate information for tourism will help us to:
 1 Adequate information for tourism will help us to: Provide a realistic diagnosis of the baseline situation: Statistics are required to define the characteristics of our destination, the number of tourists
ACI EUROPE POSITION. A level playing field for European airports the need for revised guidelines on State Aid
 ACI EUROPE POSITION A level playing field for European airports the need for revised guidelines on State Aid 16 June 2010 1. INTRODUCTION Airports play a vital role in the European economy. They ensure
Decision Strategic Plan Commission Paper 5/ th May 2017
 Decision Strategic Plan 2017-2019 Commission Paper 5/2017 5 th May 2017 Commission for Aviation Regulation 3 rd Floor, Alexandra House Earlsfort Terrace Dublin 2 Ireland Tel: +353 1 6611700 Fax: +353 1
TRIPS OF BULGARIAN RESIDENTS ABROAD AND ARRIVALS OF VISITORS FROM ABROAD TO BULGARIA IN NOVEMBER 2018
 TRIPS OF BULGARIAN RESIDENTS ABROAD AND ARRIVALS OF VISITORS FROM ABROAD TO BULGARIA IN NOVEMBER 2018 In November 2018, the number of the trips of Bulgarian residents abroad was 426.3 thousand (Annex,
SIAFI Europe 2005 Paris, Passenger Rights: Problems at issue and latest developments (passenger charter, etc.)
") SIAFI Europe 2005 Paris, 19-23.9.2005 Passenger Rights: Problems at issue and latest developments (passenger charter, etc.) by Didier Léautey Senior Adviser UIC Passenger Forum Issues SIAFI EUROPE 19.9.2005-1-
SIAFI Europe 2005 Paris, 19-23.9.2005 Passenger Rights: Problems at issue and latest developments (passenger charter, etc.) by Didier Léautey Senior Adviser UIC Passenger Forum Issues SIAFI EUROPE 19.9.2005-1-
TRAFFIC DEVELOPMENT POLICY 2018
 TRAFFIC DEVELOPMENT POLICY 2018 GUIDELINES Target The Traffic Development Policy aims at ATTRACTING INCREMENTAL TRAFFIC to our airport. The incentive system hereafter exposed is conceived to be a guideline
CABOTAGE GUIDELINES. Hauliers from Croatia are covered by a ban on cabotage until the end of June 2017.
 June 2015 CABOTAGE GUIDELINES Guidelines on the rules on road cabotage in Regulation No. 1072/2009 of the European Parliament and of the Council on common rules for access to the international road haulage
ACTION PLAN FOR THE PERIOD concerning the STRATEGY ON IMPLEMENTATION OF THE FRAMEWORK AGREEMENT ON THE SAVA RIVER BASIN
 Doc. 1S-26-O-11-5/1-2 ACTION PLAN FOR THE PERIOD 2011-2015 concerning the STRATEGY ON IMPLEMENTATION OF THE FRAMEWORK AGREEMENT ON THE SAVA RIVER BASIN April 2011 Table of Contents INTRODUCTION... 5 1.
An overview of Tallinn tourism trends
 An overview of Tallinn tourism trends August 2015 The data is collected from Statistics Estonia, Tallinn Airport and Port of Tallinn. In August 2015, 179,338 stayed overnight in Tallinn s accommodation
Making travel easier and more affordable. easyjet s views on how aviation policy can improve the passenger experience and reduce costs
 Making travel easier and more affordable easyjet s views on how aviation policy can improve the passenger experience and reduce costs Foreword by Carolyn McCall, CEO Contents Fifty years ago, flying was
(Presented by IATA) SUMMARY S
 SUMMARY S") 18/04/2013 DIRECTORS GENERAL OF CIVIL AVIATION-MIDDLE EAST REGION Second Meeting (DGCA-MID/2) (Jeddah, Saudi Arabia, 20-222 May 2013) Agenda Item 7: Aviation Security and Facilitation SECURITY INITIATIVES
18/04/2013 DIRECTORS GENERAL OF CIVIL AVIATION-MIDDLE EAST REGION Second Meeting (DGCA-MID/2) (Jeddah, Saudi Arabia, 20-222 May 2013) Agenda Item 7: Aviation Security and Facilitation SECURITY INITIATIVES
TRIPS OF BULGARIAN RESIDENTS ABROAD AND ARRIVALS OF VISITORS FROM ABROAD TO BULGARIA IN FEBRUARY 2018
 TRIPS OF BULGARIAN RESIDENTS ABROAD AND ARRIVALS OF VISITORS FROM ABROAD TO BULGARIA IN FEBRUARY 2018 In February 2018, the number of the trips of Bulgarian residents abroad was 379.5 thousand (Annex,
TRIPS OF BULGARIAN RESIDENTS ABROAD AND ARRIVALS OF VISITORS FROM ABROAD TO BULGARIA IN OCTOBER 2017
 TRIPS OF BULGARIAN RESIDENTS ABROAD AND ARRIVALS OF VISITORS FROM ABROAD TO BULGARIA IN OCTOBER 2017 In October 2017, the number of the trips of Bulgarian residents abroad was 439.0 thousand (Annex, Table
TRIPS OF BULGARIAN RESIDENTS ABROAD AND ARRIVALS OF VISITORS FROM ABROAD TO BULGARIA IN JANUARY 2018
 TRIPS OF BULGARIAN RESIDENTS ABROAD AND ARRIVALS OF VISITORS FROM ABROAD TO BULGARIA IN JANUARY 2018 In January 2018, the number of the trips of Bulgarian residents abroad was 387.6 thousand (Annex, Table
TRIPS OF BULGARIAN RESIDENTS ABROAD AND ARRIVALS OF VISITORS FROM ABROAD TO BULGARIA IN NOVEMBER 2017
 TRIPS OF BULGARIAN RESIDENTS ABROAD AND ARRIVALS OF VISITORS FROM ABROAD TO BULGARIA IN NOVEMBER 2017 In November 2017, the number of the trips of Bulgarian residents abroad was 417.6 thousand (Annex,
COMMISSION OF THE EUROPEAN COMMUNITIES COMMUNICATION FROM THE COMMISSION. Developing an EU civil aviation policy towards Brazil
 COMMISSION OF THE EUROPEAN COMMUNITIES Brussels, 5.5.2010 COM(2010)210 final COMMUNICATION FROM THE COMMISSION Developing an EU civil aviation policy towards Brazil COMMUNICATION FROM THE COMMISSION Developing
Official Journal of the European Union L 7/3
 12.1.2010 Official Journal of the European Union L 7/3 COMMISSION REGULATION (EU) No 18/2010 of 8 January 2010 amending Regulation (EC) No 300/2008 of the European Parliament and of the Council as far
PRESS RELEASE. Address: Hungary, H-1068 Budapest, Benczúr utca 25.
 PRESS RELEASE Participation of the Permanent Representative of Hungary in Danube Commission, Dr. Ivan Gyurcsík at the 7th ASEM Sustainable Development Dialogue, (11-12 September 2018, Budapest, Hungary)
DESTIMED PROJECT CALL FOR EXPRESSION OF INTEREST FOR THE IMPLEMENTATION OF ECOTOURISM PILOT ACTIONS IN CROATIAN MPAS
 DESTIMED PROJECT CALL FOR EXPRESSION OF INTEREST FOR THE IMPLEMENTATION OF ECOTOURISM PILOT ACTIONS IN CROATIAN MPAS Terms of Reference TABLE OF CONTENTS 1 Background... 3 2 Objectives of the call for
Report on Air Passenger Rights Complaints for the period 1 st January to 30 th June th October 2009
 1 Commission for Aviation Regulation October 2009 Report on Air Passenger Rights Complaints for the period 1 st January to 30 th June 2009 30 th October 2009 Commission for Aviation Regulation 3 rd Floor,
First Meeting of Advisory Committee
 Agreement on the Conservation of Albatrosses and Petrels Interim Secretariat provided by the Australian Government First Meeting of Advisory Committee Hobart, Australia, 20-22 July 2005 Agenda Item No.
Port State Control Commencement of the New Inspection Regime on 1 st January 2011
 Marine Notice No. 02 of 2011 This Marine Notice supersedes Marine Notice No. 13 of 2010 FOR THE ATTENTION OF ALL OWNERS, OPERATORS, MASTERS, AGENTS, PILOTS AND PORT AUTHORITIES Port State Control Commencement
REAUTHORISATION OF THE ALLIANCE BETWEEN AIR NEW ZEALAND AND CATHAY PACIFIC
 Chair Cabinet Economic Growth and Infrastructure Committee Office of the Minister of Transport REAUTHORISATION OF THE ALLIANCE BETWEEN AIR NEW ZEALAND AND CATHAY PACIFIC Proposal 1. I propose that the
JOINT STATEMENT BY THE BARENTS REGIONAL COUNCIL AT THE BEAC 13TH SESSION 11 October 2011, Kiruna
 JOINT STATEMENT BY THE BARENTS REGIONAL COUNCIL AT THE BEAC 13TH SESSION 11 October 2011, Kiruna 1. The Members of the Barents Regional Council (BRC) met in Kiruna on October 11, 2011, for the 4th meeting
Rights of passengers travelling by sea and inland waterway Regulation (EU) 1177/2010
 1177/2010") HELLENIC REPUBLIC MINISTRY OF MARITIME AFFAIRS AND INSULAR POLICY Rights of passengers travelling by sea and inland waterway Regulation (EU) 1177/2010 THE HELLENIC NATIONAL ENFORCEMENT BODY ACTIVITY REPORT
HELLENIC REPUBLIC MINISTRY OF MARITIME AFFAIRS AND INSULAR POLICY Rights of passengers travelling by sea and inland waterway Regulation (EU) 1177/2010 THE HELLENIC NATIONAL ENFORCEMENT BODY ACTIVITY REPORT
Brexit Preparedness seminar on transport. Council Working Party (Article 50 Format) 29/11/2018
 29/11/2018") Brexit Preparedness seminar on transport Council Working Party (Article 50 Format) 29/11/2018 Aviation - Key sectoral aspects to consider Market Access Safety Security Aviation Market Access (1) Issue
Brexit Preparedness seminar on transport Council Working Party (Article 50 Format) 29/11/2018 Aviation - Key sectoral aspects to consider Market Access Safety Security Aviation Market Access (1) Issue
The strategic importance of the Danube for a sustainable development of the region. Transnational pilot-workshop Cross-programme ETC Danube projects
 The strategic importance of the Danube for a sustainable development of the region Transnational pilot-workshop Cross-programme ETC Danube projects Manfred Seitz 28 September 2009 Course of presentation
1/2 July Draft Commission Implementing Regulation amending Regulation (EU) No 1207/2011 (Surveillance Performance and Interoperability SPI)
 No 1207/2011 (Surveillance Performance and Interoperability SPI)") SSC/14/54/5 Agenda Item 4.1 16 June 2014 54 th SINGLE SKY COMMITTEE 1/2 July 2014 Draft Commission Implementing Regulation amending Regulation (EU) No 1207/2011 (Surveillance Performance and Interoperability
SSC/14/54/5 Agenda Item 4.1 16 June 2014 54 th SINGLE SKY COMMITTEE 1/2 July 2014 Draft Commission Implementing Regulation amending Regulation (EU) No 1207/2011 (Surveillance Performance and Interoperability
sailing on the LNG era POSEIDON MED ll
 sailing on the era VENICE IGOUMENITSA PATRA PIRAEUS REVITHOUSSA sailing on the era Poseidon Med II project is a practical roadmap which aims to bring about the wide adoption of as a safe, environmentally
Europe Overnight Deployments
 Celebrity Constellation 12-Night Turkey & Greece Cruise 2016 - Apr. 15 12-Night Greek Isles & Mediterranean Cruise 2016 - Apr. 27 12-Night Italy & Dalmatian Coast Cruise 2016 - May 19 12-Night Greek Isles
International Operations: NATA 2012 Air Charter Summit
 International Operations: NATA 2012 Air Charter Summit Larry Williams Senior Trip Owner Charter Management Blue Team Universal Weather and Aviation, Inc. Agenda Session Objective Discuss current hot topics
IATA Fuel Efficiency Program
 IATA Fuel Efficiency Program IATA Fuel Efficiency Program The program was launched by IATA in 2004 in response to the rising price of fuel. It is focused on supporting the airlines to increase fuel efficiency
Transport Performance and the Data Clubs Approach. Richard Anderson ESRC International Public Service Rankings 13 th December 2005
 Transport Performance and the Data Clubs Approach Richard Anderson ESRC International Public Service Rankings 13 th December 2005 Presentation structure Introduction and history of pubic transport benchmarking
Terms of Reference for a rulemaking task
 Rulemaking Directorate Terms of Reference for a rulemaking task Technical requirements and operational procedures for the provision of data for airspace users for the purpose of air navigation ISSUE 1
Director, External Trade, CARICOM Secretariat. CARICOM Secretariat, Guyana
 THE COMMONWEALTH SECREATARIAT SEEKS APPLICATIONS FOR THE POST OF REGIONAL TRADE ADVISER (RTA) FOR AN ASSIGNMENT WITH THE CARIBBEAN COMMUNITY (CARICOM) SECRETARIAT DATE REQUIRED: December 2014 REPORTING
Maritime ports freight and passenger statistics
 Maritime ports freight and passenger statistics Statistics Explained Data from March 2018. Planned update: January 2019. This article presents the latest statistical data on freight handling and passenger
I. The Danube Area: an important potential for a strong Europe
 Final Declaration of the Danube Conference 2008 The Danube River of the European Future On 6 th and 7 th October in the Representation of the State of Baden-Württemberg to the European Union I. The Danube
ACI EUROPE POSITION. on the revision of. EU DIRECTIVE 2002/30 (noise-related operating restrictions at community airports)
") ACI EUROPE POSITION on the revision of EU DIRECTIVE 2002/30 (noise-related operating restrictions at community airports) 6 SEPTEMBER 2011 EU Directive 2002/30 Introduction 1. European airports have a long
ACI EUROPE POSITION on the revision of EU DIRECTIVE 2002/30 (noise-related operating restrictions at community airports) 6 SEPTEMBER 2011 EU Directive 2002/30 Introduction 1. European airports have a long
Challenges of Implemented MoS
 Challenges of Implemented MoS DANIEL CRIADO Business Development Manager Suardiaz Shipping Group MULTIMODAL LOGISTICS SOLUTIONS Maritime Road Rail Air 1 2 3 4 5 6 7 8 9 10 Shipowner & Maritime Line operator
AD/BR5666/MBI Brussels, 14 December 2017
 AD/BR5666/MBI Brussels, 14 December 2017 IRU Position on the EU Mobility Package technical analysis and recommendations on the revision of the EU rules on Access to the Profession of Road Transport Undertaking
Official Journal of the European Union L 337/43
 22.12.2005 Official Journal of the European Union L 337/43 PROTOCOL on the implementation of the Alpine Convention of 1991 in the field of tourism Tourism Protocol Preamble THE FEDERAL REPUBLIC OF GERMANY,
ANGLIAN WATER GREEN BOND
 ANGLIAN WATER GREEN BOND DNV GL ELIGIBILITY ASSESSMENT Scope and Objectives Anglian Water Services Financing Plc is the financing subsidiary of Anglian Water Services Limited. References in this eligibility
International Civil Aviation Organization ASSEMBLY 38TH SESSION EXECUTIVE COMMITTEE PROPOSED ROADMAP TO STRENGTHEN GLOBAL AIR CARGO SECURITY
 International Civil Aviation Organization WORKING PAPER 20/8/13 Agenda Item 13: Aviation Security Policy ASSEMBLY 38TH SESSION EXECUTIVE COMMITTEE PROPOSED ROADMAP TO STRENGTHEN GLOBAL AIR CARGO SECURITY
ASSEMBLY 36TH SESSION
 International Civil Aviation Organization WORKING PAPER A36-WP/241 18/9/07 English only ASSEMBLY 36TH SESSION EXECUTIVE COMMITTEE Agenda Item 23: Increasing the effectiveness of ICAO REPRESENTATION OF
NEFAB Annual Report 2016
 NEFAB Council #11/WP2 NEFAB Annual Report 2016 Version 1.0 Revision history Version Date Description/Change Author Approved 1.0 08.05.2017 LV 2 Main developments in 2016 NEFAB Strategy Implementation Plan
MEASURING ACCESSIBILITY TO PASSENGER FLIGHTS IN EUROPE: TOWARDS HARMONISED INDICATORS AT THE REGIONAL LEVEL. Regional Focus.
 Regional Focus A series of short papers on regional research and indicators produced by the Directorate-General for Regional and Urban Policy 01/2013 SEPTEMBER 2013 MEASURING ACCESSIBILITY TO PASSENGER
K Line Tariff (Effective as from 1st February to 28th February 2017)
") K Line Tariff (Effective as from 1st February to 28th February 2017) Surcharges are subject to review at any time Bunker Adjustment Factor FEU Asia to Europe USD 40 80 Asia to Mediterranean USD 40 80 Europe
K Line Tariff (Effective as from 1st February to 28th February 2017) Surcharges are subject to review at any time Bunker Adjustment Factor FEU Asia to Europe USD 40 80 Asia to Mediterranean USD 40 80 Europe
Femern Belt Fixed Link
 Femern Belt Fixed Link Impact on Baltic turntable function of Lübeck 5th BeltLogistics Workshop Felix Klingbiel, Vice Head of Marketing & Sales Lübecker Hafen-Gesellschaft mbh Femern Belt, 29 January 2015
ANNUAL TOURISM REPORT 2013 Sweden
 ANNUAL TOURISM REPORT 2013 Sweden Article 3 of Council Decision 86/664/EEC 1 of 22 December 1986 establishing a consultation and cooperation procedure in the field of tourism stipulates that: "...each
Safety & Airspace Regulation Group Code of Practice. Issue 13, August 2013 CAP 1089
 Safety & Airspace Regulation Group Code of Practice Issue 13, August 2013 Civil Aviation Authority 2013 All rights reserved. Copies of this publication may be reproduced for personal use, or for use within
APPLICATION OF THE NO-SPECIAL-FEE SYSTEM IN THE BALTIC SEA AREA
 CONVENTION ON THE PROTECTION OF THE MARINE ENVIRONMENT OF THE BALTIC SEA AREA HELSINKI COMMISSION - Baltic Marine HELCOM 19/98 Environment Protection Commission 15/1 Annex 19 19th Meeting Helsinki, 23-27
About ABTA. Executive summary
 ABTA response to the Department for Transport Draft Airports National Policy Statement new runway capacity and infrastructure at airports in the South East of England About ABTA ABTA The Travel Association