U.S. Department of Transportation Maritime Administration. Vessel Calls at U.S. Ports 2002
|
|
|
- Kerrie Blair
- 6 years ago
- Views:
Transcription

1 U.S. Department of Transportation Maritime Administration Vessel Calls at U.S. Ports 2002 March 2004
2 Vessel Calls at U.S. Ports 2002 March 2004 Office of Statistical and Economic Analysis
3
4 Contents Preface... v Notes and Sources... vii Ports and Coastal Regions... ix Highlights... 1 Calls... 1 Capacity... 1 Call Frequency... 2 U.S.-Flag Calls... 2 Vessel Size... 2 Fleet Age... 3 Regional Calls... 3 Port Call Concentration... 4 Summary Tables... 5 Tables (Highlights) H-1. Vessel Calls at U.S. and World Ports by Vessel Type, H-2. Active Fleets (Vessels) that Called at U.S. and World Ports, H-3. Vessel Calls at U.S. Ports by Vessel Type, 1998 and H-4. Vessel Capacity Calling at U.S. Ports by Vessel Type, 1998 and H-5. Active Fleets (Vessels), Distribution by Number of Calls at U.S. Ports, H-6. U.S.-Flag Vessel Calls at U.S. Ports by Vessel Type, 1998 and H-7. Average Vessel Size (DWT) Per Call, by Vessel Type, H-8. Vessel Calls at U.S. Ports by Vessel Type and Age, H-9. Vessel Calls by Coastal Regions, H-10. Port Call Concentration at U.S. Ports by Vessel Type, (Summary) S-1. Vessel Calls at U.S. Ports, Calls, Capacity and Average DWT/TEU Per Call, S-2. Foreign-Flag Vessel Calls at U.S. Ports, Calls, Capacity and Average DWT/TEU Per Call, S-3. U.S.-Flag Vessel Calls at U.S. Ports, Calls, Capacity and Average DWT/TEU Per Call, S-4. Vessel Calls at U.S. Ports by Coastal Region and Vessel Type, S-5. Vessel Capacity Calling at U.S. Ports by Coastal Region and Vessel Type, S-6. Top 20 U.S. Ports of Call by Vessel Type, Calls S-7. Top 20 U.S. Ports of Call by Vessel Type, Capacity iii
5
6 Preface The following report contains data on calls by oceangoing vessels of 10,000 DWT or greater at U.S. ports. The calls are presented in terms of vessels and vessel capacity (calls weighted by vessel deadweights (DWT)). For containerships, capacity is also expressed in terms of twenty-foot equivalent units (TEU). After the Highlights section, there are seven summary tables. The first three summary tables contain time series ( ) for calls and capacity by vessel type and flag (U.S. and Foreign). The next two summary tables contain time series for calls and capacity by vessel type and coastal regions. A list of U.S. ports and their associated coastal regions are shown on pages ix and x. The last two summary tables contain 2002 calls and capacity for the top 20 ports by vessel type. This report and data on calls and capacity for all U.S. ports are available at Comments and recommendations as to the content and format of the report can be made at In addition, to learn more about the Maritime Administration or the Maritime industry, visit the agency s website at v
7
8 Notes and Sources Vessel Types The vessel categories included in this report are: Tanker: Petroleum Tankers, Chemical Tankers. Product: 10,000 69,999 DWT. Crude: >=70,000 DWT. Container: Container Carriers, Refrigerated Container Carriers. Dry Bulk: Bulk Vessels, Bulk Containerships, Cement Carriers, Ore Carriers, Wood-Chip Carriers. Ro-Ro: Ro-Ro Vessels, Ro-Ro Containerships, Vehicle Carriers. Gas Carrier: LNG Carriers, LNG/LPG Carriers, LPG Carriers. Combination: Ore/Bulk/Oil Carriers, Bulk/Oil Carriers. General Cargo: General Cargo Carriers, Partial Containerships, Refrigerated Ships, Barge Carriers, Livestock Carriers. Capacity Throughout the report, capacity is the sum of vessel calls weighted by vessel DWT. For example, if three vessels called at port X in 2002, the capacity calling at that port would be: Calls DWT Calls x DWT Vessel A 10 25, ,000 Vessel B 15 30, ,000 Vessel C 12 15, ,000 Total ,000 or 880,000 DWT, and similarly for containership TEU capacities. A TEU is a nominal unit of measure equivalent to a 20 x 8 x 8 shipping container. TEU figures are shown in red italics throughout the report. Growth Rates/Percents Throughout the report, textual references to percents and growth rates are rounded to whole numbers, e.g, 31 percent instead of 30.6 percent. Growth rates are calculated as (calls 2002 calls 1998 ) x 100/calls 1998, and similarly for capacity and vessel size. For capacity, growth rates are calculated on unrounded numbers. Size Threshold The report includes only oceangoing self-propelled vessels of 10,000 DWT or greater. In 2002, these vessels accounted for about 98 percent of the vessel capacity calling at U.S. ports. Port Groupings Starting with year 2000 source data, Columbia River ports, L.A./Long Beach, Philadelphia/Delaware River ports, San Francisco Bay ports, Virginia ports, and were reported on an individual basis. However, for historical consistency, year calls at these ports are presented as totals for the respective groups. The following are the groupings. Columbia River Ports: Astoria, Kalama, Longview, Portland, Rainier, Vancouver, Willbridge. L.A./Long Beach: Los Angeles, Long Beach. Philadelphia/Delaware River Ports: Burlington, NJ; Camden, NJ; Claymont, DE; Chester, PA; Delair, NJ; Delaware City, DE; Eddystone, PA; Fairless Hills, PA; Gloucester, NJ; Marcus Hook, PA; Paulsboro, NJ; Philadelphia, PA; Reedy Point, DE; Salem, NJ; Tullytown, PA; Westville, NJ; Wilmington, DE. San Francisco Bay: Alameda, Antioch, Benicia, Concord, Crockett, Martinez, Oakland, Pittsburg, Redwood City, Richmond, Rodeo, Sacramento, San Francisco, Selby, Stockton. Virginia Ports: Chesapeake, Hampton Roads, Hopewell, Lynnhaven Roads, Newport News, Norfolk, Portsmouth, Richmond, Yorktown. Coastal Regions : All ports from Eastport, ME to Baltimore MD. South Atlantic: All ports from Alexandria, VA to Miami, FL. vii
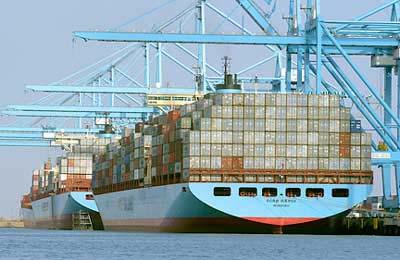
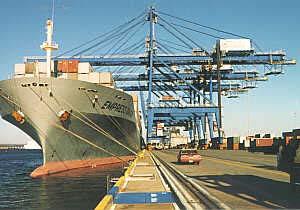
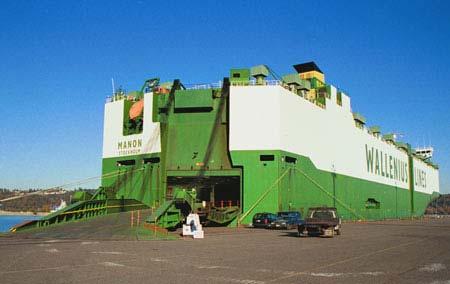
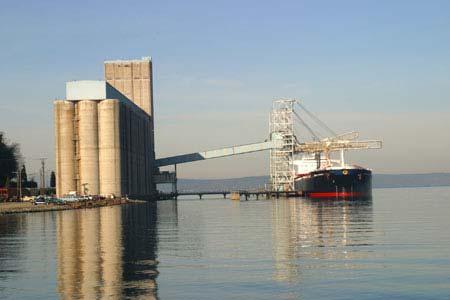
9 Notes and Sources Coastal Regions Cont. Puerto Rico : All ports from Key West, FL to Brownsville, TX. : All U.S. ports from Barrow, AK to Coos Bay, OR. Pacific Southwest: All ports from Crockett, CA to San Diego, and all Hawaiian ports. Sources Clarkson Research Studies, Shipping Review & Outlook, Spring 2003, London: Clarkson Research Studies, Spring This source contains data for world seaborne trade. Lloyd s Maritime Intelligence Unit, Vessel Movements Data Files, , London: Lloyd s Maritime Intelligence Unit, This source contains data for vessel port calls, ports and active fleets. MDS Transmodal, Containership Databank on Disk, Chester, England: MDS Transmodal, February This source contains data on the global containership fleet, deployments, itineraries and joint services. U.S. Maritime Administration, U.S. Foreign Waterborne Trade Data Banks, , Wash., DC: U.S. Maritime Administration, This source contains detailed data for U.S. foreign waterborne trade. U.S. Army Corps, Waterborne Commerce of the United States, detail files, , New Orleans: Waterborne Commerce Statistics Center, This source contains detailed data for U.S. domestic waterborne trade. Photo Credits Photographs shown on the cover, viewed clockwise beginning from the top left and ending in the middle, are courtesy of Port of Tacoma, Port of Tacoma, Maersk ( Maersk Inc.), Maryland Port Administration, and Maersk ( Maersk Inc.). viii
10 Ports And Coastal Regions Port Coastal Region Port Coastal Region Albany, NY Anacortes, WA Anchorage, AK Annapolis Anch., MD Baltimore, MD Barbers Point, HI Bath, ME Baton Rouge, LA Bayport, TX Beaumont, TX Bellingham, WA Boston, MA Brayton Point, RI Bridgeport, CT Brownsville, TX Brunswick, GA Bucksport, ME Charleston, SC Cherry Point, WA Claymont, DE Columbia River Ports, OR Convent, LA Coos Bay, OR Corpus Christi, TX Lightering Area, TX Davisville, RI Destrehan, LA Donaldsonville, LA Drift River Terminal, AK Dutch Harbor, AK Eastport, ME El Segundo, CA Everett, WA Fall River, MA Fernandina, FL Ferndale, WA Fort Pierce, FL Freeport, TX Lightering Area, TX Galveston, TX Lightering Area, TX Geismar, LA Georgetown, SC Gloucester, MA Gramercy, LA Guanica, PR Guayama, PR Guayanilla, PR Gulfport, MS Hawk Inlet, AK Hilo, HI Homer, AK Honolulu, HI Hoonah, AK Houston, TX Hydaburg, AK Ingleside, TX Jacksonville, FL Kahului, HI Kawaihae, HI Kenai, AK Ketchikan, AK Key West, FL Kivalina, AK Kodiak, AK L.A./Long Beach, CA Lake Charles, LA Las Mareas, PR Pacific Southwest South Atlantic South Atlantic Pacific Southwest South Atlantic South Atlantic South Atlantic Puerto Rico Puerto Rico Puerto Rico Pacific Southwest Pacific Southwest South Atlantic Pacific Southwest Pacific Southwest Pacific Southwest Puerto Rico LOOP Terminal, LA Manchester, WA March Point, WA Mayaguez, PR Puerto Rico Miami, FL South Atlantic Mobile, AL Montauk Lighting Area, NY Morehead City, NC South Atlantic New Haven, CT New London, CT New Orleans, LA New York, NY Newport, OR Newport, RI Nikiski, AK Norco, LA Northport, NY Northville, NY Olympia, WA Palm Beach, FL South Atlantic Panama City, FL Pascagoula, MS Lightering Area, MS Pensacola, FL Philadelphia, PA Piney Point, MD Point Comfort, TX Point Wells, WA Ponce, PR Puerto Rico Port Allen, LA Port Angeles, WA Port Arthur, TX Port Canaveral, FL South Atlantic Port Everglades, FL South Atlantic Port Hueneme, CA Pacific Southwest Port Jefferson, NY Port Manatee, FL Port Townsend, WA Portland, ME Portsmouth, NH Providence, RI Ravena, NY Red Dog, AK Rockland, ME S. Sabine Light. Area, TX S. Calif. Light. Area, CA Pacific Southwest Sabine, TX Salem, MA San Diego, CA Pacific Southwest San Francisco, CA Pacific Southwest San Juan, PR Puerto Rico Sandwich, MA Sandy Point, ME Savannah, GA South Atlantic Searsport, ME Seattle, WA Somerset, MA S.W. Pass Light. Area, LA St. Rose, LA Stony Point, NY Tacoma, WA Taft, LA Tampa, FL Texas City, TX Valdez, AK Virgina Ports, VA South Atlantic Westport, WA Westwego, LA ix
11 Ports And Coastal Regions Port Wilmington, NC Yabucoa, PR Yarmouth, ME Coastal Region South Atlantic Puerto Rico x
12 Highlights Calls In 2002, vessel calls at U.S. ports accounted for about 10 percent of vessel calls at world ports (Table H-1). The U.S. calls were made by 6,114 vessels, or fortyfour percent of the active world fleet (Table H-2). Of the 56,596 U.S. calls, 31 percent were by tankers, 30 percent were by containerships, 20 percent were by dry bulk carriers and 10 percent were by ro-ro vessels. Tanker. From 1998 to 2002, tanker calls at U.S. ports increased by 3 percent. Over the same period foreign-flag tanker calls, which are in U.S. import trades, increased by 10 percent reflecting the substitution of imports for domestic shipments (Tables S-1 S-3). In 2002, foreign-flag vessels accounted for 80 percent of tanker calls at U.S. ports, up from 74 percent four years earlier. Over this period, petroleum imports increased by 10 percent (52 million metric tons) while domestic ocean shipments, which are reserved for U.S.-flag vessels, fell by 13 percent (21 million metric tons). In 2002, 58 percent (10,045) of the tanker calls at U.S. ports were by double hull tankers, up from 37 percent (6,255) 4 years earlier (Table H-3). Of these, 5,770 were by tankers smaller than 70,000 DWT, which carry primarily petroleum products, and 4,275 were by tankers 70,000 or greater. For the period 1998 to 2002, double-hull tanker calls increased by 61 percent while single-hull tanker calls declined by 31 percent (See Tables S-1 S-3 for double-hull calls by flag). Container. Over the last four years, containership calls at U.S. ports increased by 8 percent. Over the same period, the number of containerships calling at U.S. ports increased by 28 percent to 1,026, but, as larger containerships entered U.S. trades, average calls per containership fell (See Table S-1 for changes in vessel size). Dry Bulk. A 42 percent decline in U.S. coal exports contributed to the 12 per-cent decline in dry bulk vessel calls at U.S. ports since The primary impact was on South Atlantic ports which had a 34 percent decline in dry bulk calls (Table S-4). Table H-1 Active Fleets (Vessels) that Called At U.S. Ports and World Ports, 2002 U.S. World % U.S. Vessel Type Call Call Call Tanker 1,456 3, Double-Hull 840 1, Container 1,026 2, Dry Bulk 2,488 5, Ro-Ro Vehicle Gas Carrier Combination General Cargo 507 1, All Types 6,114 13, Table H-2 Vessel Calls at U.S. and World Ports by Vessel Type, 2002 U.S. Ports World Ports Vessel Type Calls % Calls % Tanker 17, , Double-Hull 10, , Container 17, , Dry Bulk 11, , Ro-Ro 5, , Vehicle 3, , Gas Carrier , Combination , General Cargo 3, , All Types 56, , Vessel Calls at U.S. Ports by Vessel Type, 1998 and 2002 % Ch. Vessel Type Tanker 16,841 17, Double-Hull 6,255 10, Product 10,208 10, Double-Hull 3,612 5, Crude 6,633 6, Double-Hull 2,643 4, Container 15,846 17, Dry Bulk 12,674 11, Ro-Ro 4,251 5, Vehicle 2,431 3, Gas Carrier Combination General Cargo 4,978 3, All Types 56,121 56, Ro-Ro/Vehicle. From 1998 to 2002, ro-ro Table H-3 calls at U.S. ports increased by 33 percent. Vehicle carriers accounted for about 85 percent of the increase, reflecting a 52 percent increase in U.S. vehicle imports, and a movement to just-in-time delivery schedules which require higher call frequencies. 1
13 Highlights Capacity Vessel capacity calling at U.S. ports (calls x vessel DWT) increased by 6 percent from 1998 to 2002 (Table H-4). Over this period the number of calls increased by only 1 percent, but average vessel size (per call) increased by 5 percent (Table S-1). Average vessel size increased for all vessel types with the largest increases in containerships (16 percent) and double-hull tankers (10 percent). In terms of TEU s, the average size of containerships (per call) increased by 21 percent, and containership capacity calling at U.S. ports increased by 31 percent (Table S-1). The corresponding DWT figures were 16 percent and 26 percent. The TEU/DWT ratio tends to be larger for newer containerships in U.S. trades. Call Frequency Seventy-one percent of the vessels that called in U.S. ports made fewer than 10 U.S. calls (Table H-5). On a per vessel basis, containerships made the most calls at 16.7, followed by ro-ro s at 13.3, and tankers at 11.9 calls. Containerships and ro-ro vessels are generally in scheduled service which tends to increase calls per vessel. The high calls per vessel for the tankers can be attributed to their deployment in domestic trades which involve U.S. calls at both load and discharge ports. U.S. Flag Calls Vessel Capacity Calling at U.S. Ports by Vessel Type, 1998 and 2002 (Million DWT (TEU)) %Ch. Vessel Type Tanker 1,156 1, Double-Hull Product Double-Hull Crude Double-Hull Container Container (TEU) Dry Bulk Ro-Ro Vehicle Gas Carrier Combination General Cargo All Types 2,542 2, Table H-4 Active Fleets (Vessels), Distribution by Number of Calls at U.S. Ports, 2002 Calls Active Vessel Type < >19 Vessels Tanker ,456 Double-Hull Container ,026 Dry Bulk 2, ,488 Ro-Ro Vehicle Gas Carrier Combination General Cargo U.S.-flag vessel calls are largely in U.S. domestic trades. In 2002, 221 U.S.-flag vessels were active in U.S. oceanborne trades, down from 256 vessels in The U.S.-flag fleet accounted for 13 percent of U.S. port calls in 2002, down from 15 percent four years earlier. U.S.-flag vessels accounted for 14 percent of capacity calling at U.S. ports in 2002, down from 17 percent in 1998 (Tables S-1 and S-3). The declines were primarily in the tanker and container segments as 25+ year old vessels were removed from domestic service (Table H-6). Vessel Size All Types 4, ,114 Table H-5 U.S.-Flag Vessel Calls at U.S. Ports by Vessel Type, 1998 and 2002 % Ch. Vessel Type Tanker 4,345 3, Double-Hull 984 1, Container 3,297 2, Dry Bulk Ro-Ro Vehicle Gas Carrier Combination General Cargo The average size (per call) of commercial vessels calling at U.S. ports was 47,625 DWT or 17 percent larger than vessels calling at All Types 8,650 7, world ports (Table H-7). The difference was due largely to a scarcity of U.S. feeder and short-sea container services. These Table H-6 services, which use smaller vessels than linehaul services, are common in intra- 2
14 Highlights European and intra-asia trades (As of yearend 2002, there were ,000+ DWT containerships operating in intra-european and intra-asia trades. Seventy percent of these were less than 20,000 DWT/1,250 TEU s). Dry bulk carriers calling at U.S. ports were 12 percent smaller than those calling at world ports. Grains, which are generally shipped on smaller vessels than other major bulk cargoes (coal and iron ores) accounted for 51 per-cent of U.S. major bulk trades, compared to only 20 percent of worldwide major bulk trades. Fleet Age Average Vessel Size (DWT, TEU) Per Call, by Vessel Type, 2002 U.S. World Vessel Type Ports Ports % Diff. Tanker 69,412 65, Double-Hull 74,887 71, Container 42,158 31, Container (TEU) 3,020 2, Dry Bulk 42,876 48, Ro-Ro 20,376 17, Vehicle 17,528 17, Gas Carrier 32,099 40, Combination 84,459 90, General Cargo 23,496 29, All Types 47,625 40, In 2002, 47 percent of the calls at U.S. ports were by vessels 10 years old or less. The youngest segment was containerships with 57 percent of the calls by vessels 10 years old or less followed by dry bulk and tankers at 47 percent (Table H-8). Eighty percent of the double-hull tanker calls were by vessels less than 10 years old. Regional Calls In 2002, Atlantic and Pacific ports accounted for 89 percent of containership calls and 92 percent of vehicle carrier calls, Gulf and Pacific ports accounted for 76 percent of dry bulk calls, and Gulf ports alone accounted for 70 percent of gas carrier calls (Table H-9). For tankers, Gulf ports accounted for 51 percent of the calls, followed by Atlantic ports at 26 percent and Pacific ports at 22 percent. Table H-7 Table H-8 Vessel Calls by U.S. Coastal Regions, 2002 Vessel Calls at U.S. Ports by Vessel Type and Age, 2002 Less Than Vessel Type 10 Years More Than Years 20 Years Tanker 8,107 5,309 3,904 Double-Hull 8,015 1, Container 9,687 5,281 2,170 Dry Bulk 5,263 3,965 1,884 Ro-Ro 1,351 2,525 1,756 Vehicle 1,078 1, Gas Carrier Combination General Cargo 1,584 1,276 1,034 All Types 26,489 18,962 11,145 Product tankers accounted for 63 percent of overall tanker calls, but 79 percent of calls at Atlantic ports. North South Puerto Pacific Pacific Vessel Type Atlantic Atlantic Rico Northwest Southwest Total Tanker 3,122 1, ,793 2,069 8,798 17,320 Product 2,231 1, ,303 5,100 10,940 Crude ,698 6,371 Container 3,043 5, ,787 5,034 1,262 17,138 Bulk 1,388 1, ,111 1,389 4,983 11,112 Ro-Ro 1,804 1, ,632 Vehicle 1, ,605 Gas Carrier Combination General Cargo ,267 3,894 All Types 10,453 10,375 1,377 6,697 10,021 17,673 56,596 Table H-9 3
15 Highlights Port Call Concentration The top 20 ports accounted for 80 percent of the calls at U.S. ports in 2002 (Tables H-10, S-6 and S-7). The largest concentrations of calls were for containerships, ro-ro s, gas carriers and combination carriers with the top 20 ports accounting for at least 90 percent of the calls. Except for containerships, the concentration of capacity calling at U.S. ports was similar to that for calls. For containerships, the top 10 ports accounted for 80 percent of the calls, but 86 percent of the capacity; that is, large containerships tend to call at large container ports. Port Call Concentration at U.S. Ports, 2002 by Vessel Type (Percent of Calls/Capacity) Top 10 Top 20 Top 30 Vessel Ports Ports Ports Type Calls Cap. Calls Cap. Calls Cap. Tanker Product Crude Container Dry Bulk Ro-Ro Vehicle Gas Carrier Combination General Cargo All Types Table H-10 4
16 Summary Tables Vessel Calls at U.S. Ports, Calls, Capacity and Average DWT/TEU Per Call, % Ch. Vessel Type Calls Tanker 16,841 17,279 18,535 18,387 17, Double-Hull 6,255 6,942 8,742 9,568 10, Product 10,208 10,875 11,868 11,780 10, Double-Hull 3,612 3,996 5,184 5,755 5, Crude 6,633 6,404 6,667 6,607 6, Double-Hull 2,643 2,946 3,558 3,813 4, Container 15,846 16,625 17,410 17,076 17, Dry Bulk 12,674 11,946 12,013 11,628 11, Ro-Ro 4,251 5,073 5,542 5,712 5, Vehicle 2,431 3,072 3,646 3,646 3, Gas Carrier Combination General Cargo 4,978 4,354 4,318 4,076 3, All Types 56,121 56,727 59,382 58,388 56, Capacity (Million DWT/TEU) Tanker 1,156 1,170 1,252 1,274 1, Double-Hull Product Double-Hull Crude Double-Hull Container Container (TEU) Dry Bulk Ro-Ro Vehicle Gas Carrier Combination General Cargo All Types 2,542 2,559 2,711 2,746 2, Average DWT/TEU Per Call Tanker 68,670 67,723 67,551 69,313 69, Double-Hull 67,896 69,076 68,638 70,914 74, Product 36,872 37,516 36,780 37,612 37, Double-Hull 34,770 34,374 34,074 36,180 36, Crude 117, , , , , Double-Hull 113, , , , , Container 36,243 36,586 37,784 39,656 42, Container (TEU) 2,503 2,550 2,652 2,801 3, Dry Bulk 41,740 41,833 41,694 42,142 42, Ro-Ro 19,898 18,662 18,456 20,445 20, Vehicle 17,276 16,034 16,438 17,579 17, Gas Carrier 29,954 31,402 31,397 33,438 32, Combination 82,895 88,433 89,462 87,873 84, General Cargo 21,409 22,331 22,857 23,416 23, All Types 45,289 45,117 45,646 47,034 47, Table S-1 5
17 Summary Tables Foreign-Flag Vessel Calls at U.S. Ports, Calls, Capacity and Average DWT/TEU Per Call, % Ch. Vessel Type Calls Tanker 12,496 13,184 14,432 14,378 13, Double-Hull 5,271 5,828 7,328 8,055 8, Product 7,328 8,026 8,936 8,919 8, Double-Hull 2,750 3,038 3,956 4,505 4, Crude 5,168 5,158 5,496 5,459 5, Double-Hull 2,521 2,790 3,372 3,550 3, Container 12,549 13,369 14,168 14,330 14, Dry Bulk 12,567 11,842 11,882 11,477 10, Ro-Ro 3,526 4,163 4,574 4,811 4, Vehicle 2,271 2,875 3,383 3,399 3, Gas Carrier Combination General Cargo 4,822 4,191 4,163 3,942 3, All Types 47,471 48,182 50,783 50,447 49, Capacity (Million DWT/TEU) Tanker , Double-Hull Product Double-Hull Crude Double-Hull Container Container (TEU) Dry Bulk Ro-Ro Vehicle Gas Carrier Combination General Cargo All Types 2,106 2,147 2,301 2,352 2, Average DWT/TEU Per Call Tanker 68,546 67,970 68,164 69,996 69, Double-Hull 71,557 72,604 72,178 73,944 76, Product 35,618 36,562 35,496 36,572 35, Double-Hull 33,908 33,027 32,519 35,278 35, Crude 115, , , , , Double-Hull 112, , , , , Container 36,993 37,262 38,534 40,402 43, Container (TEU) 2,546 2,585 2,695 2,845 3, Dry Bulk 41,708 41,807 41,600 42,152 42, Ro-Ro 19,812 18,633 18,528 20,810 20, Vehicle 17,147 15,878 16,313 17,584 17, Gas Carrier 29,732 31,258 31,397 33,438 32, Combination 82,985 88,433 89,462 87,873 84, General Cargo 21,003 21,783 22,357 23,041 23, All Types 44,364 44,557 45,303 46,632 47, Table S-2 6
18 Summary Tables U.S.-Flag Vessel Calls at U.S. Ports, Calls, Capacity and Average DWT/TEU Per Call, % Ch. Flag/Vessel Type Calls Tanker 4,345 4,095 4,103 4,009 3, Double-Hull 984 1,114 1,414 1,513 1, Product 2,880 2,849 2,932 2,861 2, Double-Hull ,228 1,250 1, Crude 1,465 1,246 1,171 1,148 1, Double-Hull Container 3,297 3,256 3,242 2,746 2, Dry Bulk Ro-Ro Vehicle Gas Carrier Combination General Cargo All Types 8,650 8,545 8,599 7,941 7, Capacity (Million DWT/TEU) Tanker Double-Hull Product Double-Hull Crude Double-Hull Container Container (TEU) Dry Bulk Ro-Ro Vehicle Gas Carrier Combination General Cargo All Types Average DWT/TEU Per Call Tanker 69,026 66,927 65,395 66,862 69, Double-Hull 48,285 50,620 50,296 54,785 64, Product 40,060 40,202 40,692 40,855 41, Double-Hull 37,523 38,646 39,085 39,431 39, Crude 125, , , , , Double-Hull 124, , , , , Dry Bulk 45,596 44,820 50,155 41,354 43, Container 33,388 33,808 34,509 35,764 34, Container (TEU) 2,340 2,409 2,468 2,571 2, Ro-Ro 20,317 18,798 18,115 18,491 18, Vehicle 19,144 18,310 18,045 17,517 18, Gas Carrier 37,326 37, Combination General Cargo 33,934 36,424 36,288 34,451 30, All Types 50,364 48,271 47,671 49,588 49, Table S-3 7
19 Summary Tables Vessel Calls at U.S. Ports by Coastal Region and Vessel Type, % Ch. Vessel Type/Region Tanker 3,049 3,153 3,533 3,682 3, South Atlantic 1,227 1,393 1,406 1,437 1, Puerto Rico ,991 8,861 9,463 9,155 8, ,526 1,630 1,870 1,805 1, Pacific Southwest 1,878 2,026 2,081 2,096 2, Total 16,841 17,279 18,535 18,387 17, Container 3,180 3,157 3,208 3,196 3, South Atlantic 5,127 5,116 5,212 5,479 5, Puerto Rico ,127 1,197 1,178 1,283 1, ,603 1,779 1,898 1,705 1, Pacific Southwest 4,193 4,711 5,241 4,827 5, Total 15,846 16,625 17,410 17,076 17, Dry Bulk 1,553 1,441 1,579 1,587 1, South Atlantic 1,755 1,710 1,603 1,341 1, Puerto Rico ,078 5,521 5,104 4,794 4, ,787 1,744 1,998 2,420 2, Pacific Southwest 1,401 1,400 1,613 1,395 1, Total 12,674 11,946 12,013 11,628 11, Ro-Ro 1,123 1,209 1,479 1,786 1, South Atlantic 1,211 1,538 1,684 1,644 1, Puerto Rico Pacific Southwest Total 4,251 5,073 5,542 5,712 5, Table S-4 8
20 Summary Tables Vessel Calls at U.S. Ports by Coastal Region and Vessel Type, Cont. % Ch. Vessel Type/Region Gas Carrier South Atlantic Puerto Rico Pacific Southwest Total Combination South Atlantic Puerto Rico Pacific Southwest Total General Cargo South Atlantic 1,051 1, Puerto Rico ,909 1,478 1,471 1,361 1, Pacific Southwest Total 4,978 4,354 4,318 4,076 3, All Types 10,065 10,174 10,980 11,423 10, South Atlantic 10,505 10,889 10,939 10,805 10, Puerto Rico 1,353 1,513 1,560 1,407 1, ,439 18,369 18,673 17,941 17, ,883 6,113 6,760 6,927 6, Pacific Southwest 8,876 9,669 10,506 9,885 10, Total 56,121 56,727 59,382 58,388 56, Table S-4 - Cont. 9
21 Summary Tables Vessel Capacity Calling at U.S. Ports by Coastal Region and Vessel Type, (Thousand DWT/TEU) % Ch. Vessel Type/Region Tanker 184, , , , , South Atlantic 49,130 56,522 57,782 59,243 53, Puerto Rico 6,730 9,069 7,766 9,325 11, , , , , , , , , , , Pacific Southwest 143, , , , , Total 1,156,467 1,170,180 1,252,054 1,274,451 1,202, Container 113, , , , , South Atlantic 177, , , , , Puerto Rico 12,493 13,003 12,925 11,338 12, ,364 34,192 34,435 39,761 40, ,952 68,488 76,231 75,230 81, Pacific Southwest 175, , , , , Total 574, , , , , Container (TEU) 7,653 7,762 8,099 8,066 8, South Atlantic 12,208 12,853 13,844 15,054 16, Puerto Rico ,172 2,372 2,346 2,713 2, ,466 4,918 5,563 5,534 6, Pacific Southwest 12,410 13,744 15,539 15,756 17, Total 39,660 42,401 46,179 47,824 51, Dry Bulk 62,784 58,661 60,149 62,958 58, South Atlantic 83,647 73,415 66,880 57,067 47, Puerto Rico 3,143 3,921 3,487 2,726 2, , , , , , ,360 67,140 77,439 95,401 83, Pacific Southwest 59,985 60,559 69,717 58,931 61, Total 529, , , , , Ro-Ro 22,606 23,203 27,491 40,174 39, South Atlantic 25,487 30,290 32,598 34,484 32, Puerto Rico 1,460 2,770 3,635 3,197 2, ,064 9,629 9,839 9,976 9, ,514 12,362 12,822 12,952 13, Pacific Southwest 14,454 16,421 15,896 15,996 16, Total 84,585 94, , , , Table S-5 10
22 Summary Tables Vessel Capacity Calling at U.S. Ports by Coastal Region and Vessel Type, Cont. (Thousand DWT/TEU) % Ch. Vessel Type/Region Gas Carrier 2,115 4,228 3,676 3,360 3, South Atlantic 1,223 1,138 1,208 1,258 1, Puerto Rico ,181 12,540 13,337 15,970 15, ,118 2,614 2,488 2,504 1, Pacific Southwest ,054 1, Total 20,518 21,448 22,229 24,710 23, Combination 21,302 20,819 19,400 21,703 19, South Atlantic 7,683 6,745 7,556 5,403 5, Puerto Rico , ,030 36,518 46,643 37,913 36, Pacific Southwest 2,190 2,177 1,875 2,151 1, Total 70,205 67,828 76,580 67,662 64, General Cargo 16,103 16,007 16,669 16,679 15, South Atlantic 26,453 26,767 24,836 21,625 20, Puerto Rico 4,941 4,732 4,951 3,528 3, ,006 33,541 33,386 32,166 29, ,622 4,540 4,670 5,337 6, Pacific Southwest 12,446 11,641 14,186 16,107 15, Total 106,572 97,229 98,698 95,442 91, All Types 422, , , , , South Atlantic 371, , , , , Puerto Rico 29,831 34,662 34,240 31,019 34, ,006, ,882 1,010,130 1,011, , , , , , , Pacific Southwest 409, , , , , Total 2,541,666 2,559,329 2,710,529 2,746,233 2,695, Table S-5 - Cont. 11
23 Summary Tables Top 20 U.S. Ports of Call by Vessel Type, 2002 (Vessel Calls) Vessel Type/Port Tanker Calls Percent of Total Vessel Type/Port Calls Tanker, Crude Percent of Total Houston 2, Port Arthur New Orleans 1,261 7 Houston Port Arthur 1,162 7 New Orleans New York 1,094 6 Phila./Del. River Ports L.A./Long Beach Valdez Texas City Texas City Phila./Del. River Ports Corpus Christi San Francisco Bay Ports L.A./Long Beach Corpus Christi LOOP Terminal Valdez New York Freeport, TX Lake Charles Portland, ME San Francisco Bay Ports March Point Freeport, TX Port Everglades Portland, ME Lake Charles March Point Boston Port Angeles LOOP Terminal El Segundo Jacksonville Cherry Point Savannah Ferndale 81 1 El Segundo Beaumont 60 1 Top 20 Ports 13, Top 20 Ports 5, All Ports 17, All Ports 6, Tanker, Product Container Houston 1, L.A./Long Beach 2, New York New York 2, New Orleans San Francisco Bay Ports 1, L.A./Long Beach Virginia Ports 1,529 9 San Francisco Bay Ports Charleston 1,393 8 Texas City Savannah 1,085 6 Phila./Del. River Ports Seattle Port Arthur Houston Corpus Christi Miami Port Everglades Tacoma Boston San Juan Freeport, TX Baltimore Jacksonville Phila./Del. River Ports Savannah Jacksonville March Point Honolulu Point Comfort New Orleans Wilmington, NC Port Everglades Valdez Columbia River Ports Columbia River Ports Dutch Harbor Tampa Boston Top 20 Ports 8, Top 20 Ports 16, All Ports 10, All Ports 17, Table S-6 12
24 Summary Tables Top 20 U.S. Ports of Call by Vessel Type, 2002 Cont. (Vessel Calls) Vessel Type/Port Dry Bulk Calls Percent of Total Vessel Type/Port Calls Gas Carrier Percent of Total New Orleans 2, Houston Columbia River Ports 1, Tampa Houston Lake Charles 46 6 San Francisco Bay Ports New Orleans 46 6 L.A./Long Beach San Francisco Bay Ports 45 6 Tampa Freeport, TX 42 6 Phila./Del. Reiver Ports Boston 40 5 Baltimore Point Comfort 35 5 Mobile Kenai 30 4 Virginia Ports Savannah 19 3 New York Guayanilla 18 2 Savannah New York 11 1 Corpus Christi San Juan 9 1 Tacoma Portsmouth, NH 9 1 Jacksonville Port Arthur 7 1 Seattle Phila./Del. River Ports 7 1 Charleston Pascagoula 6 1 Port Arthur Ponce 6 1 Lake Charles Providence 6 1 Brownsville Sabine 6 1 Top 20 Ports 9, Top 20 Ports All Ports 11, All Ports Ro-Ro Combination Baltimore Houston New York New York Jacksonville Corpus Christi Tacoma New Orleans 60 8 Phila./Del. River Ports Phila./Del. River Ports 55 7 L.A./Long Beach Virginia Ports 50 7 Columbia River Ports Port Arthur 35 5 Miami Portland, ME 35 5 Houston Mobile 20 3 Charleston Freeport, TX 20 3 Savannah Texas City 19 2 Port Hueneme L.A./Long Beach 17 2 San Diego Baltimore 12 2 San Juan Point Comfort 9 1 Virginia Ports Galveston 8 1 Anchorage San Francisco Bay Ports 8 1 San Francisco Bay Ports Port Everglades 7 1 Port Everglades Lake Charles 6 1 Honolulu 95 2 Beaumont 5 1 Brunswick 66 1 Pascagoula 5 1 Top 20 Ports 5, Top 20 Ports All Ports 5, All Ports Table S-6 - Cont. 13
25 Summary Tables Top 20 U.S. Ports of Call by Vessel Type, 2002 Cont. (Vessel Calls) Vessel Type/Port General Cargo Calls Percent of Total Vessel Type/Port Calls All Vessel Types Percent of Total Phila./Del. River Ports L.A./Long Beach 4,994 9 New Orleans Houston 4,775 8 Houston New Orleans 4,657 8 San Juan New York 4,447 8 L.A./Long Beach San Francisco Bay Ports 3,639 6 Savannah Phila./Del. River Ports 2,401 4 New York Columbia River Ports 2,324 4 San Francisco Bay Ports Virginia Ports 2,258 4 Mobile Charleston 2,022 4 Baltimore Savannah 1,958 3 Columbia River Ports Baltimore 1,711 3 Tampa Port Arthur 1,433 3 Wilmington, NC Jacksonville 1,375 2 Charleston Tacoma 1,205 2 Port Hueneme Miami 1,099 2 Virginia Ports 96 2 San Juan 1,070 2 Miami 77 2 Seattle 1,020 2 Port Arthur 70 2 Corpus Christi 1,013 2 Galveston 63 2 Texas City Palm Beach 60 2 Tampa Top 20 Ports 3, Top 20 Ports 45, All Ports 3, All Ports 56, Table S-6 - Cont. 14
26 Summary Tables Top 20 U.S. Ports of Call by Vessel Type, 2002 (Capacity, Thousand DWT/TEU) Vessel Type/Port Tanker Capacity Percent of Total Vessel Type/Port Capacity Tanker, Crude Percent of Total Houston 118, LOOP Terminal 79, Port Arthur 94,802 8 Port Arthur 77, LOOP Terminal 79,296 7 Houston 59,529 7 New Orleans 78,576 7 Phila./Del. River Ports 58,422 7 L.A./Long Beach 76,588 6 Valdez 51,900 7 Phila./Del. River Ports 72,732 6 New Orleans 50,908 6 Valdez 61,356 5 L.A./Long Beach 49,384 6 New York 58,363 5 Texas City 38,803 5 Texas City 55,558 5 Corpus Christi 33,912 4 San Francisco Bay Ports 50,866 4 San Francisco Bay Ports 29,808 4 Corpus Christi 48,884 4 New York 23,306 3 Freeport, TX 28,531 2 Lake Charles 22,208 3 March Point 28,277 2 El Segundo 20,968 3 Lake Charles 26,522 2 Freeport, TX 20,502 3 Portland, ME 25,174 2 Portland, ME 20,356 3 El Segundo 24,020 2 March Point 19,664 2 Port Angeles 21,629 2 Port Angeles 18,975 2 Cherry Point 16,021 1 Galveston Light. Area 14,837 2 Port Everglades 15,390 1 S. Sabine Light. Area 14,745 2 Galveston Light. area 14,837 1 Cherry Point 14,321 2 Top 20 Ports 995, Top 20 Ports 719, All Ports 1,202, All Ports 796, Tanker, Product Container Houston 59, L.A./Long Beach 133, New York 35,057 9 New York 93, New Orleans 27,669 7 San Francisco Bay Ports 89, L.A./Long Beach 27,205 7 Virginia Ports 67,282 9 San Francisco Bay Ports 21,057 5 Charleston 61,877 9 Port Arthur 17,361 4 Savannah 50,426 7 Texas City 16,755 4 Seattle 38,697 5 Corpus Christi 14,972 4 Miami 31,433 4 Port Everglades 14,940 4 Tacoma 26,904 4 Phila./Del. River Ports 14,310 4 Houston 25,987 4 Boston 11,811 3 Baltimore 15,155 2 Jacksonville 9,557 2 New Orleans 10,701 1 Valdez 9,456 2 Phila./Del. River Ports 10,410 1 March Point 8,613 2 San Juan 10,171 1 Freeport, TX 8,029 2 Jacksonville 9,449 1 Savannah 7,706 2 Honolulu 9,150 1 Point Comfort 6,894 2 Port Everglades 7,331 1 Wilmington, NC 6,712 2 Columbia River Ports 7,269 1 Columbia River Ports 6,563 2 Boston 5,010 1 Charleston 5,908 1 Dutch Harbor 4,419 1 Top 20 Ports 329, Top 20 Ports 707, All Ports 405, All Ports 722, Table S-7 15
27 Summary Tables Top 20 U.S. Ports of Call by Vessel Type Cont. (Capacity, Thousand DWT/TEU) Vessel Type/Port Container (TEU) Capacity Percent of Total Vessel Type/Port Capacity Dry Bulk Percent of Total L.A./Long Beach 9, New Orleans 120, San Francisco Bay Ports 6, Columbia River Ports 57, New York 6, L.A./Long Beach 31,325 7 Virginia Ports 4,739 9 San Francisco Bay Ports 26,586 6 Charleston 4,467 9 Houston 25,635 5 Savannah 3,478 7 Baltimore 17,787 4 Seattle 2,763 5 Mobile 17,589 4 Miami 2,207 4 Tampa 16,627 3 Tacoma 2,089 4 Virginia Ports 15,518 3 Houston 1,840 4 Phila./Del. River Ports 15,438 3 Baltimore 1,066 2 New York 11,168 2 New Orleans Tacoma 9,899 2 Phila./Del. River Ports Seattle 8,906 2 Jacksonville Jacksonville 8,332 2 San Juan Corpus Christi 7,766 2 Honolulu Savannah 7,555 2 Columbia River Ports Charleston 7,004 1 Port Everglades Lake Charles 5,671 1 Dutch Harbor Port Arthur 5,417 1 Boston Point Comfort 4,979 1 Top 20 Ports 50, Top 20 Ports 421, All Ports 51, All Ports 476, Ro-Ro Gas Carrier New York 15, Houston 4, Baltimore 15, Tampa 3, Jacksonville 9,746 8 Lake Charles 2, Phila./Del. River Ports 6,432 6 Boston 2, L.A./Long Beach 6,384 6 Kenai 1,378 6 Tacoma 6,171 5 New Orleans 1,196 5 Savannah 5,752 5 Freeport, TX 1,194 5 Virginia Ports 5,372 5 Point Comfort Columbia River Ports 4,478 4 San Francisco Bay Ports Houston 4,367 4 Savannah Charleston 4,119 4 Guayanilla Miami 3,784 3 New York San Diego 3,461 3 Portsmouth, NH Port Hueneme 3,137 3 Providence San Juan 2,607 2 Ferndale Anchorage 2,312 2 L.A./Long Beach New Orleans 2,082 2 Phila./Del. River Ports San Francisco Bay Ports 2,037 2 Port Arthur Honolulu 1,822 2 Virginia Ports Port Everglades 1,417 1 Sabine Top 20 Ports 107, Top 20 Ports 22, All Ports 114, All Ports 23, Table S-7 Cont. 16
28 Summary Tables Top 20 U.S. Ports of Call by Vessel Type, 2002 Cont. (Capacity, Thousand DWT/TEU) Vessel Type/Port Combination Capacity Percent of Total Vessel Type/Port Capacity General Cargo Percent of Total Houston 11, New Orleans 7,604 8 New York 8, Houston 7,399 8 Corpus Christi 8, L.A./Long Beach 6,342 7 Phila./Del. River Ports 5,645 9 Phila./Del. River Ports 6,003 7 New Orleans 5,181 8 San Francisco Bay Ports 5,743 6 Virginia Ports 4,340 7 Savannah 5,490 6 Portland, ME 3,575 6 Columbia River Ports 5,033 6 Port Arthur 2,831 4 Mobile 5,018 5 Mobile 1,680 3 Charleston 3,868 4 Freeport, TX 1,666 3 New York 3,621 4 Texas City 1,502 2 Baltimore 3,560 4 L.A./Long Beach 1,254 2 Wilmington, NC 3,374 4 Baltimore San Juan 3,280 4 Galveston Tampa 2,473 3 S. Sabine Light. area Port Arthur 2,134 2 San Francisco Bay Ports Virginia Ports 2,104 2 LOOP Term Port Hueneme 1,561 2 Point Comfort Jacksonville 1,524 2 Lake Charles Beaumont 1,197 1 Beaumont Miami 1,178 1 Top 20 Ports 60, Top 20 Ports 78, All Ports 64, All Ports 91, All Vessel Types L.A./Long Beach 255,384 9 New Orleans 225,671 8 Houston 197,531 7 New York 191,438 7 San Francisco Bay Ports 175,789 7 Phila./Del. River Ports 116,818 4 Port Arthur 105,515 4 Virginia Ports 100,980 4 Columbia River Ports 82,957 3 Charleston 82,913 3 LOOP Terminal 79,795 3 Savannah 77,982 3 Corpus Christi 65,369 2 Valdez 61,356 2 Texas City 59,869 2 Baltimore 58,048 2 Seattle 49,801 2 Tacoma 48,625 2 Jacksonville 39,023 1 Miami 37,058 1 Top 20 Ports 2,111, All Ports 2,695, Table S-7 Cont. 17
TOTAL DOMESTIC TRADE RANK TOTAL FOREIGN TRADE
 U.S. PORT RANKING BY CARGO VOLUME 2016 Short Tons FOREIGN TRADE TOTAL TRADE TOTAL DOMESTIC TRADE RANK IMPORTS EXPORTS TOTAL FOREIGN TRADE RANK RANK RANK RANK PORT/STATE TONS PORT/STATE TONS PORT/STATE
ACEC/MW and ACEC/MD. Maryland Port Administration. Steve Johnson. June 6, 2017
 ACEC/MW and ACEC/MD Maryland Port Administration Steve Johnson June 6, 2017 1 The Port of Baltimore is a complex mix of Private and Public terminals.handling diverse bulk & general cargoes. Baltimore Forest
SAND TIGER SHARK (SoC)
") Ranking (Economic) Potentially Impacted Navigation s 2 Galveston SWD HOUSTON SHIP CHANNEL (0007780) TX X 4 New York NAD NEW YORK HARBOR (0012490) NY X 10 New York NAD NEW YORK AND NEW JERSEY HARBOR, NY
Ranking (Economic) Potentially Impacted Navigation s 2 Galveston SWD HOUSTON SHIP CHANNEL (0007780) TX X 4 New York NAD NEW YORK HARBOR (0012490) NY X 10 New York NAD NEW YORK AND NEW JERSEY HARBOR, NY
JULY 20-27, 2008 SHORE LEAVE SURVEY
 THE SEAMEN S CHURCH INSTITUTE OF NEW YORK AND NEW JERSEY 241 WATER STREET NEW YORK, NEW YORK 10038 212/349-9090 FAX: 212/349-8342 Website: www.seamenschurch.org JULY 20-27, 2008 SHORE LEAVE SURVEY The
The Potential Impacts of the Panama Canal Expansion on Texas Ports Final report PRC 17-78
 The Potential Impacts of the Panama Canal Expansion on Texas Ports Final report PRC 17-78 The Potential Impacts of the Panama Canal Expansion on Texas Ports Texas A&M Transportation Institute PRC 17-78
Fiscal Year 2007 Port Security Grant Program (PSGP) Award Allocation, Tiers 1, 2, 3, 4 May 2007
 Award Allocation, Tiers 1, 2, 3, 4 May 2007") Tier Region/Port Area Port Area Port Entity Name Total I American President Lines, Ltd. $91,500 Oakland, CA County of Alameda $505,413 Port of Oakland $5,623,700 Bay Area Richmond, CA City of Richmond
Tier Region/Port Area Port Area Port Entity Name Total I American President Lines, Ltd. $91,500 Oakland, CA County of Alameda $505,413 Port of Oakland $5,623,700 Bay Area Richmond, CA City of Richmond
Short Tons (Thousands) Metric Tons (Thousands)
 Metric Tons (Thousands)") Hampton Roads Harbor 2017 Trade Overview 0.907185 1.10231 TOTAL EXPORT IMPORT Total Cargo 62,578.98 56,770.76 Total Cargo 50,552.13 45,860.17 Total Cargo 12,026.85 10,910.59 General Cargo 21,971.71 19,932.41
Hampton Roads Harbor 2017 Trade Overview 0.907185 1.10231 TOTAL EXPORT IMPORT Total Cargo 62,578.98 56,770.76 Total Cargo 50,552.13 45,860.17 Total Cargo 12,026.85 10,910.59 General Cargo 21,971.71 19,932.41
Short Tons (Thousands) Metric Tons (Thousands)
 Metric Tons (Thousands)") Hampton Roads Harbor 2016 Trade Overview 0.907185 1.10231 TOTAL EXPORT IMPORT Total Cargo 50,313.70 45,643.88 Total Cargo 38,661.73 35,073.37 Total Cargo 11,651.98 10,570.51 General Cargo 20,869.31 18,932.33
Hampton Roads Harbor 2016 Trade Overview 0.907185 1.10231 TOTAL EXPORT IMPORT Total Cargo 50,313.70 45,643.88 Total Cargo 38,661.73 35,073.37 Total Cargo 11,651.98 10,570.51 General Cargo 20,869.31 18,932.33
Operations and Maintenance Funding Allocation via Navigation Systems Optimization
 Operations and Maintenance Funding Allocation via Navigation Systems Optimization Kenneth Ned Mitchell, PhD U.S. Army Engineer Research and Development Center Adel Khodakarami Dr. Bruce Wang Texas A&M
Delivering the Goods: Ports in the South
 Delivering the Goods: Ports in the South Sujit M. CanagaRetna The Council of State Governments Southern Legislative Conference (SLC) Atlanta, Georgia Presentation to the Southern Economic Development Council
FY 2018 Port Security Grant Program
 Port Security Grant Program In, the Port Security Grant Program (PSGP) provides $100,000,000 for transportation infrastructure security activities to implement Area Maritime Transportation Security Plans
Lower Income Journey to Work Market Share From American Community Survey
 Lower Income Journey to Work Market Share From American Community Survey 2006-2010 Table 1: Overall National Data Table 2: Car, Truck or Van Table 3: Transit Table 4: Metrics Table 1 Work Trip Market Share:
U.S. Metropolitan Area Exports, 2015
 U.S. Metropolitan Area Exports, 2015 Jeffrey Hall Office of Trade and Economic Analysis Industry and Analysis Department of Commerce International Trade Administration September 2016 U.S. Metro Exports:
FONASBA QUALITY STANDARD APPROVALS GRANTED FONASBA MEMBER ASSOCIATION AS OF February 2017
 ACGI SHIPPING, INC. Vancouver, Canada 1100-900 W. Hastings Street Vancouver, Canada V6C1E5 Erich Billung-Meyer 604-891-7447 vancouver@acgishipping.com Long Beach, CA Seattle, WA AMERICAN SHIPPING AND CHARTERING
Rank Place State Native Hawaiian and Pacific Islander population (alone or in combination
 TABLE 2a: 100 Largest Places Ranked by Number of s (race alone or in *) Living in Hard-to- Census Rank Place State (alone or in 1 Honolulu (CDP) HI 64,196 11,130 17.3 2 New York City NY 14,981 8,211 54.8
FBI Drug Demand Reduction Coordinators
 FBI Drug Demand Reduction Coordinators Alabama 2121 Building, Room 1400 Birmingham, AL 35203 (205) 252 7705 One St. Louis Centre One St. Louis Street Mobile, AL 36602 (334) 438 3674 Alaska 222 West Seventh
An overview of the US import terminal situation. Ad Ligthart
 An overview of the US import terminal situation Ad Ligthart Galveston 6-7 December 2006 An overview of the US import terminal situation An overview of the US import terminal situation Total import volume
Impact of Hurricane Irma on US Metropolitan Areas
 Impact of Hurricane Irma on US Metropolitan Areas Puerto Ricans in mainland Prepared for: Jorge Restrepo, CEO 2017 EurekaFacts LLC September 29, 2017 Climate refugees from Puerto Rico in US metropolitan
Norwegian's Free Airfare Promotion
 Norwegian's Free Airfare Promotion Start planning your next vacation with 200+ cruises to incredible destinations, including Alaska, Bahamas & Florida, Bermuda, Canada & New England, Caribbean, Mexican
District Match Data Availability
 District Match Data Availability National & State Data Location Available National Data Australia Parliament, Provincial and Territory Assemblies Canada Parliament, Provincial Legislative Assemblies New
Location, Location, Location. 19 th Annual NIC Conference NIC MAP Data & Analysis Service
 Location, Location, Location 19 th Annual NIC Conference NIC MAP Data & Analysis Service The Great Occupancy Decline 94% Occupancy Trends Majority Nursing Seniors Housing 93% 92% 91% 92.8% 91.0% 90% 89%
PORT SECURITY GRANTS Entity Legal Name City State Funding Horizon Lines of Alaska, LLC Anchorage AK $ 256,000 Southeast Stevedoring Corporation
 PORT SECURITY GRANTS Entity Legal Name City State Funding Horizon Lines of Alaska, LLC Anchorage AK $ 256,000 Southeast Stevedoring Corporation Anchorage AK $ 45,819 Horizon Lines of Alaska, LLC Dutch
Panama Canal Outlook. Jorge L. Quijano Administrator/CEO Panama Canal Authority
 Panama Canal Outlook Jorge L. Quijano Administrator/CEO Panama Canal Authority Japan November 21, 2014 Yesterday PANAMA AT A GLANCE GDP growth rate last 10 years 7.5% GDP (P) 2013 (billion of dollars)
Naval Facilities Engineering Command Small Business Professional Listing
 Command Small Business Professional Listing https://smallbusiness.navfac.navy.mil AZ Yuma ROICC Yuma Commanding PO Box 99129, Building 888 95369-9129 (928) 269-6448 Officer 11/13/2014 CA Alameda FEAD San
M+S Mehrtens & Schwickerath GmbH Bremen - Hamburg - Bremerhaven
 Port Alicante Savona Livorno Naples Monfalcone Heroya EU-WNA Loen EU-WNA Lindesnes N EUROPE USWC/BC Date: 09-May-2017 10:09 Antwerp 26-May 19-Jun Panama Canal 16-Jun 09-Jul Caldera Cri Corinto Puerto Quetzal
Higher Education in America s Metropolitan Areas A Statistical Profile
 Higher Education in America s Metropolitan Areas A Statistical Profile MSA Study No.2 Higher Education in America s Metropolitan Areas A Statistical Profile CONTENTS Why Metro Areas? 1 Executive Summary
State of the Waterway 2017
 State of the Waterway 2017 Steven W. Nerheim Director VTS Houston/Galveston Lone Star Harbor Safety Committee 2 FEBRUARY 2018 U.S. Port Rankings 2015 1 South Louisiana, LA, Port of 259.1-3.07% 15 Texas
Hector International Airport Fargo, North Dakota
 Hector International Airport Fargo, North Dakota Volume 073 Twelve Months Ended September 2007 January 2008 Airlines Serving Fargo Carried 831 Onboard Passengers Per Day for the Twelve Months Ended September
Major Metropolitan Area Sales Tax Rates
 August 19, 2010 No. 239 FISCAL FACT Major Metropolitan Area Sales Tax Rates By Lawrence Summers Introduction General sales taxes levied by state, county and city governments in the United States vary greatly,
Naval Facilities Engineering Command Small Business Professional Listing https://smallbusiness.navfac.navy.mil
 Command Small Business Professional Listing https://smallbusiness.navfac.navy.mil State City Office Name Mailing Address AZ Yuma ROICC Yuma Commanding PO Box 99129, Building 888 95369-9129 (928) 269-6448
Hector International Airport Fargo, North Dakota
 Hector International Airport Fargo, North Dakota Volume 072 Twelve Months Ended June 2007 November 2007 Airlines Serving Fargo Carried 830 Onboard Passengers Per Day for the Twelve Months Ended June 2007,
Louisiana BUILDING STRONG
 U.S. ARMY CORPS OF ENGINEERS BUILDING STRONG 2016 State Quick Facts (Tons in Millions) Tons Shipped - 256.7 Tons Received - 237.7 Tons Shipped Within State - 51.5 Total Commerical Docks - 781 Total Value
Appendix D: Aggregation Error for New England Metro Areas and for Places
 Appendix D: for New England Metro Areas and for Places D-1 Appendix D: s Figure D-1: New England Metro Areas - Summary of Tract s (2000) Metro ID (msapma99) Metro Area Name Census NCDB 1120 Boston, MA-NH
Naval Facilities Engineering Command Small Business Professional Listing
 Command Small Business Professional Listing https://smallbusiness.navfac.navy.mil AZ Yuma ROICC Yuma Commanding PO Box 99129, Building 888 95369-9129 (928) 269-6448 Officer 8/27/2018 CA Alameda FEAD San
The U.S. Waterway System 2014 TRANSPORTATION FACTS & INFORMATION
 The U.S. Waterway System 2014 TRANSPORTATION FACTS & INFORMATION Navigation and Civil Works Decision Support Center U.S. Army Corps of Engineers Published December 2015 U.S. Waterborne Traffic by Major
Access Across America: Transit 2014
 Access Across America: Transit 2014 Final Report CTS 14-11 Prepared by: Andrew Owen David Levinson Accessibility Observatory Department of Civil, Environmental, and Geo- Engineering University of Minnesota
POLLING LOCATIONS IN THE UNITED STATES
 CONSULATE IN ATLANTA POLLING LOCATIONS IN THE UNITED STATES Atlanta: Consulate General: 1117 Perimeter Center West, Northern Building Suite N411, Atlanta, GA 30338 Charlotte: Latin-American Coalition:
The 156 Arts & Economic Prosperity III Study Regions
 Full-Time Resident Local NATIONAL ESTIMATES OF ECONOMIC IMPACT $63,053,399,000 $103,145,088,000 $166,198,487,000 5,695,361 $104,234,116,000 $7,936,383,000 $9,140,633,000 AK City of Homer A 5,364 $1,248,208
1Q 2014 Greater Atlanta HBA Builder Developer Lender Council meeting Information presented by. Atlanta Job Growth
 1Q 2014 Greater Atlanta HBA Builder Developer Lender Council meeting 5-21-2014 Information presented by Eugene James, Regional Director ejames@metrostudy.com 404-510-1080 connect on LinkedIn Atlanta Job
Agency 35 ft. Over Artic. Trolley 2012 Total and 35 ft. under. 1 1 MTA New York City Transit 0 3, ,344 New York City
 Capital Metro-No. 40 Courtesy Capital Metro 1 1 MTA New York City Transit 0 3,704 640 0 4,344 New York City 2 3 New Jersey Transit Corp. 47 2,263 85 0 2,395 Newark, N.J. 3 2 Metro 50 1,956 378 0 2,384
Peak to Trough Price Decline of less that 10% Peak to Trough Price Decline between 10% and 20%
 Peak to Trough Price Decline of less that 10% Minimal Price Decline Pop. Rank Market Peak to Trough % Decline Current Rebound% 4 Dallas-Fort Worth-Arlington, TX -4.68% 115.17% 35 Austin-Round Rock, TX
BLACK KNIGHT HPI REPORT
 CONTENTS 1 OVERVIEW 2 NATIONAL OVERVIEW 3 LARGEST STATES AND METROS 4 FEBRUARY S BIGGEST MOVERS 5 20 LARGEST STATES 6 40 LARGEST METROS 7 ADDITIONAL INFORMATION OVERVIEW Each month, the Data & Analytics
For reports where vessels had an unspecified amount of crewmembers, the average of 22 crewmembers per ship was used for statistical purposes.
 eeeeeeeeeee The Seamen s Church Institute seamenschurch.org 2014 SHORE LEAVE SURVEY The Seamen s Church Institute 118 Export Street Port Newark, NJ 07114 TEL +1-973-589-5828 FAX +1-973-817-8565 seamenschurch.org
NICHOLAS BROWN Vice President, Development (516)
") CONSTRUCTION CONTACTS SOUTHERN NORTHERN D-ATLANTIC LEE JOHNSON (704) 362-6149 lbjohnson@kimcorealty.com NICHOLAS BROWN (516) 869-7266 nbrown@kimcorealty.com PAT CHRISTIE (516) 869-7130 pchristie@kimcorealty.com
CONSTRUCTION CONTACTS SOUTHERN NORTHERN D-ATLANTIC LEE JOHNSON (704) 362-6149 lbjohnson@kimcorealty.com NICHOLAS BROWN (516) 869-7266 nbrown@kimcorealty.com PAT CHRISTIE (516) 869-7130 pchristie@kimcorealty.com
NMEA CMET Dealers as of January 21, 2009 Arranged by state and then alpha ordered by company.
 CMET Dealer Name Address City State Zip Phone Communications North P.O. Box 2009 Seward AK 99664 (907) 224-8908 Radar Alaska 218 Shelikof St. Kodiak AK 99615 (907) 486-3892 Alcom Marine Electronics 711
Charleston, WV 18 Juneau, AK Peoria, IL Jefferson City,
 2004 Ranking Diocese Catholics Diocesan Seminarians 2004 Ratio (Catholics / Seminarians) 2003 Ranking 1 Lincoln, NE 89431 35 2555 2 2 Yakima, WA 68561 20 3428 5 3 Savannah, GA 75987 22 3454 13 4 Cheyenne,
Resear ch On the Evolution Pr ocess of U.S. Container Por t System
 DOI:10.15957/j.cnki.jjdl.2012.02.016 32 2 Vol.32 No. 2 2012 2 ECONOMIC GEOGRAPHY Feb. 2012 1 2 1 璠 1970 2009 1970 2009 1970 1981 1981 1995 1995 2006 2006 2009 1995 F552.7 A 1000-8462(2012)02-0094 - 07
TRANSATLANTIC NORTH EUROPE NETWORK
 TRANSATLANTIC NORTH EUROPE NETWORK May, 2017 TRANSATLANTIC NORTH EUROPE OVERVIEW NEUATL1 NEUATL2 NEUATL3 ANTWERP BREMERHAVEN ANTWERP ROTTERDAM FELIXSTOWE FELIXSTOWE BREMERHAVEN ANTWERP ROTTERDAM LE HAVRE
Beta Radiation in the United States Following the Fukushima Disaster. by Bobby1
 Beta Radiation in the United States Following the Fukushima Disaster by Bobby1 This is a statistical study of beta radiation in the United States following the Fukushima nuclear disaster. Its purpose is
(See Note 1) Solar Energy Factor (SEF D ) Solar Fraction (SF D ) Estimated Energy Savings SYSTEM DETAILS
 Solar Energy Factor (SEF D ) Solar Fraction (SF D ) Estimated Energy Savings SYSTEM DETAILS") OG-300 ICC-SRCC TM CERTIFIED SOLAR SYSTEM # SYSTEM INFORMATION Pumped Internal Backup: Gas Tank Collector Type: Glazed Flat Plate Solar Tank Volume: 379 liter (100 gal) Collector Heat Transfer Fluid: GRAS
OG-300 ICC-SRCC TM CERTIFIED SOLAR SYSTEM # SYSTEM INFORMATION Pumped Internal Backup: Gas Tank Collector Type: Glazed Flat Plate Solar Tank Volume: 379 liter (100 gal) Collector Heat Transfer Fluid: GRAS
ACS/2013/TRADE Customs Working Group.INFO.001 IMPACT OF THE WELCOME
 ACS/2013/TRADE Customs Working Group.INFO.001 IMPACT OF THE WELCOME Panama Logistic Center of the Americas Reaching the full potential of its geographical position Operational Results FY2011 FY2012 Transits
Hector International Airport Fargo, North Dakota
 Hector International Airport Fargo, North Dakota Volume 081 Twelve Months Ended March 2008 July 2008 Airlines Serving Fargo Carried 838 Onboard Passengers Per Day for the Twelve Months Ended March 2008,
eeeeeeeeeee SHORE LEAVE SURVEY The Seamen s Church Institute Center for Seafarers Rights
 eeeeeeeeeee The Seamen s Church Institute seamenschurch.org 2015 2014 SHORE LEAVE SURVEY The Seamen s Church Institute 118 Export Street Port Newark, NJ 07114 TEL +1-973-589-5828 FAX +1-973-817-8565 seamenschurch.org
U.S. Department of Homeland Security. Fiscal Year 2006 Infrastructure Protection Program
 U.S. Department of Homeland Security Fiscal Year 2006 Infrastructure Protection Program September 25, 2006 Table of Contents Infrastructure Protection Program Overview 02 Port Security Grant Program 06
State of the Waterway 2017
 State of the Waterway 2017 Steven W. Nerheim Director, VTS Houston/Galveston Lone Star Harbor Safety Committee 10 th February 2017 U.S. Port Rankings - 2014 (Millions of short tons) 1 Port of S Louisiana,
TOP 100. Transit Bus Fleets Agency 35 ft. Over Artic and 35 ft. Total +/- under 0 3, ,426 82
 L.A. Metro-No. 3 1 1 MTA New York City Transit New York City 2 2 New Jersey Transit Corp. Newark, N.J. 3 3 Metro Los Angeles 4 5 Toronto Transit Commission Toronto 5 10 Chicago Transit Authority Chicago
Fun By Home Port Ship Miami, Florida Dates Ship Fort Lauderdale, Florida Dates
 Fun By Home Port Ship Miami, Florida Dates Carnival Conquest 6-day Western Caribbean 5/05/19 7-day Eotic Eastern Caribbean 2019, 2020 7-day Eotic Western Caribbean 2019, 2020 Carnival Glory 7-day Eotic
The FMR history file contains the following fields, all for 2-bedroom FMRs. It is in EXCEL format for easy use with database or spreadsheet programs.
 The FMR history file contains the following fields, all for 2-bedroom FMRs. It is in EXCEL format for easy use with database or spreadsheet programs. GENERAL NOTES 1. There are no Fiscal Year 1984 FMRs
LEASING CONTACTS. Northern Region. Mid-Atlantic Region. Southern Region. Western Region
 Northern Region Mid-Atlantic Region JOSH WEINKRANZ, Northern Region (516) 869-7146 jweinkranz@kimcorealty.com DAVE SALVAGE Vice, Northern Region (617) 933-2821 dsalvage@kimcorealty.com TOM SIMMONS, Mid-Atlantic
Physical Oceanographic Real-Time System (PORTS ) Funding Model
 Funding Model") Physical Oceanographic Real-Time System (PORTS ) Funding Model Richard Edwing, Director Center for Operational Oceanographic Products and Services AAPA Harbors & Navigation Committee Meeting Jacksonville,
Physical Oceanographic Real-Time System (PORTS ) Funding Model Richard Edwing, Director Center for Operational Oceanographic Products and Services AAPA Harbors & Navigation Committee Meeting Jacksonville,
Communicating the Importance of Seaports. Bringin It Home. Presented to AAPA Annual Convention Galveston, TX October 27, 2009
 Communicating the Importance of Seaports Bringin It Home Presented to AAPA Annual Convention Galveston, TX October 27, 2009 Jim Kruse Director, Center for Ports & Waterways Texas Transportation Institute
Passengers Boarded At The Top 50 U. S. Airports ( Updated April 2
 (Ranked By Passenger Enplanements in 2006) Airport Table 1-41: Passengers Boarded at the Top 50 U.S. Airportsa Atlanta, GA (Hartsfield-Jackson Atlanta International) Chicago, IL (Chicago O'Hare International)
Summary of Findings in Local Green Building Incentives Spreadsheet. by Jessica Wentz Center for Climate Change Law Columbia Law School.
 Summary of Findings in Local Green Building Incentives Spreadsheet by Jessica Wentz Center for Climate Change Law Columbia Law School June 14, 2010 This paper accompanies the local green building incentives
Appendix A TRIP Urban Roads Report 2018
 Appendix A TRIP Urban Roads Report 2018 Pavement Conditions and Extra Vehicle Operating Costs for Urban Areas with Population of 500K or More Akron OH 49% 12% 14% 25% $837 Albany Schenectady Troy NY 15%
Census Affects Children in Poverty by Professors Donald Hernandez and Nancy Denton State University of New York, Albany
 Phone: (301) 457-9900 4700 Silver Hill Road, Suite 1250-3, Suitland, MD 20746 Fax: (301) 457-9901 Census Affects in Poverty by Professors Donald Hernandez and Nancy Denton State University of New York,
July air traffic statistics. Prepared by the Office of Corporate Risk and Strategy
 July 214 air traffic statistics Prepared by the Office of Corporate Risk and Strategy Air Traffic Statistics Table of Contents Summary Air Traffic Summary... 1 SH&E Air Traffic Schedule Activity... 3 Passenger
Population Estimates for U.S. Cities Report 1: Fastest Growing Cities Based on Numeric Increase,
 ulation s for U.S. Cities Report 1: Fastest Growing Cities Based on Numeric Increase, 2015-2015 1 Phoenix AZ 32,113 2.0 1,582,904 1,615,017 167,393 11.6 2 Los Angeles CA 27,173 0.7 3,949,149 3,976,322
Houston Economic Update. Presented by Patrick Jankowski Vice President, Research Greater Houston Partnership
 Houston Economic Update Presented by Patrick Jankowski Vice President, Research Greater Houston Partnership Houston Astros - Percent Regular Season Games Won Help from the bullpen this year Help from the
TOP 100 Bus Fleets Agency 35 ft. and Over Artic under 35 ft. Total. 18 < metro magazine SEPTEMBER/OCTOBER 2018 metro-magazine.
 1 1 MTA New York City Transit/MTA Bus Co. 0 4,860 951 5,811 New York City 2 3 New Jersey Transit Corp. 418 2,879 85 3,382 Newark, N.J. 3 2 Los Angeles County Metropolitan Transportation Authority 50 1,882
State Five Year Tonnage Trend. Shipping Tons Receving Tons Within Tons Total Tons
 U.S. ARMY CORPS OF ENGINEERS Louisiana BUILDING STRONG 2015 State Quick Facts (Tons in Millions) Tons Shipped - 243.4 Tons Received - 238.8 Tons Shipped Within State - 53.7 Total Commerical Docks - 835
I The shipping market contents ISL
 Comment - Charts and Tables concerning The Shipping Market World Merchant Fleet Tanker Market Bulk Carrier Market Tab. 1 Additions/Reductions by Ship Types 2014-2016 and up to June 2017... III Tab. 2 Size
Park-Related Total* Expenditure per Resident, by City
 Park-Related Total* per Resident, by City FY 2008 City Population Total Park per Resident Washington, D.C. 591,833 $153,324,830 $259 Seattle 598,541 $150,672,543 $252 Scottsdale 235,371 $50,429,049 $214
Initial Locations of 2020 Area Census Offices
 1 of 6 Anchorage* AK At Large Birmingham* AL 007 Huntsville AL 005 Mobile AL 001 Fayetteville AR 003 Little Rock AR 002 Flagstaff AZ 001 Window Rock AZ 001 Maricopa (Central)* AZ 006 Maricopa (South) AZ
PUBLIC TRANSPORTATION INTRODUCTION
 PUBLIC TRANSPORTATION INTRODUCTION 1 OUTLINE Current Status and Recent Trends Significant Influences A Critical Assessment Arguments Supporting Public Transport Future Influences Ingredients for Future
RE/DEVELOPMENT CONTACTS
 WESTERN NORTHERN D-ATLANTIC CURT TAYLOR (425) 373-3507 ctaylor@kimcorealty.com MARK WENDEL (949)252-3870 mwendel@kimcorealty.com CHAEL STRAHS (650) 746-7501 mstrahs@kimcorealty.com NICHOLAS BROWN (516)
333 W. Campbell Road, Suite 440 Richardson, Texas Cruising for Charity with Randy Limbacher in Tahiti July 28, 2007
 333 W. Campbell Road, Suite 440 Richardson, Texas 75080 972.238.1998 800.952.1998 Cruising for Charity with Randy Limbacher in Tahiti July 28, 2007 Join me for this special annual event to raise money
CONSTRUCTION CONTACTS
 SOUTHERN NORTHERN D-ATLANTIC LEE JOHNSON (704) 362-6149 lbjohnson@kimcorealty.com NICHOLAS BROWN (516) 869-7266 nbrown@kimcorealty.com T CHRISTIE (516) 869-7130 pchristie@kimcorealty.com TRISHA MURRAY
ALN Apartment Data, Inc. (Continued on next page)
") AK - Anchorage 93.0% 90.9% -210-2.2% $1,035 $1,018-1.7% 93.0% 90.9% -210-2.2% $1,035 $1,018-1.7% AK - Misc. AK 90.3% 86.8% -350-3.8% $1,218 $1,245 2.3% 90.3% 86.8% -350-3.8% $1,218 $1,245 2.3% Alaska Average
AK - Anchorage 93.0% 90.9% -210-2.2% $1,035 $1,018-1.7% 93.0% 90.9% -210-2.2% $1,035 $1,018-1.7% AK - Misc. AK 90.3% 86.8% -350-3.8% $1,218 $1,245 2.3% 90.3% 86.8% -350-3.8% $1,218 $1,245 2.3% Alaska Average
Rapid Maritime Response
 Rapid Maritime Response presented to 13 th MACHC Katie Ries Coast Survey is set up for rapid maritime response Navigation managers coordinate activities and assets with Coast Guard, port officials,
The Panama Canal Update: Some Implications for Western Hemisphere Trade
 The Panama Canal Update: Some Implications for Western Hemisphere Trade April 18, 2011 Today s Objectives Provide a brief synopsis of the potential effects of the expanded Panama Canal on Hemispheric trade
CLIA 2006 Forecast. Terry Dale, President & CEO. San Diego February 8, 2006
 CLIA 2006 Forecast Terry Dale, President & CEO San Diego February 8, 2006 2005 Sustained Growth Six Vessels Joined CLIA Cruise Fleet 3 new ships launched Carnival Liberty Norwegian Jewel Pride of America
US Housing Overview. October 7, Toby Morrison. Regional Sales Director MARKET INTELLIGENCE
 US Housing Overview October 7, 2010 Toby Morrison Regional Sales Director 480-415-2578 MARKET INTELLIGENCE www.hanleywood.com www.builderinfostore.com Agenda National Overview Remodel & New Construction
NORTHEAST REGION. Leasing Contacts. NY Metro Region. New England Region. TOM PIRA Senior Director - Real Estate (516)
") NORTHEAST JOSH WEINKRANZ (516) 869-7146 jweinkranz@kimcorealty.com ME TOM PIRA Senior Director - Real Estate (516) 869-2516 tpira@kimcorealty.com NORTHEAST DAVE SALVAGE Vice & Asset Management (617) 933-2821
NORTHEAST JOSH WEINKRANZ (516) 869-7146 jweinkranz@kimcorealty.com ME TOM PIRA Senior Director - Real Estate (516) 869-2516 tpira@kimcorealty.com NORTHEAST DAVE SALVAGE Vice & Asset Management (617) 933-2821
Alabama Y Y Birmingham-Hoover, AL Y Y. Alaska N/A. Arizona N Y Phoenix-Mesa-Scottsdale, AZ N Y Tucson, AZ N Y
 - requires bidders to obtain out of state Alabama Y Y Birmingham-Hoover, AL Y Y Alaska Arizona N Y Phoenix-Mesa-Scottsdale, AZ N Y Tucson, AZ N Y Arkansas Y N Little Rock-North Little Rock, AR Y N Memphis,
RANKING OF THE 100 MOST POPULOUS U.S. CITIES 12/7/ /31/2016
 OVERVIEW OF THE DATA The following information is based on incoming communication to the National Human Trafficking Hotline via phone, email, and online tip report from December 7, 2007 December 31, 2016
SAMPLE SAMPLE. Metro Housing Starts Forecast Chartbook October
 2.5 Metro Housing Starts Forecast Chartbook 2016-2018 October 2016 2.0 1.5 0.5 1990 1994 1998 2002 2006 2010 2014 2018 www.housingeconomics.com Table of Contents (Metro Housing Starts Forecasts and Economic
Oct-17 Oct-18 bps %CHG Oct-17 Oct-18 %CHG Oct-17 Oct-18 bps %CHG Oct-17 Oct-18 %CHG
 AK - Anchorage 92.6% 89.9% -270-2.9% $1,023 $1,011-1.2% 92.6% 89.9% -270-2.9% $1,023 $1,011-1.2% AK - Misc. AK 89.9% 85.8% -410-4.6% $1,227 $1,230 0.2% 89.9% 85.8% -410-4.6% $1,227 $1,230 0.2% Alaska Average
THE CRUISE INDUSTRY IN
 Economic Benefit of the Cruise Industry in Alaska Alaska benefits from the cruise industry as the premiere cruise destination market in the United States. In 2010, Alaska accounted for $930 million in
Metropolitan Votes and the 2012 U.S. Election: Population, GDP, Patents and Creative Class
 politan Votes and the 2012 U.S. Election: Population, GDP, Patents and Creative Class Author: Shawn Gilligan, Shawn.Gilligan@rotman.utoronto.ca Zara Matheson, Zara.Matheson@rotman.utoronto.ca Kevin Stolarick,
Mango Market Development Index
 Mango Market Development Index 2016-2017 Understanding the Market Index The Mango Market Development Index is designed to measure and compare mango volume sold at retail relative to population by region
air traffic statistics
 December 213 air traffic statistics Prepared by the Office of Finance Department of Internal Controls, Compliance and Financial Strategy Commercial Total Dom Int'l Passengers % Change Air Traffic Summary
Per capita carbon emissions from transportation and residential energy use, 2005
 Per capita carbon emissions from transportation and residential energy use, 2005 Metropolitan Area Carbon Footprint Honolulu, HI 1 1.356 Los Angeles-Long Beach-Santa Ana, CA 2 1.413 Portland-Vancouver-Beaverton,
Florida's Scheduled Commercial Service Airports
 Florida's Scheduled Commercial Service Airports Volume 154 May 2016 - Domestic Airlines Serving Florida Carried 170,726 Onboard Passengers Per Day for, up 7.7% over the previous 12 months. Highlights in
MANGO MARKET DEVELOPMENT INDEX REPORT
 MANGO MARKET DEVELOPMENT INDEX REPORT 2015-2016 UNDERSTANDING THE MARKET INDEX The Mango Market Development Index is designed to measure and compare mango sales volume relative to population by region
METROPOLITAN STATISTICAL AREA
 Miami-Fort Lauderdale-West Palm Beach METROPOLITAN STATISTICAL AREA Broward County is part of the 8th largest metropolitan statistical area (MSA)() in the country with a population just over 6M in 2016.
Northeast Region. JOSH WEINKRANZ President, Northeast Region (516)
") LEASING CONTACTS Western Region ARMAND VASQUEZ, Western Region (916) 580-2534 avasquez@kimcorealty.com CARMEN DECKER Vice, Pacific Northwest Region (425) 373-3511 cdecker@kimcorealty.com JOHN WELTER Vice,
LEASING CONTACTS Western Region ARMAND VASQUEZ, Western Region (916) 580-2534 avasquez@kimcorealty.com CARMEN DECKER Vice, Pacific Northwest Region (425) 373-3511 cdecker@kimcorealty.com JOHN WELTER Vice,
Who Sprawls the Most?
 SPRAWL AMERICAN STYLE Who Sprawls the Most? Jackie Cutsinger Research Assistant, Center for Urban Studies Wayne State University Measuring Sprawl in Major Metros Regionally stratified, nationally representative
Port of Stockton Commissioner Travel FY
 FY 2014-2015 November 9-13, 2014 Annual Houston, TX October 6, 2014 Trip Pending September 28 to October 2, 2014 Breakbulk Houston, TX Griffen October 6, 2014 * $0.00 ** September 28-30, 2014 Western Plan
August air traffic statistics. Prepared by the Office of Corporate Risk and Strategy
 August 214 air traffic statistics Prepared by the Office of Corporate Risk and Strategy Metropolitan Washington Airports Authority Air Traffic Statistics Table of Contents Summary Air Traffic Summary...
June Air Traffic Statistics. Prepared by the Office of Corporate Risk and Strategy
 June 214 Air Traffic Statistics Prepared by the Office of Corporate Risk and Strategy Air Traffic Statistics Table of Contents Summary Air Traffic Summary... 1 SH&E Air Traffic Schedule Activity... 3 Passenger