Managing Director s Review...3. Business idea, vision, values...4. The most remarkable events of Passenger volume at regular level...
|
|
|
- Job Austen Melton
- 6 years ago
- Views:
Transcription
1
2 Table of contents Managing Director s Review...3 Business idea, vision, values...4 The most remarkable events of Passenger volume at regular level...6 Positive trend continued in cargo transports...7 Long-term leasing agreements on warehouses...8 Development of operations continued in the Port organisation...9 Co-operation for improved port safety...10 Environmental protection belongs to the quality of operations...11 Environmental statement Key figures and graphs Port of Turku s financial statements were positive...16 Profits and loss account...17 Balance sheet Statement of source and application of funds (indirect)...20

3 Managing Director s Review Port of Turku Ltd is a limited liability company wholly-owned by the City of Turku whose line of business is maintenance of the port, port operations, safety and development, and other business operations related thereto. Operating year 2016 was still a challenging one for Finland s economy. Nevertheless, the turnover and operating profit of the port enterprise increased on the previous year. Turnover amounted to 22 million euros, up by 7.4 per cent. Operating profit stood at 5.2 million euros, and the result of the financial year was 1.6 million euros. The positive development was particularly supported by the growth of cargo transports as well as the rationalisation of Port of Turku Ltd s own operations and partly the sale of the dredging equipment. The growth of around 5 per cent in cargo transports mainly accumulated from the increased German traffic, as Finnlines raised the number of its regular vessel calls to four per week. In addition to unit cargo, the Port strengthened its position as the port for demanding project shipments of the Finnish industry. The passenger volume through the Port of Turku reached the satisfactory level of the previous years. In 2016, some 3.3 million passengers travelled via the Port. Viking Line Oyj announced in late 2016 that it has signed a letter of intent on ordering a new vessel. The vessel to replace m/s Amorella will be bigger and have higher capacity than m/s Viking Grace and is due for completion in spring In 2016, traffic planning in Kanavaniemi was initiated to make car traffic smoother and improve the service level in the passenger harbour. The project is linked to the EU-supported NextGen project which will update the existing sea connection between the ports of Turku, Mariehamn and Stockholm. Aimed at improving the sustainability and environmental soundness of maritime traffic, the project is co-ordinated by Port of Turku Ltd. The other partners are the aforementioned ports and Viking Line. In 2017, we expect Port of Turku Ltd s turnover to continue to grow. The cargo transport volume will be further increased by the growth of liner traffic to Germany and other destinations, and the recovery of domestic demand will increase the cargo volume on our Scandinavian routes. Passenger volumes are expected to stay at their current level next year, until Viking Line s new ship will give a significant boost to our Swedish route in Christian Ramberg, Managing Director 3
4 Business idea, vision, values BUSINESS IDEA The Port of Turku acts as a flexible centre of maritime traffic and promotes the competitiveness of the business world. We create the best prerequisites for passenger traffic and cargo transports. The company operates in the maintenance of the port, running and developing port operations, and other business related thereto. Port of Turku Ltd is a limited liability company whollyowned by the City of Turku. VISION The operations of the Port of Turku focus on functions that support passenger traffic and the transports of processed products. In these areas the Port of Turku is the best alternative in the economic region. VALUES The operations of the Port of Turku are based on reliability, customer-orientation, expertise, renewal, responsibility, and profitability. KEY FIGURES Turnover, MEUR Change % Business surplus, MEUR of turnover % Result, MEUR Investments Equity ratio % No. of personnel, on average KEY INDICATORS MUUTOS % No. of personnel Of which permanent employees Administration Vessel traffic services Operational services Technical services Turnover / person 286, ,


5 Finnlines increased both the capacity and departures on the Turku Germany route. M/s Gabriella replaced m/s Amorella and m/s Viking Grace during their docking from 19 January 10 February. Continuous noise measurement was tested in Pansio on 1 February. Port joined LinkedIn on 2 February. Port joined Twitter on 9 February. New environmental permit was granted to the Pansio Harbour on 4 April. NaviGate fair, Turku, May. Cruise liner m/s Deutschland, 8 June. Cruise liner m/s Albatros, 15 June. Cruise liner m/s World, 17 June. M/s Gamle Oksøy visited Turku on 28 June. JANUARY FEBRUARY MARCH APRIL MAY JUNE The most remarkable events of 2016 JULY AUGUST SEPTEMBER OCTOBER NOVEMBER DECEMBER Cruise liner m/s Artania, 1 July. Swan Regatta in Turku from July. Harbour icebreaker s/s Turso visited Turku on 6 August. Power Truck Show, Alahärmä, August. Cruise liner National Geographic Orion, 13 August. Cruise liner National Geographic Orion, 27 August. Port of Turku shipping days, 1 September. Open Port event, 18 September. Road fuel gas filling station in Turku was opened on 26 October. Renovation of shelter no. 180 commenced on 1 November. Permission for construction of noise barrier was approved on 3 November. Viking Line announced having signed a letter of intent on a new ship for the Turku Stockholm route on 23 November. The logistics prizes of the Turku Chamber of Commerce were distributed at the Port of Turku s calendar party on 24 November. Port Calendar 2017 was published. Jaakko Nirhamo, M.Sc. (Tech.), was appointed Sales Director of the Port of Turku. Major incident exercise in the Port of Turku on 7 December. Viking Strandfelt was elected the Port Hampuusi of 2016 on 13 December.

6 Passenger volume at regular level The Port of Turku is the leading Finnish port for passenger traffic between Finland and Sweden. There are four daily departures from Turku via Åland islands to Stockholm, two in the morning and two in the evening. Known for its great vistas, the archipelago route is operated by two shipping companies, Tallink Silja Oy and Viking Line Abp. In addition to regular liner traffic, passengers are brought to the Port of Turku by the cruise liner companies operating in the Baltic Sea. ROUTE TO SWEDEN IS STILL POPULAR AMONG TRAVEL- LERS The passenger volume through the Port of Turku reached the satisfactory level of the previous years. In 2016, some 3.3 million passengers travelled via the Port of Turku, which indicates that the route between Turku and Stockholm is still an attractive alterna-tive to the other tourist routes between Finland and the neighbouring countries. The short and fast sea voyage enables a diverse offering of cruise products both for leisure and conference travel. SHIPPING COMPANIES RENEWED THE VESSELS ON THE ROUTE The popularity of the Port of Turku s passenger traffic is also maintained by the willingness of the shipping companies to renew their vessels and services with a keen ear to the customers wishes. Tallink Silja Oy updated m/s Galaxy s restaurants in spring 2016 and the project continues on m/s Baltic Princess during spring Of Viking Line s vessels, the biggest changes took place on m/s Viking Amorella where the restaurants were refurnished and part of the cabins were fitted with double beds. On m/s Viking Grace the popular spa department was expanded. A NEW VESSEL ARRIVING IN 202 Viking Line Abp announced in late 2016 that it has signed a letter of intent on ordering a new vessel. Planned for the Turku Stockholm route, the new ship will be 218 metres long and have room for 2,800 passengers. Due for completion in spring 2020, the vessel will allow for the development of the passenger traffic in the Port of Turku and considerably increase the cargo capacity and enhance the environmentally sound operations. CRUISE TRAFFIC FOCUSED ON THE SUMMER MONTHS The Port of Turku s cruise season started on 10 June and ended on 4 September. There were a total of eight cruise liner calls during the summer, the same number as in They brought some 4,400 cruise passengers to Turku. Viking Line Abp announced in late 2016 that it has signed a letter of intent on ordering a new vessel. 6

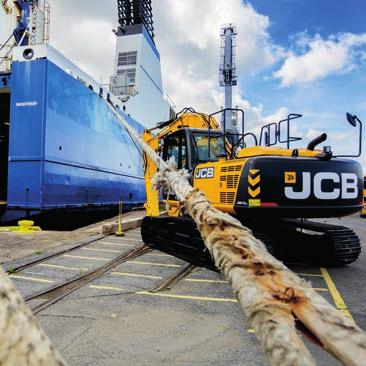
7 Positive trend continued in cargo transports The Port of Turku offers a fast and cost-efficient route for import and export shipments of trade and industry. High-frequency liner traffic to Scandinavia and Germany and the connections to ocean lines add flexibility to transport schedules and strengthen the delivery performance of companies. The Port s good inland connections provide added value especially for domestic distribution and other operators in the transport chain for whom time matters. THE BIGGEST GROWTH IN LINER TRAFFIC TO GERMANY Cargo transports via the Port of Turku developed positively in Due to increase in exports, the total cargo volume grew by around 5 per cent. Unit cargo transports rose by nearly 9 per cent, most of which came from the increased German traffic. The growth was accelerated by the increase of Finnlines vessel calls to four per week and significant growth of the cargo capacity. INVESTMENT IN PROJECT SHIPMENTS PAID OFF In addition to unit cargo, the share of project shipments that require careful load handling has increased in the Port of Turku s cargo transports. Most of those are export shipments of the heavy industry to Europe as well as Asian and American markets. Items exported via Turku include e.g. mining equipment, processed steel products, and forest industry products. INVOLVED IN THE SUCCESS OF MARITIME INDUSTRY The success of the Turku region maritime cluster is also visible in the operations of the Port of Turku. The Meyer Turku shipyard and its subcontractors use the Port s services as part of their materials management. More than one thousand cabin modules ready for installation in vessels are in intermediate storage in the Port area. Furthermore, some of the shipyard s subcontractors use the services of the logistics companies operating in the Port, especially Turku Free Zone Company. NEW VESSELS SUPPORT THE DEVELOPMENT OF TRAFFIC The diverse stock of vessels of the shipping companies operating in Turku offers plenty of capacity for the needs of both project shipments and unit cargo. During 2017, e.g. Baltic Line and Mann Lines will renew their stock of vessels. The first new ship is Baltic Line s m/v Baltic Madonna. The new vessel sails from Turku to Norway in alternating weeks with m/v Mini Star which is also being replaced by a new vessel during the spring. Furthermore, Mann Lines will introduce a new ship on its route from Turku via Bremerhaven to Harwich in the summer. Due to increase in exports, the total cargo volume grew by around 5 per cent. Unit cargo transports rose by nearly 9 per cent. 7

8 Long-term leasing agreements on warehouses The Port of Turku s business operations also include the leasing of land areas and buildings held by the company. In 2016, the leasing agreements of the Port s own warehouses were renewed with durations set for periods of 2 10 years. The longest leasing agreement was made on warehouse shelter 180 which was renovated during the year as a raw materials warehouse as per modern requirements. Thanks to the new agreements, the Port s own warehouse capacity is fully booked to the year If required, however, the Port s storage capacity can be quickly increased. The development of the Port s cargo transports also has a positive effect on the high utilisation rate of the private warehouses and terminals in the area. In addition, a large amount of new warehouse space is being built in the immediate vicinity of the Port. The new unheated Best hall of Turku Free Zone Company was introduced at the end of January 2017, and the construction work of another hall with geothermal heating will be completed in late summer. BIG PROJECTS PROCEEDED AS PLANNED The Port of Turku participates in the EU-supported ScanMed project which helps to prepare for the tightening of the environmental regulations in seafaring, especially regarding waste water reception. New vessels must drain their waste water on land by 2019 at the latest, and from 2021 on the rule will concern all passenger vessels sailing in the Baltic Sea. A joint project of several ports promotes the use of LNG in maritime traffic and offering on-shore electricity to vessels. One of the partners is Viking Line which signed a letter of intent on ordering a new vessel in late The intention is to create a new kind of a ro-ro passenger vessel concept that responds to the needs of both cargo and passenger traffic, taking into account the sensitive environment of the Baltic Sea. The biggest development project for cargo transports concerned the Port s crane services. The Port s container and multi-function cranes went through comprehensive basic repairs, including modernisation of the crane logic to meet the current requirements. The crane project will be completed in summer The Port of Turku surveyed together with Neste Jacobs the user potential of LNG in the Turku region. In the survey the readiness of local shipping companies, industrial players and thermal energy plants for the use of LNG was mapped broadly. The results of the survey speak for building a small-scale LNG terminal in the Port of Turku. The utilization rate of the Port s storage space is high. If required, however, the Port s storage capacity can be quickly increased. 8

9 Development of operations continued in the Port organisation The Port of Turku continued the operations development process initiated in 2015 for enhancing the customer service and practical activities of the port enterprise. The work tasks were specified and team work was renewed e.g. by increasing the co-operation of Port Control, crane operators and technical maintenance services. The channels between the personnel and management are the Port s co-operation team and the occupational safety committee, which participated actively in the development of the personnel issues. The evaluation of the training needs of the personnel proceeded as planned, with the aim to strengthen the know-how of the whole personnel, also with a view to the future needs. During the year under review, the starting of voluntary, regular age-based check-ups was prepared as part of maintenance of well-being at work and support for coping at work. The check-ups intended for those over 45 are planned to be organised every three years. The customer satisfaction survey carried out in 2016 indicates that the personnel have committed themselves to the Port s strategic goals. In a survey completed in the autumn the Port of Turku received the best ratings e.g. for willingness to serve and contacts with customers, which is why the Port of Turku is appreciated as an easy and reliable partner. At the end of 2016, the Port of Turku had 77 employees, which was 3 persons less compared with the previous year. At the end of 2016, Board members elected by the Annual General Meeting of Port of Turku Ltd were Arja Iho, Satu-Maarit Hilden, Turja Lehtonen, Maria Puhakka and Jarmo Tamminen. The Chair of the Board was Marjukka Karttunen. The Vice Chairman was Petja Raaska who was appointed to replace Jukka Mikkola who resigned. The Board convened 12 times in

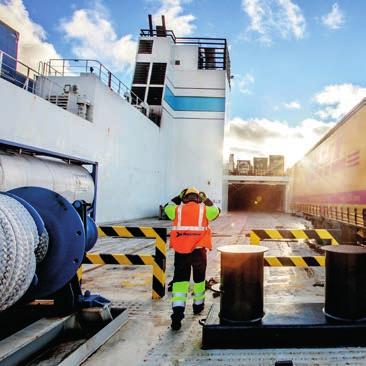
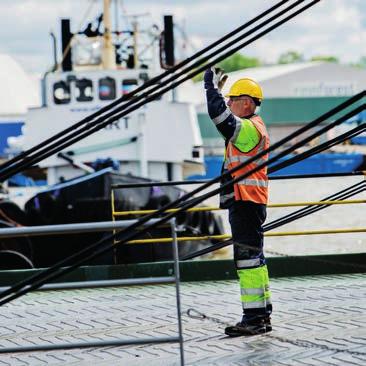
10 Co-operation for improved port safety The goal of the Port of Turku s safety measures is to guarantee the safety of people, vessels and property in the port and on fairways. The port area is equipped with 24-hour video surveillance and an access control system in accordance with the ISPS regulations. The safety of maritime traffic on port fairways is secured by the VTS radar system that covers the commercial fairways. Safety work in the Port means above all anticipation and prevention of dangerous situations together with different authorities and other players in the port. THE HAZARD PROJECT TIES THE BALTIC SEA PORTS TO- GETHER The Port of Turku participates in the EU-supported HAZARD project that focuses on the prevention and management of accidents. The three-year project started in March 2016 and aims at improving port safety in the Baltic Sea region ports. Headed up by the Turku School of Economics, the project involves ports, emergency departments, logistics players and academic partners from seven Baltic Sea region countries. Partners from Southwest Finland in addition to the Turku School of Economics are the Ports of Turku and Naantali, Southwest Finland Emergency Services, and Neste Corporation Logistics. CO-OPERATION BETWEEN THE AUTHORITIES IMPROVED IN AN EXERCISE One of the goals of the HAZARD project is to standardise the safety practices and facilitate working with the continuously changing and amended safety regulations and requirements. These goals are aimed at e.g. through joint exercises of the port operators and emergency authorities. Co-operation between different organisations is challenging and hence practising is necessary. To enhance the co-operation, Southwest Finland Emergency Services arranged a major emergency exercise in the Port of Turku on 7 December The purpose was to simulate an ammonia leak in the West Harbour, the resulting odour of which caused a panic in the passenger terminal. In addition to actual rescue operations, the exercise involved efficient communication between the contributing organisations, which is a requirement for functioning co-operation and managing a major emergency situation. During the project, similar major emergency exercises will be arranged in Turku, Naantali, Klaipeda and Hamburg. The emergency services and ports or port operators of those cities will participate in the project. The three-year project started in March 2016 and aims at improving port safety in the Baltic Sea region ports. 10

11 Environmental protection belongs to the quality of operations The Port of Turku s environmental work focuses on water protection in the Baltic Sea, reduction of emissions into air and improvement of energy-efficiency. The individual measures for improving environmental issues and minimising the environmental impacts are determined in the Port s environmental programme. In addition, the Port draws up annually an environmental report which collects the measures and follow-up implemented during the year. QUALITY AND ENVIRONMENTAL SYSTEMS WERE SUCCESS- FULLY UPDATED The development of the Port of Turku s environmental and safety issues is based on an operations system certified by DNV GL. In 2016, reassessment and certification of the systems in accordance with the ISO and ISO 9001 standards were performed. As a result, the Port s quality and environmental management systems have now been updated to match the newest standards. ADDITIONAL CAPACITY FOR WASTE WATER RECEPTION The Port of Turku has had fixed waste water reception points for passenger vessels since the 1980s. As part of the EU-funded ScanMed environmental project, three new reception points were built in 2016 on the berths used by cargo traffic and cruise liners in the West Harbour and the Linnanaukko area. Enhancing waste water collection is part of the ScanMed project which aims at improving the state of the Baltic Sea. ENERGY SAVINGS FROM ENHANCED LIGHTING Reducing the energy consumption in port operations and buildings is part of the Port of Turku s environmental work. In 2016, energy efficiency was improved e.g. by using LED technology in the lighting of the port area and upgrading the lighting control. Despite the increased lighting power the energy consumption of lighting has been halved. Port charges guide to cleaner seafaring The Port of Turku is one of the few Finnish ports that apply environmental port charges. Discounted port charges encourage the shipping companies to introduce technology for reducing nitrogen oxide emissions. In 2016, the Port granted environmental discounts of around 450,000 euros. 11
12 Environmental statement Revenue, Eur Cost, Eur Investments, Eur 1. Air and climate protection 7, Water protection and waste water processing 57, , Waste management and littering 38,579 76, Soil and ground water protection 5. Noise and vibration abatement 41,944 22, Nature and landscape protection 7. Official duties of environmental protection 8. Promotion of environmental protection 9, , ,473 TOTAL 47, , , Environment-based taxes and fiscal charges Waste tax 514 Fuel tax 16,030 Electricity tax 52,405 ENVIRONMENTAL OPERATING COSTS TOTAL 68,949 Environmental protection devices (investments) depreciation Protection of fairway ramps against erosion 3,435 Filling embankments 46,515 Renovation of the premises 10,518 Environmental construction, Pansio 2,811 Embankment basin, stabilisation, Pansio 138,873 Environmental construction, West Harbour 7,959 Depreciation other investmenst 68,986 DEPRECIATION TOTAL 279,097 TOTAL 47, , ,578 12
13 Key figures and graphs Financial statement 13
14 Graphs 2,8 Goods traffic, mill. tonnes 2,6 2,4 2, Goods traffic, 2,5 mill. tonnes 15 % 20 % 65 % Car Autolautta ferry Ro-Ro Others Muut No. of trucks, pcs Passenger traffic, mill. people
15 2500 No. of vessel calls, pcs Average vessel net tonnage, NT No. of personnel of Port of Turku Turnover/person
16 Port of Turku s financial statements were positive Year 2016 was financially positive for Port of Turku Ltd. The company s turnover increased by 7.4 per cent to stand at 22.0 million euros (2015: MEUR 20.5). Thanks to the positive development of turnover, operating profit grew by 53.9 per cent to 5.2 million euros (2015: MEUR 3.4) despite the challenging market conditions. The company s investments in the financial year amounted to 2.8 million euros, the most significant of which were the building of on-shore electricity supply and reception of wastewater from cruise liners. POSITIVE TONE WAS ALSO VISIBLE IN TRAFFIC VOLUME Deviating from the industry trend, total traffic through the Port of Turku increased by 4.9 per cent to 2.5 million tonnes. Exports accounted for 1.1 million tonnes and imports for 1.4 million tonnes. The growth was positively affected e.g. by the development of Finnlines traffic on the Turku Travemünde route. A total of 3.3 million passengers (-0.5%) travelled through the Port, and the number of vessel calls was 2,006 (+6.25%). The company employed on average 76 (77) persons during the financial year. Turnover and business surplus (eur, million) Liikevaihto Turnover Liikevoitto Business surplus Investments (eur, million)
17 Profits and loss account TURNOVER 22,033, ,515, Production for own use 156, , Other operating income 978, , Materials and services Materials, equipments and goods Purchases during the financial period -260, , External services -2,185, ,437, Materials and services total -2,446, ,925, Personnel costs Salaries and remunerations -3,535, ,589, Indirect employee costs Pension expenses -920, , Other indirect employee costs -193, , Personnel costs total -4,649, ,668, Depreciation and write-downs Other operating expenses -6,009, ,777, Depreciation and write-downs total -6,009, ,777, Other operation expenses -4,813, ,586, OPERATION PROFIT (LOSS) 5,248, ,411, Financing income and expenses Other interest and financial income From companies in the same group From others 10, , Interest costs and other financial expenses To companies in the same group -3,627, ,264, To others -5, , Financial income and costs total -3,622, ,266, OPERATING PROFIT (LOSS) BEFORE EXTRAORDINARY ITEMS 1,626, ,144, OPERATING PROFIT (LOSS) BEFORE APPROPRIATIONS AND TAXES 1,626, ,144, Appropriations Increase (-) or decrease (+) in depreciation difference Appropriations total Income taxes Income taxes Income taxes total PROFIT FOR THE FINANCIAL PERIOD 1,626, ,144,
18 Balance sheet ASSETS FIXED ASSETS Intangible assets Goodwill 18,946, ,104, Intangible assets total 18,946, ,104, Tangible assets Buildings and structures 13,745, ,509, Fixed structures and fixtures 36,899, ,398, Machines and equipment 1,684, ,095, Advance payments and unfinished purchases 1,173, , Tangible assets total 53,503, ,031, Investments Receivables from companies in the same group 121, , Shares in associated companies 609, , Investments total 731, , FIXED ASSETS TOTAL 73,181, ,857, CURRENT ASSETS Short-term receivables Sales receivables Sales receivables from companies in the same group 63, , Sales receivables from elsewhere 1,606, ,462, Other receivables Other receivables from companies in the same group 13,262, ,244, Other receivables from elsewhere 460, , Adjusting entries for assets Adjusting entries for assets from companies in the same group 28, Adjusting entries for assets from elsewhere 221, ,939, Short-term receivables total 15,614, ,749, Cash in hand and at banks , CURRENT ASSETS TOTAL 15,615, ,755, ASSETS TOTAL 88,797, ,612,
19 Balance sheet SHAREHOLDERS EQUITY AND LIABILITIES SHAREHOLDERS EQUITY Share capital 100, , Chargeable equity issue Other reserves Invested unrestricted equity fund 23,241, ,241, Profit (loss) from previous financial periods 2,301, ,556, Profit (loss) for the financial period 1,626, ,144, SHAREHOLDERS EQUITY TOTAL 27,269, ,042, ACCRUED APPROPRIATIONS Depreciation difference LIABILITIES Long-term liabilities Liabilities to companies in the same group 54,800, ,800, Other long-term liabilities 23,638.,84 9, Non-current liabilities total 54,823, ,809, Short-term liabilities Accounts payable To companies in the same group 586, , To others 861, , Other liabilities To companies in the same group 1,000, ,000, To others 416, , Adjusting entries for liabilities To companies in the same group 2,645, , To others 1,193, ,208, Short-term liabilities. total 6,703, ,760, LIABILITIES TOTAL 61,527, ,569, SHAREHOLDERS EQUITY AND LIABILITIES TOTAL 88,797, ,612,
20 Statement of source and application of funds (indirect) Profit/loss before extraordinary items (+/-) 1,626, ,144, Adjustments of operating profit 8,929, ,043, Depreciation according to plan 6,009, ,777, Financial income and expenses 3,622, ,266, Other adjustments -701, Cash flow before change in working capital 10,556, ,188, Change in working capital 92, ,766, Addition/reduction of short-term interest-free receivables -2,865, ,499, Addition/reduction of short-term interest-free liabilities 2,957, , Cash flow from operations before financial items and taxes 10,648, ,422, Paid interest and charges from other financial costs of operations -3,632, ,270, Interest received from operations 10, , Cash flow before extraordinary items 7,026, ,155, Cash flow from operations 7,026, ,155, Investments in tangible and intangible assets -4,554, ,032, Transfer of tangible and intangible assets 932, Investments in other investments (-) -9, , Investment cash flow -3,631, ,154, Repayments of short-term loans (-) -1,000, ,000, Dividends paid and other profit distribution (-) -2,400, Financial cash flow -3,400, ,000, Change in financial assets, addition (+) / reduction (-) -4, , Financial assets at the beginning of the financial year 5, , Financial assets at the end of the financial year ,
21 21
22 ANNUAL REPORT 2016 Juhana Herttuan puistokatu 21, FI TURKU Tel
Annual General Meeting. 13 June 2017
 Annual General Meeting 13 June 2017 Agenda 1. Approval of the Annual Report of the financial year 2016 of AS Tallink Grupp 2. Proposal on distribution of profits 3. Extension of authorities of the members
PORT OF HELSINKI ALL OF FINLAND WITHIN YOUR REACH
 PORT OF HELSINKI ALL OF FINLAND WITHIN YOUR REACH PORT OF THE ENTIRE FINLAND One of the strengths of the Port of Helsinki is its excellent location at the heart of Finnish production, population and consumption.
VR Group s result for 2018 was excellent rail traffic volumes increased
 Press release 1 (5) VR Group s result for 2018 was excellent rail traffic volumes increased Financial details for 2018 presented in this press release are unaudited FAS figures. The figures in brackets
Finnair Group Annual Report 1 January 31 December 2006
 Finnair Group Annual Report 1 January 31 December 2006 2006: A year for restructuring Scheduled Passenger Traffic transforming to meet Asian traffic demands Labour negotiations to cut 670 jobs 80 million
FINAVIA INTERIM REPORT 1 JANUARY SEPTEMBER 2010: DEMAND FOR AIR SERVICES RECOVERING
 1 (8) FINAVIA INTERIM REPORT 1 JANUARY 2010 30 SEPTEMBER 2010: DEMAND FOR AIR SERVICES RECOVERING Summary of the key figures for January to September Finavia Group s corresponding figures for the previous
Finnair Q Result
 Finnair Q1 2015 Result 7 May 2015 CEO Pekka Vauramo, Interim CFO Mika Stirkkinen 1 Turbulent market environment The weakness of the Finnish economy continued to be reflected in the demand in the first
NORWEGIAN AIR SHUTTLE ASA QUARTERLY REPORT SECOND QUARTER 2006 [This document is a translation from the original Norwegian version]
![NORWEGIAN AIR SHUTTLE ASA QUARTERLY REPORT SECOND QUARTER 2006 [This document is a translation from the original Norwegian version]](/thumbs/74/71229964.jpg "NORWEGIAN AIR SHUTTLE ASA QUARTERLY REPORT SECOND QUARTER 2006 [This document is a translation from the original Norwegian version]") NORWEGIAN AIR SHUTTLE ASA QUARTERLY REPORT SECOND QUARTER 2006 SECOND QUARTER IN BRIEF had earnings before tax of MNOK 24.8 (20.6) in the second quarter. The operating revenue increased by 44 % this quarter,
NORWEGIAN AIR SHUTTLE ASA QUARTERLY REPORT SECOND QUARTER 2006 SECOND QUARTER IN BRIEF had earnings before tax of MNOK 24.8 (20.6) in the second quarter. The operating revenue increased by 44 % this quarter,
Interim report January March May 2016 FINNLINES Q1
 Interim report January March 2016 11 May 2016 FINNLINES Q1 FINNLINES PLC INTERIM REPORT JANUARY-MARCH 2016 (unaudited) Stock Exchange Release 11 May 2016 at 13:15 JANUARY-MARCH 2016: Result for the reporting
New innovations and possibilities an extension to old traditions
 New innovations and possibilities an extension to old traditions Rauma Marine Constructions was founded in 2014. The wholly Finnish-owned shipbuilding company has created a completely new starting point
Finnlines Plc Annual General Meeting Tom Pippingsköld, CFO
 Finnlines Plc Annual General Meeting 12.4.2016 Tom Pippingsköld, CFO 1 Global Shipping Segments 1 Jan 2015 Source: http://www.statista.com/statistics/264024/number-of-merchant-ships-worldwide-by-type/
180.8 million passengers, nearly 17.7 million cars and 3.3 million cargo units. Every year 6.4 million passengers travel on Viking Line s vessels.
 1959 2012 180.8 million passengers, nearly 17.7 million cars and 3.3 million cargo units. Every year 6.4 million passengers travel on Viking Line s vessels. The Viking Line fleet The Viking Line fleet
Finnair Group Interim Report 1 January 30 September 2008
 Finnair Group Interim Report 1 January 30 September 2008 1 31/10/2008 Presentation name / Author Airline industry at a historical turning point Expensive fuel price in the beginning of 2008 has dramatical
Finnair Group Interim Report 1 January 31 March 2008
 Finnair Group Interim Report 1 January 31 March 2008 1 29/04/2008 Presentation name / Author Outlook for the industry less positive Growth of demand declining due to uncertainty of global economy Growth
Financial review January June July 2018 FINNLINES Q2
 Financial review January June 2018 31 July 2018 FINNLINES Q2 FINNLINES PLC FINANCIAL REVIEW JANUARY JUNE 2018 (unaudited) Media Release 31 July 2018 JANUARY JUNE 2018: Strong performance in January June,
Thank you for participating in the financial results for fiscal 2014.
 Thank you for participating in the financial results for fiscal 2014. ANA HOLDINGS strongly believes that safety is the most important principle of our air transportation business. The expansion of slots
DFDS A/S H Analyst meeting 30 August 2006
 DFDS A/S H1 2006 Analyst meeting 30 August 2006 DFDS A/S Contents The half-year in brief Strategy on track DFDS Seaways DFDS Tor Line Half-year accounts & profit forecast 2006 DFDS A/S H1 2006 in brief
Half-yearly Report 2013
 Half-yearly Report 2013 Financial result unchanged PORT OF ROTTERDAM THROUGHPUT DECREASED SLIGHTLY Throughput in the port of Rotterdam in the first half of the year decreased by 0.9% compared to the first
ANA HOLDINGS Financial Results for the Three Months Ended June 30, 2018
 ANA HOLDINGS NEWS ANA HOLDINGS Financial Results for the Three Months Ended June 30, 2018 TOKYO, July 31, 2018 ANA HOLDINGS INC. (hereinafter ANA HD ) today reports its financial results for the three
Port of Tallinn Estonia s Biggest Maritime Gateway
 Port of Tallinn Estonia s Biggest Maritime Gateway Margus Vihman Chief Commercial Officer/ Member of the Management Board Organization The company in a nutshell State-owned limited liability company Port
TARIFF OF HARBOUR DUES
 PORT OF GDYNIA AUTHORITY S.A. JOINT-STOCK COMPANY TARIFF OF HARBOUR DUES Valid from 1 July 2007 The Tariff established by the Port of Gdynia Authority, S.A. under Resolution no. 168/II/2004 of 18 August
Finnair Q Result
 17 August 2016 CEO Pekka Vauramo CFO Pekka Vähähyyppä Finnair Q2 2016 Result 1 Highlights of the second quarter The seventh consecutive quarter of profit improvement Fukuoka & Guangzhou route openings
Globus Maritime Limited Trading Update and Financial Highlights for the Three Months and Nine Months Ended September 30, 2007.
 Globus Maritime Limited Trading Update and Financial Highlights for the Three Months and Nine Months Ended September 30, 2007. Athens, Greece, November 15, 2007. Globus Maritime Limited (AIM: GLBS), a
Summary of Results for the First Three Quarters FY2015/3
 Summary of Results for the First Three Quarters FY2015/3 February 10, 2015 Tokyu Corporation (9005) http://www.tokyu.co.jp/ Contents Ⅰ.Executive Summary 2 Ⅱ.Conditions in Each Business 5 Ⅲ.Details of Financial
Financial review January March May 2018 FINNLINES Q1
 Financial review January March 2018 8 May 2018 FINNLINES Q1 FINNLINES PLC FINANCIAL REVIEW JANUARY MARCH 2018 (unaudited) Media Release 8 May 2018 JANUARY MARCH 2018: Continued strength in first quarter
OPERATING AND FINANCIAL HIGHLIGHTS SUBSEQUENT EVENTS
 Copa Holdings Reports Net Income of US$6.2 Million and EPS of US$0.14 for the Third Quarter of 2015 Excluding special items, adjusted net income came in at $37.4 million, or EPS of $0.85 per share Panama
Q Finnair s growth continued Pekka Vähähyyppä
 2018 Finnair s growth continued 25.10.2018 Pekka Vähähyyppä 1 We continued to develop our services and network New route to Los Angeles in 2019, two daily flights to Hong Kong New digital service for exploring
Summary of Results for the First Quarter of FY2015/3
 Summary of for the First Quarter of FY2015/3 August 8, 2014 Tokyu Corporation (9005) http://www.tokyu.co.jp/ Contents Ⅰ.Executive Summary 2 Ⅱ.Conditions in Each Business 4 Ⅲ.Details of Financial for the
WÄRTSILÄ CORPORATION JP MORGAN CAZENOVE EUROPEAN CAPITAL GOODS CEO CONFERENCE
 WÄRTSILÄ CORPORATION JP MORGAN CAZENOVE EUROPEAN CAPITAL GOODS CEO CONFERENCE Jaakko Eskola President & CEO 1 Wärtsilä PUBLIC 16 June 2017 Jaakko Eskola Wärtsilä s net sales by business Q1/2017 SERVICES,
Finnair 2015 kolmannen vuosineljänneksen tulos
 Finnair 215 kolmannen vuosineljänneksen tulos Q3 Result 215 3 October 215 3.1.215 Toimitusjohtaja Pekka Vauramo Talousjohtaja Pekka Vähähyyppä 1 Highlights of the quarter Excellent Q3 result: Record result
Finnair Q Result
 Finnair Q2 2015 Result 14 August 2015 CEO Pekka Vauramo, Interim CFO Mika Stirkkinen 1 Market environment shows signs of improvement There were signs of a recovery in the demand for consumer and business
Summary o f Results for the First Half of FY2018
 Summary o f Results for the First Half of FY2018 November 9, 2018 (9005) https://www.tokyu.co.jp/ Contents Ⅰ.Executive Summary 2 Ⅱ.Conditions in Each Business 6 Ⅲ.Details of Financial Results for the 13
OPERATING AND FINANCIAL HIGHLIGHTS. Subsequent Events
 Copa Holdings Reports Net Income of US$113.1 Million and EPS of US$2.57 for the First Quarter of 2015 Excluding special items, adjusted net income came in at US$106.0 million, or EPS of US$2.41 per share
Q Fast growth continued, Comparable operating result at record high levels Pekka Vauramo
 2018 Fast growth continued, Comparable operating result at record high levels 17.7.2018 Pekka Vauramo 2 A good - Comparable operating result increased to new seasonal high Revenue Comparable operating
AUDITED GROUP RESULTS AND CASH DIVIDEND FOR THE YEAR ENDED 30 JUNE 2014
 Comair Limited (Incorporated in the Republic of South Africa) Reg. No. 1967/006783/06 ISIN Code: ZAE000029823 Share Code: COM ( Comair or the Group ) AUDITED GROUP RESULTS AND CASH DIVIDEND FOR THE YEAR
GROUP ULJANIK PLOVIDBA CONSOLIDATED AUDITED FINANCIAL STATEMENTS FOR THE PERIOD JANUARY - DECEMBER 2014
 GROUP ULJANIK PLOVIDBA CONSOLIDATED AUDITED FINANCIAL STATEMENTS FOR THE PERIOD JANUARY - DECEMBER 2014 Pula, April 2015 CONTENT: Consolidated audited Financial Statements of GROUP ULJANIK PLOVIDBA with
Cruise Liners. Prices and terms Port of Stockholm and Nynäshamn. Version
 Cruise Liners Prices and terms 2019 Port of Stockholm and Nynäshamn Version 201901 CONTENTS GENERAL INFORMATION CONTACT 3 TERMS AND CONDITIONS 3-4 INVOICING PRINCIPLES 5 CRUISE LINERS HARBOUR DUES 6-7
NORWEGIAN AIR SHUTTLE ASA QUARTERLY REPORT FIRST QUARTER 2004 [This document is a translation from the original Norwegian version]
![NORWEGIAN AIR SHUTTLE ASA QUARTERLY REPORT FIRST QUARTER 2004 [This document is a translation from the original Norwegian version]](/thumbs/87/95085804.jpg "NORWEGIAN AIR SHUTTLE ASA QUARTERLY REPORT FIRST QUARTER 2004 [This document is a translation from the original Norwegian version]") NORWEGIAN AIR SHUTTLE ASA QUARTERLY REPORT 2004 IN BRIEF At the start of 2003, Norwegian has become a pure low-fare airline. The Fokker F-50 operations have been terminated, and during the quarter the
NORWEGIAN AIR SHUTTLE ASA QUARTERLY REPORT 2004 IN BRIEF At the start of 2003, Norwegian has become a pure low-fare airline. The Fokker F-50 operations have been terminated, and during the quarter the
Norwegian Air Shuttle ASA
 Norwegian Air Shuttle ASA Q1 2018 Presentation 26 April 2018 Highlights Q1 2018 Successfully completed private placement of NOK 1.3 billion Added two 737-800s and six 787-9s to operations Launched interline
SEA BOARD OF DIRECTORS: 2017 STATUTORY FINANCIAL STATEMENTS AND NON-FINANCIAL REPORT APPROVED
 SEA BOARD OF DIRECTORS: 2017 STATUTORY FINANCIAL STATEMENTS AND NON-FINANCIAL REPORT APPROVED SEA Group results Passenger traffic: 31.6 million, up 8.9% (22 million at Milan Malpensa, growth of 14.1%)
MIRAMAR, Fla., April 29, 2015 (GLOBE NEWSWIRE) -- Spirit Airlines, Inc. (Nasdaq:SAVE) today reported first quarter 2015 financial results.
 -- Spirit Airlines, Inc. (Nasdaq:SAVE) today reported first quarter 2015 financial results.") April 29, 2015 Spirit Airlines Announces First Quarter 2015 Results; Adjusted Net Income Increases 87.1 Percent to $70.7 Million and Pre-Tax Margin Increases 900 Basis Points to 22.7 Percent MIRAMAR, Fla.,
April 29, 2015 Spirit Airlines Announces First Quarter 2015 Results; Adjusted Net Income Increases 87.1 Percent to $70.7 Million and Pre-Tax Margin Increases 900 Basis Points to 22.7 Percent MIRAMAR, Fla.,
Finnair Group Interim Report 1 January 30 June 2008
 Finnair Group Interim Report 1 January 30 June 2008 1 08/08/2008 Presentation name / Author Airline industry at a historical turning point Fuel price has a stranglehold on the business Average ticket prices
WÄRTSILÄ TO ACQUIRE L-3 MARINE SYSTEMS INTERNATIONAL
 WÄRTSILÄ TO ACQUIRE L-3 MARINE SYSTEMS INTERNATIONAL PRESS CONFERENCE 16.12.2014 Jaakko Eskola 1 The most complete marine offering on earth 2 Wärtsilä Corporate presentation 2014 L-3 Marine Systems International
THE FIRST CHOICE FOR FREQUENT TRAVELERS
 THE FIRST CHOICE FOR FREQUENT TRAVELERS One of SAS s strategic priorities is to be the first choice for frequent travelers. We define frequent travelers as individuals who take five or more return flights
Air China Limited Interim Results. August Under IFRS
 Air China Limited 21 Interim Results Under IFRS August 21 1 Agenda 21 Interim Results Overview Business Overview Financial Overview Outlook 2 2 2 21 Interim Results 3 21 Interim Results Overview 4 4 4
P R E S S R E L E A S E
 Strategy successfully confirmed: operating profit up by 10.2% Bremen, 14 April 2015 +++ The EUROGATE Group can look back on a successful business performance in 2014. The Company increased operating profit
Copa Holdings Reports Record Earnings of US$41.8 Million for 4Q06 and US$134.2 Million for Full Year 2006
 Copa Holdings Reports Record Earnings of US$41.8 Million for 4Q06 and US$134.2 Million for Full Year 2006 Panama City, Panama --- March 7, 2007. Copa Holdings, S.A. (NYSE: CPA), parent company of Copa
Schiphol Group. Annual Report
 Schiphol Group Annual Report 2013 Business model Business model Schiphol Group distinguishes four core activities: Aviation, Consumer Products and Services, Real Estate, and Alliances and Participations.
OPERATING AND FINANCIAL HIGHLIGHTS
 Copa Holdings Reports Net Income of US$32.0 Million and EPS of US$0.72 for the Second Quarter of 2012 Excluding special items, adjusted net income came in at $58.6 million, or EPS of $1.32 per share Panama
Air China Limited Annual Results. March Under IFRS
 Air China Limited 21 Annual Results Under IFRS March 211 Agenda Part 1 Highlights Part 2 Business Overview Part 3 Financial Overview Part 4 Outlook 2 Part 1 Highlights Steady Economic Growth; Asia Pacific
INTESA SANPAOLO VITA RESULTS AT 31 MARCH 2017 APPROVED:
 INTESA SANPAOLO VITA RESULTS AT 31 MARCH 2017 APPROVED: Assets under management at 145,908.2 million euros (143,735.3 million euros at December 2016 +1.5%) Financial liabilities (unit and index linked)
Copa Holdings Reports Net Income of $57.7 million and EPS of $1.36 for the Third Quarter of 2018
 Copa Holdings Reports Net Income of $57.7 million and EPS of $1.36 for the Third Quarter of 2018 November 14, 2018 PANAMA CITY, Nov. 14, 2018 /PRNewswire/ -- Copa Holdings, S.A. (NYSE: CPA), today announced
PRESS RELEASE Financial Results. Rising passenger traffic at 12.5m Exceeding 1bn in consolidated revenue
 PRESS RELEASE 2016 Financial Results Rising passenger traffic at 12.5m Exceeding 1bn in consolidated revenue Kifissia, 23 March 2017 AEGEAN reports full year 2016 results with consolidated revenue at 1,020m,
Spirit Airlines Reports First Quarter 2017 Results
 Spirit Airlines Reports First Quarter 2017 Results MIRAMAR, Fla., April 28, 2017 - Spirit Airlines, Inc. (NASDAQ: SAVE) today reported first quarter 2017 financial results. GAAP net income for the first
OPERATING AND FINANCIAL HIGHLIGHTS. Subsequent Events
 Copa Holdings Reports Financial Results for the First Quarter of 2016 Excluding special items, adjusted net income came in at US$69.9 million, or EPS of US$1.66 per share Panama City, Panama --- May 5,
UECC s M/V AUTO ENERGY Naming Ceremony for the world s second dual fuel LNG Pure Car and Truck Carrier (PCTC)
") PRESS RELEASE Oslo, 10 February 2017 UECC s M/V AUTO ENERGY Naming Ceremony for the world s second dual fuel LNG Pure Car and Truck Carrier (PCTC) As reported earlier, United European Car Carriers (UECC),
PRESS RELEASE Oslo, 10 February 2017 UECC s M/V AUTO ENERGY Naming Ceremony for the world s second dual fuel LNG Pure Car and Truck Carrier (PCTC) As reported earlier, United European Car Carriers (UECC),
SOK Communications and publications 17 August (5)
") Communications and publications 17 August 2006 1 (5) Cleared for publication at 12:00, 17 August 2006 The S Group reports growth in sales and number of customer-owners earnings trend stable The number
Communications and publications 17 August 2006 1 (5) Cleared for publication at 12:00, 17 August 2006 The S Group reports growth in sales and number of customer-owners earnings trend stable The number
Meyer Turku Oy MEC-E Mechanical Engineering in Society. Mika Heiskanen October 6, 2017
 Meyer Turku Oy MEC-E1001 - Mechanical Engineering in Society Mika Heiskanen October 6, 2017 Agenda Short indroduction of myself Meyer Turku as a part of Finnish Maritime Cluster - Meyer Turku in a nutshell
WORLDWIDE BUSINESS WITH SEFİNE SHIPYARD NEW BUILDING SHIP REPAIR CONVERSION MEGA STEEL CONSTRUCTION
 www.sefine.com.tr WORLDWIDE BUSINESS WITH SEFİNE SHIPYARD NEW BUILDING SHIP REPAIR CONVERSION MEGA STEEL CONSTRUCTION Welcome Sefine Shipyard is a customer-focused, international shipbuilder building innovative
PRESS RELEASE / NOTICE TO INVESTORS
 March 25, 2015 PRESS RELEASE / NOTICE TO INVESTORS El Al's CEO David Maimon and its CFO, Dganit Palti, today presented the financial statements for the fourth quarter of 2014 In 2014 the Company's revenues
Action plan for sustainable tourism on Suomenlinna
 Action plan for sustainable tourism on Suomenlinna 2015 2020 This action plan is part of the sustainable tourism strategy for Suomenlinna published by the Governing Body of Suomenlinna (GBS) in 2015. The
Copa Holdings Reports Net Income of $49.9 million and EPS of $1.18 for the Second Quarter of 2018
 Copa Holdings Reports Net Income of $49.9 million and EPS of $1.18 for the Second Quarter of 2018 Panama City, Panama --- Aug 8, 2018. Copa Holdings, S.A. (NYSE: CPA), today announced financial results
Progressing towards profitable growth
 Progressing towards profitable growth Jaakko Eskola President & CEO 1 Wärtsilä 29 September 2016 Jaakko Eskola OUR STRATEGIC GROWTH AGENDA Focused on fostering a high performance culture committed to continuous
SAS takes forceful action in a challenging market
 SAS Q2 2013/14 1 1 SAS takes forceful action in a challenging market Q2 EBT MSEK -1,078 Disappointing result in a challenging market most European carriers struggle During the last year, capacity has outgrown
2Q 2008 INTERIM REPORT Unaudited
 2Q 2008 INTERIM REPORT Unaudited HIGH UTILISATION AND STRONG CASH FLOW IN 2Q 2008 Ocean HeavyLift ASA (OHL) continues to deliver strong results in the second quarter of 2008. TC equivalent revenues came
JAPAN AIRLINES Co., Ltd. Financial Results 1 st Quarter Mar/2017(FY2016) July 29, 2016
 July 29, 2016") JAPAN AIRLINES Co., Ltd. Financial Results Mar/2017(FY2016) July 29, 2016 Today s Topics P.1 P.2 P.13 From the first quarter of this fiscal year, figures for Revenue Passengers Carried, ASK, RPK and Load
JAPAN AIRLINES Co., Ltd. Financial Results Mar/2017(FY2016) July 29, 2016 Today s Topics P.1 P.2 P.13 From the first quarter of this fiscal year, figures for Revenue Passengers Carried, ASK, RPK and Load
FIRST QUARTER OPERATING PROFIT IMPROVES TO $274 MILLION
 1 August 2006 Page 1 of 4 No. 03/06 1 August 2006 FIRST QUARTER OPERATING PROFIT IMPROVES TO $274 MILLION HIGHLIGHTS OF THE GROUP S PERFORMANCE 1st Quarter 2006-07 Year-on-Year % Change Operating revenue
Cathay Pacific Airways Limited Abridged Financial Statements
 To provide shareholders with information on the results and financial position of the Group s significant listed associated company, Cathay Pacific Airways Limited, the following is a summary of its audited
Ref. PE004/ May Subject: Management Discussion and Analysis for the First Quarter of 2018
 Ref. PE004/2561 10 May 2018 Subject: Management Discussion and Analysis for the First Quarter of 2018 Attention: President The Stock Exchange of Thailand According to the financial reports of Nok Airlines
OPERATING AND FINANCIAL HIGHLIGHTS
 Copa Holdings Reports Financial Results for the Fourth Quarter of 2015 Excluding special items, adjusted net income came in at $31.7 million, or EPS of $0.73 per share Panama City, Panama --- February
Consolidated Statement of Financial Position as at December 31, 2017
 86 Key Figures Consolidated Statement of Financial Position as at December 31, 2017 Assets in million December 31, 2017 December 31, 2016 Non-current assets Goodwill 19.3 19.3 Investments in airport operating
SAS Group Q Teleconference
 SAS Group Q4 2012 Teleconference December 12, 2012 1 Break-even result in 2012 despite 1.6 bn SEK higher fuel cost 23 MSEK EBT (before non-recurring items) despite 1.6 bn SEK higher fuel cost Positive
PRESS RELEASE AEROPORTO GUGLIELMO MARCONI DI BOLOGNA S.p.A.: The Board of Directors approves the group results for the first nine months of 2017:
 PRESS RELEASE AEROPORTO GUGLIELMO MARCONI DI BOLOGNA S.p.A.: The Board of Directors approves the group results for the first nine months of 2017: Traffic growth continues with 6.3 million passengers (+6.7%
AEROFLOT ANNOUNCES FY 2017 IFRS FINANCIAL RESULTS
 AEROFLOT ANNOUNCES FY 2017 IFRS FINANCIAL RESULTS Moscow, 1 March 2018 Aeroflot Group ( the Group, Moscow Exchange ticker: AFLT) today publishes its audited financial statements in accordance with International
Interim Business Report 2017
 April 1, 2017 through September 30, 2017 November 22, 2017 Contents SECTION 1 01 Consolidated Statement of Income 02 Factors Leading to Difference in Consolidated Ordinary Income Compared With Same Period
SAS AB Analyst meeting
 SAS AB Analyst meeting London, August 9, 2001 2 2nd Quarter a tough Quarter The Marketplace Continued weak world economy Weaker Swedish economy SAS Weaker traffic growth and reduced passenger load factors
Passenger services 7,438 10,550 Cargo services 4,405 4,225 Catering and other services Turnover 1 12,275 15,511
 Cathay Pacific Airways Limited - 2003 Interim Results Consolidated Profit and Loss Account - Unaudited Six months ended 30th June 2003 2002 Note Passenger services 7,438 10,550 Cargo services 4,405 4,225
OPERATING AND FINANCIAL HIGHLIGHTS. Subsequent Events
 Copa Holdings Reports Net Income of $103.8 million and EPS of $2.45 for the Third Quarter of 2017 Excluding special items, adjusted net income came in at $100.8 million, or EPS of $2.38 per share Panama
THIRD QUARTER RESULTS 2017
 THIRD QUARTER RESULTS 2017 KEY RESULTS In the 3Q17 Interjet total revenues added $5,835.1 million pesos that represented an increase of 22.0% over the revenue generated in the 3Q16. In the 3Q17, operating
2006 INTERIM ANNOUNCEMENT
 (Stock Code: 78) 2006 INTERIM ANNOUNCEMENT FINANCIAL HIGHLIGHTS Six months ended 30th June, 2006 (Unaudited) Six months ended 30th June, 2005 % Change (Unaudited) HK$ M HK$ M Revenue 608.3 542.4 +12.1%
Lifetime Performance INTERIM REPORT January-June 2005
 Lifetime Performance INTERIM REPORT January-June 2005 INTERIM REPORT JANUARY-JUNE 2005 WÄRTSILÄ CORPORATION SECOND QUARTER HIGHLIGHTS: Net sales grew to EUR 686.8 million (58.3) Operating income improved
El Al Israel Airlines announced today its financial results for the second quarter and the first half of 2017.
 August 16, 2017 El Al Israel Airlines announced today its financial results for the second quarter and the first half of 2017. The Company's revenues in the second quarter of 2017 amounted to approx. USD
Financial Results 3 rd Quarter MAR/2016 (FY2015)
") Financial Results MAR/2016 (FY2015) January 29 th, 2016 CONTENTS P.1 P.2 P.3 P.4~ Overview of FY MAR/16 Results Operating Revenue Operating Profit 1,030 1,020 1,010 +1.0Bn 1,022.3 1,023.4 (+0.1%) 180 160
Financial Results MAR/2016 (FY2015) January 29 th, 2016 CONTENTS P.1 P.2 P.3 P.4~ Overview of FY MAR/16 Results Operating Revenue Operating Profit 1,030 1,020 1,010 +1.0Bn 1,022.3 1,023.4 (+0.1%) 180 160
LASSILA & TIKANOJA Q Pekka Ojanpää, President and CEO 25 October Lassila & Tikanoja plc
 LASSILA & TIKANOJA Q3 2017 Pekka Ojanpää, President and CEO 25 October 2017 Lassila & Tikanoja plc HIGHLIGHTS OF Q3/2017 L&T completed the acquisition of Veolia FM AB (L&T FM AB) The integration process
Copa Holdings Reports Net Income of $136.5 million and EPS of $3.22 for the First Quarter of 2018
 Copa Holdings Reports Net Income of $136.5 million and EPS of $3.22 for the First Quarter of 2018 May 9, 2018 PANAMA CITY, May 9, 2018 /PRNewswire/ -- Copa Holdings, S.A. (NYSE: CPA), today announced financial
1Q 2014 Edition. Share Information. Daily Share Price Movements
 1Q 2014 Edition 1Q 2013 1Q 2014 Change Financial Summary (USD Mio) OPERATING REVENUES 807 807 0.01% OPERATING EXPENSES 827 1,000 20.86% OTHERS (INCOME) 4 25 460.80% INCOME (LOSS) FROM OPERATIONS -20-193
JAL Group Announces its FY Medium-Term Business Plan
 JAL Group Announces its FY2006-2010 Medium-Term Business Plan -Mobilize the Group s Strengths to Regain Trust - Tokyo, Thursday March 2, 2006: The JAL Group today announced its medium-term business plan
OPERATING AND FINANCIAL HIGHLIGHTS SUBSEQUENT EVENTS
 Copa Holdings Reports Financial Results for the Third Quarter of 2016 Excluding special items, adjusted net income came in at $55.3 million, or adjusted EPS of $1.30 per share Panama City, Panama --- November
Regulation of ownership steering and basis of other steering
 1 (5) Administration Department/Corporate Policy 10 March 2011 Finavia Corporation's ownership strategy policies The Ministry of Transport and Communications has laid down the following enumerated ownership
ANA HOLDINGS Financial Results for the Six Months Ended September 30, 2018
 ANA HOLDINGS NEWS ANA HOLDINGS Financial Results for the Six Months Ended September 30, 2018 TOKYO, Nov. 2, 2018 ANA HOLDINGS INC. (hereinafter ANA HD ) today reports its financial results for the six
Output volume and order backlog at record levels Renewed significant increases in net profit and operating profit Dividend bonus announced
 Bilfinger Berger AG Carl-Reiss-Platz 1-5 68165 Mannheim Germany www.bilfingerberger.com Contact: Sascha Bamberger Phone: +49 6 21/4 59-24 55 Fax: +49 6 21/4 59-25 00 E-mail: sbam@bilfinger.de Date: February
LOCATED AT THE GATEWAY OF THE TROPICAL PROVINCE, RIDING ON THE GROWTH MOMENTUM OF THE COUNTRY, WE ARE ON THE RIGHT TRACK OF TAKING OFF.
 LOCATED AT THE GATEWAY OF THE TROPICAL PROVINCE, RIDING ON THE GROWTH MOMENTUM OF THE COUNTRY, WE ARE ON THE RIGHT TRACK OF TAKING OFF. MANAGEMENT DISCUSSION INDUSTRY REVIEW Civil Aviation Industry in
Volaris Reports Strong First Quarter 2015: 32% Adjusted EBITDAR Margin, 9% Operating Margin
 Volaris Reports Strong First Quarter 2015: 32% Adjusted EBITDAR Margin, 9% Operating Margin Mexico City, Mexico, April 22, 2015 Volaris* (NYSE: VLRS and BMV: VOLAR), the ultra-low-cost airline serving
RYANAIR ANNOUNCES RECORD Q1 PROFIT INCREASE
 RYANAIR ANNOUNCES RECORD Q1 PROFIT INCREASE Ryanair, Europe s largest low fares airline today (Tuesday, 6 Aug 2002) announced its biggest increase in Q1 profits (end 30 Jun 02). Passenger traffic during
Net sales by business area in % Services. Ship Power 31% Power Plants POWER PLANTS
 THIS IS WÄRTSILÄ Wärtsilä is a global leader in complete lifecycle power solutions for the marine and energy markets. By emphasising technological innovation and total efficiency, Wärtsilä maximises the
AIR CANADA REPORTS 2010 THIRD QUARTER RESULTS; Operating Income improved $259 million or 381 per cent from previous year s quarter
 AIR CANADA REPORTS 2010 THIRD QUARTER RESULTS; Operating Income improved $259 million or 381 per cent from previous year s quarter MONTRÉAL, November 4, 2010 Air Canada today reported operating income
Interim Report January - September 2002
 Interim Report January - September 2002 INTERIM REPORT JANUARY-SEPTEMBER 2002 WÄRTSILÄ CORPORATION INTERIM REPORT JANUARY-SEPTEMBER 2002 Wärtsilä s net sales increased and operatin profit totalled EUR
IKYU Corporation. Presentation Materials
 IKYU Corporation Tokyo Stock Exchange First Section (Securities Code No. 2450) Non-Consolidated Financial Results for Fiscal 2011 (April 2011 to March 2012) Presentation Materials May 10, 2012 This is
Management Discussions and Analysis for the three-month period ended 31 March 2014 and Executive Summary
 Executive Summary Overview of the global economy during the first quarter of 2015 (Q1/2015) are as following; the US economy has been in recovery mode while rapidly dollar appreciation weighs on net exports
PRESS ANNOUNCEMENT JULY 28, 1999 For Immediate Release STAR CRUISES REPORTS RECORD SECOND QUARTER EARNINGS
 PRESS ANNOUNCEMENT JULY 28, 1999 For Immediate Release STAR CRUISES REPORTS RECORD SECOND QUARTER EARNINGS STAR CRUISES PLC announced record net income of US$20.7 million (US 3.3 cents earnings per share)
Balance sheets and additional ratios
 Balance sheets and additional ratios amounts in millions unless otherwise stated Consolidated balance sheets Dutch guilders USD* June 30, December 31, June 30, December 31, 1997 1996 1997 1996 Fixed assets