2Q 2013 presentation Oslo, 11 July 2013
|
|
|
- Amy Thornton
- 6 years ago
- Views:
Transcription

1 Fred. Olsen Energy ASA 2Q 2013 presentation Oslo, 11 July
2 AGENDA FINANCIAL RESULT 2Q 2013 MARKETS OPERATIONS SUMMARY 2
3 Income Statement Key Figures (NOK mill) 2Q Q 2013 Operating revenues Recharged income Total revenues Operating costs (780) (747) Recharged expenses (73) (53) Total operating expenses (853) (800) Oper. result before depr. (EBITDA) Depreciation (354) (345) Operating result (EBIT) Net financial items (8) 23 Result before tax Estimated tax (23) (25) Net result
4 MNOK EBITDA Comparison 2Q 2013 vs. 1Q Q EBITDA Bolette Borgland Borgsten Borgholm Byford Other 2Q EBITDA 4
5 Financial Items Breakdown (NOK mill) 2Q Q 2013 Interest income 2 4 Gains on financial instruments Financial income Interest expenses (54) (54) Capitalized borrowing cost (projects) Losses on financial instruments (16) (31) Other financial expenses (17) (38) Financial expenses (61) (99) Net foreign currency gain/(loss) 4 97 Net financial items (8) 23
6 Offshore Drilling Segment (NOK mill) 2Q Q 2013 Operating revenues Recharged income Total revenues Operating costs (733) (705) Recharged expenses (73) (53) Total operating expenses (806) (758) Oper. result before depr. (EBITDA) Depreciation (352) (342) Operating result (EBIT)
7 Engineering & Fabrication Segment (NOK mill) 2Q Q 2013 Operating revenues Operating costs (47) (42) Oper. result before depr. (EBITDA) 5 2 Depreciation (3) (2) Operating result (EBIT) 2 -
8 Consolidated Balance Sheet (NOK mill) 2Q Q 2013 Intangible assets Property, plant & equipment Other non-current assets Total non-current assets Other current assets Cash and cash equivalents Total current assets Total assets Equity Non-current interest bearing debt Other non-current liabilities Total non-current liabilities Current interest bearing debt Current liabilities newbuilds Other current liabilities Total current liabilities Total equity and liabilities
9 Consolidated Cash Flow (NOK mill) 2Q Q 2013 Profit before income taxes Depreciation and impairment Interest expense Gain on sale of assets - 1 Changes in working capital (73) (275) Unrealized loss/(gain) financial instruments (34) (2) Cash generated from operations Interest paid (54) (55) Taxes paid (31) (10) Net cash flow from operating activities Net investment in fixed assets (340) (235) Cash flow used in investment activities (340) (235) Borrowing of loans Repayment of loans (118) (287) Dividend paid (1 325) - Cash flow from financing activities (765) (287) Foreign currency Net change in cash and cash equivalents (342) (19) Cash at beginning of period Cash at end of period
10 2Q 3Q 4Q 1Q 2Q 3Q 4Q 1Q 2Q 3Q 4Q 1Q 2Q 3Q 4Q 1Q 2Q 3Q 4Q 1Q 2Q 3Q 4Q 1Q 2Q 3Q 4Q 1Q 2Q 3Q 4Q 1Q 2Q 3Q 4Q 1Q 2Q 3Q 4Q 1Q 2Q NOK million Offshore drilling EBITDA and margin 1500,0 1400,0 70 % 1300,0 1200,0 60 % 1100,0 1000,0 50 % 900,0 800,0 40 % 700,0 600,0 30 % 500,0 400,0 20 % 300,0 200,0 10 % 100,0 0,0 0 % EBITDA Offshore Drilling EBITDA % Offshore Drilling 10
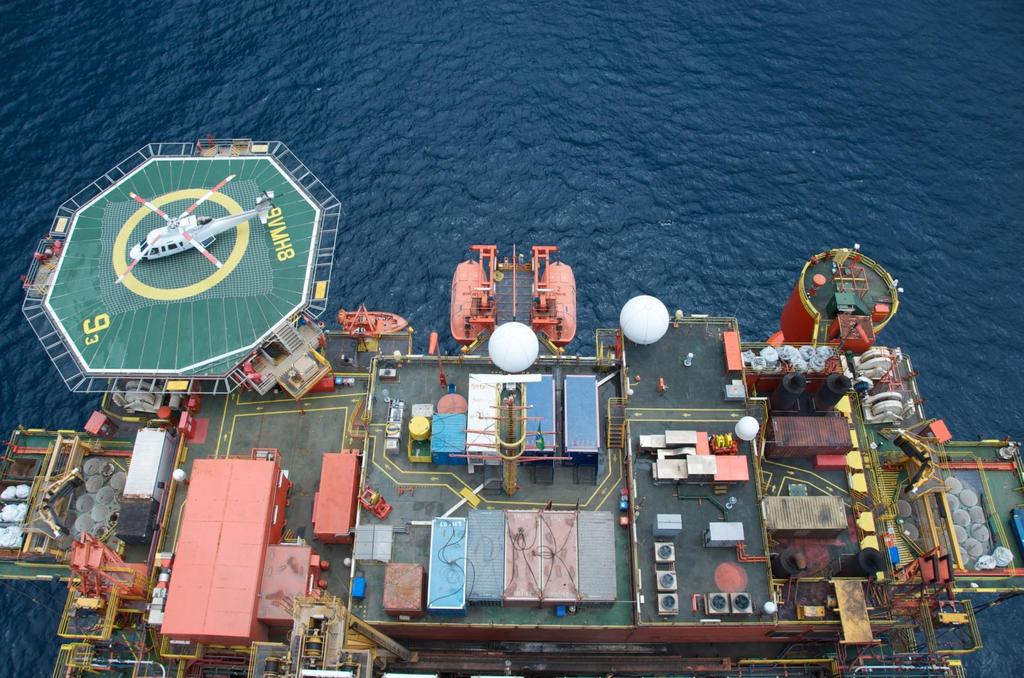
11 Fleet status Rig Type / design W depth ft Location Client Contract status Day rate (in USD) Next CR survey Ultra-deepwater and deepwater units Bollsta Dolphin - delivery 1Q'15 SS / Moss UK Chevron 1Q Q Q 2020 Bolette Dolphin - delivery 3Q'13 Drillship Mozambique Anadarko 4Q Q Q 2018 Belford Dolphin Drillship Mozambique Anadarko January '12 - December ' Q 2015 Blackford Dolphin SS / Aker H Brazil Anadarko June '13 - September ' Q 2013 UK MPX February '14-March ' Ireland Capricorn April '14-June ' Midwater floaters Norway Bideford Dolphin SS / Aker H Norway Statoil January '11 - January '14 NOK 916' + USD 243' 2Q 2014 Statoil February '14 - February '17 NOK USD 301' Option February '17 - February '19 NOK USD 301' Borgland Dolphin SS / Aker H Norway Consortium* January '10 - February '14 NOK 970' + USD 376' 4Q 2014 Consortium** February '14 - September '17 NOK 990' + USD 354' Bredford Dolphin SS / Aker H Norway Lundin November '11 -December '14 NOK 957' + USD 204' 2Q 2017 Consortium*** January '14 - March '16 NOK 970' + USD 274' Option April '16 - February '17 NOK 970' + USD 274' Midwater floaters UK - Brazil Borgny Dolphin SS / Aker H Brazil Petrobras September '08-September ' Q 2014 Byford Dolphin SS / Aker H UK BP April '13 - April ' Q 2015 Option May '16 - April '19 Borgsten Dolphin Tender support / AH-3 UK Total February '13 -May ' / incl. capital contribution Option June '16 - June '17 1Q 2018 Borgholm Dolphin Accomodation / AH-3 UK Shell May '13- June ' Q 2017 BG August '14- April ' Option May '15 - June ' Participants in the consortiums: * BP, Total, E.ON Ruhrgas, OMV, Rocksource, Wintershall, Statoil ** Wintershall, Tullow Oil, E.ON Ruhrgas, Suncor Energy *** RWE DEA, Lundin, Noreco, Repsol 11
12 FINANCIAL RESULT MARKETS OPERATIONS SUMMARY 12

13 Global market outlook floating units Healthy activity in the ultra deepwater segment with rate levels maintained for new contracts Stable in deep- and midwater markets North Sea market strong with few available rigs the next years 13
14 Norwegian floater market In general a high activity on the Norwegian Continental Shelf Tight market with few available units before 2015 Few new contracts during the quarter Continued demand both for exploration and development projects Name Polar Pioneer Transocean Barents West Navigator West Phoenix Transocean Winner Ocean Vanguard Transocean Searcher Transocean Arctic Transocean Leader COSLPioneer Bredford Dolphin Borgland Dolphin Deepsea Atlantic West Venture Island Innovator Songa Delta Songa Dee Stena Don West Alpha West Hercules Songa Trym Deepsea Bergen Scarabeo 5 Bideford Dolphin Scarabeo 8 Leiv Eiriksson COSLInnovator COSLPromoter Transocean Spitsbergen Songa Equinox Songa Endurance Songa Encourage Songa Enabler Q1 Q2 Q3 Q4 Q1 Q2 Q3 Q4 Q1 Q2 Q3 Q4 Q1 Q2 Q3 Q4 Contract Option Yard/under construction As per July 2013 Source: DNB
15 Average dayrates Norway 15
16 UK floater market Has become more like a longer term market, compared to the spot oriented feature of this market only a few years ago Blackford Dolphin will enter this market in 2014 Still strong demand for accommodation units Name J.W. McLean Ocean Princess Paul B. Loyd, Jr. GSF Arctic III Transocean Prospect Noble Ton van Langeveld Ocean Guardian Sedco 714 Sedco 711 Sedco 704 Stena Spey Transocean John Shaw Ocean Nomad Sedco 712 WilHunter Byford Dolphin Ocean Patriot WilPhoenix Bollsta Dolphin Deepsea Aberdeen Q1 Q2 Q3 Q4 Q1 Q2 Q3 Q4 Q1 Q2 Q3 Q4 Q1 Q2 Q3 Q4 Contract Option Yard/under construction As per July 2013 Source: DNB 16
17 Average dayrates UK 17
18 Dayrates deepwater drilling units worldwide 18
19 FINANCIAL RESULT MARKETS OPERATIONS SUMMARY 19
20 Contract overview Bolette Anadarko Bollsta Chevron Belford Anadarko Blackford 1) 2) 3) 4) Borgny Petrobras Bideford Statoil Statoil Borgland RMN con. RMN consortium Bredford Lundin AGR consortium Byford 5) BP Borgsten Total (tender support services) Borgholm Shell BG 1) Karoon 2) Anadarko 3) MPX 4) Capricorn (Cairn) 5) BP Yard/Class renewal survey Option Mobilization Average contract length of ca. 33 months 20
21 USD 1000 Backlog Contract backlog Customer base % 25 % Anadarko Chevron Statoil % 4 % 6 % 7 % 14 % 21 % BP Lundin Total Petrobras Others Total backlog approx. USD 4.8 billion 21

22 Bollsta Dolphin Moss Maritime CS 60 E (Enhanced) design from HHI Estimated delivery 1Q 2015, total cost estimated to USD 740 million including two BOPs Steel cutting in June 2013 Has secured a five-year contract with Chevron for operations West of Shetland in the UK sector Commencement estimated to mid 2015, after mobilization from Korea 22


23 Ultra deepwater Africa Bolette Dolphin Newbuild ultra deepwater drillship from Hyundai Heavy Industries Delivery date is rescheduled to end October 2013 Has secured a four-year contract with Anadarko for international operations, including Mozambique. Start of operation after delivery and mobilization Belford Dolphin Commenced a new four-year contract with Anadarko from January 2012 Operating offshore Mozambique Next five-year class renewal survey to take place in 1Q 2015 Commisioning phase ongoing 23


24 Midwater - Norway Borgland Dolphin Continued operations under a four-year drilling contract with a consortium managed by RMN (Rig Management Norway), expiring February 2014 Another contract with RMN of 18 wells will follow, with estimated commencement February Estimated duration is 3.5 years Next five-year class renewal survey to take place 4Q 2014 Bideford Dolphin Continued operations under a three-year drilling contract with Statoil estimated to expire end of January 2014 A new three-year contract with Statoil was entered into in October 2012, with estimated commencement February 2014 Next five-year class renewal survey to take place 2Q


25 Midwater - Norway / United Kingdom Bredford Dolphin Continued under the drilling contract with Lundin Norway AS, estimated to be completed end of 2013 The eight well contract with a consortium led by AGR was extended with additional four wells. Contract commencement estimated to end Further options exist for minimum five wells The class renewal survey was completed August 2012 Borgholm Dolphin Accommodation unit with 303 bed capacity Commenced a one year contract with Shell mid May A new nine month contract was entered into with BG, with estimated commencement beginning of August 2014 Class renewal survey was completed March
 Byford Dolphin Completed a three-year drilling contract with BP Exploration in April 2013 and commenced the new contract with")

26 Midwater - United Kingdom (cont.) Byford Dolphin Completed a three-year drilling contract with BP Exploration in April 2013 and commenced the new contract with BP, estimated to expire April 2016 The class renewal survey and installation of a new five ram BOP is scheduled to 1Q 2015 Borgsten Dolphin Continued under the tender support services contract of 40 months duration with Total E&P UK, plus two six month options Completed class renewal survey and conversion to tender support vessel mid February


27 Deepwater/ midwater - Brazil Blackford Dolphin Commenced a one-well contract with Anadarko early June 2013 Will be relocated to UK during 4Q. Two one-well contracts were entered into with MPX and Capricorn/Cairn for operations offshore UK and Ireland, estimated to 150 days in total LOI entered into with Harland & Wolff to undertake the class renewal survey at the yard in 4Q Estimated duration of the yard stay is 45 days and total cost of approximately USD 90 million Borgny Dolphin Operating under a five-year drilling contract with Petrobras in Brazil. The contract was extended with approximately one year, and estimated to expire in September 2014 Next class renewal survey to take place in 4Q

28 Harland & Wolff Focus on ship repair, ship building, steel fabrication and engineering services During the quarter, the yard continued the contract for Kværner Verdal AS for fabrication of pile sleeve clusters and floatation tanks for the Edvard Grieg and Martin Linge jackets. Estimated to be completed 4Q 2013 The engineering phase for fabrication of the Humber gateway offshore windfarm substation jacket commenced during the quarter Harland & Wolff has signed a LOI to undertake the class renewal survey of Blackford Dolphin, scheduled to 4Q 2013
29 Summary Financial Revenues were 1,788 million EBITDA was 935 million Profit before tax was 573 million Contract backlog amounting to approximately USD 4.8 billion Operational Byford Dolphin commenced new contract with BP mid April 2013 Borgholm Dolphin commenced new contract with Shell mid May 2013 Blackford Dolphin commenced new contract with Anadarko early June 2013 Market Blackford Dolphin entered into new contracts of 150 days in UK/Ireland Extension of three wells for Borgland Dolphin under the RMN contract Option of four wells exercised for Bredford Dolphin under the AGR contract Average contract duration approximately 33 months 29
30 Q&A 30
Financial results 3Q Oslo, 28 October 2014
 Financial results 3Q 2014 Oslo, 28 October 2014 AGENDA FINANCIAL RESULTS 3Q 2014 MARKETS OPERATIONS SUMMARY Income Statement Key Figures (USD mill) 3Q 2014 2Q 2014 Change Operating revenues 310,0 256,8
Financial results 2Q Oslo, 10 July 2015
 Financial results 2Q 2015 Oslo, 10 July 2015 AGENDA FINANCIAL RESULTS 2Q 2015 MARKET OPERATIONS SUMMARY Income Statement Key Figures (USD mill) 2Q 2015 1Q 2015 Change Operating revenues 320,6 272,0 48,6
Conference call 1Q 2012 results. May 14, 2012
 Conference call 1Q 2012 results May 14, 2012 Contents Highlights 1Q 2012 Market prospects New investments Contract backlog 1Q 2012 accounts Seadrill North Atlantic Drilling Q&A session 2 Highlights First
Pareto Oil & Offshore Service Conference. CEO Alf C Thorkildsen September 2, 2009
 Pareto Oil & Offshore Service Conference CEO Alf C Thorkildsen September 2, 2009 Contents Company profile (2009 vs. 2008) Deepwater operations Construction performance Order backlog and market outlook
2nd quarter 2005: Status and outlook
 2nd quarter 2005: Status and outlook Oslo, 18 Agenda Aker Group update Leif-Arne Langøy, CEO Details 2Q05 financials Bengt A Rem, CFO Aker Seafoods 2Q status and outlook Yngve Myhre, CEO Aker American
Nordic Energy Summit, Oslo Jan Arve Haugan, President & CEO
 Nordic Energy Summit, Oslo Jan Arve Haugan, President & CEO Kvaerner delivers amazing projects UPSTREAM DOWNSTREAM & INDUSTRIALS CONCRETE SOLUTIONS JACKETS CONTRACTORS NORWAY CONTRACTORS INTERNATIONAL
2Q 2008 INTERIM REPORT Unaudited
 2Q 2008 INTERIM REPORT Unaudited HIGH UTILISATION AND STRONG CASH FLOW IN 2Q 2008 Ocean HeavyLift ASA (OHL) continues to deliver strong results in the second quarter of 2008. TC equivalent revenues came
Eidesvik Offshore ASA Annual General Meeting
 Eidesvik Offshore ASA Annual General Meeting 23.05.2018 Supply 7 vessels Seismic 11 vessels Subsea 4 vessels Revenues MNOK 755 457 employees Operates 26 ships The offshore wind market Contract extension
ANCHOR-LINE TENSION CALIBRATION SERVICE OVERVIEW
 ANCHOR-LINE TENSION CALIBRATION SERVICE w w w. i n c o n t r o l. n o OVERVIEW About Us About Us InControl AS descends from the Instrumentation & Control division of Amitec AS (former FK Smith AS/Sandven
Aker companies investor day, London Jan Arve Haugan, President & CEO Eiliv Gjesdal, CFO
 Aker companies investor day, London Jan Arve Haugan, President & CEO Eiliv Gjesdal, CFO This is Kvaerner CONCRETE SOLUTIONS JACKETS TOPSIDES ONSHORE Global leader in marine concrete structures European
DOF ASA 1Q Presentation
 DOF ASA 1Q Presentation CEO Mons Aase CFO Hilde Drønen Agenda Highlights Overview 1Q Financial DOF ASA 1 Q Presentation - 2 Highlights 1Q Skandi Mongstad and Geograph delivered from yard Long term contracts
Presentasjon av Farstad Shipping ASA
 Rederiforbundet 01.03.16 Presentasjon av Farstad Shipping ASA Karl-Johan Bakken - CEO Torstein L. Stavseng - CFO Farstad Shipping ASA Looking ahead from 2015 Dressing the Company for the Future Strategically
Aker ASA and Aker Drilling ASA
 The preferred partner AKER ASA Aker ASA and Aker Drilling ASA Presentation to Pareto Oil and Offshore Conference, 1-2 September 2010 Trond Brandsrud, CFO Aker ASA Geir Sjøberg, CEO Aker Drilling ASA This
NORWEGIAN AIR SHUTTLE ASA QUARTERLY REPORT SECOND QUARTER 2006 [This document is a translation from the original Norwegian version]
![NORWEGIAN AIR SHUTTLE ASA QUARTERLY REPORT SECOND QUARTER 2006 [This document is a translation from the original Norwegian version]](/thumbs/74/71229964.jpg "NORWEGIAN AIR SHUTTLE ASA QUARTERLY REPORT SECOND QUARTER 2006 [This document is a translation from the original Norwegian version]") NORWEGIAN AIR SHUTTLE ASA QUARTERLY REPORT SECOND QUARTER 2006 SECOND QUARTER IN BRIEF had earnings before tax of MNOK 24.8 (20.6) in the second quarter. The operating revenue increased by 44 % this quarter,
NORWEGIAN AIR SHUTTLE ASA QUARTERLY REPORT SECOND QUARTER 2006 SECOND QUARTER IN BRIEF had earnings before tax of MNOK 24.8 (20.6) in the second quarter. The operating revenue increased by 44 % this quarter,
Norwegian Air Shuttle ASA
 Norwegian Air Shuttle ASA Q1 2018 Presentation 26 April 2018 Highlights Q1 2018 Successfully completed private placement of NOK 1.3 billion Added two 737-800s and six 787-9s to operations Launched interline
Rederi AB TransAtlantic. Årsstämma. Annual General Meeting CEO Henning E. Jensen. TransAtlantic Company presentation
 Rederi AB TransAtlantic Årsstämma TransAtlantic Company presentation Annual General Meeting 2013 CEO Henning E. Jensen TransAtlantic in Brief Two business areas Industrial Shipping (IS), HQ Gothenburg
PRELIMINARY ACCOUNTS FOR 2012
 INTERIM REPORT FOR Q4 2012 AND INTERIM REPORT FOR Q4 2012 AND PRELIMINARY ACCOUNTS FOR 2012 HIGHLIGHTS Q4 with growth in volume and improved normalized EBITDA MNOK 261 improvement in normalized EBITDA
Summary of Results for the First Three Quarters FY2015/3
 Summary of Results for the First Three Quarters FY2015/3 February 10, 2015 Tokyu Corporation (9005) http://www.tokyu.co.jp/ Contents Ⅰ.Executive Summary 2 Ⅱ.Conditions in Each Business 5 Ⅲ.Details of Financial
NORWEGIAN AIR SHUTTLE ASA QUARTERLY REPORT FIRST QUARTER 2004 [This document is a translation from the original Norwegian version]
![NORWEGIAN AIR SHUTTLE ASA QUARTERLY REPORT FIRST QUARTER 2004 [This document is a translation from the original Norwegian version]](/thumbs/87/95085804.jpg "NORWEGIAN AIR SHUTTLE ASA QUARTERLY REPORT FIRST QUARTER 2004 [This document is a translation from the original Norwegian version]") NORWEGIAN AIR SHUTTLE ASA QUARTERLY REPORT 2004 IN BRIEF At the start of 2003, Norwegian has become a pure low-fare airline. The Fokker F-50 operations have been terminated, and during the quarter the
NORWEGIAN AIR SHUTTLE ASA QUARTERLY REPORT 2004 IN BRIEF At the start of 2003, Norwegian has become a pure low-fare airline. The Fokker F-50 operations have been terminated, and during the quarter the
Norwegian Air Shuttle ASA
 Norwegian Air Shuttle ASA Q4 2017 Presentation 15 February 2018 Highlights Q4 2017 Added one 737-800 and two 787-9s to operations Financed the first aircraft with a combination of UKEF and JOLCO Agreed
Q FLEET STATUS REPORT
 Seadrill Limited type 1 West Alpha 4th-HE 1986 2,000 23,000 Norway - - - - West Venture 5th-HE 2000 2,600 30,000 Norway - - - - West Phoenix 6th-HE 2008 10,000 30,000 Norway Equinor 2 Sep/18 Dec/18 Undisclosed
P esent n atio i n o n f or o H alf l Y e Y ar E n E d n e d d d 31 D ecemb m e b r 2 008
 Queensland WA & QLD Report Summary Strong revenue growth of 61.8% to $234.5m Strong cash flow from operations of $20.9m Net debt to equity 23.2% Underlying net profit of $8.2m (before goodwill impairment
Interim Report 3m Bilfinger Berger SE, Mannheim May 10, 2012 Joachim Müller, CFO
 Interim Report 3m 2012 Bilfinger Berger SE, Mannheim May 10, 2012 Joachim Müller, CFO Bilfinger Berger SE Interim report 3m 2012 May 10, 2012 Page 1 3m 2012: Highlights Growth in output volume and orders
Interim Report 6m 2014
 August 11, 2014 Interim Report 6m 2014 Investors and Analysts Conference Call on August 11, 2014 Joachim Müller, CFO Latest ad-hoc release (August 4, 2014) Reduction of forecast, primarily due to a further
Presentation on Results for the 2nd Quarter FY Idemitsu Kosan Co.,Ltd. November 14, 2018
 Presentation on Results for the 2nd Quarter FY 2018 Idemitsu Kosan Co.,Ltd. November 14, 2018 Table of Contents 1. FY 2018 2nd Quarter Financials (1) Overview (2) Segment Information 2. Reference Materials
Investor Update April 2009
 I t U d t Investor Update April 2009 Strong First Half Performance Revenue $78.9 million, 26% pcp Pre-tax profit $15.5m, 45% pcp Net profit after tax $12.2m, 63% 2m pcp Earnings per share of 6.7c, 31%
Falkland Oil and Gas Limited ( FOGL or the Company ) Preliminary Results for the year ended 31 December 2007
 Preliminary Results for the year ended 31 December 2007") Wednesday 12 March 2008 Falkland Oil and Gas Limited ( FOGL or the Company ) Preliminary Results for the year ended 31 December 2007 FOGL, the oil and gas exploration company focused on its extensive licence
Wednesday 12 March 2008 Falkland Oil and Gas Limited ( FOGL or the Company ) Preliminary Results for the year ended 31 December 2007 FOGL, the oil and gas exploration company focused on its extensive licence
Summary of Results for the First Quarter of FY2015/3
 Summary of for the First Quarter of FY2015/3 August 8, 2014 Tokyu Corporation (9005) http://www.tokyu.co.jp/ Contents Ⅰ.Executive Summary 2 Ⅱ.Conditions in Each Business 4 Ⅲ.Details of Financial for the
Preliminary Figures FY 2016
 February 14, 2017 Preliminary Figures FY 2016 Capital Markets Day 2017 Tom Blades (CEO) Disclaimer This presentation has been produced for support of oral information purposes only and contains forwardlooking
26 October 2017 Icelandair Group Interim Report NET PROFIT USD 101 MILLION IN THIRD QUARTER
 NET PROFIT USD 101 MILLION IN THIRD QUARTER Total income in Q3 up by 10% between years, to USD 536.0 million Passenger revenue higher than expected EBITDA unchanged year on year, at USD 161.1 million Passenger
Air China Limited Interim Results. August Under IFRS
 Air China Limited 21 Interim Results Under IFRS August 21 1 Agenda 21 Interim Results Overview Business Overview Financial Overview Outlook 2 2 2 21 Interim Results 3 21 Interim Results Overview 4 4 4
Globus Maritime Limited Trading Update and Financial Highlights for the Three Months and Nine Months Ended September 30, 2007.
 Globus Maritime Limited Trading Update and Financial Highlights for the Three Months and Nine Months Ended September 30, 2007. Athens, Greece, November 15, 2007. Globus Maritime Limited (AIM: GLBS), a
Presentation on Results for the 2nd Quarter FY Idemitsu Kosan Co.,Ltd. November 1, 2016
 Presentation on Results for the 2nd Quarter FY 2016 Idemitsu Kosan Co.,Ltd. November 1, 2016 Table of Contents 1. 2nd Quarter FY 2016 Financials (1) Overview (2) Segment Information 2. Reference Materials
SAS AB Analyst meeting
 SAS AB Analyst meeting London, August 9, 2001 2 2nd Quarter a tough Quarter The Marketplace Continued weak world economy Weaker Swedish economy SAS Weaker traffic growth and reduced passenger load factors
1st quarter 2005: Status and outlook
 1st quarter 2005: Status and outlook Leif-Arne Langøy, President & CEO Bengt A Rem, CFO Oslo, 28 Agenda Group update Details 1Q05 performance Closing remarks Q&A Leif-Arne Langøy Bengt A Rem Leif-Arne
4th quarter results February 2012
 4th quarter results 2011 14 February 2012 KVÆRNER ASA FOURTH QUARTER RESULTS 2011 HIGHLIGHTS Longview achieved substantial completion Kollsnes project completed Sakhalin-1 GBS project reached Mechanical
Presentation on Results for the 1st Quarter FY Idemitsu Kosan Co.,Ltd. August 14, 2017
 Presentation on Results for the 1st Quarter FY 2017 Idemitsu Kosan Co.,Ltd. August 14, 2017 Table of Contents 1. FY 2017 1st Quarter Financials (1) Overview (2) Segment Information 2. Reference Materials
Capital Markets Day 10 January 2013
 Capital Markets Day 10 January 2013 Time Topic Speaker 09.00 Introduction Jan Arve Haugan, President & CEO 09.20 Concept / Front End, Engineering and Procurement Janne H. Rasten, EVP Project Support Tony
INTERIM REPORT FOR Q2 AND FIRST HALF
 INTERIM REPORT FOR Q2 INTERIM REPORT FOR Q2 AND FIRST HALF 2011 HIGHLIGHTS Profit of NOK 62 million in Q2 for Hurtigruten Pre-tax profit NOK 62 million (NOK 142 million) Bus assets written down NOK 40
Q Fast growth continued, Comparable operating result at record high levels Pekka Vauramo
 2018 Fast growth continued, Comparable operating result at record high levels 17.7.2018 Pekka Vauramo 2 A good - Comparable operating result increased to new seasonal high Revenue Comparable operating
H1 RESULTS 2007 Jón Karl Ólafsson, CEO
 H1 RESULTS 2007 Jón Karl Ólafsson, CEO Agenda 01 Highlights 02 Financial results 03 Outlook 04 New organizational chart 05 Q & A H1 Highlights Aggressive fleet growth characterizes H1 results 12 aircraft
Presentation on Results for the 3rd Quarter FY Idemitsu Kosan Co.,Ltd. February 14, 2019
 Presentation on Results for the 3rd Quarter FY 2018 Idemitsu Kosan Co.,Ltd. February 14, 2019 Table of Contents 1. FY 2018 3rd Quarter Results (1) Overview (2) Segment Information 2. Forecast for FY 2018
KOREAN AIR 4Q17 FINANCIAL RESULTS
 KOREAN AIR 4Q17 FINANCIAL RESULTS 1 Disclaimer This presentation is for informational purposes only, contains preliminary financial and other information about Korean Air Lines Co., Ltd. and is subject
FLEET STATUS REPORT. Seadrill Limited. Drilling depth (feet) Location Current contract Client Start Expire Dayrate US$ D a.
 Location Current contract Client Start Expire Dayrate US$ D a.") Seadrill Limited Semi-submersibles type 1 a West Alpha 2 4th-HE 1986 2,000 23,000 Norway - - - - West Venture 2 5th-HE 2000 2,600 30,000 Norway - - - - West Phoenix 2 6th-HE 2008 10,000 30,000 UK Anasuria
Seadrill Limited Semi-submersibles type 1 a West Alpha 2 4th-HE 1986 2,000 23,000 Norway - - - - West Venture 2 5th-HE 2000 2,600 30,000 Norway - - - - West Phoenix 2 6th-HE 2008 10,000 30,000 UK Anasuria
Copa Holdings Reports Net Income of US$113.9 Million for the Fourth Quarter of 2013
 Copa Holdings Reports Net Income of US$113.9 Million for the Fourth Quarter of 2013 Panama City, Panama --- February 12, 2014. Copa Holdings, S.A. (NYSE: CPA), today announced financial results for the
OPERATING AND FINANCIAL HIGHLIGHTS
 Copa Holdings Reports Net Income of US$18.6 Million and EPS of US$0.42 for the Second Quarter of 2010 Excluding special items, adjusted net income came in at $26.3 million, or $0.60 per share Panama City,
Copa Holdings Reports Net Income of $136.5 million and EPS of $3.22 for the First Quarter of 2018
 Copa Holdings Reports Net Income of $136.5 million and EPS of $3.22 for the First Quarter of 2018 May 9, 2018 PANAMA CITY, May 9, 2018 /PRNewswire/ -- Copa Holdings, S.A. (NYSE: CPA), today announced financial
Aker Status and outlook January - June 2008
 Aker Status and outlook January - June 2008 Oslo, 15 August 2008 Aker Jan-June 2008 Agenda Highlights Leif-Arne Langøy, Chairman & CEO, Aker Aker 2Q08 financials Bengt A Rem, Senior Partner & CFO, Aker
Financial Results 1 st Quarter Mar/2016 (FY2015) 30 July, 2015
 30 July, 2015") Financial Results Mar/2016 (FY2015) 30 July, 2015 Today s Topics P.2 P.3 P.15 1 Overview of FY Mar/2016 Financial Results Operating Revenue Operating Profit 320 307.0 +4.9Bn (+1.6%) 312.0 50 +17.6Bn (+94.6%)
Financial Results Mar/2016 (FY2015) 30 July, 2015 Today s Topics P.2 P.3 P.15 1 Overview of FY Mar/2016 Financial Results Operating Revenue Operating Profit 320 307.0 +4.9Bn (+1.6%) 312.0 50 +17.6Bn (+94.6%)
PRESS RELEASE Financial Results. Rising passenger traffic at 12.5m Exceeding 1bn in consolidated revenue
 PRESS RELEASE 2016 Financial Results Rising passenger traffic at 12.5m Exceeding 1bn in consolidated revenue Kifissia, 23 March 2017 AEGEAN reports full year 2016 results with consolidated revenue at 1,020m,
Golden Ocean Group Limited Q results March 1, 2007
 Golden Ocean Group Limited Q4 2006 results March 1, 2007 PROFIT & LOSS 2005 2006 (in thousands of $) 2006 2005 Oct-Dec Oct-Dec Jan - Dec Jan - Dec Operating Revenues 37 292 91 253 Time charter revenues
Tiger Airways Holdings Limited FY11 Results
 Tiger Airways Holdings Limited FY11 Results May 2011 Financial Year Ended 31 March 2011 Disclaimer The information contained in this presentation (the "Information") is provided by Tiger Airways Holdings
Cathay Pacific Airways Interim Results 04 August Cathay Pacific Airways Interim Results 6 August 2008
 Cathay Pacific Airways 2010 Interim Results 04 August 2010 Cathay Pacific Airways 2008 Interim Results 6 August 2008 Interim Result 1H 2010 1H 2009 Group Profit/(Loss) HK$6,840m HK$812m Group Turnover
Finnair Q Result
 17 August 2016 CEO Pekka Vauramo CFO Pekka Vähähyyppä Finnair Q2 2016 Result 1 Highlights of the second quarter The seventh consecutive quarter of profit improvement Fukuoka & Guangzhou route openings
OPERATING AND FINANCIAL HIGHLIGHTS. Subsequent Events
 Copa Holdings Reports Net Income of US$113.1 Million and EPS of US$2.57 for the First Quarter of 2015 Excluding special items, adjusted net income came in at US$106.0 million, or EPS of US$2.41 per share
VERY GOOD RESULTS IN OUR MOST IMPORTANT QUARTER
 VERY GOOD RESULTS IN OUR MOST IMPORTANT QUARTER Q3 EBITDA USD 161.8 million, as compared to USD 155.6 million in the corresponding quarter last year 19% increase in passenger numbers on international flights
Presentation on Results for the 3rd Quarter FY Idemitsu Kosan Co.,Ltd. February 2, 2016
 Presentation on Results for the 3rd Quarter FY 2015 Idemitsu Kosan Co.,Ltd. February 2, 2016 Table of Contents 1. 3 rd Quarter FY 2015 Financials (1) Overview (2) Segment Information 2. Forecast for FY
Highlights from the Annual Results December 2007
 Highlights from the Annual Results December 2007 Disclaimer The information in this document is taken from the BAA 2007 Annual Results ( the Results ) which were published on 11 March 2008 and other public
Copa Holdings Reports Record Earnings of US$41.8 Million for 4Q06 and US$134.2 Million for Full Year 2006
 Copa Holdings Reports Record Earnings of US$41.8 Million for 4Q06 and US$134.2 Million for Full Year 2006 Panama City, Panama --- March 7, 2007. Copa Holdings, S.A. (NYSE: CPA), parent company of Copa
Summary o f Results for the First Half of FY2018
 Summary o f Results for the First Half of FY2018 November 9, 2018 (9005) https://www.tokyu.co.jp/ Contents Ⅰ.Executive Summary 2 Ⅱ.Conditions in Each Business 6 Ⅲ.Details of Financial Results for the 13
More cruise nights and marginally improved result
 INTERIM REPORT FOR Q1 2011 HIGHLIGHTS More cruise nights and marginally improved result Pre-tax result improved by NOK 7 million from Q1 2010 8.6% more cruise nights improved the capacity utilization to
3rd Quarter 2004: Status and outlook
 3rd Quarter 2004: Status and outlook Leif-Arne Langøy, President & CEO Bengt A Rem, CFO Oslo, 26 November 2004 Agenda Group update Details 3Q04 performance Concluding remarks Q&A session Leif-Arne Langøy
Copa Holdings Reports Earnings of US$30.3 Million and EPS of US$0.70 for 3Q08
 Copa Holdings Reports Earnings of US$30.3 Million and EPS of US$0.70 for 3Q08 Panama City, Panama --- November 13, 2008. Copa Holdings, S.A. (NYSE: CPA), parent company of Copa Airlines and Aero Republica,
Conference Philip Adkins (CEO) Cristijn Sarvaas (CFO) September 2008
 Cristijn Sarvaas (CFO) September 2008") Pareto Oil & Offshore Conference 2008 Philip Adkins (CEO) Cristijn Sarvaas (CFO) September 2008 9/21/2008 2 Fairstar in brief Founded in 2005 to become a leading provider of high-end ocean transportation
Pareto Oil & Offshore Conference 2008 Philip Adkins (CEO) Cristijn Sarvaas (CFO) September 2008 9/21/2008 2 Fairstar in brief Founded in 2005 to become a leading provider of high-end ocean transportation
OPERATING AND FINANCIAL HIGHLIGHTS SUBSEQUENT EVENTS
 Copa Holdings Reports Net Income of US$6.2 Million and EPS of US$0.14 for the Third Quarter of 2015 Excluding special items, adjusted net income came in at $37.4 million, or EPS of $0.85 per share Panama
OPERATING AND FINANCIAL HIGHLIGHTS SUBSEQUENT EVENTS
 Copa Holdings Reports Financial Results for the Third Quarter of 2016 Excluding special items, adjusted net income came in at $55.3 million, or adjusted EPS of $1.30 per share Panama City, Panama --- November
Fact Sheet for Q and H July 21, 2016
 Fact Sheet for Q2 2016 and H1 2016 July 21, 2016 Contents Daimler Group Stock Market Information 3 Earnings and Financial Situation 4-13 Information for Divisions Mercedes-Benz Cars 14-17 Daimler Trucks
Fact Sheet for Q4 and Full Year 2016 February 2, 2017
 Fact Sheet for Q4 and Full Year 2016 February 2, 2017 Contents Daimler Group Stock Market Information 3 Earnings and Financial Situation 4-13 Information for Divisions Mercedes-Benz Cars 14-17 Daimler
OPERATING AND FINANCIAL HIGHLIGHTS
 Copa Holdings Reports Financial Results for the Fourth Quarter of 2018 Excluding special items, adjusted net profit came in at $44.0 million, or Adjusted EPS of $1.04 Panama City, Panama --- February 13,
OPERATING AND FINANCIAL HIGHLIGHTS
 Copa Holdings Reports Net Income of US$32.0 Million and EPS of US$0.72 for the Second Quarter of 2012 Excluding special items, adjusted net income came in at $58.6 million, or EPS of $1.32 per share Panama
OPERATING AND FINANCIAL HIGHLIGHTS
 Copa Holdings Reports Financial Results for the Fourth Quarter of 2015 Excluding special items, adjusted net income came in at $31.7 million, or EPS of $0.73 per share Panama City, Panama --- February
Morgan Stanley 2011 Emerging Companies Conference 9 June 2011
 Morgan Stanley 2011 Emerging Companies Conference 9 June 2011 Company Overview Mermaid Marine Australia Limited (MMA) is Australia s largest integrated marine services provider to the offshore oil and
Air China Limited Annual Results. March Under IFRS
 Air China Limited 21 Annual Results Under IFRS March 211 Agenda Part 1 Highlights Part 2 Business Overview Part 3 Financial Overview Part 4 Outlook 2 Part 1 Highlights Steady Economic Growth; Asia Pacific
Presentation on Results for the 3rd Quarter FY Idemitsu Kosan Co.,Ltd. February 14, 2018
 Presentation on Results for the 3rd Quarter FY 2017 Idemitsu Kosan Co.,Ltd. February 14, 2018 Table of Contents 1. FY 2017 3rd Quarter Results (1) Overview (2) Segment Information 2. Forecast for FY2017
Ferrovial increases net profit by 12%, to 287 million euro
 All-time record backlog: 23.695 billion euro Ferrovial increases net profit by 12%, to 287 million euro Revenues expanded by 2.8% to 3.758 billion euro, supported by solid performance in the international
Second Quarter 2016 Presentation
 Second Quarter 2016 Presentation Scanship Holding ASA August 31, 2016 Henrik Badin CEO Christian Fr. Thyholdt - CFO Disclaimer This presentation (the Presentation ) has been produced by Scanship Holding
ASL Marine Holdings Ltd.
 ASL Marine Holdings Ltd. SHIPBUILDING SHIPREPAIR SHIPCHARTERING Pulse of Asia 2008 - Presentation 8 th July 2008 1 Presentation Outline Company Profile 9M FY2008 Financial Review Business Review - Shipbuilding
2012 RESULT PRESENTATION
 212 RESULT PRESENTATION BJÖRN ROSENGREN, PRESIDENT & CEO 25 JANUARY 213 Wärtsilä Net sales back to growth with stable profitability 212 development Order intake EUR 4,94 million, +9% Net sales EUR 4,725
TUI Group Investor Presentation
 TUI Group Investor Presentation WestLB Deutschland Conference Frankfurt, 18-19 November 2009 TUI AG Investor Relations Seite 1 Agenda I. Group overview II. Financials III. Outlook 2009 IV. Financing update
Fact Sheet for Q3 and January-September 2017 October 20, 2017
 Fact Sheet for Q3 and January-September 2017 October 20, 2017 Contents Daimler Group Stock Market Information 3 Earnings and Financial Situation 4-12 Information for Divisions Mercedes-Benz Cars 13-16
PRESS RELEASE. First Half 2017 Financial Results Higher Load Factors and traffic lead to a significant rebound in second quarter profitability
 PRESS RELEASE First Half 2017 Financial Results Higher Load Factors and traffic lead to a significant rebound in second quarter profitability Kifissia, 12 September 2017 AEGEAN announces first half 2017
OPERATING AND FINANCIAL HIGHLIGHTS. Subsequent Events
 Copa Holdings Reports Net Income of $103.8 million and EPS of $2.45 for the Third Quarter of 2017 Excluding special items, adjusted net income came in at $100.8 million, or EPS of $2.38 per share Panama
Icelandair Group Financial Results for the first half and Q2 2007
 Icelandair Group Financial Results for the first half and Q2 2007 Total revenue for H1 2007 was ISK 28.1 billion compared to ISK 24.1 billion for H1 2006, an increase of 17%. Total revenue for Q2 2007
AVINOR Debt investor presentation November 2017
 1 AVINOR Debt investor presentation November 2017 Agenda Key credit highlights Aviation in Norway and Avinor mission Ownership and regulatory structure Business areas Strategy Key projects Financial performance
Copa Holdings Reports Fourth Quarter and Full Year 2007 Results
 Copa Holdings Reports Fourth Quarter and Full Year 2007 Results Panama City, Panama --- February 21, 2008. Copa Holdings, S.A. (NYSE: CPA), parent company of Copa Airlines and Aero Republica, today announced
Copa Holdings Reports Net Income of $49.9 million and EPS of $1.18 for the Second Quarter of 2018
 Copa Holdings Reports Net Income of $49.9 million and EPS of $1.18 for the Second Quarter of 2018 Panama City, Panama --- Aug 8, 2018. Copa Holdings, S.A. (NYSE: CPA), today announced financial results
OPERATING AND FINANCIAL HIGHLIGHTS. Subsequent Events
 Copa Holdings Reports Financial Results for the First Quarter of 2016 Excluding special items, adjusted net income came in at US$69.9 million, or EPS of US$1.66 per share Panama City, Panama --- May 5,
USD thousand Q Q Change % Change 12M 2015
 EBITDA POSITIVE IN FIRST-QUARTER EBITDA positive by USD 1.1 million, as compared to a negative outcome of USD 2.3 million last year Positive impact of low fuel prices on performance 21% increase in passenger
2012 Result. Mika Vehviläinen CEO
 2012 Result Mika Vehviläinen CEO 1 Agenda Market environment in Q4 Business performance and strategy execution Outlook Financials 2 Market Environment According to IATA, Global air travel continues to
Copa Holdings Reports Net Income of $57.7 million and EPS of $1.36 for the Third Quarter of 2018
 Copa Holdings Reports Net Income of $57.7 million and EPS of $1.36 for the Third Quarter of 2018 November 14, 2018 PANAMA CITY, Nov. 14, 2018 /PRNewswire/ -- Copa Holdings, S.A. (NYSE: CPA), today announced
JET AIRWAYS (I) LTD. Presentation on Financial Results Q July 24, 2009
 LTD. Presentation on Financial Results Q July 24, 2009") JET AIRWAYS (I) LTD Presentation on Financial Results Q1 2010 July 24, 2009 1 1 1 Agenda Domestic operating environment Jet Airways performance highlights JetLite performance highlights Outlook 2 2 2 Domestic
JET AIRWAYS (I) LTD Presentation on Financial Results Q1 2010 July 24, 2009 1 1 1 Agenda Domestic operating environment Jet Airways performance highlights JetLite performance highlights Outlook 2 2 2 Domestic
Growth and strategic development. 3 January 2019
 Growth and strategic development 3 January 2019 3 key messages 1) Strong foundation for development 2) Market environment with new opportunities 3) Clear growth strategy 2 3 Status Some few examples from
Investor Presentation
 TUI Group Investor Presentation WestLB Deutschland Conference 2010 17 November 2010 TUI AG Investor Relations Seite 1 Future-related related statements This presentation contains a number of statements
Finnair Group Interim Report 1 January 30 September 2008
 Finnair Group Interim Report 1 January 30 September 2008 1 31/10/2008 Presentation name / Author Airline industry at a historical turning point Expensive fuel price in the beginning of 2008 has dramatical
Ramsay Health Care Limited Results Briefing Half Year ended 31 December 2018
 Ramsay Health Care Limited Results Briefing Half Year ended 31 December 2018 Craig McNally, Group Managing Director & Bruce Soden, Group Finance Director 28 February 2019 ramsayhealth.com Agenda Group
COSCO CORPORATION. (SINGAPORE) LTD FY2003 Full Year Results. Presentation
 LTD FY2003 Full Year Results. Presentation") COSCO CORPORATION (SINGAPORE) LTD FY2003 Full Year Results Presentation 11 February 2004 1 Outline of Presentation 1. Background & Corporate Restructuring Exercise 2. Operations Review 3. Financial Review
COSCO CORPORATION (SINGAPORE) LTD FY2003 Full Year Results Presentation 11 February 2004 1 Outline of Presentation 1. Background & Corporate Restructuring Exercise 2. Operations Review 3. Financial Review
ATWOOD OCEANICS, INC.
 ATWOOD OCEANICS, INC. Bank of America Securities 2005 Energy Conference November 13 15, 2005 Forward Looking Disclaimer Except for the historical information contained herein, the matters discussed in
Q Finnair s growth continued Pekka Vähähyyppä
 2018 Finnair s growth continued 25.10.2018 Pekka Vähähyyppä 1 We continued to develop our services and network New route to Los Angeles in 2019, two daily flights to Hong Kong New digital service for exploring
VR Group s result for 2018 was excellent rail traffic volumes increased
 Press release 1 (5) VR Group s result for 2018 was excellent rail traffic volumes increased Financial details for 2018 presented in this press release are unaudited FAS figures. The figures in brackets
DFDS A/S H Analyst meeting 30 August 2006
 DFDS A/S H1 2006 Analyst meeting 30 August 2006 DFDS A/S Contents The half-year in brief Strategy on track DFDS Seaways DFDS Tor Line Half-year accounts & profit forecast 2006 DFDS A/S H1 2006 in brief