The Housing Crisis in Puerto Rico and the Impact of Hurricane Maria*
|
|
|
- Arthur Richards
- 5 years ago
- Views:
Transcription


1 The Housing Crisis in Puerto Rico and the Impact of Hurricane Maria* Jennifer Hinojosa and Edwin Meléndez *We would like to acknowledge the invaluable comments on an earlier version from: the staff from the National Council of State Housing Agencies; Marcos Morales from UnidosUS; Miriam Colon from the NYC Housing Preservation and Development; Bill O Dell, Maria Estefania Barrios, Nancy Clark, and Martha Kohen from the University of Florida; and Erika Ruiz, Marion McFadden, and Michelle Whetten from Enterprise Community. All remaining errors or omissions are ours. Issued June 2018 Centro RB
2 Introduction By all counts, Puerto Rico s housing market is in a deep and prolonged crisis. At least 18 percent of Puerto Rico s housing stock is vacant as a result of the island s prolonged economic recession, which commenced in 2006, and the spike in foreclosures after Hurricane Maria suggests that vacant units are increasing at an accelerated rate. Puerto Rico s economic recession led to depopulation and the loss of jobs, which induced a decline of home equity values and an increase in foreclosures. More recently, Puerto Rico s housing stock has been damaged due to Hurricane Maria, which devastated the island on September 20, The effects of the economic crisis and the impact of Hurricane Maria (2017) further depreciated Puerto Rico s housing market leading many families to either leave Puerto Rico, stay within their damaged homes, or move with other families within the island. Perhaps the clearest indicator of the housing crisis is that pre-hurricane Maria, Puerto Rico lost about 45,880 households while adding 115,197 net housing units from 2005 to Because of this clear unbalance between the increase in the supply of housing and a sharp decline in demand for housing, Puerto Rico s median home values have declined across the island by at least 10 percent since Furthermore, aggravating the potential demand for housing in the immediate future, median household income declined by 5 percent, from $21,458 in to $20,078. The purpose of this report is to analyze Puerto Rico s housing market during the economic recession period (2006 to 2016) using data from the U.S. Census Bureau to understand the state of the housing market prior to Hurricane Maria and post-hurricane Maria (to the extent that data is available). We analyze Puerto Rico s housing vacancy rate, median home values, housing tenure, and the building of new residential structures, key indicators of the housing market. In this context, we also present data on residential mortgage delinquencies and in process of foreclosures, including available data post-hurricane Maria. In sum, we discuss primarily the challenges that Puerto Rico s housing market faced prior to the impact of Hurricane Maria. The detailed profile of the housing market is imperative to understand both the impact of Hurricane Maria and policy options moving forward. The excess supply of vacant homes in Puerto Rico is a clear impediment to economic recovery. Yet, the high vacancy rate potentially could provide housing for displaced Hurricane Maria victims. More broadly, it could also provide an opportunity to the expansion of affordable rental units that are built to code and resilient, and potential new homeownership opportunities as well. However, it is not known whether or not these vacant housing units may come back on the market or whether they were damaged by one or both of the storms (Hurricane Irma and Hurricane Maria). Social purpose housing demand may be expected to be highest post-hurricane Maria, especially during the restructuring phase. In this report, we focus on single-family structures, which are the most prevalent in Puerto Rico. There are multi-family units and other vacant buildings, especially those owned by the government, such as closed school buildings, that could also be converted to social purpose housing. Yet, at the moment, we do not have comprehensive data on the actual stock of these buildings or their ownership. However, many of these properties will have similar problems of financing and rehabilitation, project management and many of the barriers addressed in this report. In the final section of this study, we address what can be done to rebuild damaged homes while undertaking policies that could help the battered and 2016, U.S. Census Bureau, American Community Survey (1-year estimates) 2 Adjusted for inflation. 2
3 Introduction housing market stabilize and start the arduous road to recovery. We believe it is possible to implement a housing program in which vacant units are converted into affordable housing to accommodate the families that lost their homes and to mitigate the endemic challenge of widespread informal housing not built to code. The expected flow of federal assistance to reconstruct the island offers a unique opportunity to transfer vacant housing units to social purpose utilization. We propose that an adaptation of the Low-Income Housing Tax Credit (LIHTC) in conjunction with the Community Development Block Grant Disaster Recovery (CDBG-DR) could support the financing of a massive purchase and rehabilitation of vacant housing units for conversion to social purposes. In neighborhoods where most homes are resilient, damaged and vacant homes can be rehabbed or demolished through CDBG-DR, making room for construction of homes that meet code and are resilient against climate events. Considering the high level of poverty on the island, without rental subsidies this housing will not be able to reach families with extremely low income (30% of area median income) or very low income (50% of area median income), as defined by the U.S. Department of Housing and Urban Development (HUD) that sets the income thresholds households must not exceed in order to qualify for HUDassisted housing. Such a program would be a first step toward closing the gap between availability and the weakened market demand for housing in Puerto Rico and lead to more stable housing prices while removing units from the housing stock that might not be built up to code. Yet, community planning and residents participation are critical elements in the implementation of any program aimed at mitigating the impact of Hurricanes Irma and Maria on the homes of the most vulnerable segments of the population and the decade-long housing crisis in Puerto Rico. 3
4 Housing Stock (Occupancy versus Vacancy) In 2016, according to the U.S. Census Bureau, of the 1.5 million housing units in Puerto Rico, 18 percent were vacant 3 and the remaining 82 percent were occupied. By comparison, in the fourth quarter 2017, according to the U.S. Census Bureau, approximately 12.2 percent of the housing units in the United States were vacant. 4 The number of vacant homes increased in Puerto Rico from 11 percent in 2006 to 18 percent in 2016, a 64 percent change. As shown in Figure 1, the number of vacant homes in Puerto Rico quickly rose after the 2006 economic crisis, and steadily increased between 2007 and To date, at least 273,093 homes in 2016 were vacant relative to 153,493 homes in Figure 1. Percent Non-Recreational Vacant Housing Units, used for migrant workers, and lastly (5) other vacant homes 6 (Kresin 2013). In the case of Puerto Rico, more than half of the vacant homes (57%) were categorized as other vacant homes, and it may include foreclosed homes and/or abandoned homes. While the remaining 43 percent were: seasonal or recreational use (21%), at the time on the market for sale (9%) or on the market for rent (9%), sold but not occupied (2%), and lastly rented, but not occupied at the time (1%). Homes considered as recreational or seasonal use, also known as vacation homes, remained steady from 22 percent to 21 percent, although it was the highest in 2012 at 26 percent and in 2013 at 25 percent. The largest proportion of recreational vacant housing units are located in Cabo Rojo (11%) followed by San Juan (8%), Carolina (5%), Humacao (4%), and Río Grande (4%). More interestingly, of all Source: American Community Survey Recreational versus Non-Recreational Vacant Homes 5 It is important to note that there are different reasons a home is categorized as vacant. According to the U.S. Census Bureau, vacant homes are either: (1) vacant homes available to rent, (2) vacant homes rented, but not occupied, (3) vacant homes sold, but not occupied, (4) vacant homes vacant housing units in Cabo Rojo, at least 69 percent are designated as recreational homes. Similarly, 65 percent of Culebra s vacant housing units are recreational homes, followed by Luquillo (62%), Vieques (54%), Fajardo (50%), and Rio Grande (49%). In Puerto Rico, vacant homes on the market (for sale or for rent) steadily declined, especially after the onset of the economic crisis. Vacant homes for sale were 10 percent in 3 According to the U.S. Census Bureau, a vacant housing unit is defined as no one is living in it at the time of the interview. 4 U.S. Census Bureau, Quarterly Residential Vacancies and Homeownership, Fourth Quarter 2017, Release Number: CB18-08, January 30, This report separates vacant homes as non-recreational and recreational use, because homes in Puerto Rico are used as either second-homes or vacation homes and at the time the survey was taken they may have been vacant. This report aggregates the following categories: (1) vacant homes available to rent, (2) vacant homes rented, but not occupied, (3) vacant homes that are sold, but not occupied, (3) vacant homes used for migrant workers, and (4) other vacant homes, for non-recreational purposes, while recreational homes include vacant homes used as second homes for recreational/seasonal use. 6 Other vacant homes is defined is being repaired or renovations, does not want to rent or sell, is using the unit for storage, is elderly and living in a nursing home or with family members. Foreclosed properties may also be classified as other vacant in the vacant or occupied categories. 4

5 2006 and slightly declined to 9 percent in On the other hand, vacant homes for rent declined from 12 percent in 2006 to 9 percent in These patterns suggest that vacant properties on the market are taking longer to sell and/or to find tenants. Table 1. Non-Recreational Vacant Homes, 2016 Total Housing Units Non-Recreational Vacant Housing Units % Non-Recreational Vacant Housing Units Puerto Rico 1,571, ,798 16% Top 10 Counties 641, ,363 44% Lastly, vacant homes categorized as other vacant increased from 44 percent in 2006 to 57 percent in As previously mentioned, these vacant homes are likely to be foreclosed and/or abandoned. Such vacant homes are largely associated to higher crime rates, decline in property values overtime, furthering depopulation trends, and more importantly disinvestment in these communities. The majority of other vacant homes are found in San Juan (14%) followed by Ponce (4%), Carolina (4%), Arecibo (3%), Mayagüez (3%), Bayamón (3%), Vega Baja (3%), Caguas (2%), Toa Baja (2%), and Guaynabo (2%). San Juan Municipio 192,766 39,009 15% Bayamón Municipio 83,785 10,640 4% Ponce Municipio 66,906 10,532 4% Mayagüez Municipio 41,274 10,099 4% Carolina Municipio 77,771 9,902 4% Arecibo Municipio 41,400 7,758 3% Caguas Municipio 58,356 7,475 3% Yauco Municipio 17,252 6,361 2% Toa Baja Municipio 34,592 5,321 2% Aguadilla Municipio 27,365 5,266 2% Other Counties 930, ,435 56% In fact, Puerto Rico s proportion of vacant homes is greater compared to the nation as a whole and to other states in the U.S. mainland. In 2016, 8 percent7 of homes in the U.S. were vacant; this is at least 10 percentage points lower than Puerto Rico (18%). Relative to states, Puerto Rico (18%) had the highest percentage of vacant homes in 2016 followed by Alabama (13%), West Virginia (13%), Mississippi (13%), Louisiana (13%), Oklahoma (12%), New Mexico (12%), Arkansas (11%), Kansas (11%), and Missouri (11%). Source: 2016 U.S. Census Bureau, American Community Survey (5 Year Estimates) Vacant Homes by County Between 2000 and 2016, the number of vacant homes for other than recreational purposes increased across all counties in Puerto Rico, especially in urbanized counties and to a Figure 2. Vacant Homes by County, lesser extent municipalities located in the rural areas of the island. The majority of the vacant homes (non-recreational use) are concentrated within the San Juan metropolitan area and coastal counties. As shown in table 1, the top 10 counties with the largest number of vacant homes in 2016 include: San Juan (15%) followed by Bayamón (4%), Ponce (4%), Mayagüez (4%), Carolina (4%), Arecibo (3%), Caguas (3%), Yauco (2%), Toa Baja (2%), and Aguadilla (2%). On the other hand, counties located in the interior region and coastal eastern regions, such as Culebra (356), Florida (526), Maricao (618), Las Marias (647), Adjuntas (929), Maunabo (934), are among the counties with the lowest number of vacant homes for non-recreational use (see Appendix A for all counties). Does not include vacant homes used for seasonal, recreational, or occasional use. 5
6 Between 2000 and 2016 the following counties showed the largest absolute increase of non-recreational vacant homes: San Juan (+22,538), Mayagüez (+5,934), Bayamón (+5,233), Yauco (+4,633), Carolina (+4,389), Ponce (+4,307), Caguas (+4,139), Vega Baja (+3,554), Arecibo (+3,446), and Aguadilla (+2,933). This may be a direct result of demographic and social impacts such as depopulation, stale housing market, falling behind mortgage payments, and lack of employment forcing many households to leave their homes. Median Home Values 8 Economic conditions devalued homes across the island. As shown in Figure 3, as the number of vacant homes increased between 2000 and 2016, median home values declined in Puerto Rico. As of 2016, the median home values at $111,990 was at its lowest. This trend clearly illustrates the island s depressed housing market prior to Hurricane Maria. Recent median home values reported by Zillow.com, Realtor.com, and comparable data of properties values from Luis Figure 3. Median Home Values and Vacant Homes, Luis Abreu & Associates (LA&A) 9. Overall, similar trends were shown among all databases. For example, Realtor. com showed slightly higher median home sales price in Puerto Rico ($115,000), Zillow.com and comparable data from Luis Abreu & Associates showed slightly lower median home sales price of $110,000, comparable to the 2016 American Community Survey ($111,900). In all, median home values from all databases are similar. Pre- and post-hurricane Maria, Puerto Rico s housing market shows variations across counties, as most median home values declined while a few increased slightly. In other words, median home values of recent sales transaction vary across the island (especially in counties with a high percent of vacant housing stock), declining economic sector, and population loss. According to the U.S. Census Bureau, the median home value for Puerto Rico in 2016 had declined 16 percent (or $21,747) from the median home value of $133, in Guaynabo had the highest median home value at $199,100 followed by San Juan ($161,100), Gurabo ($156,700), Trujillo Alto ($155,700), Carolina ($150,300), Dorado ($148,600), Toa Alta ($146,900), Bayamón Source: U.S. Census Bureau, American Community Survey Abreu & Associates, were used to get a sense of recent home sale prices in Puerto Rico post-hurricane Maria. However, only 24 counties were reported by Realtor.com, 12 counties were reported by Zillow, and 78 counties were reported by ($141,100), Caguas ($137,300), and Toa Baja ($135,100). On the other hand, Las Marías ($75,500) had the lowest median home values followed by Peñuelas ($77,500), Guayanilla ($82,600), Salinas ($86,400), Lares ($87,500), Comerio ($89,000), Aguada ($89,900), Guanica ($90,000), Jayuya ($90,300), and Coamo ($90,500). More than half 8 Median home values was adjusted for Only home sale transactions between 2017 and 2018 were selected for this report. 10 Adjusted for 2016 inflation 6
 of Puerto Rico s counties experienced a decline in median home values during the economic crisis period, while the remaining 42 percent")
7 Figure 4. Median Home Value Change by County, 2009 and 2016 (58%) of Puerto Rico s counties experienced a decline in median home values during the economic crisis period, while the remaining 42 percent experienced an increase. As shown in Appendix B, Guaynabo (-$27,744) and Culebra (-$26,477) showed the highest decline in home values relative to the island as a whole (-$21,747) followed by San Juan (-$20,599), Trujillo Alto (-$20,048), Humacao (-$19,277), Florida (-$17,999), Las Marías (-$17,259), Carolina (-$14,218), Vieques (-$13,816), and Bayamón (-$12,300). While Aibonito (+$20,179), Aguas Buenas (+$16,117), Camuy (+$11,867), Aguadilla (+$11,801), Barranquitas (+$11,763), Maricao (+$10,874), Naranjito (+$10,861), Cayey (+$10,859), Gurabo (+$10,824), and Hormigueros (+$10,152) showed an increase in median home values between 2009 and The Housing Market Post-Hurricane Maria To analyze Puerto Rico s post-hurricane Maria housing market, we use 2017 and 2018 home sales transaction data from Luis Abreu & Associates, Realtor.com, and Zillow. com. In all, at least 50 percent of the island s counties experienced a decline in their median home values and the remaining 50 percent experienced a slight increase between 2016 (pre-hurricane Maria) and 2018 (post-hurricane Maria). Median home values in Puerto Rico further de11 12 clined from $117,86011 in 2016 to $110,00012 in 2018, a difference of $7,869. According to the Luis Abreu & Associates database, median home sales values were highest in Dorado ($215,000), followed by Guaynabo ($199,000), Vieques ($189,000), Culebra ($180,000), Canóvanas ($165,000), Rincón ($156,434), Toa Alta ($150,007), San Juan ($150,000), Cataño ($150,000), and Vega Alta ($149,000). On the other hand, Arroyo ($78,000), followed by Patillas ($78,000), Las Marías ($80,000), Maunabo ($80,500), Yabucoa ($84,000), Guanica ($85,000), Naguabo ($85,000), Ciales ($85,000), Peñuelas ($86,250), and Salinas ($86,500) showed the lowest median home sales values during post-hurricane Maria. Overall, among the top 10 counties with the highest decline in median home values between 2016 (pre-hurricane Maria) and 2018 (post-hurricane Maria) are: Trujillo Alto (-$31,006), Bayamón (-$28,627), Carolina (-$28,318), Ciales (-$24,232), Toa Baja (-$22,307), Patillas (-$21,014), San Juan (-$19,694), Arroyo (-$19,224), Hatillo (-$19,067), Maunabo (-$18,409), Quebradillas (-$15,209), Arecibo (-$14,688). As shown in appendix 1, Ciales (-22%) followed by Patillas (-21%), Arroyo (-20%), Bayamón (-19%), Trujillo Alto (-19%), Maunabo (-19%), Gurabo (-18%), Carolina (-18%), Hatillo (-16%), and Toa Baja (-16%) experienced the highest decline, in terms of percent change of median home values between 2016 and These coun- Adjusted for 2018 inflation Reported by Luis Abreu & Associates 7
8 ties were within one to twenty miles away from Hurricane Maria s trajectory, and that may have had an impact in the declining median home values (see Figure 10). According to the Realtor.com database, homes in Toa Alto had a median sales price of $83,500, this was at least $60,306 less compared to the 2016 American Community Survey estimates (5-year estimate) with a median value of $154, Similar declines were shown when comparing pre- 14 and post-hurricane Maria 15 prices: Cataño (-$68,980), Carolina (-$67,318), Trujillo Alto (-$60,306), Table 2. Post-Maria Median Home Sales Prices Reported by Zillow.com and Realtor.com Bayamón (-$58,627), Toa Baja (-$52,307), Juncos (-$42,293), Fajardo (-$40,268), Hormigueros (-$33,025), Caguas (-$29,624), Guayama (-$27,278), Arecibo (-$26,488), San Lorenzo (-$23,136), Ponce (-$19,229), San Juan (-$12,194), and Gurabo (-$6,059). On the other hand, homes with an increase of median home sales values included: Guayanilla (+$170,494), Utuado (+$49,539), Guaynabo (+$47,779), Rincón (+$39,699), Cabo Rojo (+$31,633), Dorado (+$10,472), and Vega Baja (+$5,604). As shown in Table 2, recent home sales reported by Zillow.com showed similar trends, whereas Carolina median 2016 ACS* (5-year estimates) Realtor.com Median Home Sales Price Median Home Value Difference between Realtor and 2016 ACS (5-year estimates) Zillow.com Median Home Sales Prices Median Home Value Difference between Zillow and 2016 ACS (5-year estimates) Puerto Rico $117,869 $101,000 -$17,369 $100,000 $17,869 Carolina Municipio $158,318 $91,000 -$67,318 $100,000 -$58,318 Bayamón Municipio $148,627 $90,000 -$58,627 $91,200 -$57,427 Trujillo Alto Municipio $164,006 $103,700 -$60,306 $107,500 -$56,506 Toa Baja Municipio $142,307 $90,000 -$52,307 $97,000 -$45,307 Naguabo Municipio $99, $65,000 -$34,646 Caguas Municipio $144,624 $115,000 -$29,624 $115,500 -$29,124 Arecibo Municipio $103,438 $76,950 -$26,488 $74,950 -$28,488 Vega Baja Municipio $118,396 $124,000 $5,604 $92,000 -$26,396 Ponce Municipio $105,229 $86,000 -$19,229 $80,900 -$24,329 Gurabo Municipio $165,059 $159,000 -$6,059 $144,950 -$20,109 Guaynabo Municipio $209,721 $257,500 $47,779 $221,000 $11,279 Cabo Rojo Municipio $118,817 $150,450 $31,633 $140,000 $21,183 Toa Alta Municipio $154,736 $83,500 -$71, Cataño Municipio $133,880 $64,900 -$68, Juncos Municipio $122,293 $80,000 -$42, Fajardo Municipio $110,917 $70,649 -$40, Hormigueros Municipio $115,025 $82,000 -$33, Guayama Municipio $100,278 $73,000 -$27, San Lorenzo Municipio $123,136 $100,000 -$23, San Juan Municipio $169,694 $157,500 -$12, Mayagüez Municipio $106,809 $101,000 -$5, Vega Alta Municipio $125,453 $124,000 -$1, Dorado Municipio $156,527 $166,999 $10, Rincón Municipio $134,301 $174,000 $39, Utuado Municipio $97,961 $147,500 $49, Guayanilla Municipio $87,006 $257,500 $170, Source: 2016 American Community Survey (5-year estimates), Zillow.com (data as of March 2018), Realtor.com (data as of April 2018) *Adjusted for 2018 inflation 13 Adjusted for 2018 inflation U.S. Census Bureau, American Community Survey, 5-year estimate 15 Realtor.com home sales prices as of
9 sales prices declined from $158,318 in 2016 to $100,000 in 2018, a difference of -$58,318. Similarly, Bayamón (-$57,427), Trujillo Alto (-$56,506), Toa Baja (-$45,307), Naguabo (-$34,646), Caguas (-$29,124), Arecibo (-$28,488), Vega Baja (-$26,396), Ponce (-$24,329), and Gurabo (-$20,109). On the other hand, Guaynabo (+$11,279) and Cabo Rojo (+$21,183) experienced an increase in their median home values after Hurricane Maria. In sum, damages caused by Hurricane Maria may have caused median home values to further decline compared to median home values reported by the 2016 American Community Survey (5-year estimates). Housing Market Indicators This section provides a general overview of Puerto Rico s core housing market indicators such as: price per square foot, building permits, cement sales/prices, employment in the construction industry, and economic activity index (GDB). Taken as a whole, these housing indicators depict a profoundly depressed housing market, one that clearly impedes the economic recovery of the island. Figure 5. Puerto Rico s Price per Square foot Change, a difference of $64. As shown in Figure 5, between 2011 and 2018, Puerto Rico s price per square foot significantly declined from $150 in 2011 to $85 in However, after September 2017, the post-hurricane Maria period, Puerto Rico s average price per square foot was at its lowest compared to the previous years (see Figure 5). The impact of Hurricanes Maria and Irma has had an adverse economic effect on Puerto Rico s housing market. New Residential Structures & Permits According to U.S. Census Bureau, between 2000 and 2016, a total of 166,504 building permits 17 for new residential construction were issued in Puerto Rico. A large proportion were authorized for single family housing units (71%) and the remaining 29 percent were for two or more housing units (see Figure 6). In the 15-year span, building permit authorization was steadily high between 2000 and 2005 ranging from 18,489 to 17,346; however, between 2006 and 2016, during the economic crisis period, housing permits dropped significantly from 14,718 to 2,528. Similarly, the number of building permits reported by the Government Development Bank for Puerto Rico 18 also showed a decline from 17,830 permits in 2006 to only 2,047 permits Source: Zillow.com As of February 2018, the price per square foot of a home in Puerto Rico was $85, relative to $141 in U.S. mainland. 16 The 2018 data reflects a reversal for Puerto Rico when compared to the United States (see Figure 5). Between 2010 and 2018, Puerto Rico s price per square foot was highest in 2010 at an average rate of $176 compared to $112 stateside, in Between 2006 and 2008, the number of building permits declined from 17,830 to 11,749. However, in 2009, building permits significantly reduced to 6,735 and further declined to 2,047 in Trends in building permits are the clearest indicator of the collapse of the housing market associated with the economic crisis in Puerto Rico. 16 Zillow.com and 2013 data was not available. 18 Data is only available from 2006 to
10 Figure 6. Building Permits Source: U.S. Census Bureau, New Residential Construction, Another indicator of Puerto Rico s housing market decline is cement sales, number of building permits, and economic activity (GDB). As shown in Figure 6, annual permits issued for single family housing units declined from 12,840 in 2000 to 1,554 in 2016, a change of -88 percent. Family housing with two or more units also showed a significant change of -83 percent, from 5,426 annual permits in 2000 to 915 permits in Cement sales is another indicator of housing demand. Puerto Rico s total cement sales declined by 68 percent, from $2.2 million in 2009 to $715,000 in In addition, Puerto Rico s economic activity (GDB) also declined from 144 in 2009 to 111 in 2018, a change of -23 percent. Figure 7. Puerto Rico s Residential Permits Issuance and Mining, Logging, and Construction Employees, Consistent with the trend of housing permit authorizations in Puerto Rico, the number of employees in the mining, logging, and construction sector also showed a downward spiral trend between 2000 and As shown in Figure 7, employment in the mining, logging, and construction industry ranged between 70,000 employees in 2000 to 63,000 in 2005; however, in 2006 the number of employees within this sector further declined to 55, As the number of building permits slightly increased in 2009 and 2010, the number of employees in the mining, logging, and construction industry also increased (see Figure 7). However, between 2011 and 2016, employees in this sector were at its lowest on the island corresponding to the slowdown on building permits and other indicators. According to U.S. Census Bureau and U.S. Department of Housing and Urban Development (HUD), a total of includes the months of July 2018 through December Bureau of Labor Statistics, , seasonally adjusted Source: U.S. Census Bureau, New Residential Construction, and Bureau of Labor Statistics 10
11 158,806 of new residential housing units 21 were built in Puerto Rico between 2000 and Similar to trends in building permits, a large proportion of these new residential housing structures are single family units, followed by five or more housing units, three to four housing units, and two housing units. Between 2000 and 2002, new residential housing units in Puerto Rico steadily declined from 18,489 to 19,780. Overall, the trends of building permit authorizations, employment in the mining, logging, and construction industry, cement sales, GDB index, and the construction of new residential properties is clearly linked to the island s economic stagnation. During the period of economic stagnation, the data indicates that housing supply in Puerto Rico has by far exceeded the demand for housing. The collapse for the demand for housing has not only depressed housing values but also stands as an impediment to the island s economic recovery. Housing Tenure One of the key housing indicators for socioeconomic progress is the rate of home ownership. Generally, Puerto Rico has a higher home ownership rate relative to stateside markets. Yet, between 2005 and 2016, homeownership decreased by 11 percent while home renters increased by 13 percent (see Figure 8). Although in 2006 homeowners continue to exceed home renters, it was the beginning of a decline. Foreclosures Foreclosures, like high rates of vacant units, are an indicator and manifestation of the housing crisis. As shown in Figure 9, data from Puerto Rico Government for the period between 2008 and Two measures of mortgage distress are presented, the share of mortgages that were 90 or more days late in their payment and the share that started the foreclosure process. The number of residential properties in process of foreclosure in January 2008 was 10,722 and steadily increased to 15,051 in February As shown in Figure 9, between February 2010 and September 2012, the number of properties in process of foreclosure increased slightly, from 15,051 to 18,534. Between, February 2015 and August 2017 (a month before Hurricane Irma and Hurricane Maria), a slight decline was seen from 18,981 to 13,436. Figure 8. Puerto Rico s Housing Tenure, Source: U.S. Census Bureau, 2000 Decennial & American Community Survey According to the U.S. Census Bureau and U.S. Department of Housing and Urban Development, new residential construction consists of data on the five phases of a residential construction project: (1) housing units authorized to be built by a building or zoning permit; (2) housing units authorized to be built, but not yet started; (3) housing units started; (4) housing units under construction; and (5) housing units completed. It does not include group quarters (i.e., dormitories and rooming houses), transient accommodations, HUD-code manufactured homes (mobile) homes, moved or relocated buildings, and housing units created in an existing residential or nonresidential structure. These statistics only include privately-owned buildings. Publicly-owned housing units are excluded from the statistics. Units in structures built by private developers with partial public subsidies or which are for sale upon completion to local public housing authorities under the HUD "Turnkey" program are all classified as private housing. 11

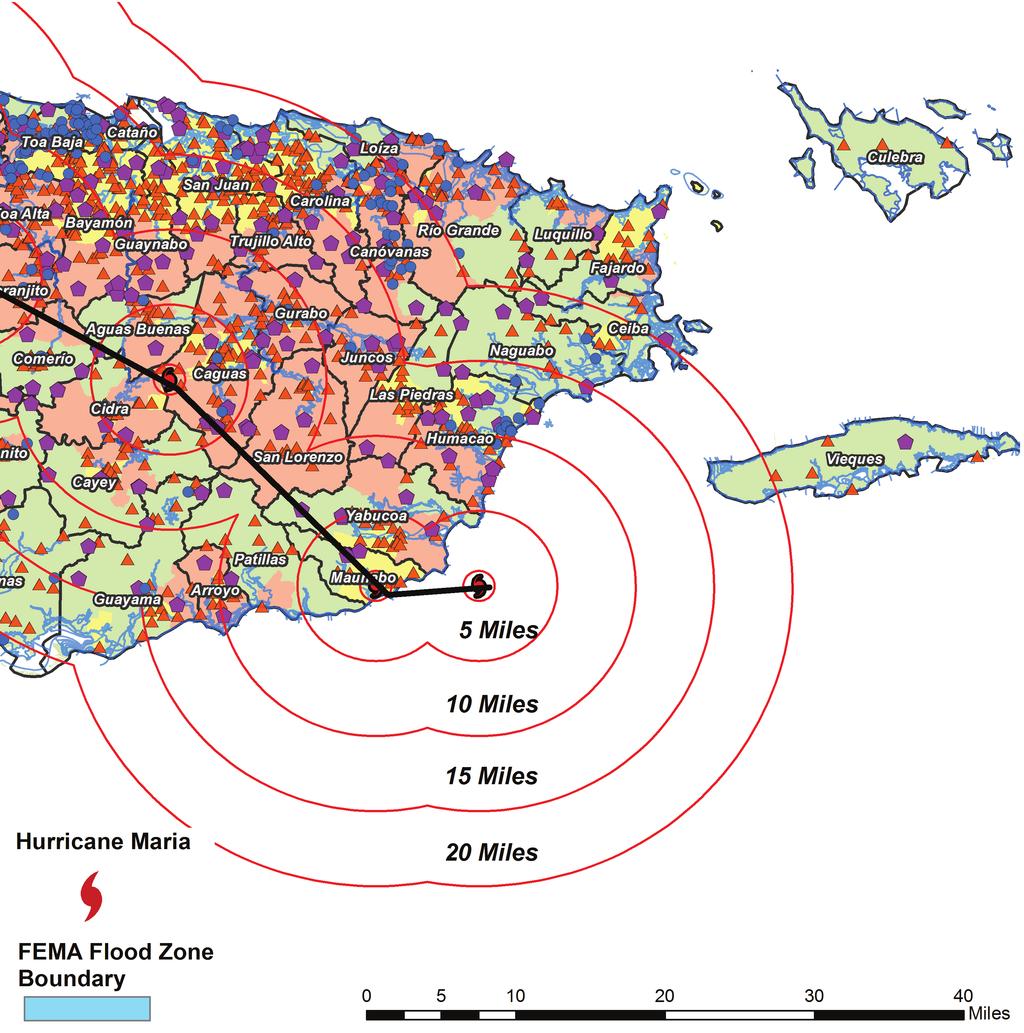
12 Figure 10. Hurricane Maria Impact Hurricane Maria struck Puerto Rico as a category 4 storm. Puerto Rico experienced widespread flooding (blue shades on map) with waist-deep water levels in some areas. Storm surge and flash flooding trapped thousands of residents. Despite evacuation of at risk areas to shelters, ongoing investigations suggest that over a thousand people may have died as a direct consequence of the storm. Strong winds destroyed homes and caused massive devastation and complete power grid destruction. FEMA designation of residences that are not repairable (Replacement Assistance Eligible), damaged by flooding or that suffered roof damage illustrate in the map the extent and concentration of the damage caused by the storm. 12
13 13
14 Figure 9. Puerto Rico Residential Mortgage Loan Portfolio, 90+ days in Delinquent & In Process of Foreclosure, Source: Oficina de Comisionado de Instituciones Financieras (OCIF) From September 2017 through January 2018, post-hurricane Maria, the number of residential properties in the process of foreclosure decreased slightly from 13,436 to 12,962. Although the number of residential properties in process of foreclosure was lower during post-hurricane Maria, it may be due to the island s paralyzed economic state right after Hurricane Maria made landfall. These numbers are likely to increase after January Thus, the share of mortgages that were 90 or more days late in their payment may give a sense of what s to come. For example, post-hurricane Maria residential properties that were 90 or more days late in their mortgage payment was at its highest after September 2017, with 11,411, followed by 17,442 in October 2017; 52,451 in November 2017; 22,407 in December 2017; and lastly 13,558 in January of FEMA Individual Assistance (IA) 22 As of May 18, 2018, a total of 452,386 Individual Assistance (IA) applications 23 have been approved to help survivors with housing and disaster related expenses, totaling an approved amount of $1.23 billion dollars. At least 56 percent ($687 million) of that was approved for total housing assistance (HA) and the remaining 45 percent ($ million) was approved for total other needs assistance (ONA). 24 Of the total of 772,682 valid homeowners registrations 25 only 40 percent (310,182) were approved for FEMA assistance. The top 10 counties, homeowners and approved for FEMA assistance included: San Juan (6% of the total IA for homeowners), Bayamón (5%), Ponce (4%), Carolina (4%), Caguas (3%), Toa Baja (3%), Arecibo (3%), Humacao (2%), Guyanabo (2%), Toa Alta (2%), and Vega Baja (2%). On the other hand, a total of 339,380 valid registrations were home renters and 42 percent were approved for FEMA assistance. Among the top 10 counties with the largest approved FEMA assistance included: San Juan (18%), Bayamón (7%), Carolina (5%), Ponce (5%), Caguas (4%), Toa Baja (2%), Mayagüez (2%), Guaynabo (2%), Arecibo (2%), and Trujillo Alto (2%). On September 20, 2017, Hurricane Maria struck Puerto Rico as a Category 4 storm, with sustained winds blowing at 145 mph and peaking at 155 mph as it made landfall. Puerto Rico experienced widespread flooding with waistdeep water levels in some areas. As illustrated in Figure 10, FEMA designation of residences that are not repairable (Replacement Assistance Eligible; see purple shades on map), damaged by flooding (blue shades) or that suffered roof/ foundation damage (orange shades) illustrate in the map the extent and concentration of the damage caused by the storm. The vast majority of damaged homes destroyed by 22 Source: FEMA.gov and data retrieved on May 23, "FEMA and the Federal Government cannot vouch for the data or analyses derived from these data after the data have been retrieved from the agency's website(s) and/or Data.gov." 23 Individual Assistance (IA) is provided by the Federal Emergency Management Agency (FEMA) to individuals and families who have sustained losses due to disasters. Homeowners, renters and business owners in designated counties who sustained damage to their homes, vehicles, personal property, businesses or inventory as a result of a federally declared disaster may apply for disaster assistance. Disaster assistance may include grants to help pay for temporary housing, emergency home repairs, uninsured and underinsured personal property losses, and medical, dental and funeral expenses caused by the disaster, along with other serious disaster-related expenses. 24 According to FEMA, this can include, personal property, transportation, medical, dental, funeral, essential tools, moving/storage, miscellaneous, and other needs. 25 Count of FEMA registration owners within the state, county, zip where the registration is valid. In order to be a valid registration the applicant must be in an Individual Assistance declared state and county and have registered within the FEMA-designated registration period. 14
15 Hurricane Maria were mostly located along the hurricane s trajectory (especially within the 1- to 10-mile buffer radius), counties located in the San Juan metropolitan area, eastern coast (point of entry), and northwestern coast (point of exit). As shown in Figure 10, homes located on the left side of Hurricane Maria s path were mostly in counties within the central and southwestern regions of the island. In these rural areas, homes were damaged due to wind and/or flood. Thus, homes with roof/foundation (orange shade) and flood (orange shade) damages were more visible relative to the right side of Hurricane Maria s path. Housing Damages Table 3. FEMA Home Damages among Homeowners damage between $20,001 and $30,000, and (4) damage greater than $30,001 (see Table 2). Most of the damage to housing was under $10,000. Across the island, at least 92 percent of FEMA inspected damages was between $1 to $10,000, followed by 6 percent between $10,001 and $20,000, and 1 percent between $20,001 and $30,000. Lastly, only 1 percent of FEMA damaged inspected homes had damages greater than $30,001. As illustrated in Figure 10 damaged homes in counties other than the top 10 were located along the path of Hurricane Maria and in close proximity to flood zone areas. Among home renters, FEMA reported a total of 22,407 homes damaged by Hurricane Maria (see Table 2). About 42 percent of the damaged homes were also located within the San Juan metropolitan area and coastal counties with high Total housing Units Total Damage Homes (Owners) % FEMA Inspected Damage between $1 to $10,000 FEMA Inspected Damage between $10,001 to $20,000 FEMA Inspected Damage between $20,001 to $30,000 FEMA Inspected Damage > $30,001 Puerto Rico 1,571, , % 308,169 19,156 3,428 4,332 Top , ,329 33% 41,854 2, San Juan 192,766 18,476 6% Bayamón 83,785 14,405 4% 4, Caguas 58,356 12,173 4% 5, Carolina 77,771 11,897 4% 3, Ponce 66,906 11,771 4% 1, Toa Baja 34,592 10,419 3% 2, Humacao 26,899 8,967 3% 5, Arecibo 41,400 8,895 3% 11, Guaynabo 40,303 6,712 2% 4, Canóvanas 18,012 6,614 2% 1, Other Counties 930, ,756 67% 266,315 16,846 2,960 3,666 Source: FEMA.gov, data as of 5/11/2018 As of May 11, 2018, FEMA reported a total of 357,492 damaged homes caused by Hurricane Maria; 94 percent of these damaged homes were homeowners and the 6 percent were home renters. Overall about 23 percent of the island s housing stock was affected by Hurricane Maria. As shown in Table 3, about a third (33%) of the damaged homes were located in the San Juan metropolitan area and other coastal counties: San Juan (6%), Bayamón (4%), Caguas(4%), Carolina (4%), Ponce (4%), Toa Baja (3%), Humacao (3%), Arecibo (3%), Guaynabo (2%), and Canóvanas (2%). This report interprets the type of damage based on FEMA inspected damage categories: (1) damage between $1 and $10,000, (2) damage between $10,001 to $20,000, (3) housing density: San Juan (12%), Toa Baja (5%), Caguas (4%), Bayamón (4%), Carolina (4%), Ponce (3%), Arecibo (3%), Canóvanas (2%), Humacao (2%), and Guaynabo (2%). According to FEMA, home damages among renters ranged between moderate (73%) to major damages (26%); however, no substantial damages were reported. As illustrated in Figure 10, the remaining 58 percent of damaged homes among the home renters were also located along Hurricane Maria s path and in close proximity to flood zone areas. Yet, a total of the 4,332 housing units were in the $30,001 or above category and only 666 or 15 percent located in the top 10 counties. 15
16 Table 4. FEMA Home Damages among Home Renters Total housing Units Total Damage Homes (Renters) % Total with Moderate Damage Total with Major Damage Total with Substantial Damage Puerto Rico 1,571,744 22, % 16,444 5,820 0 Top ,790 9,396 42% 1, San Juan 192,766 2,625 12% Toa Baja 34,592 1,227 5% Caguas 58, % Bayamón 83, % Carolina 77, % Ponce 66, % Arecibo 41, % Canóvanas 18, % Humacao 26, % Guaynabo 40, % Other Counties 930,954 13,011 58% 15,077 5,311 0 Source: FEMA.gov, data as of 5/11/2018 What Can Be Done All indicators of the solidity or lack thereof of the housing market presented in this report point to the unavoidable conclusion that conditions in the Puerto Rican housing market have been deteriorating steadily since the unset of the fiscal and economic crisis in the mid 2000s and that Hurricane Maria aggravated the situation. In an interview with Lizzie O'Leary, host of Marketplace Weekend 26, Ricardo Rosselló, the governor of Puerto Rico, asserted, One of the opportunities I think we have is to start to eradicating that informal housing component, [to] start pushing folks into safe, formal [home] ownership. He added: We have had a significant decrease in population, and that has led itself to a lot of houses to be available or owned by the bank. There s an opportunity to leverage, in the short run. The second component is implementing what we want to have: the most robust construction codes in the nation. Make sure we are ready for another [C]ategory 5 hurricane. Indeed, the devastation caused by Hurricane Maria, its impact on the housing stock in Puerto Rico, and the expected flow of federal assistance to reconstruct the island offer a unique opportunity to transfer vacant housing units to social purpose utilization. A massive purchase of vacant housing units for social purposes would be a first step toward closing the gap between availability and the demand for units and lead to more stable housing prices while removing units that might not be built up to code. Yet, there are two significant barriers that would need to be overcome. The first would be financing of a program aimed at the purchase of vacant properties for conversion to social purposes. The second would be a social one, that even in the case that financing is available, home owners or renters may not want to relocate and would prefer to stay where the property is located and rehabilitate the damaged property. Each one of these hurdles require specific strategies. Financing Financing is the first hurdle for a housing program aimed at transferring vacant housing largely owned by individual owners to social purpose use. This is because FEMA s estimated damage cost might not be sufficient to cover the purchase cost of the available housing stock. As indicated in Table 3, 4,332 owners received grants for properties with damages estimated by FEMA to exceed $30,000. Two factors affect the cost of vacant units. The first would be the location of the property in terms of both the municipality, and within the municipality whether the property is located in an urban, suburban or rural area. The second is related to the housing market conditions in that area. As Table 2 indicates, the drop in median home values vary significantly by municipality and location. The overall drop in the price of housing units post-hurricane Maria is estimated to be around $8,000, from the median home value of about $112, Retrieved from:
17 Based on a hypothetical case using market averages, where the purchase cost would be $104,000 and the average FEMA grant would be $30,000 the minimum for destroyed properties, the financing gap would be about $74,000 per unit not including closing costs. Assuming that FEMA authorizes the use of the grant for purchasing a replacement property rather than the rehabilitation of properties that suffered total damages, the financing gap or total cost for purchasing a new home for all the owners of destroyed property would be about $321 million. In the context of the federal allocations through CDBG DR to Puerto Rico, which are to date about $18 billion, this estimate is a relatively small and manageable total. Yet, Governor Rosselló s stated second goal to start to eradicating [... ] informal housing calls for a more expansive and expensive program converting vacant properties to social purposes beyond those damaged by the storm. For illustration purposes, let us use the group of home renters whose housing suffered major damages. From Table 4, there are 5,820 home renters in this group. Let s assume that this group does not qualify for FEMA grants for rehabilitation of the units. Thus, a 100% of the replacement housing cost would have to be generated by the program. Using the cost of replacement housing from the prior example of $104,000, the total cost for a program covering the most affected renters would be $605 million. As in the prior case, this estimate is a relatively small and manageable total that may not require more than the inclusion of a program for the conversion of vacant property to social purpose uses in the CDBG DR plan for the island. For this group of most-affected renters and owners the price tag would be about one billion, yet there are hundred of thousands of Puerto Ricans living in informal housing that was not built up to standards. The expansion of a conversion of vacant units to social purpose housing in a larger scale aimed at eradicating [the] informal housing to improve storm resiliency would require other types of financing to close the gap for the purchasing of vacant property. Rebuilding to code where the informal housing is located is always an option but not always feasible in terms of storm resistant housing. A new housing construction program is also a theoretical possibility. But given that 18 percent of the housing stock in Puerto Rico, or 332,365 units, it would be better for the recovery of the housing market the diminishing of the available stock of vacant units, especially if this strategy would reduce the stock of informal housing. In addition, past federal aid to Puerto Rico for the construction of new housing for Hurricane Georges (1998) recovery was limited and plagued by mismanagement, this is a less likely policy option after Hurricanes Irma and Maria. Given the housing market context, the expansion of the Low-Income Housing Tax Credit (LIHTC) managed and overseeing by the IRS (U.S. Treasury) and administered by states housing agencies might be a policy option to be considered. LIHTC is the most important program for creating affordable housing through the extension of tax credits to the private sector for the acquisition, rehabilitation, or new construction of rental housing targeted to lower-income households. Puerto Rico qualifies for the LIHTC federal program and already receives an allocation based on population, among other considerations. As suggested before, the policy mechanism to allocate funding to expand funding for such a program would be through the CDBG-DR plan for the island and would require advocacy from municipalities, government experts working in FEMA and the Department of Housing of Puerto Rico, academic and independent policy analysts, and community leaders to include this component in the plan. In a succinct overview, LIHTC works primarily through the syndication (packaging) of the tax credits from one or various investors that make capital contributions to specific affordable housing projects. Developers sell the property to investors to raise equity for construction of their projects, thus reducing the debt services and allowing projects to provide affordable rents to low-income families. In return for capital contribution the investors receive a prorated tax credit that lowers their federal tax liability. Investors in these syndicated partnerships or limited liability company that own the project are typically banks and other financial institutions or individual investors. Investors purchase credits at a price that depends on market conditions for these credits, which can go be as low as.85 or.90 of the present value per dollar of the credit to as high as 1.00 or even higher depending on market demand for the credits. In part, the value of the tax credit to investors is also given by the Community Reinvestment Act (CRA), which motivates bank to use housing credit investments as a CRA-qualified investment vehicle for banks. 27 Developers are key intermediaries between capital investors and communities in need of affordable housing. The typical developer is a community development corporation (CDC), a non-profit entity, though private developers may 27 Affordable Housing Finance Magazine, Study Credits CRA for Motivating LIHTC Investment. Retrieved June 6, 2018, from: study-credits-cra-for-motivating-lihtc-investment_o]. 17
18 and do participate significantly in the program. In addition to housing development, CDCs engage in comprehensive neighborhood social and economic development. Depending on the eligibility criteria for the population being served by the project, the tax credits can cover approximately 30 to 70 percent of the total development costs of the project corresponding to the project's units that are rented to low-income tenants and the income threshold guidelines for residents in the projects. The developers insure that the project meets IRS requirements for qualification, manage the construction and could manage the properties once completed on behalf of the investors, insure compliance with rent, income and other restrictions, and receive developer fees. In the case of the proposed program, developers would have to adapt the typical project-based development, where the units or buildings are adjacent to each other, to a scattered site development. The agglomeration of units in a relative small area may serve to persuade residents (as we will discuss below) to relocate from at-risk areas. This concept of relocating affected residents to concentrated areas in particular neighborhoods will have a positive spillover effect on local businesses and inducing area economic development. LIHTC projects typically involve a combination of sources. In addition to other local and federal programs that can be bundled for project financial feasibility, the IRS announced early this year the designation of the First Round of Opportunity Zones for 18 states and Puerto Rico. This designation will allow equity investments in businesses, real estate, and business assets that are located in a Qualified Opportunity Zone. 28 In combination with LIHTC, private developers may receive tax incentives as part of this program in similar fashion to the New Market Tax Credits (NMTC). Island developers may create investment partnerships and other ownership mechanisms to attract multinational corporations, stateside banks and other investors to invest in housing and other development opportunities. In sum, private and non-profit developers are crucial in LIHTC project development from its beginning to the expiration of the tax credits restriction period (30 years) by: designing the projects (securing land and site control, partnering with local community organizations and residents), facilitating the transaction and selling the syndication to investors, managing the property, insuring ongoing maintenance and overseeing capital improvements to maintain and expand property value, and transferring ownership once the tax credits expire. The larger-scale expansion of a program for the conversion of vacant units to social purpose housing would not be possible without the financing mechanisms provided by the LIHTC, Qualified Opportunity Zone investments and other similar financial mechanisms that would attract private sector investments. CBDG-DR funding is a crucial resource to serve as gap financing for these projects. As an illustration, the purchase of 10,000 units from the stock of 332,365 vacant units at a market price of $104,000 per unit would require a $1.04 billion investment. If the LIHTC or a similar financing mechanism could be used to attract this level of investment, if tax credits price is.85 per dollar in capital investment, the total out-front cost for the program would slightly more than $150 million by no means a small amount but not an insurmountable barrier for the implementation of the program. Currently, the annual allocation of LIHTC is $2.70 multiplied by the state or territory population. Obviously, although a portion of these credits could be earmarked for a program aimed toward hurricane victims, even if they were completely devoted to this purpose, Puerto Rico s current allocation of credits of about $9 million would be insufficient to have a discernable effect on the situation and the program benefiting hurricane victims would be directly competing with ongoing projects. Based on annual allocations to the LIHTC program would take well over a decade to implement the program. The increase in the territory allocation of tax credits for the LIHTC would require congressional action to lift the cap. There is a precedence for extra disaster credits under the Housing Credit program, which were provided as part of the Go Zone bill after Hurricane Katrina. However, no disaster credits were provided to respond to Hurricane Sandy. There are a couple of bills that have been introduced in this Congress that include disaster credits. First, H.R. 3679, the National Disaster Tax Relief Act of 2017 (Rep Tom Reed, R-NY-23), introduced into House Ways and Means, includes a measure to increase the State housing credit ceiling for states damaged by disaster. Second, H.R. 4172, the Give A HAND Act (Rep Richard Neal, D-MA-1), also introduced into House Ways and Means, includes a measure using the same exact language as HR 3679 to raise the state housing credit ceiling. Neither bill has left committee. Alternatively, Puerto Rico could create, in conjunction with the CDBG-RC plan, a Puerto Rico LIHTC such as the one created in other states for similar goals of expanding the affordable housing stock in the state. According to the Affordable Housing Resource Center, there are fifteen state 28 LISC, Opportunity Zones: A new program to connect private investment to low-income communities nationwide. Retrieved June 6, 2018, from: sites/default/files/resources/pdfs/opportunity_zone_fact_sheet.pdf. 18
19 programs with their own LIHTC program intended to provide gap or full financing of affordable housing projects. State LIHTC programs vary broadly, ranging from less than a million in credits to over $20 million annual allocations, types of credits could be 4 percent and/or 9 percent, and credit periods range from a year to up to ten years. Puerto Rico would have a wide range of options to develop a program that fits local circumstances. A criollo LIHTC is no substitute for federal tax credits, yet Puerto Rico has a three-year window to create programs that could receive CRA credits that might attract stateside investors. Earlier this year, banking regulators announced that community development activities in the U.S. Virgin Islands (USVI) and Puerto Rico will be eligible to receive credit under the Community Reinvestment Act (CRA) for activities that help revitalize or stabilize the U.S. Virgin Islands and Puerto Rico. 29 The expansion of financial institution s assessment area would serve as an incentive for capital to flow to areas affected by the storms with the potential for an extension for long-term recovery efforts. One of the advantages of implementing an expansion of the LIHTC or a program modeled after the LIHTC is that there are many capable affordable housing CDC developers and syndicators in Puerto Rico. There are also many stateside CDCs and syndicators eager to partner with local developers to implement such a social purpose program in Puerto Rico. And given the governor s stated view on the subject, all necessary elements seem to be aligned. Yet, a program of the proposed magnitude could not be implemented without the enthusiastic support of those more directly affected by the program and a broader public understanding of and support to the program. Community Planning One of the most important elements to keep in mind when discussing the impact of the recent storms on housing is that building up to code is highly correlated to the question of poverty and access to resilient structures. Since Puerto Rico has a poverty rate of near half the population, inadequate housing is largely a result of poverty. But how much informal housing there is in Puerto Rico is an open question. A recent report summarizes the situation as follows: A 2007 study by environmental consultant Interviron Services Inc, commissioned by the Puerto Rico Builders Association, found that 55 percent of residential and commercial construction was informal. That would work out to nearly 700,000 homes. That figure might be high, said David Carrasquillo, president of the Puerto Rico Planning Society, a trade group representing community planners. But even a very conservative estimate would yield at least 260,000 illegally built houses, he said. 30 Community planning and residents participation are critical elements in the implementation of any program aimed at mitigating the impact of Hurricanes Irma and Maria on the homes of the most vulnerable segments of the population and the decade-long housing crisis in Puerto Rico. In this context, community planning takes two forms: engagement with displaced and low-income residents as well as engagement with communities as a whole. The reasons why someone or a family may not want to relocate from their home location prior to the storm are multiple--these may include proximity to schools or family and friends, access to transportation and employment, access to health care or health services providers, opportunity to recover investments in property, and many others. Though many of these reasons are not possible to overcome and thus difficult decisions for residents affected by the storms, there might be situations where households could improve their social situation by moving to other units in different locations. This is the case, for example, where the dwellings are located in flood-prone areas or where the existing structures cannot be built to code (e.g., second floors where the foundations are inadequate for structural reinforcements) and will require complete demolition and replacement. The point is that individual circumstances matter and they may matter more to the most vulnerable households, for instance, if the neighborhood network is critical to support health and other social services needs. No matter how powerful a rationality for relocating neighborhood residents might be local planners, social workers and public outreach workers will not go too far in promoting an alternative housing plan in the absence of a participatory process where residents feel empowered to make critical decisions that affect their lives. 29 The CRA, which is jointly regulated by the Federal Reserve, the Federal Deposit Insurance Corporation (FDIC) and the Office of the Comptroller of the Currency (OCC), requires that financial institutions lend to low-income communities within their assessment area the geographic area surrounding an institution s brick-andmortar depository locations. In addition to getting credit for mortgage and small business lending, banks can receive positive CRA credit for investing in the Low-Income Housing Tax Credit (Housing Credit), the New Markets Tax Credit (NMTC) and the historic rehabilitation tax credit. Olivia Barrow, Banking Regulators Announce CRA-consideration for Investments in Puerto Rico and Virgin Islands, January 26, Retrieved from: 30 Nick Brown, In Puerto Rico, a housing crisis U.S. storm aid won't solve. Reuters, February 6, Retrieved from: 19
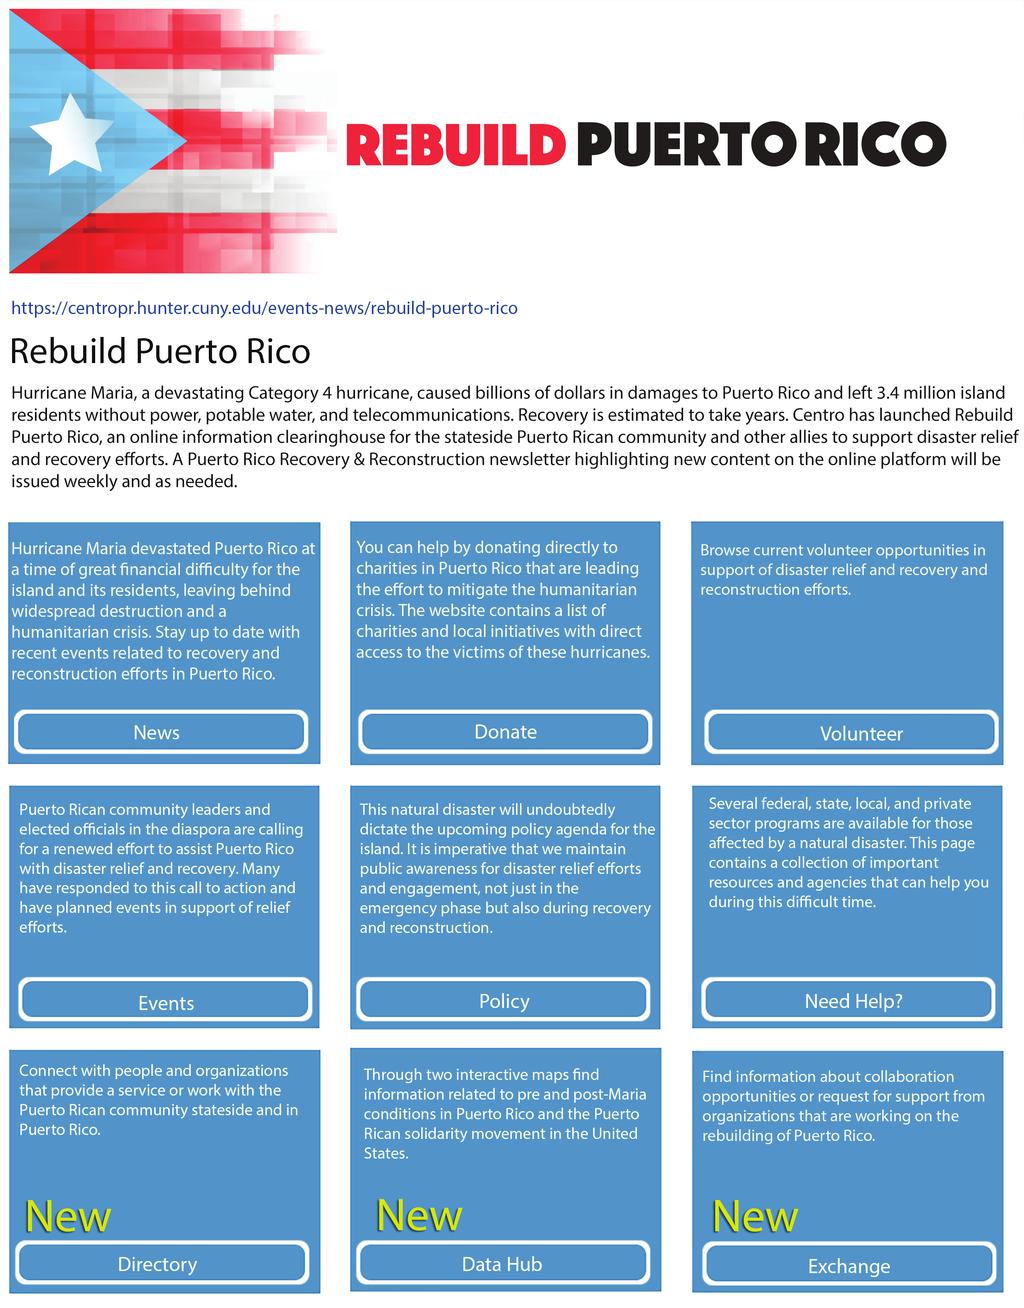
20 In addition to individual circumstances affecting the relocation choices open to individuals, families and households affected by the storms there are circumstances that affect communities as a whole. Examples abound. For instance, houses could have been built in areas prone to flooding. The construction of resilient homes could involve raising the structures to the levels recommended by FEMA and other local areas, as it was the case in New Orleans after Hurricane Katrina or in coastal areas in New Jersey, New York, and Connecticut after Super Storm Sandy. In Puerto Rico, some of the communities affected by flooding are informal housing villages where housing was not built up to code. In these cases, relocation is warranted and probably inevitable, yet the social cohesion of the community calls for a collective solution. Reaching a consensus on the perceived problem and solution would be a process likely to take some time and where all stakeholders, including local government and municipal agencies, would have to participate to find, not just economically feasible, but also politically feasible solutions. When communities confront housing problems that transcend individual households and families, a community planning process is required. Access to affordable and resilient housing, in this context, is an important factor but just one of the factors to be considered. Of foremost importance is the fact that it is often the case that residents prefer to remain in communities where they have families and friends nearby. Often, when there is social cohesion in the community, residents would prefer to build to code where they are located rather than to relocate. With many urban areas having concentrated vacancies accounting for up to a fifth or even higher proportion of the housing stock in a housing development (called urbanizacion in Puerto Rico), one of the options available to communities is clustering where displaced families from a community move to a cluster of vacant units in a targeted neighborhood. Clustering may involve extending all the same types of support services provided in a CDC-led housing development. Yet, even in communities where most residents prefer to rebuild where they are located, relocation may fit the preferences for some of the residents for work or family-related reasons and these residents in need of affordable housing may be interested in participating in a relocation process. The most important consideration is that it is the residents decision to relocate, a decision that needs to be informed but, more than anything, it needs to be a voluntary relocation. Epilogue: A Community Planning Tool to Rebuild Puerto Rico The Center for Puerto Rican Studies has created an online planning tool available to community leaders, planners, architects, state and municipal workers, social workers, and other professionals engaged with communities. Rebuild Puerto Rico was created as an online information clearinghouse for the stateside Puerto Rican community and other allies to support disaster relief and recovery efforts. More recently, we added a Data Hub where users can find an interactive Puerto Rico map with all the information on housing vacancies and other data used for this report. Users can, for example, replicate the centerfold map included in this report and zoom in a municipality or census track to ascertain flood areas or the number of non-repairable units in an area. This visualization tool was created to support community visioning exercises, among other community engagement strategies. Community visioning is the process of developing consensus about what future the community wants, and then deciding what is necessary to achieve it. A vision statement captures what community members most value about their community, and the shared image of what they want their community to become. The goal of visioning is to develop written and visualized statements of a community's long-term goals and strategic objectives [... ] Visioning is typically done at the beginning step of any planning process at all levels. 31 Solving the decade-long housing crisis and mitigating the impact of Hurricanes Irma and Maria requires the active participation of multiple stakeholders, especially the most directly affected communities themselves. This report is intended to provide some baseline data to support engagement of communities and other stakeholders in the solution of such a pressing issue for the welfare of the population and the economic recovery of the island. The online tool described here will be improved over time to support a search of consensus and a shared vision to rebuild Puerto Rico Taken from: Visioning
21 Appendix A. Non-Recreational Vacant Homes by County, 2016 Total Housing Units Non- Recreational Vacant Housing Units % Non- Recreational Vacant Housing Units Total Housing Units Non- Recreational Vacant Housing Units % Non- Recreational Vacant Housing Units Puerto Rico 1,571, ,798 16% San Juan Municipio 192,766 39,009 15% Bayamón Municipio 83,785 10,640 4% Ponce Municipio 66,906 10,532 4% Mayagüez Municipio 41,274 10,099 4% Carolina Municipio 77,771 9,902 4% Arecibo Municipio 41,400 7,758 3% Caguas Municipio 58,356 7,475 3% Yauco Municipio 17,252 6,361 2% Toa Baja Municipio 34,592 5,321 2% Aguadilla Municipio 27,365 5,266 2% Vega Baja Municipio 24,739 5,241 2% Guaynabo Municipio 40,303 4,916 2% Humacao Municipio 26,899 4,688 2% Trujillo Alto Municipio 29,505 4,223 2% Isabela Municipio 20,417 4,069 2% Cabo Rojo Municipio 29,625 3,813 1% Río Grande Municipio 23,191 3,544 1% Guánica Municipio 9,346 3,439 1% Sabana Grande Municipio 10,806 3,276 1% San Sebastián Municipio 17,695 3,137 1% Guayama Municipio 18,819 3,034 1% Fajardo Municipio 18,627 2,997 1% San Germán Municipio 15,652 2,975 1% Toa Alta Municipio 25,726 2,905 1% Cayey Municipio 20,106 2,904 1% Canóvanas Municipio 18,012 2,764 1% Aguada Municipio 17,508 2,756 1% Utuado Municipio 13,368 2,714 1% Juncos Municipio 15,723 2,637 1% Las Piedras Municipio 15,634 2,604 1% Dorado Municipio 15,803 2,397 1% Manatí Municipio 18,799 2,381 1% Juana Díaz Municipio 18,930 2,371 1% Vega Alta Municipio 16,128 2,367 1% San Lorenzo Municipio 16,434 2,343 1% Yabucoa Municipio 14,771 2,320 1% Rincón Municipio 9,462 2,302 1% Salinas Municipio 13,873 2,252 1% Lajas Municipio 12,107 2,193 1% Cidra Municipio 16,213 2,134 1% Añasco Municipio 12,448 2,109 1% Hatillo Municipio 16,855 2,108 1% Moca Municipio 15,632 2,092 1% Coamo Municipio 16,380 2,064 1% Patillas Municipio 8,943 2,062 1% Ceiba Municipio 7,456 2,033 1% Naguabo Municipio 11,555 1,962 1% Gurabo Municipio 17,568 1,951 1% Camuy Municipio 14,051 1,940 1% Aguas Buenas Municipio 10,790 1,933 1% Arroyo Municipio 8,556 1,738 1% Naranjito Municipio 10,605 1,699 1% Corozal Municipio 13,063 1,650 1% Lares Municipio 12,263 1,635 1% Loíza Municipio 11,588 1,629 1% Cataño Municipio 10,849 1,588 1% Guayanilla Municipio 8,364 1,510 1% Luquillo Municipio 10,529 1,468 1% Morovis Municipio 11,661 1,358 1% Barceloneta Municipio 9,892 1,324 1% Jayuya Municipio 6,231 1,278 0% Barranquitas Municipio 11,034 1,276 0% Peñuelas Municipio 8,828 1,246 0% Ciales Municipio 7,322 1,214 0% Aibonito Municipio 9,961 1,198 0% Santa Isabel Municipio 9,380 1,169 0% Quebradillas Municipio 10,348 1,115 0% Orocovis Municipio 8,514 1,111 0% Vieques Municipio 5,036 1,084 0% Comerío Municipio 7,625 1,077 0% Hormigueros Municipio 7,555 1,057 0% Villalba Municipio 9,144 1,051 0% Maunabo Municipio 5, % Adjuntas Municipio 7, % Las Marías Municipio 3, % Maricao Municipio 2, % Florida Municipio 4, % Culebra Municipio 1, % Source: Source: 2016 U.S. Census Bureau, American Community Survey (5 Year Estimates) 21
22 Appendix B. Median Home Values, Pre- and post-hurricane Maria Geography Median Home Value (2009-ACS- 5YR) Median Home Value (2016-ACS- 5YR) Difference Median Home Value (2016-ACS- 5YR)* Realtor.com Zillow.com Comparable Data (from Abreau) Puerto Rico $133,647 $111,900 -$21,747 $117,869 $100,500 $100,000 $110,000 Adjuntas Municipio $93,769 $90,900 -$2,869 $95,749 $105,000 Aguada Municipio $97,475 $89,900 -$7,575 $94,696 $125,500 Aguadilla Municipio $112,299 $124,100 $11,801 $130,720 $135,000 Aguas Buenas Municipio $92,983 $109,100 $16,117 $114,920 $122,500 Aibonito Municipio $99,721 $119,900 $20,179 $126,296 $130,000 Añasco Municipio $102,192 $100,400 -$1,792 $105,756 $120,000 Arecibo Municipio $103,764 $98,200 -$5,564 $103,438 $76,950 $75,000 $88,750 Arroyo Municipio $93,433 $92,300 -$1,133 $97,224 $78,000 Barceloneta Municipio $115,555 $108,200 -$7,355 $113,972 $110,000 Barranquitas Municipio $90,737 $102,500 $11,763 $107,968 $110,000 Bayamón Municipio $153,400 $141,100 -$12,300 $148,627 $90,000 $90,000 $120,000 Cabo Rojo Municipio $112,074 $112,800 $726 $118,817 $150,450 $135,000 $131,000 Caguas Municipio $139,587 $137,300 -$2,287 $144,624 $115,000 $110,000 $131,250 Camuy Municipio $93,433 $105,300 $11,867 $110,917 $101,500 Canóvanas Municipio $124,652 $116,600 -$8,052 $122,820 $165,000 Carolina Municipio $164,518 $150,300 -$14,218 $158,318 $91,000 $106,000 $130,000 Cataño Municipio $128,807 $127,100 -$1,707 $133,880 $64,900 $150,000 Cayey Municipio $109,941 $120,800 $10,859 $127,244 $120,000 Ceiba Municipio $108,368 $96,200 -$12,168 $101,332 $93,000 Ciales Municipio $102,866 $103,700 $834 $109,232 $85,000 Cidra Municipio $119,486 $120,000 $514 $126,401 $135,000 Coamo Municipio $85,010 $90,500 $5,490 $95,328 $105,220 Comerío Municipio $86,919 $89,000 $2,081 $93,748 $90,000 Corozal Municipio $93,433 $93,500 $67 $98,488 $99,950 Culebra Municipio $131,277 $104,800 -$26,477 $110,390 $180,000 Dorado Municipio $144,304 $148,600 $4,296 $156,527 $166,999 $215,000 Fajardo Municipio $110,839 $105,300 -$5,539 $110,917 $70,649 $98,000 Florida Municipio $112,299 $94,300 -$17,999 $99,330 $88,000 Guánica Municipio $80,631 $90,000 $9,369 $94,801 $85,000 Guayama Municipio $93,994 $95,200 $1,206 $100,278 $73,000 $102,000 Guayanilla Municipio $77,823 $82,600 $4,777 $87,006 $257,500 $92,000 Guaynabo Municipio $226,844 $199,100 -$27,744 $209,721 $257,500 $220,000 $199,000 Gurabo Municipio $145,876 $156,700 $10,824 $165,059 $159,000 - Hatillo Municipio $102,866 $112,800 $9,934 $118,817 $99,750 Hormigueros Municipio $99,048 $109,200 $10,152 $115,025 $82,000 $105,000 Humacao Municipio $117,577 $98,300 -$19,277 $103,544 $125,000 Isabela Municipio $106,010 $109,000 $2,990 $114,814 $128,500 Jayuya Municipio $95,117 $90,300 -$4,817 $95,117 $102,500 Juana Díaz Municipio $104,213 $99,000 -$5,213 $104,281 $125,000 Juncos Municipio $118,588 $116,100 -$2,488 $122,293 $80,000 $113,318 Lajas Municipio $94,780 $93,900 -$880 $98,909 $110,000 Lares Municipio $99,384 $87,500 -$11,884 $92,168 $95,000 Las Marías Municipio $92,759 $75,500 -$17,259 $79,527 $80,000 Las Piedras Municipio $126,336 $114,100 -$12,236 $120,187 $130,000 22
23 Geography Median Home Value (2009-ACS- 5YR) Median Home Value (2016-ACS- 5YR) Difference Median Home Value (2016-ACS- 5YR)* Realtor.com Zillow.com Comparable Data (from Abreau) Loíza Municipio $110,053 $105,500 -$4,553 $111,128 $110,000 Luquillo Municipio $120,272 $111,900 -$8,372 $117,869 $138,225 Manatí Municipio $116,791 $109,600 -$7,191 $115,446 $110,000 Maricao Municipio $83,326 $94,200 $10,874 $99,225 - Maunabo Municipio $93,657 $93,900 $243 $98,909 $80,500 Mayagüez Municipio $98,374 $101,400 $3,026 $106,809 $101,000 $115,000 Moca Municipio $101,181 $96,300 -$4,881 $101,437 $120,000 Morovis Municipio $106,122 $99,400 -$6,722 $104,702 $105,000 Naguabo Municipio $102,978 $94,600 -$8,378 $99,646 $65,000 $85,000 Naranjito Municipio $89,839 $100,700 $10,861 $106,072 $100,000 Orocovis Municipio $91,636 $98,400 $6,764 $103,649 $102,500 Patillas Municipio $87,032 $94,000 $6,968 $99,014 $19,229 $78,000 Peñuelas Municipio $80,181 $77,500 -$2,681 $81,634 $86,250 Ponce Municipio $106,684 $99,900 -$6,784 $105,229 $86,000 $85,500 $105,250 Quebradillas Municipio $104,101 $108,900 $4,799 $114,709 $99,500 Rincón Municipio $124,989 $127,500 $2,511 $134,301 $174,000 $156,434 Río Grande Municipio $125,887 $116,800 -$9,087 $123, $135,000 Sabana Grande Municipio $96,465 $98,100 $1,635 $103,333 $99,500 Salinas Municipio $92,646 $86,400 -$6,246 $91,009 $86,500 San Germán Municipio $92,422 $101,600 $9,178 $107,020 $135,000 San Juan Municipio $181,699 $161,100 -$20,599 $169,694 $157,500 $150,000 San Lorenzo Municipio $118,475 $116,900 -$1,575 $123,136 $100,000 $120,000 San Sebastián Municipio $100,957 $103,400 $2,443 $108,916 $100,000 Santa Isabel Municipio $105,224 $93,100 -$12,124 $98, $104,250 Toa Alta Municipio $145,090 $146,900 $1,810 $154,736 $83,500 $150,007 Toa Baja Municipio $132,176 $135,100 $2,924 $142,307 $90,000 $92,000 $120,000 Trujillo Alto Municipio $175,748 $155,700 -$20,048 $164,006 $103,700 $109,000 $133,000 Utuado Municipio $93,657 $93,000 -$657 $97,961 $147,500 $90,000 Vega Alta Municipio $116,454 $119,100 $2,646 $125,453 $124,000 $149,000 Vega Baja Municipio $116,678 $112,400 -$4,278 $118,396 $124,000 $100,000 $115,000 Vieques Municipio $123,416 $109,600 -$13,816 $115,446 $189,000 Villalba Municipio $93,882 $93,000 -$882 $97,961 $95,000 Yabucoa Municipio $95,903 $90,800 -$5,103 $95,644 $84,000 Yauco Municipio $93,769 $92,500 -$1,269 $97,434 $95,000 Source: 2009 & 2016 American Community Survey, Zillow.com, Realtor.com, and Luis Abreu & Associates 23
24
$ FACTS ABOUT PUERTO RICO: WAGE HOUSING MOST EXPENSIVE AREAS WAGE RANKING
 STATE #52 * RANKING In Puerto Rico, the Fair Market Rent () for a two-bedroom apartment is $480. In order this level of and utilities without paying more than 30% of income on housing a household must
$9.68 PER HOUR STATE HOUSING WAGE
 PUERTO RICO STATE #2 * RANKING In Puerto Rico, the Fair Market Rent () for a two-bedroom apartment is $04. In order to afford this level of and utilities without paying more than of income on housing a
Hazus: Estimated Damage and Economic Losses. Puerto Rico, United States
 HURRICANE MARIA Initial Hazus Run, 27 November 2017 ARA wind field Hazus: Estimated and Economic es, United States Initial Hazus Wind Estimates for Hurricane Maria using the ARA wind field. Note: Model
October 10, Michael Moriarty Mitigation Division Director FEMA Region II
 U. S. Department of Homeland Security Region II One World Trade Center, 52nd Floor New York, NY 10007 October 10, 2017 MEMORANDUM FOR: Alejandro De La Campa Federal Coordinating Officer FEMA-4339-DR &
How Maria Forges PR s Future
 H.Calero Consulting Group, Inc. How Maria Forges PR s Future Assessment and Forecast An economy in recession Real GNP growth, % High Moderate Negative 8.0% 0% -1.1% Source: PR Planning Board with investment
GDB Supplemental Information
 GDB Supplemental Information May 2017 Table of Contents I. Summary of Outstanding Loan and Deposit Balances II. Summary Detail of Municipal Cash Flow Projections and Loan Detail III. Summary of Gross Deposits
Children in Puerto Rico: Results from the 2000 Census. By Mark Mather
 Children in Puerto Rico: Results from the 2000 Census By Mark Mather The Annie E. Casey Foundation and the Population Reference Bureau August 2003 KIDS COUNT KIDS COUNT, a project of the Annie E. Casey
A Conceptual Framework for Measuring the Exposure to Tsunamis of Puerto Rican Coastal Communities
 Meulaboh, Aceh A Conceptual Framework for Measuring the Exposure to Tsunamis of Puerto Rican Coastal Communities Jean-Edouard Faucher Saylisse Dávila, PhD Department of Industrial Engineering University
Case 3:14-cv Document 1 Filed 02/19/14 Page 1 of 12 IN THE UNITED STATES DISTRICT COURT FOR THE DISTRICT OF PUERTO RICO
 Case 3:14-cv-01136 Document 1 Filed 02/19/14 Page 1 of 12 IN THE UNITED STATES DISTRICT COURT FOR THE DISTRICT OF PUERTO RICO MUNICIPALITY OF SAN SEBASTIAN Plaintiff CIVIL NO. 14-1136 CIVIL RIGHTS DECLARATORYJUDGMENT
Final Report Waste Characterization Study
 Final Report Waste Characterization Study Prepared For: Prepared By: October 24, 2003 1 INTRODUCTION AND BACKGROUND The Solid Waste Management Authority of Puerto Rico (SWMA) contracted with Wehran Puerto
Agenda RECOVERY UPDATES HURRICANE HARVEY HURRICANE IRMA HURRICANE MARIA USPS COMMUNICATION
 October 4, 2017 1 Agenda RECOVERY UPDATES HURRICANE HARVEY HURRICANE IRMA HURRICANE MARIA USPS COMMUNICATION 2 3 Harvey Recovery Texas All Plants operational, including BMEUs and drop shipments Customers
Puerto Rico and the U.S. Virgin Islands After Hurricanes Irma and Maria Jason Bram, Officer Research Economist
 Puerto Rico and the U.S. Virgin Islands After Hurricanes Irma and Maria Jason Bram, Officer Research Economist Economic Press Briefing: February 22, 2018 The views expressed here are those of the presenter
Puerto Rico in the Aftermath of Hurricanes Irma and Maria Jason Bram, Officer Research Economist
 Puerto Rico in the Aftermath of Hurricanes Irma and Maria Jason Bram, Officer Research Economist March 7, 2018 The views expressed here are those of the presenter and do not necessarily represent those
Dynamic Itinerary for Infrastructure Projects Public Policy Document
 Apartado 40285 San Juan, Puerto Rico 00940 Dynamic Itinerary for Infrastructure Projects May 2008 Report Prepared By: MP Engineers of Puerto Rico, P.S.C. Las Vistas Shopping Village 300 Ave Felisa Rincon
Population Composition, Geographic Distribution, and Natural Hazards: Vulnerability in the Coastal Regions of Puerto Rico
 Population Composition, Geographic Distribution, and Natural Hazards: Vulnerability in the Coastal Regions of Puerto Rico Researchers Havidán Rodríguez, Ph.D. (DRC-UDel) Walter Díaz, Ph. D. (CISA-UPRM)
Puerto Rico & the US Virgin Islands in the Aftermath of Hurricanes Irma and Maria Jason Bram, Officer Research Economist
 Puerto Rico & the US Virgin Islands in the Aftermath of Hurricanes Irma and Maria Jason Bram, Officer Research Economist Presentation to Community Advisory Group June 21, 2018 The views expressed here
Post-Hurricane Maria Exodus from Puerto Rico and School Enrollment in Florida
 Post-Hurricane Maria Exodus from Puerto Rico and School Enrollment in Florida Research Brief Issued December 2017 By: Edwin Meléndez, Jennifer Hinojosa, and Nashia Roman centro RB2017-02 Hurricane Maria
Evidence from the FRBNY Puerto Rico Small Business Survey REGIONAL PERSPECTIVES ON PUERTO RICO SMALL BUSINESS
 Evidence from the FRBNY Puerto Rico Small Business Survey REGIONAL PERSPECTIVES ON PUERTO RICO SMALL BUSINESS I Evidence from the FRBNY Puerto Rico Small Business Survey REGIONAL PERSPECTIVES ON PUERTO
Puerto Rico Department of Transportation and Public Works Highway and Transportation Authority
 Puerto Rico Department of Transportation and Public Works Highway and Transportation Authority San Juan Urbanized Area (SJUA) Urbanized Areas Under 200,000 in Population (UZA) Aguadilla Urbanized Area
SITUATION AT A GLANCE SITUATION UPDATE. Background
 SITUATION AT A GLANCE International Medical Corps is responding to the aftermath of multiple hurricanes in Puerto Rico, Dominica, and Florida. In Dominica, International Medical Corps has provided 411,658
Regional Economic Conditions
 Regional Economic Conditions Jason Bram, Research Officer Community Advisory Group Meeting March 29, 2018 The views expressed here are those of the presenter and do not necessarily represent those of the
San Juan Harbor Navigation Improvements Feasibility Study
 San Juan Harbor Navigation Improvements Feasibility Study DRAFT Economics Appendix RELEASED 8/8/17 1 EXECUTIVE SUMMARY San Juan Harbor is located on the northeastern coast of Puerto Rico and is the island
Puerto Ricans in Connecticut, the United States, and Puerto Rico, 2014
 Issued April 2016 Centro DS2016US-8 Puerto Ricans in Connecticut, the United States, and Puerto Rico, 2014 In 2014, Connecticut was the 6th state with most Puerto Ricans (301,182) in the United States.
(No. 9) (Approved April 8, 2001) AN ACT
 (Approved April 8, 2001) AN ACT") (S. B. 148) (No. 9) (Approved April 8, 2001) AN ACT To establish the Puerto Rico National Parks System, establish its objectives, its administration, the powers and duties of the Executive Director of
(S. B. 148) (No. 9) (Approved April 8, 2001) AN ACT To establish the Puerto Rico National Parks System, establish its objectives, its administration, the powers and duties of the Executive Director of
Puerto Rican Entrepreneurship in the U.S.
 Puerto Rican Entrepreneurship in the U.S. Research Brief issued April 2017 By: Jennifer Hinojosa Centro RB2016-14 Puerto Rican entrepreneurs were the fastest growing business firms in the U.S. According
September 29, resilience360.com
 September 29, 2017 resilience360.com resilience360@dhl.com 2 DHL RESILIENCE360 SPECIAL BRIEF Hurricane Maria made landfall in Puerto Rico on September 20, causing severe damage to the country s infrastructure,
Current Strategies. Humanitarian Relief to Puerto Rico
 The David Maldonado Foundation is dedicated to providing humanitarian relief assistance to churches, families, schools, and communities nationally and abroad. Our work focuses on strengthening families,
Housing Briefing Document. Resilient Puerto Rico Commission
 Housing Briefing Document Resilient Puerto Rico Commission February 2018 Contents 1 Introduction... 3 2 Housing Conditions and Trends... 3 2.1 Housing development trends... 3 2.2 Housing affordability
Public-Private Partnerships. Mr. David Alvarez Executive Director Puerto Rico Public-Private Partnerships Authority March 29, 2011
 Public-Private Partnerships Mr. David Alvarez Executive Director Puerto Rico Public-Private Partnerships Authority March 29, 2011 Disclaimer Today s presentation includes certain statements that are not
Tourist Traffic in the City of Rijeka For the Period Between 2004 and 2014
 Tourist Traffic in the City of Rijeka For the Period Between 2004 and 2014 Rijeka, February 2015. Table of Contents Pg No. 1. Introduction 3 2. Physical indicators on an annual level 4 2.1. Structure and
SITUATION AT A GLANCE
 SITUATION AT A GLANCE International Medical Corps is responding to the aftermath of multiple hurricanes in Puerto Rico, Dominica, and Florida. The damage in Dominica following Hurricane Maria is extensive,
 EB-5 Program February 2011 P R E S E N T E D B Y : www.hackleyrobertson.com U.S. Employment-Based Immigration 1. First Preference: Priority Workers (EB-1) 2. Second Preference: Advanced Degree and Professionals
Petrofin Research Greek fleet statistics
 Petrofin Research 2 nd part of Petrofin Research : Greek fleet statistics In this 2 nd part of Petrofin research, the Greek Fleet Statistics, we analyse the composition of the Greek fleet, in terms of
Evaluating Lodging Opportunities
 Evaluating Lodging Opportunities This section explores market opportunities for new lodging accommodations in the downtown area. It will help you understand travel and visitation trends, existing competition,
Puerto Ricans in Ohio, the United States, and Puerto Rico, 2014
 Issued April 2016 Centro DS2015US-12 Puerto Ricans in Ohio, the United States, and Puerto Rico, 2014 In 2014, Ohio had the tenth largest number of Puerto Ricans in the United States with 108,174 residents,
Thessaloniki Chamber of Commerce & Industry TCCI BAROMETER. March Palmos Analysis. March 11
 Thessaloniki Chamber of Commerce & Industry TCCI BAROMETER March 2011 Palmos Analysis March 11 TCCI BAROMETER (Executive Summary) Thessaloniki Chamber of Commerce and Industry (TCCI), consistent to its
PUERTO RICO: PATHWAY TO THE FUTURE Opportunities of an Economic Transformation
 PUERTO RICO: PATHWAY TO THE FUTURE Opportunities of an Economic Transformation Rebuilding Puerto Rico Mr. Omar J. Marrero, Esq. Executive Director Puerto Rico Public-Private Partnerships Authority & Central
Spirit Airlines Reports Third Quarter 2017 Results
 Spirit Airlines Reports Third Quarter 2017 Results MIRAMAR, Fla., October 26, 2017 - Spirit Airlines, Inc. (NASDAQ: SAVE) today reported third quarter 2017 financial results. GAAP net income for the third
Puerto Ricans in Georgia, the United States, and Puerto Rico, 2014
 Issued September 2016 Centro DS2014GA-14 Puerto Ricans in Georgia, the United States, and Puerto Rico, 2014 In 2014, an estimated 89,462 Puerto Ricans lived in Georgia and accounted for 1.7 percent of
Business Plan INTRODUCTION AIRPORT ENTERPRISE FUND OVERVIEW. Master Plan Guiding Principles
 5 Business Plan INTRODUCTION Just as previous chapters have outlined plans for the airport s physical development, this chapter outlines a plan for the airport s financial development. More specifically,
A COMPARISON OF THE MILWAUKEE METROPOLITAN AREA TO ITS PEERS
 KRY/WJS/EDL #222377 (PDF: #223479) 1/30/15 PRELIMINARY DRAFT Memorandum Report A COMPARISON OF THE MILWAUKEE METROPOLITAN AREA TO ITS PEERS EXECUTIVE SUMMARY This memorandum report provides a statistical
Puerto Ricans in Rhode Island, the United States, and Puerto Rico, 2013
 Issued September 2016 Centro DS2015US-07 Puerto Ricans in Rhode Island, the United States, and Puerto Rico, 2013 In 2013 an estimated 36,217 Puerto Ricans lived in Rhode Island and accounted for at least
Puerto Ricans in Massachusetts, the United States, and Puerto Rico, 2014
 Issued April 2016 Centro DS2016US-07 Puerto Ricans in Massachusetts, the United States, and Puerto Rico, 2014 In 2014, Massachusetts was the fifth state with most Puerto Ricans in the United States. In
State of the Shared Vacation Ownership Industry. ARDA International Foundation (AIF)
") State of the Shared Vacation Ownership Industry ARDA International Foundation (AIF) This paper includes a high-level overview of the timeshare industry with a core focus on financial growth, owner demographics
State of the Shared Vacation Ownership Industry ARDA International Foundation (AIF) This paper includes a high-level overview of the timeshare industry with a core focus on financial growth, owner demographics
PROFILE OF THE PUERTO RICAN POPULATION IN UNITED STATES AND PUERTO RICO: 2008
 PROFILE OF THE PUERTO RICAN POPULATION IN UNITED STATES AND PUERTO RICO: 2008 Sonia G. Collazo, Camille L. Ryan, Kurt J. Bauman U.S. Census Bureau Housing and Household Economic Statistics Division This
April 4, resilience360.com
 April 4, 2018 resilience360.com resilience360@dhl.com 2 DHL RESILIENCE360 SPECIAL REPORT With a death toll of 112 and a total estimated cost of USD 90 billion, Hurricane Maria ranks third in the list of
NAPA VALLEY VISITOR INDUSTRY 2016 Economic Impact Report
 NAPA VALLEY VISITOR INDUSTRY 2016 Economic Impact Report Research prepared for Visit Napa Valley by Destination Analysts, Inc. Table of Contents S E C T I O N 1 Introduction 2 S E C T I O N 2 Executive
International economic context and regional impact
 Contents I. GDP growth trends in Latin America and the Caribbean in 2012 II. Regional performance in 2012: Inflation, employment and wages External sector Policies: Fiscal and Monetary III. Conclusions
HOUSEHOLD TRAVEL SURVEY
 HOUSEHOLD TRAVEL SURVEY Household Travel Survey i TABLE OF CONTENTS Page 1.0 INTRODUCTION... 1 2.0 SUMMARY OF TRAVEL... 2 2.1 All-Day Travel Patterns... 2 2.1.1 Automobile Availability... 2 2.1.2 Trip
DOWNTOWN, CHARLOTTE AMALIE
 TOTAL VISITOR ARRIVALS TO THE USVI : DECEMBER YEAR TO DATE DECEMBER TOTAL VISITOR ARRIVALS 2,85, 2,8, 2,814,257 2,75, 2,7, 2,65, 2,6, 2,642,118 2,71,542 2,648,5 2,55, 212 213 214 215 Visitor arrivals ended
TRANSPORT AFFORDABILITY INDEX
 TRANSPORT AFFORDABILITY INDEX Report - December 2016 AAA 1 AAA 2 Table of contents Foreword 4 Section One Overview 6 Section Two Summary of Results 7 Section Three Detailed Results 9 Section Four City
2009 Muskoka Airport Economic Impact Study
 2009 Muskoka Airport Economic Impact Study November 4, 2009 Prepared by The District of Muskoka Planning and Economic Development Department BACKGROUND The Muskoka Airport is situated at the north end
Economic Impact of Tourism in Hillsborough County September 2016
 Economic Impact of Tourism in Hillsborough County - 2015 September 2016 Key findings for 2015 Almost 22 million people visited Hillsborough County in 2015. Visits to Hillsborough County increased 4.5%
SUB-REGIONAL PERFORMANCE MEASURES
 SUB-REGIONAL PERFORMANCE MEASURES 29 REPORT Overall regional performance is a function of five major areas: Service Coverage - monitors both how much service is available to people in the region (in terms
HVS Market Pulse: Why Aren t Hotels Being Built in Ski Towns?
 HVS Market Pulse: Why Aren t Hotels Being Built in Ski Towns? January 23, 2017 By Brett E. Russell In ski resort towns across the U.S. and Canada, a large and growing number of people are hitting the slopes.
The Hotel Industry: The United States, Virginia And Hampton Roads
 The Hotel Industry: The United States, Virginia And Hampton Roads THE HOTEL INDUSTRY: THE UNITED STATES, VIRGINIA AND HAMPTON ROADS Do not forget to show hospitality to strangers. Hebrews 12:2 This chapter
The Economic Impact of Tourism in Buncombe County, North Carolina
 The Economic Impact of Tourism in Buncombe County, North Carolina 2017 Analysis September 2018 Introduction and definitions This study measures the economic impact of tourism in Buncombe County, North
Housing in Hobart: an overview of the data. Richard Eccleston, Lisa Denny, Julia Verdouw & Kathleen Flanagan University of Tasmania May 2018
 Housing in Hobart: an overview of the data Richard Eccleston, Lisa Denny, Julia Verdouw & Kathleen Flanagan University of Tasmania May 2018 Informing the Housing Debate Tasmania is facing significant housing
Subject Property Schuster St Las Vegas, NV SW Las Vegas Ind. LOCATION Distance to Seaport:
 Subject Property 6615 Schuster St Las Vegas, NV 89118 - SW Las Vegas Ind LOCATION Distance to Airport: 6.2 mi Distance to Seaport: 232.5 mi Distance to Rail Terminal: 6.7 mi Population 500 Mile Radius:
Balance sheets and additional ratios
 Balance sheets and additional ratios amounts in millions unless otherwise stated Consolidated balance sheets Dutch guilders USD* June 30, December 31, June 30, December 31, 1997 1996 1997 1996 Fixed assets
NAPA VALLEY VISITOR INDUSTRY 2014 Economic Impact Report
 NAPA VALLEY VISITOR INDUSTRY 2014 Economic Impact Report Research prepared for Visit Napa Valley by Destination Analysts, Inc. Table of Contents SECTION 1 Introduction 2 SECTION 2 Executive Summary 5 SECTION
TRANSPORT AFFORDABILITY INDEX
 TRANSPORT AFFORDABILITY INDEX Report - March 2018 AAA 1 AAA 2 Table of contents Foreword 4 Section One Overview 6 Section Two Summary of Results 8 Section Three Detailed Results 14 Section Four State by
Overview of the Regional Economy
 Overview of the Regional Economy Jason Bram, Research Officer Presentation to the Community Depository Institutions Advisory Council (CDIAC) March 9, 2018 The views expressed here are those of the presenter
Shopping Mall Business in Japan
 Overview of Business Operations (Fiscal year ending February 20, 2011) Shopping Mall Business in Japan ÆON Mall is pressing ahead in creating shopping malls that answer customer needs and are the most
Press Release. Bilfinger 2017: Stable foundation laid for the future
 Press Release February 14, 2018 Bilfinger 2017: Stable foundation laid for the future Organic growth in orders received after three years of decline Trend reversal: Output volume better than expected Growth
2013/14 Pre-Budget Submission Accommodation Association of Australia
 2013/14 Pre-Budget Submission Accommodation Association of Australia Accommodation Association of Australia Principal Contact Mr Richard Munro Chief Executive Officer Phone: +61 2 8666 9015 EXECUTIVE SUMMARY
An outdoor waterpark is a facility offering three or more waterslides and other aquatic facilities.
 Methodology for Feasibility Studies for Waterparks By David J. Sangree, MAI, CPA, ISHC Before a developer or an organization considers constructing a new indoor or outdoor waterpark at a resort or standalone,
THIRD QUARTER RESULTS 2017
 THIRD QUARTER RESULTS 2017 KEY RESULTS In the 3Q17 Interjet total revenues added $5,835.1 million pesos that represented an increase of 22.0% over the revenue generated in the 3Q16. In the 3Q17, operating
CONTACT: Investor Relations Corporate Communications
 NEWS RELEASE CONTACT: Investor Relations Corporate Communications 435.634.3200 435.634.3553 Investor.relations@skywest.com corporate.communications@skywest.com SkyWest, Inc. Announces Fourth Quarter 2017
CONTACT: Investor Relations Corporate Communications
 NEWS RELEASE CONTACT: Investor Relations Corporate Communications 435.634.3200 435.634.3553 Investor.relations@skywest.com corporate.communications@skywest.com SkyWest, Inc. Announces Second Quarter 2017
Preliminary Figures FY 2016
 February 14, 2017 Preliminary Figures FY 2016 Capital Markets Day 2017 Tom Blades (CEO) Disclaimer This presentation has been produced for support of oral information purposes only and contains forwardlooking
Appendix B Ultimate Airport Capacity and Delay Simulation Modeling Analysis
 Appendix B ULTIMATE AIRPORT CAPACITY & DELAY SIMULATION MODELING ANALYSIS B TABLE OF CONTENTS EXHIBITS TABLES B.1 Introduction... 1 B.2 Simulation Modeling Assumption and Methodology... 4 B.2.1 Runway
Eastern Caribbean Humanitarian Situation Report No. 12
 @UNICEF/Romaro Richardon/Anguilla2017 Eastern Caribbean Humanitarian Situation Report No. 12 14 November 2017 Highlights As of mid-november, the majority of schools in Anguilla, Antigua, British Virgin
Agritourism in Missouri: A Profile of Farms by Visitor Numbers
 Agritourism in Missouri: A Profile of Farms by Visitor Numbers Presented to: Sarah Gehring Missouri Department of Agriculture Prepared by: Carla Barbieri, Ph.D. Christine Tew, MS candidate April 2010 University
5 Demography and Economy
 5 Demography and Economy Demography People have probably lived on Great Barrier Island (Aotea) since the 13 th century. There are few written observations about the number of Maori settled here but these
Execution of WIN2016 programme currently underway, confirmation of underlying operating margin target of 5-6% for 2015/2016
 Press Release Results for the year ending 30 September 2013 Paris, 4 December 2013 Note: this press release presents consolidated 2013/2013 earnings established under IFRS accounting rules, currently being
The Economic Impact of Tourism on Galveston Island, Texas Analysis
 The Economic Impact of Tourism on Galveston Island, Texas 2012 Analysis Headline Results Headline results Tourism is a significant contributor to business sales, employment, and taxes on Galveston Island.
ECONOMIC PROFILE PARK CITY & SUMMIT COUNTY, UTAH
 ECONOMIC PROFILE PARK CITY & SUMMIT COUNTY, UTAH Prepared by the Park City Chamber of Commerce & Visitors Bureau PO Box 1630, Park City, UT 84060 1.800.453.1360 Economic Profile Packet Sections 1. Introduction
Figure 1.1 St. John s Location. 2.0 Overview/Structure
 St. John s Region 1.0 Introduction Newfoundland and Labrador s most dominant service centre, St. John s (population = 100,645) is also the province s capital and largest community (Government of Newfoundland
Heathrow (SP) Limited
 Limited") Draft v2.0 10 Feb Heathrow (SP) Limited Results for year ended 31 December 2013 24 February 2014 Strong operational and financial performance in 2013 Passenger satisfaction at record high and over 72 million
Draft v2.0 10 Feb Heathrow (SP) Limited Results for year ended 31 December 2013 24 February 2014 Strong operational and financial performance in 2013 Passenger satisfaction at record high and over 72 million
Press Release. Bilfinger with dynamic start to financial year 2018
 Press Release May 15, 2018 Bilfinger with dynamic start to financial year 2018 Book-to-bill ratio reaches 1.2 in the first quarter Fourth consecutive growth quarter in orders received Adjusted EBITA above
Business Growth (as of mid 2002)
") Page 1 of 6 Planning FHWA > HEP > Planning > Econ Dev < Previous Contents Next > Business Growth (as of mid 2002) Data from two business directories was used to analyze the change in the number of businesses
Page 1 of 6 Planning FHWA > HEP > Planning > Econ Dev < Previous Contents Next > Business Growth (as of mid 2002) Data from two business directories was used to analyze the change in the number of businesses
The Economic Impact of Tourism on Galveston Island, Texas
 The Economic Impact of Tourism on Galveston Island, Texas 2017 Analysis Prepared for: Headline Results Headline results Tourism is an integral part of the Galveston Island economy and continues to be a
A COMPARISON OF THE MILWAUKEE METROPOLITAN AREA TO ITS PEERS
 KRY/WJS/EDL #222377 v4 (PDF: #223479v2) 4/1/15 APPENDIX D REVISED DRAFT Memorandum Report A COMPARISON OF THE MILWAUKEE METROPOLITAN AREA TO ITS PEERS EXECUTIVE SUMMARY This report provides a statistical
CANOVANAS URBAN DEVELOPMENT CORP. P.O. BOX SAN JUAN, P.R
 CANOVANAS URBAN DEVELOPMENT CORP. P.O. BOX 9021990 SAN JUAN, P.R. 00902-1990 787-602-8955 proyectosnuevospr@gmail.com COMMERCIAL LOTS FOR SALE UP TO 60,000 S.F. AVAILABLE FOR CONSTRUCTION Karla Mas O Neill
El Al Israel Airlines announced today its financial results for the year 2016 and the fourth quarter of the year:
 El Al Israel Airlines announced today its financial results for the year 2016 and the fourth quarter of the year: The Company's revenues in 2016 amounted to approx. USD 2,038 million, compared to approx.
Thessaloniki Chamber of Commerce & Industry TCCI BAROMETER. Palmos Analysis Ltd.
 Thessaloniki Chamber of Commerce & Industry TCCI BAROMETER Palmos Analysis Ltd. March 2014 TCCI BAROMETER (Executive Summary) Thessaloniki Chamber of Commerce and Industry (TCCI), consistent to its efforts
Formulation of econometric solutions of immediate resources for a disaster area in Mayagüez, Puerto Rico
 Department of Civil Engineering and Surveying University of Puerto Rico Mayagüez Campus Formulation of econometric solutions of immediate resources for a disaster area in Mayagüez, Puerto Rico Coral A.
Mutual Development Service, Corp.
 Mutual Development Service, Corp. Since 1993 LOW INCOME HOUSING PROJECTS LIHTC Development in Puerto Rico Mutual Development Service, Corp. Since 1993 24 20 years committed commited to the development
2013 ASTA Travel Agency Industry Overview
 University of Massachusetts Amherst ScholarWorks@UMass Amherst Tourism Travel and Research Association: Advancing Tourism Research Globally 2013 Marketing Outlook Forum - Outlook for 2014 2013 ASTA Travel
Land area 1.73 million km 2 Queensland population (December 2015) Brisbane population* (June 2015)
 Brisbane population* (June 2015)") Queensland - 18 Queensland OVERVIEW Queensland is nearly five times the size of Japan, seven times the size of Great Britain, and two and a half times the size of Texas. Queensland is Australia s second
Queensland - 18 Queensland OVERVIEW Queensland is nearly five times the size of Japan, seven times the size of Great Britain, and two and a half times the size of Texas. Queensland is Australia s second
NAPA VALLEY VISITOR INDUSTRY 2012 Economic Impact Report
 Join Visit Napa Valley NAPA VALLEY VISITOR INDUSTRY 2012 Economic Impact Report Research prepared for Visit Napa Valley by Destination Analysts, Inc. Table of Contents SECTION 1 Introduction 2 SECTION
Thank you for participating in the financial results for fiscal 2014.
 Thank you for participating in the financial results for fiscal 2014. ANA HOLDINGS strongly believes that safety is the most important principle of our air transportation business. The expansion of slots
Alternative Highest & Best Use Analysis Boutique Hotel
 Alternative Highest & Best Use Analysis In response to numerous comments received from the public, as well as issues raised by the CCC in the Appeal Staff Report Substantial Issue Determination, the following
part one: comparing puerto ricans
 part one: comparing puerto ricans snapshot: puerto ricans across major us metro areas This section uses data from the 2010 American Community Survey one-year estimates to examine the socioeconomic characteristics
CONTACT: Investor Relations Corporate Communications
 NEWS RELEASE CONTACT: Investor Relations Corporate Communications 435.634.3200 435.634.3553 Investor.relations@skywest.com corporate.communications@skywest.com SkyWest, Inc. Announces Second Quarter 2016
CITY OF COTATI: LOCAL ECONOMIC REPORT
 EDB Sonoma County Economic Development Board Cotati Chamber of Commerce economy 2010-11 CITY OF COTATI: LOCAL ECONOMIC REPORT E c o n o m i c D e v e l o p m e n t B o a r d 4 0 1 C o l l e g e Av e n
VALUE OF TOURISM. Trends from
 VALUE OF TOURISM Trends from 2005-2015 March 2017 TABLE OF CONTENTS 1. Overview... 2 Key highlights in 2015... 2 2. Contributions to the economy... 4 TOURISM REVENUE... 5 Total revenue... 5 Tourism revenue
Australian Cities Accounts Estimates. December 2011
 Australian Cities Accounts 2010-11 Estimates December 2011 This report has been prepared by: SGS Economics and Planning Pty Ltd ACN 007 437 729 Level 5 171 Latrobe Street MELBOURNE VIC 3000 P: + 61 3 8616
FOURTH QUARTER RESULTS 2017
 FOURTH QUARTER RESULTS 2017 KEY RESULTS In the 4Q17 Interjet total revenues added $5,824.8 million pesos that represented an increase of 10.8% over the revenue generated in the 4Q16. In the 4Q17, operating