FOREWORD. Information has also been sourced from International bodies such as:
|
|
|
- Priscilla George
- 6 years ago
- Views:
Transcription


1
2 FOREWORD Belize Travel and Tourism Statistics is an annual compilation of statistics on the Tourism Industry in Belize. The Belize Tourism Board (BTB) wishes to thank the following organizations for providing us annually with the data which makes this publication possible: Institute of Archaeology Belize Audubon Society Central Bank of Belize Department of Immigration & Nationality Hol Chan Marine Reserve The Belize Zoo and Tropical Education Center The Community Baboon Sanctuary National Institute of Culture & History Forestry Department Information has also been sourced from International bodies such as: Caribbean Tourism Organization United Nations World Tourism Organization World Travel and Tourism Council Sistema de Integración Centroamericana This publication includes overnight visitor arrival figures and cruise passenger arrivals for Belize and the Caribbean. This publication also includes tourist arrival and day-tripper data for the Central American region. A detailed market breakdown of visitors to Belize is also featured. The performance of the hotel sector can be found in Section 2. Section 3 is devoted to visits to selected sites countrywide. All recommendations, comments, and inquiries regarding the contents of this publication should be forwarded to: Raymond James Mossiah Product Development Department Belize Tourism Board P.O. Box Regent & South Streets Belize City, Belize Phone: Fax: Website: btbb@btl.net
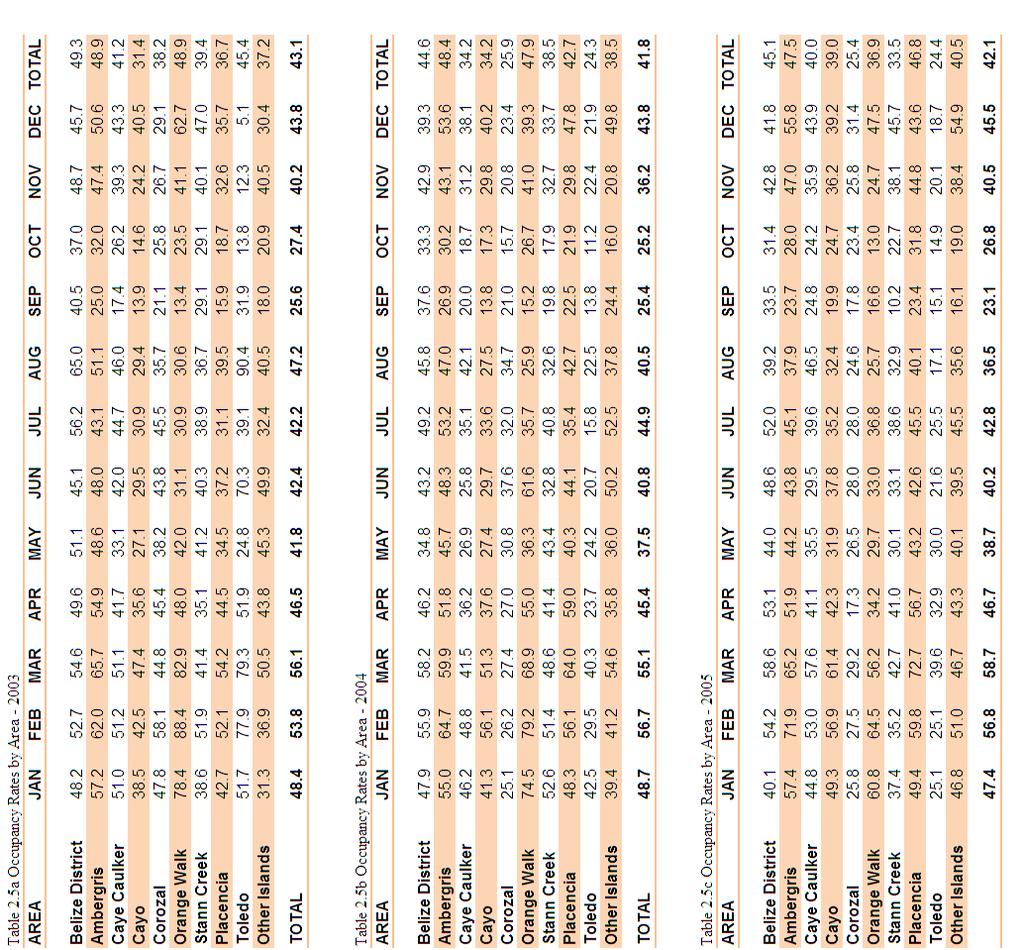
3 TRAVEL AND TOURISM STATISTICS 2008 CONTENTS SECTION 1: ARRIVAL STATISTICS SUMMARY Table 1.1 International Tourist Arrivals by Sub-region Table 1.2 Overnight Visitors by Category Table 1.3 Tourist Visitors by Port of Entry Table 1.4 Tourist Arrivals at the Philip Goldson International Airport by Month Table 1.5 Tourist Arrivals at the Philip Goldson International Airport by Quarter Table 1.6 Tourist Arrivals at the Philip Goldson International Airport by Season Table 1.7 Tourist Visitors to selected Caribbean Destinations Table 1.8 Market Breakdown Tourist Visitors to selected Caribbean Destinations Table 1.9 Tourist Arrivals to Central America Table 1.10 Day Trippers to Central America Table 1.11 Total Visitors to Central America Table 1.12 Overnight Tourist Visitors to Belize by Month Table 1.13 Overnight Tourist Visitors to Belize by Origin Table 1.14 Overnight Tourist Visitors to Belize by Market Share Table 1.15 European Overnight Tourist Visitors to Belize by Origin Table 1.16 European Overnight Tourist Visitors to Belize by Month Table 1.17 American Overnight Tourist Visitors to Belize by Month Table 1.18 Canadian Overnight Tourist Visitors to Belize by Month Table 1.19 Latin American Overnight Tourist Visitors to Belize by Month Table 1.20 Cruise Arrivals by Month Table 1.21 Cruise Arrivals by Quarter Table 1.22 Cruise Arrivals by Major Cruise Lines Table 1.23 Cruise Passenger Arrivals to selected Caribbean Destinations Table 1.24 Tourist Expenditure Table 1.25 Selected Central American Indicators SECTION 2: HOTEL STATISTICS SUMMARY Table 2.1 Number of Hotels (also Figure 2.1) Table 2.2 Number of Rooms (also Figure 2.2) Table 2.2a. Hotel Size Distribution (also Figure 2.3) Table 2.3 Number of Beds (also Figure 2.4) Table 2.4 Hotel Performance by Region Table 2.5a Monthly Occupancy Rates by Area, 2003
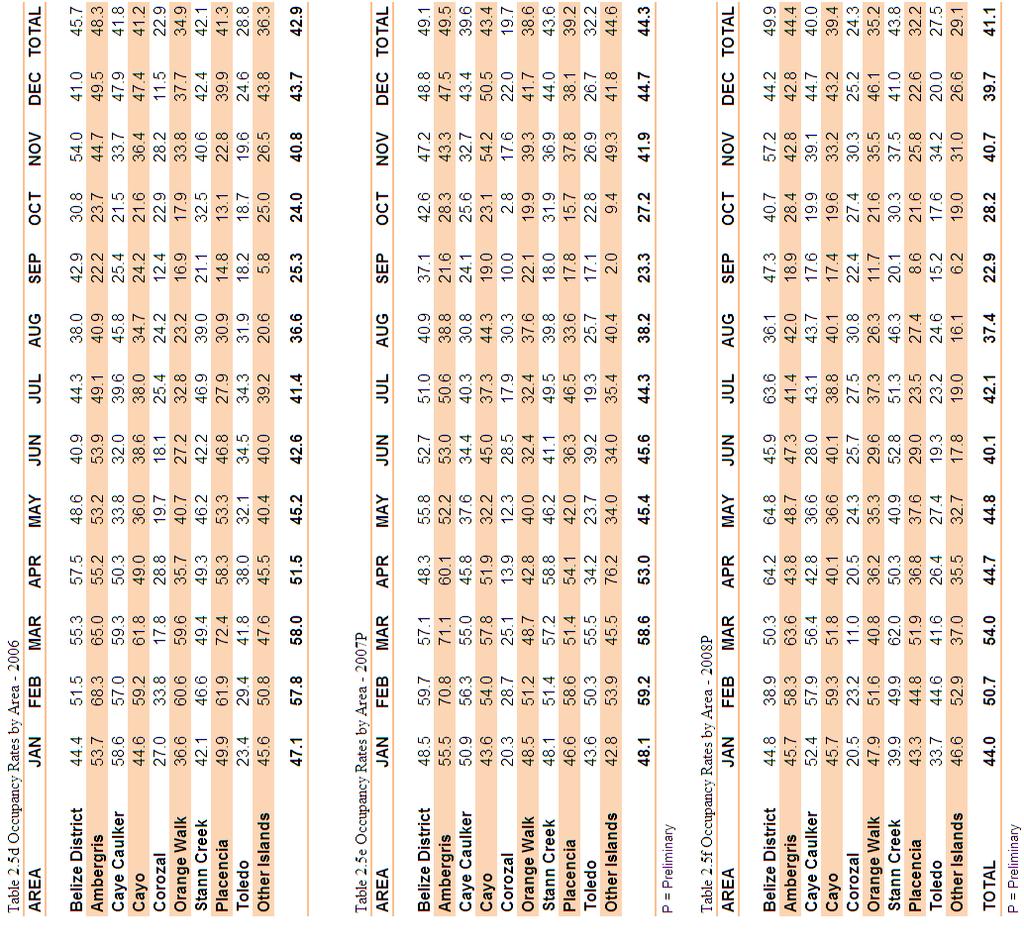
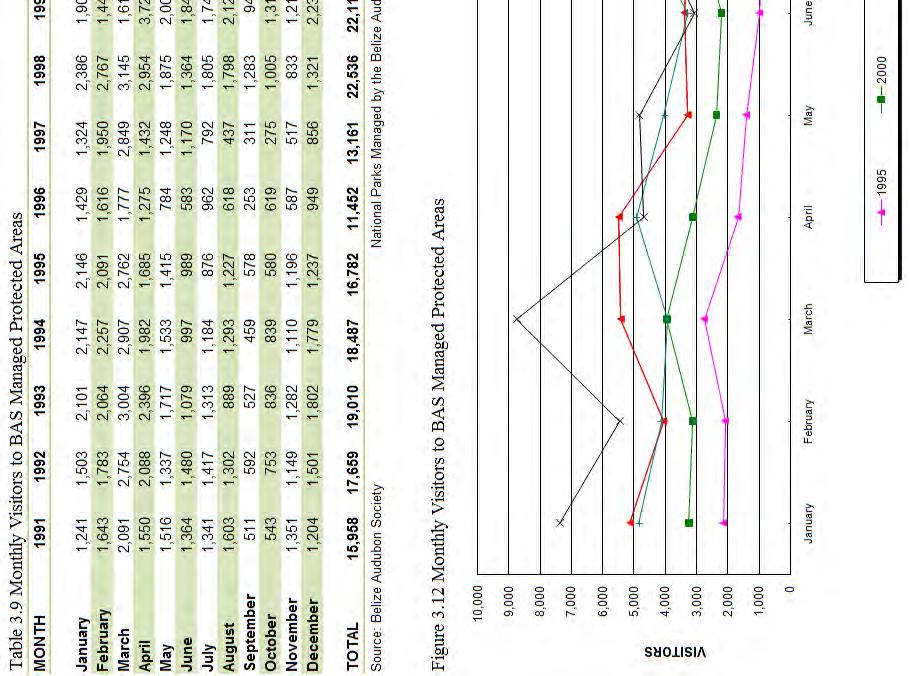
4 Table 2.5b Monthly Occupancy Rates by Area, 2004 Table 2.5c Monthly Occupancy Rates by Area, 2005 Table 2.5d Monthly Occupancy Rates by Area, 2006 Table 2.5e Monthly Occupancy Rates by Area, 2007 Table 2.5f Monthly Occupancy Rates by Area, 2008 Table 2.6 Monthly Occupancy Rates (also Figure 2.5) Table 2.7 Average Room Rates by Area (also Figure 2.6) Table 2.8 Average Room Rates by Month (also Figure 2.7) Table 2.9 Room Revenue Distribution (%) by Area (also Figure 2.8) Table 2.10 Room Revenue Distribution (%) by Month (also Figure 2.9) Table 2.11 Employment in the Hotel Industry (also Figure 2.10) Table 2.12 Employment by Nationality Table 2.13 Hotel Employment by Area (also Figure 2.11) Table 2.14 Tour Guides & Tour Operators by Area (also Figure 2.12 & Figure 2.13) SECTION 3: VISITATION STATISTICS TO SELECTED ATTRACTIONS SUMMARY Table 3.1 Visitors to Maya Sites (also Figure 3.3) Table 3.2 Monthly Visitors to Maya Sites (also Figure 3.4) Table 3.3 Visitors to Hol Chan Marine Reserve (also Figure 3.5) Table 3.4 Monthly Visitors to Hol Chan Marine Reserve (also Figure 3.6) Table 3.5 Types of Visitors to the Belize Zoo (also Figure 3.7) Table 3.6 Monthly Visitors to the Belize Zoo (also Figure 3.8) Table 3.7 Visitors to BAS Managed Protected Areas (also Figure 3.10) Table 3.8 Types of Visitors to BAS Managed Protected Areas (also Figure 3.11) Table 3.9 Monthly Visitors to BAS Managed Protected Areas (also Figure 3.12) Table 3.10 Monthly Visitors to the Mountain Pine Ridge Reserve (also Figure 3.13) Table 3.11 Types of Visitors to the Community Baboon Sanctuary (also Figure 3.14) Table 3.12 Monthly Visitors to the Community Baboon Sanctuary
5 SECTION 1. ARRIVAL STATISTICS
6 Immigration Statistics Tourist Arrivals The illustration below shows that arrivals fall into tourist (shaded areas) and non-tourist categories. In 2008 Belize welcomed 842,396 visitors, of which 245,026 were overnight tourists and 597,370 were cruise visitors spending only a few hours in the country. Figure 1.1 Arrivals into Belize by Major Categories and Subgroups ARRIVALS INTO BELIZE TOTAL ARRIVALS INTERNATIONAL ARRIVALS BELIZEANS RETURNING RESIDENTS Temporary Employment Permit Student Permit Living Abroad (In-boundTourists) Living in Belize (Non In-bound Tourists) Holders of Resident Cards Foreigners living in Belize for 1-5 years Diplomatic Organizational Married to Belizeans Children with Belizean Parents Dependent Permit Intransit Official (In-bound Toursits) Tourist (see page 2) Business (In-bound Tourists) The Immigration Department categorizes arrivals as shown below. Included in Total Arrivals are Tourists and Non-Tourists. Leisure, Recreation and holidays Business and Professional Religion / Pilgrimages Visiting Friends and Relatives Health Treatment Other (Aircraft & Ships crews on public transportation) Shaded areas indicate tourist visitors Purpose of visit RR Returning Residents TV Tourist Visitors (leisure/vacation) BV Business Visitors (private sector business) INT Intransit Visitors OV Official Visitors (government business) TEP Temporary Employment Permits (persons with) SP Student Permit (persons with) DP Dependent Permits (persons with) DIP Diplomats ORG Organizational (non-nationals residing in Belize)


7 International Tourist Arrivals According to the World Tourism Organization: 2008 will clearly go into the history books as a year of turbulence and contrasts. In the 12 months since UNWTO published its January 2008 edition of the World Tourism Barometer, including forecasts for the year ahead, the growth in international tourist arrivals has slowed drastically worldwide, under the influence of an extremely volatile and unfavorable global economy due to factors such as the credit crunch, the widening financial crisis, commodity and oil price rises, and massive exchange rate fluctuations. All this has, inevitably, undermined both business and consumer confidence, contributing in turn to the current global recession. 1 Table 1.1 International Tourist Arrivals by Sub-region Figure 1.2 World Inbound International Tourist Arrivals, 2008* Figure 1.3 World Inbound International Tourist Arrivals (millions) 1 UNWTO World Tourism Barometer, p.1 Vol. 7 No. 1 January
8 In 2008 the global travel industry was hit by a number of economic hurricanes. On the international front, arrivals continued to grow in the first half of the year. However in Belize, the signs of trouble were evident since April and Belize ended the year down by 2.5%. Belize experienced decreases in both the leisure category as well as business category. The table below shows that in 2008 approximately 96% of overnight tourists came for leisure while the remaining 4% visited for business. Table 1.2 Overnight Visitors by Category Category R 2008P Leisure 186, , , , , , , , ,929 Business 8,883 10,250 13,424 10,063 10,828 10,426 11,281 10,891 8,822 Total 195, , , , , , , , ,026 P = Provisional R = Revised Entry Points The Philip Goldson International Airport (PGIA) remains the main port of entry for tourist arrivals to Belize. Since 2004 tourist visitors through this point have accounted for more than 70% of overnight visitors to Belize. In 2008 this was no different as the PGIA represented roughly 73% of tourists. International carriers into Belize include US Airways from Charlotte, North Carolina (USA); American Airlines from Dallas, Texas and Miami, Florida; Continental Airlines from Houston, Texas; and Grupo Taca which remains constant from San Salvador, El Salvador and also from Houston. Delta Airlines arrives from Atlanta, Georgia and there are a few charters and private flights that come in every year into Belize. Table 1.3 Tourists Visitors by Port of Entry Port P 2007R 2008P PGIA 131, , , , , , , , ,379 SLA 27,258 26,555 25,276 21,893 21,985 20,843 21,540 22,555 23,783 BWBS 27,503 26,912 36,369 38,261 38,034 33,253 38,667 36,261 33,323 SCK ,287 1, ,017 PGA 8,420 7,940 7,285 7,155 6,914 7,107 7,734 8,962 8,524 Total 195, , , , , , , , ,026 PGIA Philip Goldson International Airport SCK Stann Creek (Southern) Seaport SLA Santa Elena (Northern) Border Station with Mexico PGA Punta Gorda (Southern) Seaport BWBS Belize Western Border (Benque) Station with Guatemala

9 Figure Tourist Visitors by Port of Entry The four record setting months at the PGIA were not able to offset the months in which decreases were reported. That led to an overall decrease in the number of arrivals at the PGIA. In analyzing the market breakdown through the PGIA it can be said that the decrease in American visitors for the most part accounted for the decrease at the PGIA. Of note is that this is the primary port of entry for American visitors as it is approximately 2 hours from Dallas, Houston and Miami while Charlotte and Atlanta are 2.5 and 4 hours away respectively. Table 1.4 Total Tourists Arrivals at Philip Goldson International Airport (PGIA) by month % Change Month R 2008P vs Jan 11,071 12,334 11,057 13,158 14,630 16,156 16,144 15,358 16, Feb 13,326 13,460 13,020 14,708 17,409 18,848 18,728 18,708 19, Mar 17,427 16,222 16,347 19,061 19,917 23,394 22,852 25,195 24, Apr 12,743 12,782 10,472 14,183 14,635 15,330 18,262 17,565 15, May 10,965 11,832 11,154 13,085 12,804 13,138 14,933 15,349 15, Jun 11,706 12,526 11,952 13,594 14,107 15,949 16,703 17,141 17, Jul 12,177 12,830 11,309 13,779 15,038 15,679 16,007 15,968 15, Aug 10,182 11,266 9,995 12,001 11,665 11,471 11,567 12,249 12, Sep 6,447 5,027 5,045 5,608 6,370 6,189 6,069 6,289 5, Oct 4,658 5,494 5,740 6,888 7,633 7,749 7,149 8,268 6, Nov 8,447 8,433 9,847 10,838 11,615 12,064 12,203 12,334 12, Dec 12,533 11,568 13,736 15,075 16,852 18,671 17,951 18,491 16, TOTAL 131, , , , , , , , ,

10 Figure 1.5 Tourist Arrivals at PGIA by Month Table 1.5 Tourists Arrivals by Quarter at the PGIA R 2008P % Change vs st Quarter 41,825 42,016 40,425 46,928 51,956 58,397 57,724 59,261 60, nd Quarter 35,415 37,141 33,578 40,862 41,545 44,417 49,898 50,056 48, rd Quarter 28,806 29,124 26,349 31,388 33,074 33,339 33,643 34,506 33, th Quarter 25,638 25,495 29,323 32,801 36,100 38,484 37,287 39,093 35, TOTAL 131, , , , , , , , , Table 1.6 Tourists Arrivals by Season at the PGIA R 2008P % Change vs Winter 54,568 54,798 50,897 61,111 66,591 73,727 75,985 76,826 76, Summer 77,115 78,976 78,777 90,868 96, , , , , TOTAL 131, , , , , , , , , Winter refers to January-April Summer refers to May-December
11 Table 1.7 Tourist Arrivals in Selected Caribbean Destinations Destination Change Anguilla 47,965 43,798 46,915 53,987 62,084 72,962 77,652 68, Antigua & Barbuda * 193, , , , , , , , Aruba 691, , , , , , , ,675 N/A Bahamas 1,428,209 1,402,894 1,428,973 1,450,043 1,514,532 1,600,751 1,527,622 1,462, Barbados P 507, , , , , , , , Belize P 195, , , , , , , , Bermuda * 274, , , , , , , , Bonaire 50,395 52,086 62,179 62,507 62,550 63,552 74,309 62,101 N/A British Virgin Islands P 295, , , , , , , , Cancun (Mexico) ** 2,178,715 1,965,445 2,076,478 2,331,362 2,134,180 1,586,942 2,022,302 2,165, Cayman Islands 334, , , , , , , , Cozumel (Mexico)** 240, , , , , ,680 57,075 N/A N/A Cuba 1,774,541 1,685,231 1,907,320 1,854,410 2,319,334 2,220,567 2,152,221 2,348, Curacao 204, , , , , , , ,164 N/A Dominica 66,393 67,108 72,948 79,386 79,257 83,916 54,606 N/A N/A Dominican Republic* 2,868,915 2,793,581 3,268,182 3,443,205 3,690,692 3,965,055 3,979,582 3,979, Grenada P 123, , , ,865 98, , , , Guyana 95, , , , , , ,487 38, Jamaica 1,276,516 1,266,366 1,350,285 1,414,786 1,478,663 1,678,905 1,700,785 1,767,271 N/A Martinique P 460, , , , , , , , Montserrat 9,800 9,623 8,375 10,138 9,690 7,963 7,745 7, Puerto Rico ** 1,218,712 1,279,762 1,321,846 1,411,910 1,465,292 1,446,184 1,361,083 1,323, Saba 9,005 10,778 10,260 11,012 11,462 11,012 11,673 12, St Eustatius 9,597 9,781 10,788 11,056 10,355 9,585 11,568 7,146 N/A St Kitts & Nevis 25,493 25,201 17,699 35,390 27,869 N/A N/A N/A N/A St Lucia 250, , , , , , , , St Maarten * 402, , , , , , , , St Vincent & Grenadines 70,686 77,622 78,535 86,727 95,505 97,432 89,637 60, Trinidad & Tobago 383, , , , , , , , Turks & Caicos 165, , , , ,000 N/A N/A N/A N/A US Virgin Islands 609, , , , , , , , Data contained reflects January to December for the respective years. For 2008: St. Eustatius to July only, Aruba and Curacao to September only and Bonaire to October only. For 2007: Cozumel to February only and Dominica to August only. Please note there have been revisions to data from various countries as far back as The information reflected here is based on the most recent information from the Caribbean Tourism Organization (as of April 2, 2009). * Non-Resident Air Arrivals **Non-Resident Hotel registrations only P Preliminary R Revised SOURCE: Caribbean Tourism Organization
12 Table 1.8 Market Breakdown of Tourist Arrivals in Selected Caribbean Destinations Time United Destination Anguilla Antigua & Barbuda * Aruba Bahamas Barbados P Belize P Bermuda * Bonaire Cancun (Mexico) ** Cayman Islands Cuba 1 Curacao Dom Republic * Grenada P Guyana Jamaica Montserrat Puerto Rico ** Saba St. Lucia St. Eustatius St. Maarten * St. Vincent & Grenadines Suriname Trinidad & Tobago U S Virgin Is.** Frame States 2008 Canada 2008 Europe 2008 Other 2008 Tourists % Change Tourists % Change Tourists % Change Tourists % Change Jan- Dec 40, , , , Jan- Dec 84, , , , Jan- Sep 418, , , , Jan- Dec 1,176, , , , Jan- Dec 131, , , , Jan- Dec 147, , , , Jan- Dec 189, , , , Jan- Oct 26, , , , Jan- Dec 1,679, , , , Jan- Dec 240, , , , Jan- Dec , , , Jan- Sep 35, , , , Jan- Dec 1,092, , ,345, , Jan- Dec 21, , , , Jan- May 18, , , , Jan- Dec 1,150, , , , Jan- Dec 1, , , Jan- Dec , , , Jan- Dec 4, , , Jan- Dec 108, , , , Jan- July 1, , , Jan- Dec 257, , , , Jan- Aug 17, , , , Jan- Feb , , Jan- July 115, , , , Jan- Dec 672, , , , * Non-Resident Air Arrivals **Non-Resident Hotel registrations only SOURCE: Caribbean Tourism Organization P Preliminary R Revised
13 Table 1.9 Tourist Arrivals to Central America (in 000s) Country R 2005R 2006R 2007R 2008P % Change Belize Costa Rica 1, , , , , , , El Salvador , , , Guatemala , , , , , Honduras Nicaragua Panama , , P = Preliminary R = Revised Table 1.10 Day Trippers to Central America (in 000s) Country R 2005R 2006R 2007R 2008P % Change Belize Costa Rica El Salvador Guatemala Honduras Nicaragua Panama For Belize the information refers to cruise visitors only. P = Preliminary R = Revised Table 1.11 Total Visitors to Central America (in 000s) Country P 2007R 2008P % Change Belize , , Costa Rica 1, , , , , , , El Salvador 1, , , , , Guatemala , , , , , Honduras , , , , , Nicaragua , Panama , , , , , P = Preliminary R = Revised SOURCE: Sistema de Integración Centroamericana (SICA)
14 Table 1.12 Overnight Tourist Visitors to Belize by Month Month R 2008P Change vs January 17,033 18,896 17,820 19,648 22,166 22,165 22,264 21,534 23, February 18,767 19,767 19,377 20,412 23,645 24,734 24,278 25,618 25, March 22,921 21,526 23,388 24,460 26,817 29,321 29,415 31,267 30, April 18,699 18,398 17,027 19,660 20,320 20,503 23,888 23,595 21, May 15,704 16,335 16,106 17,967 17,386 17,999 19,898 19,938 20, June 16,148 17,081 16,953 19,228 18,939 20,460 21,572 22,409 22, July 18,307 18,704 18,011 20,670 21,734 20,062 22,024 22,710 22, August 16,633 17,342 16,184 19,689 17,479 18,335 18,498 18,112 18, September 11,019 8,659 8,634 9,975 10,432 10,013 11,626 11,079 8, October 8,580 9,069 10,397 11,524 12,167 12,011 10,883 12,292 11, November 13,632 12,822 15,603 16,313 16,873 16,711 18,079 18,911 17, December 18,324 17,357 20,021 21,028 22,873 24,259 24,883 23,958 23, Total 195, , , , , , , , , Table 1.13 Overnight Tourist Visitors to Belize by Origin Area R 2008P Change vs American 104, , , , , , , , , Canadian 9,205 9,492 9,185 9,831 11,926 13,580 15,553 16,655 17, European 27,674 29,735 29,115 33,528 32,767 33,466 34,373 34,175 34, Latin America 34,485 31,437 38,592 35,610 33,751 28,658 29,932 29,860 27, Belizeans living abroad 14,106 12,999 11,896 7,799 7,698 7,705 8,365 9,160 8, Caribbean 1,696 1,760 1,941 2,056 2,209 2,087 2,319 2,595 2, Asia 2,097 2,402 2,235 2,412 2,729 2,469 2,367 3,280 2, Oceania 1,129 1,122 1,176 1,342 1,556 1,915 2,149 2,202 2, Middle East Africa TOTAL 195, , , , , , , , , Latin America includes Mexico, Central America and South America
15 The Canadian market shows great potential as it has almost doubled since the year In the period 2007 to 2008 there was an increase of 6.2%. This was noteworthy since there are no direct flights from any Canadian province to Belize. Meanwhile arrivals from Europe flat-lined around 34,000 and have not reflected any significant growth in the last five years. However, there has been significant growth since The American market represents just over 60% of all international overnight arrivals into Belize. Due to the economic downturn in the US, many Americans did not travel, decided on destinations closer to the United States, or opted for travel within the borders of the US. In times of economic uncertainty, travel becomes a luxury that is foregone for more immediate needs, and this indeed was the case in 2008 for many Americans. Table 1.14 Overnight Tourist Visitors to Belize by Market Share Area R 2008P American Canadian European Latin America Belizeans living abroad Caribbean Asia Oceania Middle East Africa TOTAL The Airline Development Committee established in 2008 is mandated to seek new carriers and routes into Belize, including European ones. The European market has been at arm s length for many years. The infrastructure is not currently in place to properly service that market. Currently there are no direct flights into Belize from Europe, and often Europeans do not want to overnight in the United States en route to Belize. Even though Europeans often have a multiple destination Central American tour, the lack of direct flights from Europe into Belize does not afford them the opportunity to at least start that tour in Belize. Nonetheless, Europe is an opportunity. Table 1.7 shows that some very small Caribbean islands have tapped into the European market and have made significant steps, both in terms of having direct flights into their respective destinations, and in the case of St. Lucia for example, working very closely with some of the major wholesalers and tour operators in Europe. Evidence of this is reflected in the fact that in 2008 St. Lucia had almost three times the number of European visitors than did Belize.
16 With the strength of the Euro relative to other world currencies, travel became more affordable to European Union residents. Table 1.15 European Overnight Tourist Visitors to Belize by Origin Country R 2008P Change vs UK 8,007 9,313 9,444 9,319 9,991 9,989 9,799 10,180 10, Germany 3,757 3,841 3,602 4,145 4,269 3,966 4,308 4,054 4, Netherlands (Holland) 3,555 3,906 3,656 4,211 3,585 3,617 4,071 3,496 3, France 1,921 1,829 2,218 3,114 3,308 3,805 3,167 3,126 3, Italy 2,606 3,093 3,122 3,847 2,850 3,080 3,073 2,702 2, Spain 1,211 1,510 1,377 1,737 1,401 1,386 1,727 1,806 1, Sweden ,053 1,088 1, Switzerland 1, ,019 1, Other 4,809 4,576 4,036 5,352 5,500 5,828 6,413 6,972 6, Total 27,674 29,735 29,115 33,528 32,767 33,466 34,373 34,175 34, Figure 1.6 European Overnight Tourists by Origin

17 Table 1.16 European Overnight Tourist Visitors to Belize by Month Month R 2008P Change vs Jan 2,405 2,661 2,432 2,874 3,327 3,167 3,041 2,818 3, Feb 2,614 2,814 2,536 2,791 2,814 3,439 2,969 3,215 3, Mar 2,471 2,478 2,771 2,462 3,405 3,323 3,292 3,188 3, Apr 2,385 2,335 2,296 2,687 2,645 2,946 2,869 3,052 3, May 1,847 1,684 1,622 2,049 1,868 2,347 2,376 2,108 2, Jun 1,424 1,601 1,690 1,973 1,685 1,950 2,157 2,235 2, Jul 2,704 2,713 2,942 3,363 3,336 2,730 3,213 3,421 3, Aug 3,472 3,982 3,819 4,843 3,773 4,423 4,011 3,691 3, Sep 1,919 1,919 1,646 1,945 1,708 1,770 2,282 2,181 1, Oct 1,590 1,922 1,640 2,186 2,137 2,111 1,683 1,852 1, Nov 2,442 2,591 2,818 3,143 2,937 2,609 3,112 3,372 2, Dec 2,400 3,035 2,903 3,212 3,132 2,652 3,367 3,041 3, TOTAL 27,674 29,735 29,115 33,528 32,767 33,466 34,373 34,175 34, Figure 1.7 European Overnight Visitors by Month

18 Table 1.17 American Overnight Tourist Visitors to Belize by Month Month R 2008P Change vs Jan 8,807 10,032 9,391 11,213 12,942 13,454 13,583 12,960 13, Feb 11,004 11,147 11,104 12,659 15,184 16,004 15,661 15,568 15, Mar 14,783 13,265 14,108 17,025 17,984 19,705 19,690 21,673 19, Apr 10,150 9,927 8,649 11,740 12,126 13,004 15,405 14,614 12, May 8,991 9,457 9,108 11,061 10,994 11,309 12,829 12,905 13, Jun 10,315 10,731 10,479 12,578 12,968 14,317 15,473 15,525 15, Jul 10,252 10,181 9,121 11,793 12,974 13,339 14,231 13,985 13, Aug 7,190 8,068 6,924 9,251 8,632 9,009 9,128 9,527 9, Sep 4,537 3,640 3,404 4,043 4,856 4,520 4,945 4,783 3, Oct 3,046 4,163 4,152 5,387 5,904 6,231 5,669 6,324 5, Nov 6,020 6,595 7,787 8,598 9,202 9,710 10,047 10,001 9, Dec 9,622 9,088 10,376 11,941 13,601 15,375 14,848 14,702 13, TOTAL 104, , , , , , , , , Figure 1.8 American Overnight Visitors by Month

19 Table 1.18 Canadian Overnight Tourist Visitors to Belize by Month Month R 2008P Change vs Jan 982 1,224 1,104 1,230 1,357 1,686 1,917 1,929 2, Feb 1,503 1,429 1,331 1,373 1,813 2,212 2,390 2,654 3, Mar 1,342 1,423 1,308 1,379 1,701 1,886 2,294 2,532 2, Apr ,026 1,090 1,223 1,557 1, May ,039 1, Jun Jul Aug Sep Oct Nov ,075 1,263 1, Dec 1,225 1,099 1,236 1,437 1,620 2,123 2,460 2,294 2, TOTAL 9,205 9,492 9,185 9,831 11,926 13,580 15,553 16,655 17, Figure 1.9 Canadian Overnight Visitors by Month

20 Table 1.19 Latin American Overnight Visitors by Month Month R 2008P Change vs Jan 3,422 3,440 3,564 3,175 3,373 2,663 2,480 2,545 2, Feb 2,438 3,165 3,185 2,718 2,830 2,125 2,206 2,931 2, Mar 3,013 2,829 4,009 2,458 2,671 3,013 2,938 2,482 3, Apr 3,533 3,285 3,734 3,214 3,193 2,489 2,966 2,762 2, May 2,490 2,869 3,186 2,900 2,508 2,401 2,399 2,376 2, Jun 2,615 2,844 2,888 3,135 2,726 2,422 2,215 2,511 2, Jul 2,826 2,984 3,679 3,553 3,185 1,948 2,340 2,583 2, Aug 2,913 2,099 2,612 3,300 2,466 2,568 2,602 2,298 2, Sep 2,594 1,628 2,011 2,557 2,403 2,169 2,597 2,196 1, Oct 2,464 1,721 3,143 2,692 2,647 2,019 2,023 2,185 1, Nov 3,056 1,991 2,919 2,787 2,673 2,271 2,539 2,718 1, Dec 3,122 2,581 3,662 3,121 3,075 2,570 2,628 2,274 2, TOTAL 34,485 31,437 38,592 35,610 33,751 28,658 29,932 29,860 27, Figure 1.10 Latin American Overnight Visitors by Month

21 The Cruise Sector The year 2008 marked the fourth consecutive year that cruise arrivals to Belize have decreased. From the height of cruise tourism in 2004 with a total of 851,436 passengers on board, Belize has seen a decrease of approximately 30% to 597,370 in With more and larger ships being built, Belize must be careful in welcoming cruise passengers more so now than before as outlined in Protecting Belize s Natural Heritage: An Action Plan For Shared Stewardship Of A Cruise Destination. 2 The cruise sector in Belize continues to play an important role in the overall product as it contributes significantly to total tourism expenditure. Table 1.20 Cruise Arrivals by Month P 2007R 2008P % Change January 10,485 4,653 18,448 56,689 94,861 94,774 79,077 95,436 81, February 11,665 7,584 19,056 48,172 87,532 96,667 77,569 86,010 69, March 13,271 8,648 21,822 54,151 89, ,802 94,631 95,379 78, April 6,695 3,517 23,989 46,401 72,260 73,327 62,399 64,079 46, May 4, ,973 24,413 50,642 48,013 27,346 29,970 35, June ,473 33,623 57,160 55,432 35,335 26,956 26, July ,502 30,602 56,794 33,140 29,443 30,478 36, August ,072 38,809 57,018 48,518 33,875 17,368 29, September ,095 31,430 45,132 32,554 21,431 15,252 29, October ,810 47,356 58,961 23,481 32,551 30,820 32, November 3,648 8,548 46,377 70,377 77,579 73,175 74,960 57,551 58, December 6,022 15,166 56,073 93, ,690 98,450 87,314 74,829 74, TOTAL 58,131 48, , , , , , , , Ship Calls Figure 1.11 Cruise Sector Performance Belize , Conservation International, Belize Ministry of Tourism and Oak Foundation
22 Table 1.21 Cruise Arrivals by Quarter Quarter R 2008P % Change 1st Quarter 35,421 20,885 59, , , , , , , nd Quarter 12,344 3,517 64, , , , , , , rd Quarter , , , ,212 84,749 63,098 95, th Quarter 10,366 23, , , , , , , , TOTAL 58,131 48, , , , , , , , Table 1.22 Cruise Arrivals by Major Cruise Line R P 2008P %Change Passengers Carnival 3,614 11, , , , , , , Norwegian 30,572 32, ,170 85, , , , , Royal Caribbean , , , , , , Ship calls Carnival Norwegian Royal Caribbean Cruise calls Cruise calls for the three major lines only. R = Revised
23 Table 1.23 Cruise Passenger Arrivals to Selected Caribbean Destinations Destination % change Antigua & Barbuda 408, , , , , , , , Aruba 487, , , , , , , , Bahamas 2,551,673 2,802,112 2,970,174 3,360,012 3,078,709 3,076,397 2,970,659 2,861, Barbados 527, , , , , , , , Belize 48, , , , , , , , Bermuda 179, , , , , , , , Bonaire 42,181 44,004 53,343 40,077 61,844 97, , British Virgin Islands P 202, , , , , , , , Cayman Islands 1,214,757 1,574,750 1,659,390 1,693,293 1,798,999 1,930,136 1,715,666 1,553, Cozumel (Mexico) 1,595,362 2,227,690 2,862,039 2,519,179 2,322,845 2,488,190 2,569, Curacao 300, , , , , , , , Dominica 207, , , , , , , , Dominican Republic 208, , , , , , , , Grenada P 147, , , , , , , , Jamaica 840, ,419 1,132,596 1,099,773 1,135,843 1,336,994 1,179,504 1,088, Martinique P 202, , , ,416 93,060 95,812 71,683 87, Puerto Rico 1,350,317 1,203,911 1,234,992 1,390,343 1,315,079 1,338,019 1,437,239 1,392, St Kitts & Nevis 10,405 6,314 8,296 14,011 5,009 St Lucia 490, , , , , , , , St Maarten 867,752 1,055,040 1,171,734 1,348,450 1,488,461 1,421,645 1,421,906 1,345, St Vincent & the Grenadines 76,494 70,314 64,965 74,657 69, , ,779 67, Trinidad & Tobago 82,243 60,047 55,532 54,254 67,068 85,677 76,741 44, US Virgin Islands 1,891,389 1,738,710 1,773,948 1,964,689 1,912,539 1,901,275 1,917,878 1,757, P Preliminary n.a. Figures not available SOURCE: Caribbean Tourism Organization Although cruise tourism in Belize has peaked, it is still a major contributor to the economy of Belize and the Caribbean. In its study on behalf of the Florida-Caribbean Cruise Association (FCCA) BREA 1 noted that cruise tourism generated nearly [US] $1.8 billion in direct expenditure, 41,500 jobs and [US] $600 million in employee wages to the Caribbean.

24 Figure 1.12 Cruise Visitor Arrivals

25 Figure 1.13 CTO Tourism Tree Source: CTO Customer Relations Participants Handbook p. 15
26 Economic Impact of Tourism As the diagram above illustrates, tourism s impact extends far beyond airlines (international and local) hotels, tour operators, tour guides, restaurants, nightclubs and souvenir shops. Instead it has a domino effect on the entire economy. In other words tourism has a direct, indirect and induced effect:3 Gross visitor expenditure represents the primary economic stimulus of tourism on the domestic economy. This expenditure produces a first round or direct impact on the economy when it is spent by the visitor to purchase goods and services such as accommodation, meals, transportation and duty-free items. The companies and individuals that provide these goods and services must in turn purchase the necessary inputs in the domestic economy in order to produce the output required by the visitor. Thus the visitor expenditure stimulates a further indirect impact on other sectors of the economy through the purchase of inputs such as electricity, freight transportation, farm produce and manufactured items. Employees of the companies producing these final outputs and inputs would receive wages and salaries and other income that they would spend in the domestic economy that would in turn generate further economic activity. Thus the visitor expenditure has an induced impact on the economy through the expenditure of the wages and salaries. In Belize, tourism impacts agriculture and fisheries in a major way. The construction industry is also affected, as well as the retail sector that supplies the construction industry. Tourism generates government revenues, business revenues as well as salaries for employees. Tourism is a major foreign exchange earner, which is important since Belize produces very few of the items it consumes, from pens to ear-rings, irons to bulbs, computers to motor vehicles. Prior to the world economic crises, the World Travel and Tourism Council ( estimated that in 2008 tourism generated 238,277,000 jobs in travel and tourism and tourism expenditure was an estimated US $5,890 billion (US $5.9 trillion) of economic activity. They further go on to forecast that in the year 2018 employment generated by travel and tourism will be 296,252,000.4 Tourism Expenditure The tourism expenditure calculation is a lengthy process which is derived from key findings of the Visitor Expenditure and Motivation Survey (VEMS) generally found in Section 4 of the Annual Travel and Tourism Statistical Digest. The VEMS is a 12-month survey conducted jointly by the Belize Tourism Board and the Central Bank of Belize. The 2008 VEMS is presently being analyzed and thus is absent from this version of the publication. 3 World Tourism Organization Tourism Satellite Account, Methodological Reference 4 WTTC Tourism Satellite Accounting Research, 2008 Executive Summary
27 Table 1.24 Tourism Expenditure Total Total Source: Belize Tourism Board P = Preliminary Figure 1.14 Tourism Expenditure
28 Below find selective indicators for the SICA region. Table 1.25 Selected Central American Indicators Country Travel Agencies Hotels Occupancy Beds Exchange Rates Belize ,013 Belize Dollar (Bze $2 = US $1 Costa Rica 352 2, N/A Costa Rican Colón (571.0=US$1) El Salvador N/A ,061 US Dollar (US$1=US$1) Guatemala 652 2, ,067 Quetzal (Q7.6=US$1) Honduras ,883 Lempira (L18.96=US$1) Nicaragua N/A 12,494 Córdoba (C$19.8=US$1) Panama ,886 Balboa (B/.1=US$1) Belize, information refers to tour operators, not travel agencies Costa Rica, only agencies registered with the Cost Rican Tourism Institute Source: BOLETÍN DE ESTADÍSTICAS TURÍSTICAS DE CENTROAMÉRICA Secretaría de Integración Turística Centroamericana (SITCA)
29 SECTION 2. HOTEL STATISTICS
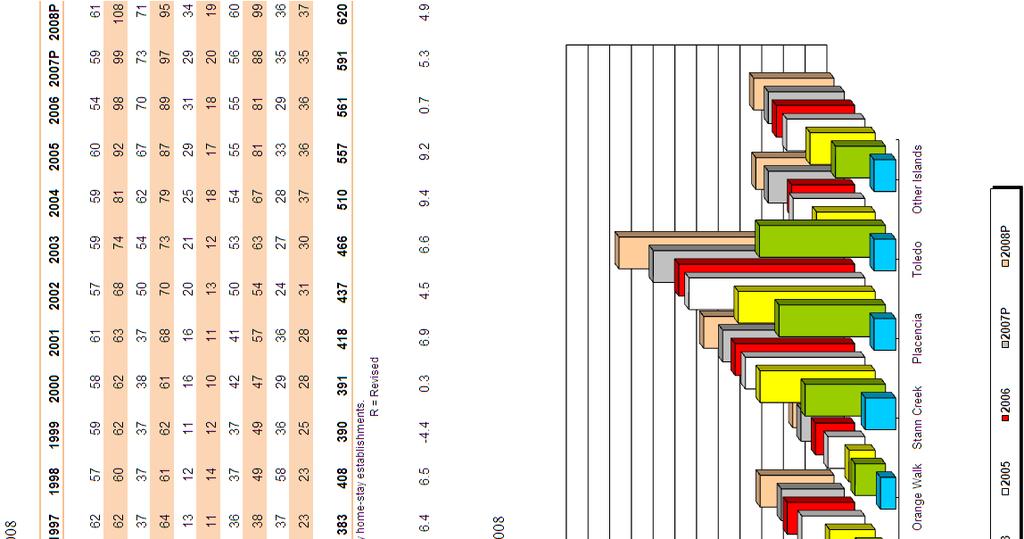
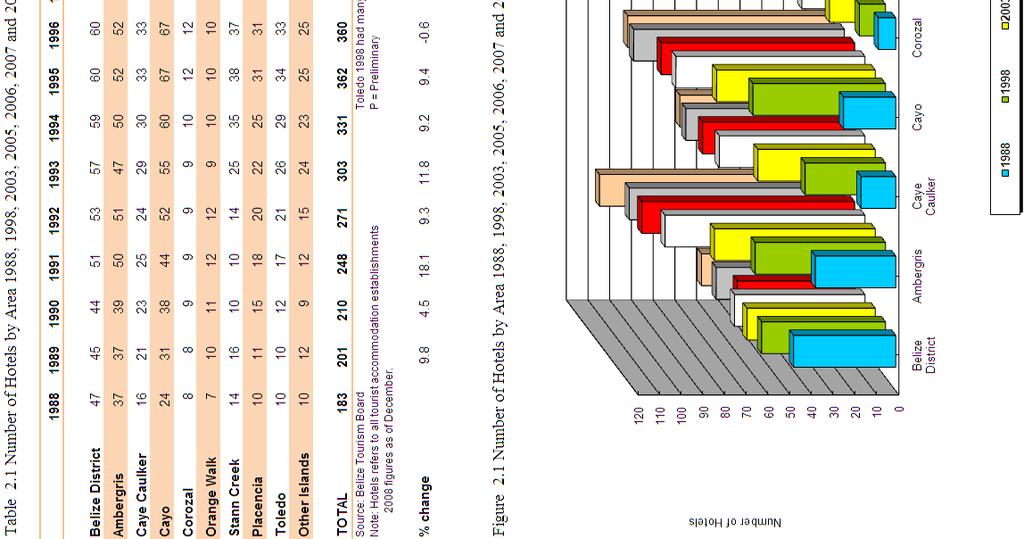
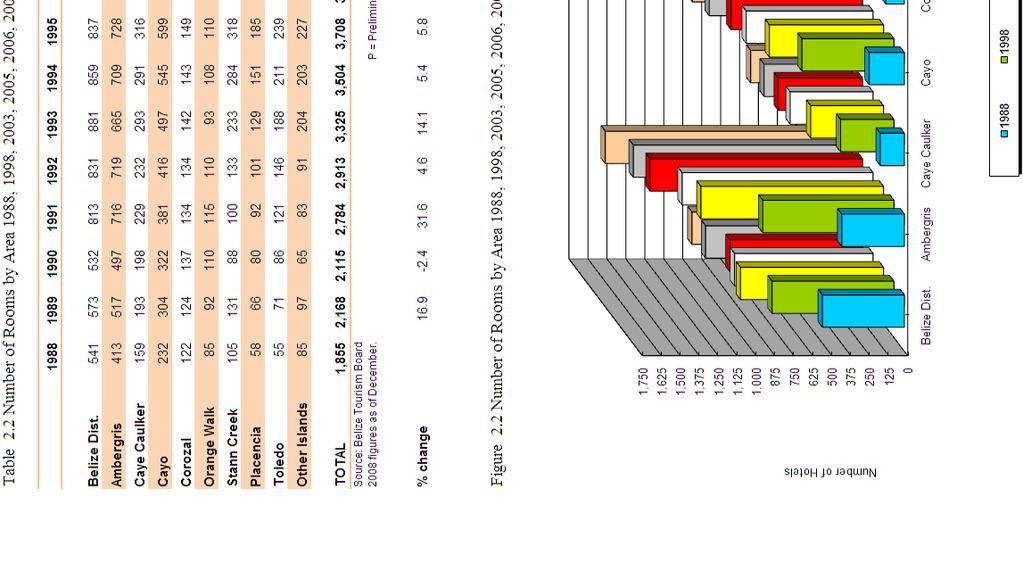
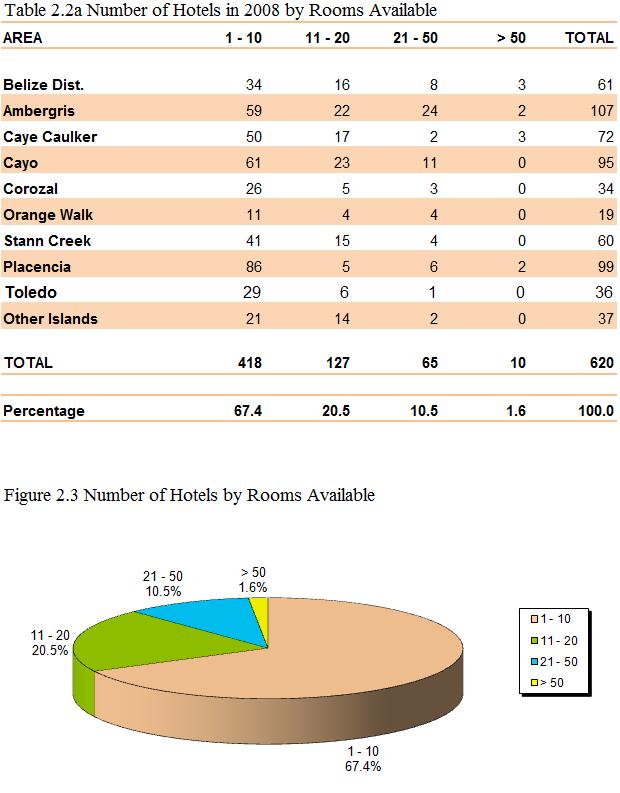
30 Accommodation Statistics Hotels, Rooms, Beds According to the Hotels and Tourist Accommodation Act Revised Edition 2003 which regulates the accommodation sector, a hotel is defined as any building containing not less than 10 bedrooms for the accommodation for reward of guests or any building containing a group of units containing not less than 10 units, and such units may consist of buildings, cottages, cabanas, apartments, or otherwise for the accommodation of guests for reward, situated within the same complex or precincts 5. However for the purpose of this report, all accommodation establishments are referred to as hotels and each must comply with the legislated minimum standards was an impressive year as investors displayed strong confidence in the Belizean tourism product. In five of the nine destinations there were record numbers of hotels as the accommodation sector revealed the highest number of establishments ever. Since 1998, there has been an increase of more than 210 hotels and since 1988, an increase of more than 435 hotels. With 620 hotels, 2008 was the first time Belize reported more than 600 accommodation establishments. With the largest property in the country having 173 rooms available for guest use, Belize can still be regarded as a destination with significant local ownership of the accommodation supply. For the first time ever, there were three destinations with 95 or more hotels. These destinations, Ambergris Caye, Cayo and Placencia represent 49% of hotels while the northern districts of Corozal and Orange Walk account for less than 10%. Ambergris Caye was the first destination to surpass the 100 mark, while Placencia has doubled the number of hotels in just ten years. Corozal has almost tripled in the same time frame. The numbers are even more remarkable looking at the growth in the last 20 years. Since 1988 the total number of hotels has more than tripled from 183 to 620. Again, Placencia has been the area with the most notable growth and tourism has transformed a traditional fishing village into the fastest growing tourism destination. While the economic impact on the village is more obvious, the socio-cultural impact of tourism on traditional fishing villages such as Placencia, Hopkins, Sarteneja, Ambergris Caye and Caye Caulker is yet to be documented. Hotel rooms numbered 6,536 in 2008 which was 336 more rooms, or a 5.4% increase compared to All destinations reported increases in their room stock except the Orange Walk District, which had the same number as it did a year ago. In 20 years, the Placencia Peninsula has increased its number of rooms twelvefold. The Cayo, Stann Creek and Toledo Districts have been able to quadruple their supply of hotel rooms, while Ambergris Caye and Caye Caulker have more than tripled theirs. 20 years ago, the Belize District and Ambergris Caye were the only destinations with more than 400 rooms. Today, Corozal, Orange Walk and Toledo have still not yet reached that amount of rooms. 5 Hotels and Tourist Accommodation Act, Chapter 285, pp. 6-7
31
32
33
34

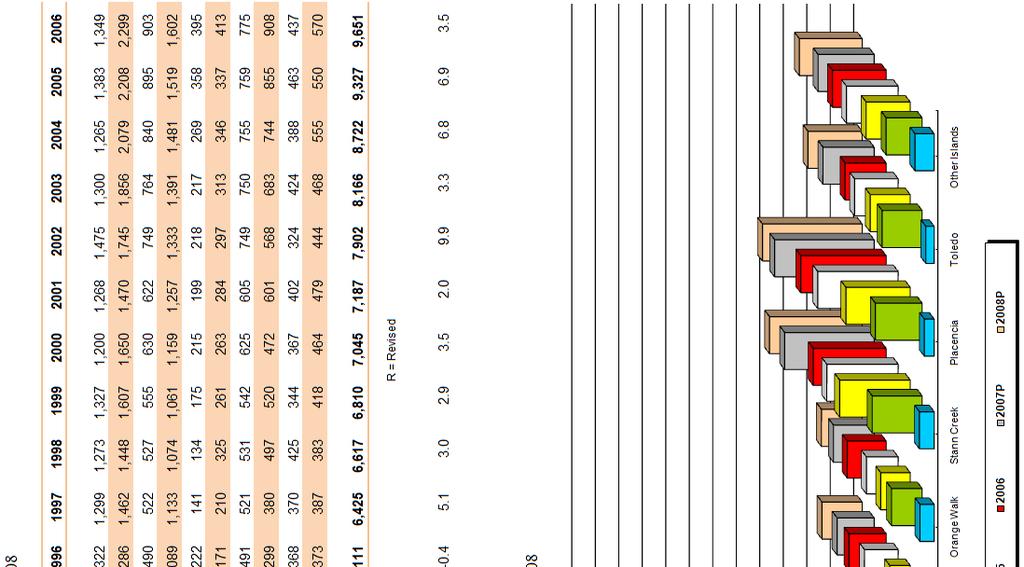
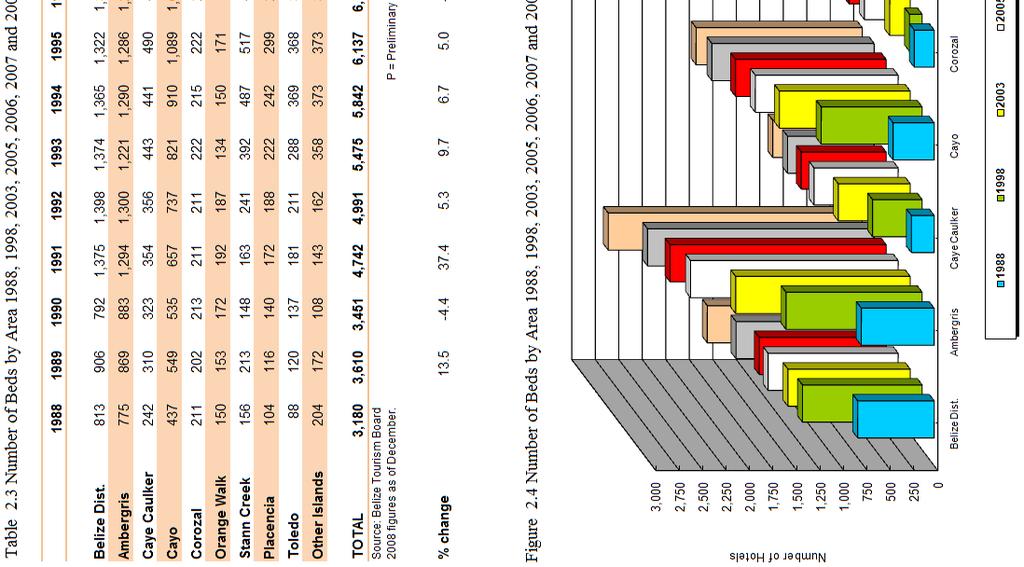
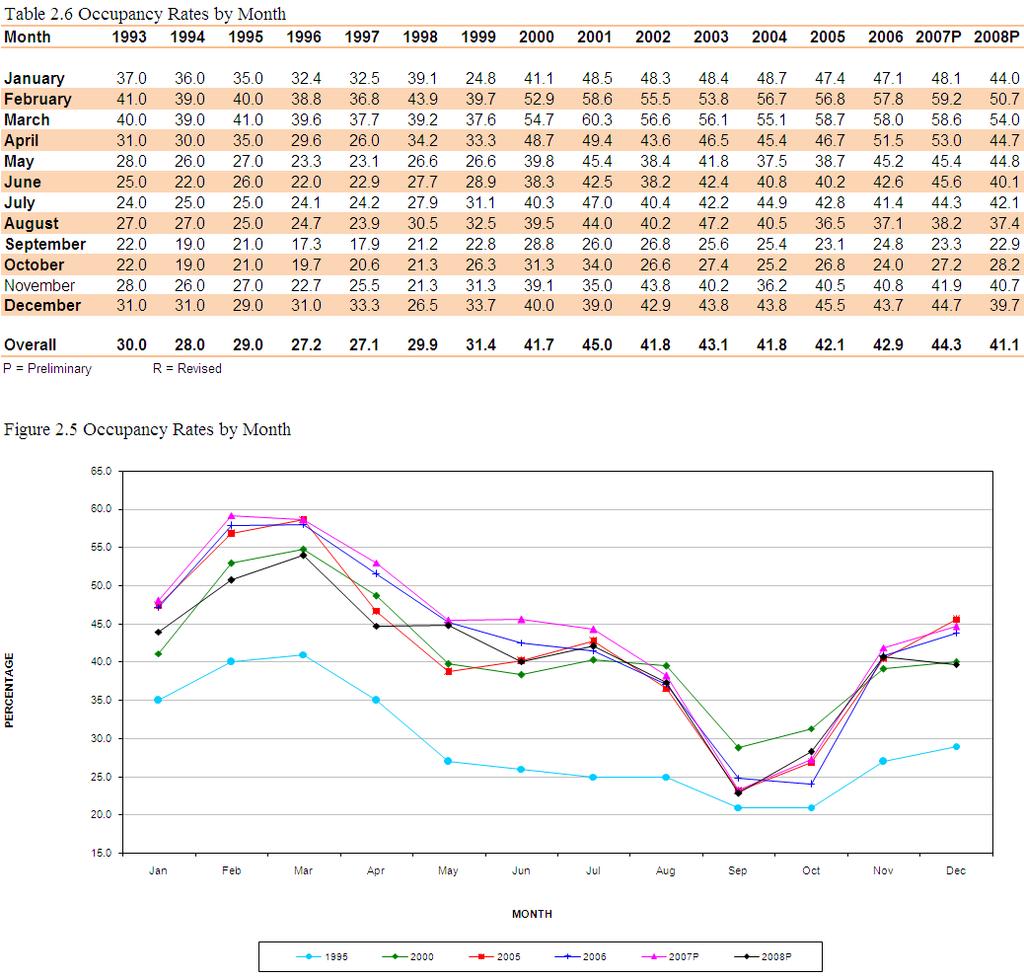
35 There were a total of 11,213 hotel beds in 2008, up by 6.8% or 711 beds from the year before. In Orange Walk and Placencia the number of beds remained relatively the same, whereas in the Belize District and Ambergris Caye there were increases of at least 175 beds each. Since 1998 there has been an increase of approximately 4,600 beds and an increase of 8,000 beds since In other words, since 1988 the number of beds in the accommodation sector has more than tripled. WTO Tourism Barometer The World Tourism Organization in its January 2009 Barometer quoted a Deloitte & Touche LLP analysis using STR Global and Smith Travel Research data: 2008 was a difficult time for economies throughout the world and it would seem that the outlook for the year ahead will remain challenging for everyone. Inevitably, the travel and tourism industry was likely to suffer and many destinations saw decline in visitors during 2008, particularly in the latter part of the year as both individuals and corporations slashed travel budgets. As a result, analysis by Deloitte, the business advisory firm reports that although hotel performance across the globe saw deceleration in growth compared to 2007, all but one world region continued to report positive growth year-to-november 2008 Looking ahead, 2009 will be a challenging time for hoteliers around the world as global economies struggle through the recession. As global unemployment rises and consumers and corporations continue to reign in their travel budgets, hotels generally will sell fewer room nights at lower prices. We would expect all regions to be reporting negative numbers this time next year. 6 Table 2.4 Hotel Performance by Region7 Room Occupancy Room occupancy reflects the total rooms occupied as a percentage of the total rooms available for guest use. This includes rooms sold as well as complimentary rooms in use for accommodation purposes. 6 UNWTO World Tourism Barometer Vol. 7 No. 1 January The UNWTO s full contact information can be found later in this publication. 7 Ibid. p. 41
36
37
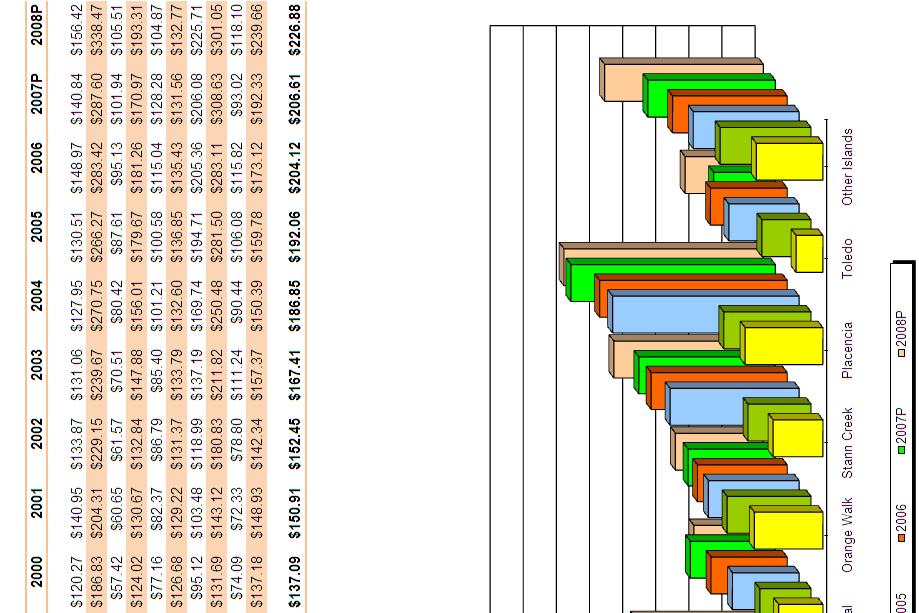
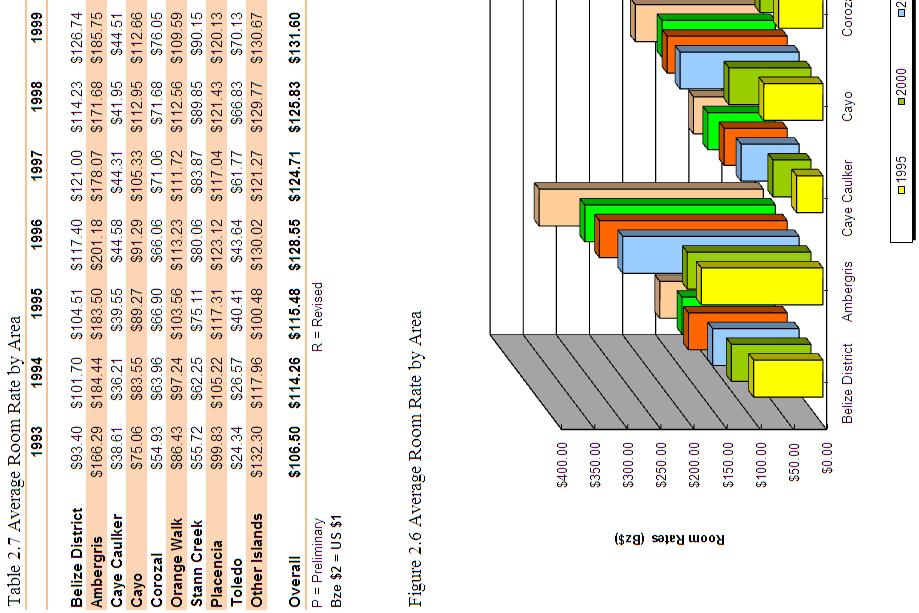
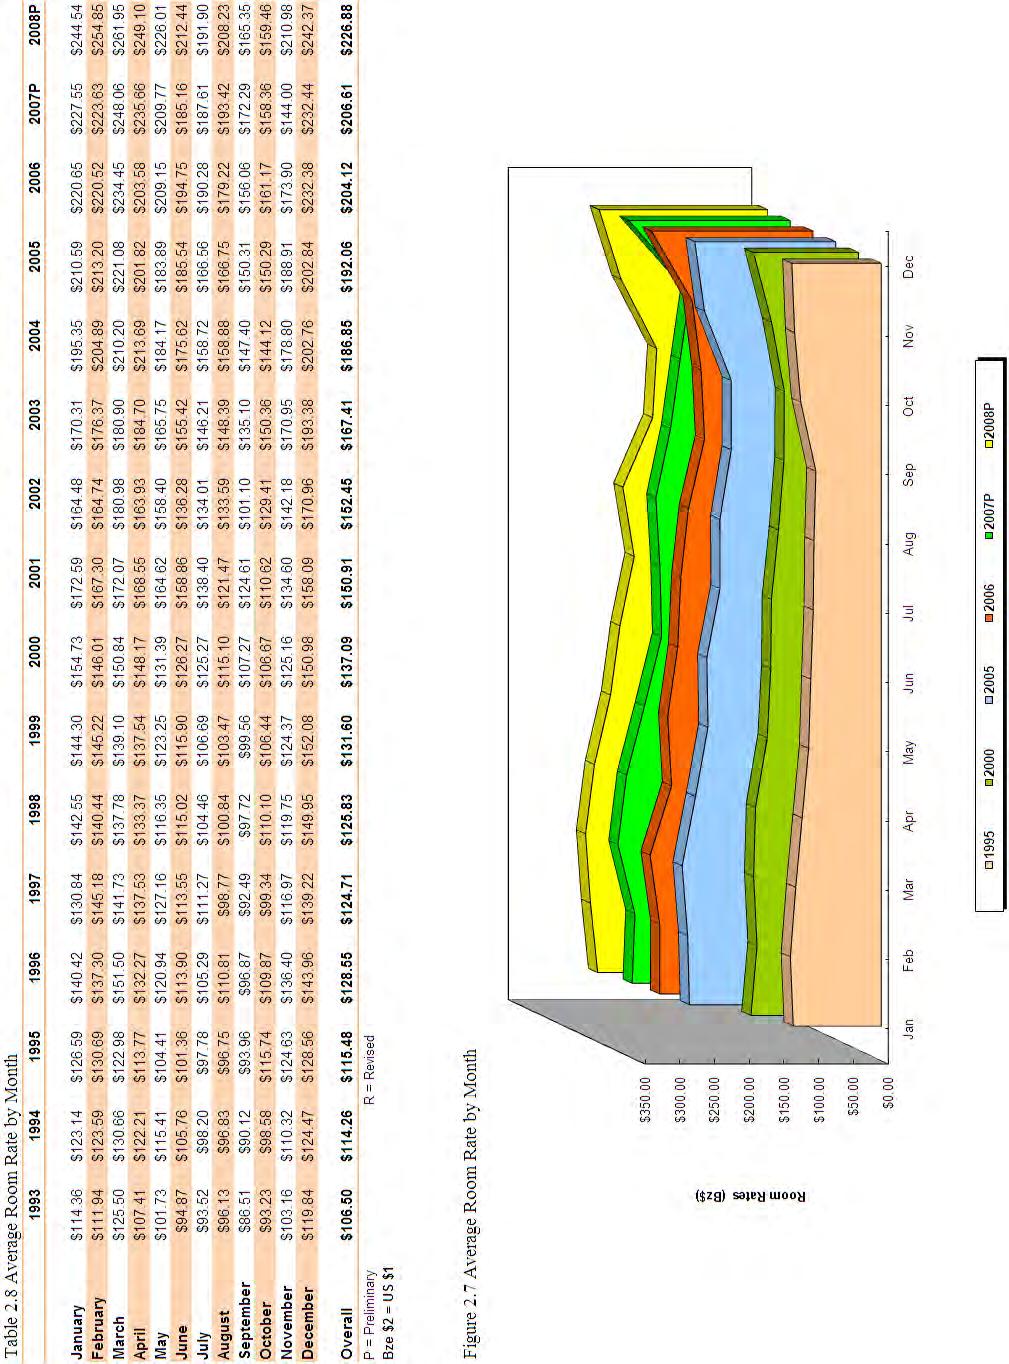
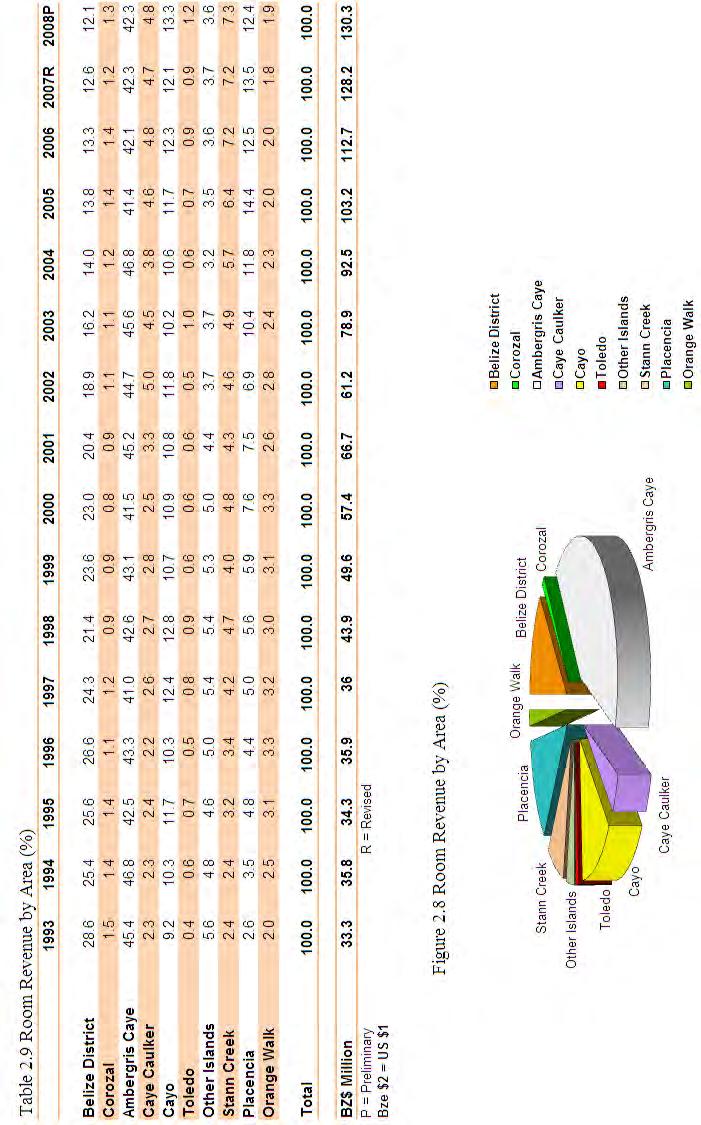
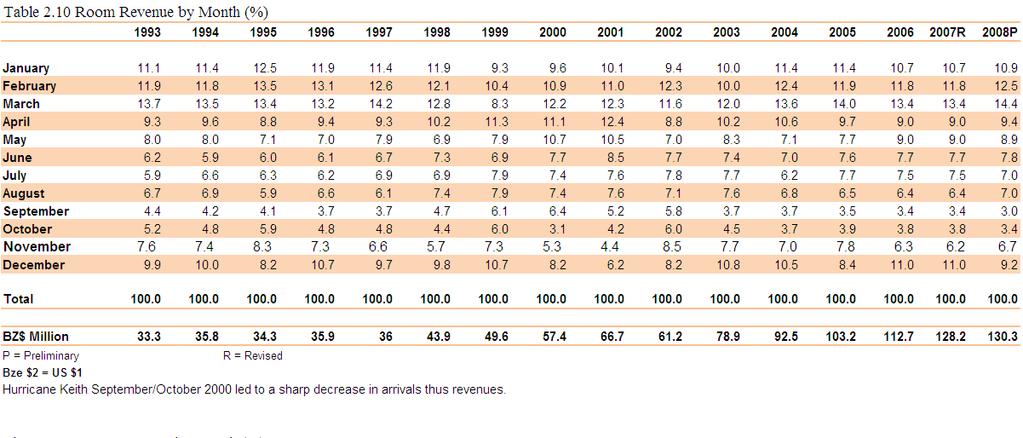
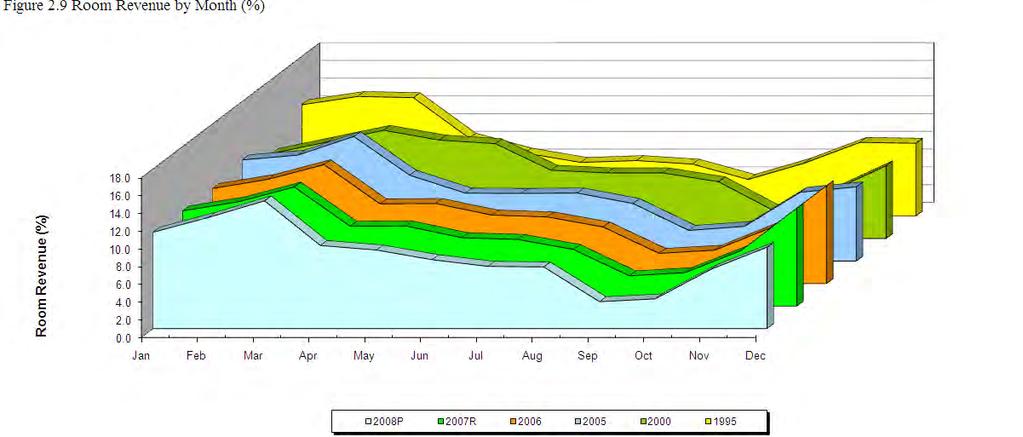
38 In 2008 the national occupancy rate was 41.1%, with the accommodation sector in Belize facing as difficult a scenario as the global picture. Corozal was the only destination that showed positive growth, while the other destinations experienced the same occupancy levels as last year (which was not bad given the economic climate) or experienced decreases. Although October is not a good yardstick, it was the only month that showed an increase when compared to the 2007 figures. Room Rates For the purpose of this publication, these rates are quoted in Belize Dollars (Bze $2 = US $1). The average room rate increased by $20.27 or by 9.8% from 2007 to With most destinations having increased room rates, even with the decrease in the occupancy levels, it was still possible to report an overall increase in the revenues generated by the hotel sector. Ambergris Caye and Placencia were the only destinations with nightly room rates greater than Bze $300 (US $150) and well above the national average. Corozal and Caye Caulker were just above Bze $100 (US $50) per room per night and less than half the national average. Room Revenue The Belize Tourism Board generates its revenues from the hotel tax collected from the sale of hotel room nights. Effective April 1, 2005 the hotel tax rate went from 7% to 9%. The hotel tax collections in 2008 revealed that the accommodation sector generated some Bze $130.3 million in revenues. This increase of Bze $2.1 million over 2007 reflected a 1.7% growth. As expected, Ambergris Caye generated the bulk of hotel room revenue with 42.3%. The Cayo District was next with 13.3%. These were followed by Placencia and the Belize district with 12.4% and 12.1% respectively.
39
40
41
42

43 Hotel Employment According to figures provided by the Social Security Board, Cayo, Placencia and Toledo showed increases in employment. Overall however, employment in the hotel sector was down by 1.7%. This was the first decrease in the hotels sector since a 1.0% decrease in In 2008 a total of 6,471 persons were employed in hotels, down from 6,580 in Figure 2.10 Hotel Employment by Area It seems that the trend is now irreversible as 2008 marked the eight consecutive year that there have been more males than females working in the hotel industry, and the gap appears to be widening significantly. In 2008 there were 59.9% and 40.1% males and females respectively compared to 1991 where there were 41.3% and 58.7% males and females respectively employed in this sector. Belizeans accounted for 81.7% of employees in this sector compared to 18.3% foreigners. One of the areas where there is a great opportunity for Belizeans is for chefs in the accommodation sector. There is a serious shortage of Belizean chefs whereby work permits have to be granted to foreigners to fill this gap. To highlight this need, every year the Belize Tourism Board provides culinary training as well as hosts the Taste of Belize Culinary Competition to encourage Belizeans to get involved Social Security Board. Table 2.11, Table 2.12 and Table 2.13, including text and data compilations, is the exclusive property of the Social Security Board, and is protected by Belize and international copyright laws. All content and all information herein have been produced by the Social Security Board for nonprofit, research, and educational use only. This document is not intended for direct or indirect commercial use. No part may be reproduced in any form, displayed in any form, or reused for any purpose or by any means without prior written authorization of the Social Security Board. A fee may accompany such written authorization. Written authorization to reproduce, display, or reuse the content and information herein shall be provided on the condition that the content and information shall not be modified in any way, and that a copyright notice accompany all copies or reproduction. The Belize Tourism Board has received the expressed authorization to produce this information in this digest, which serves as an information piece for the tourism industry and the public at large.

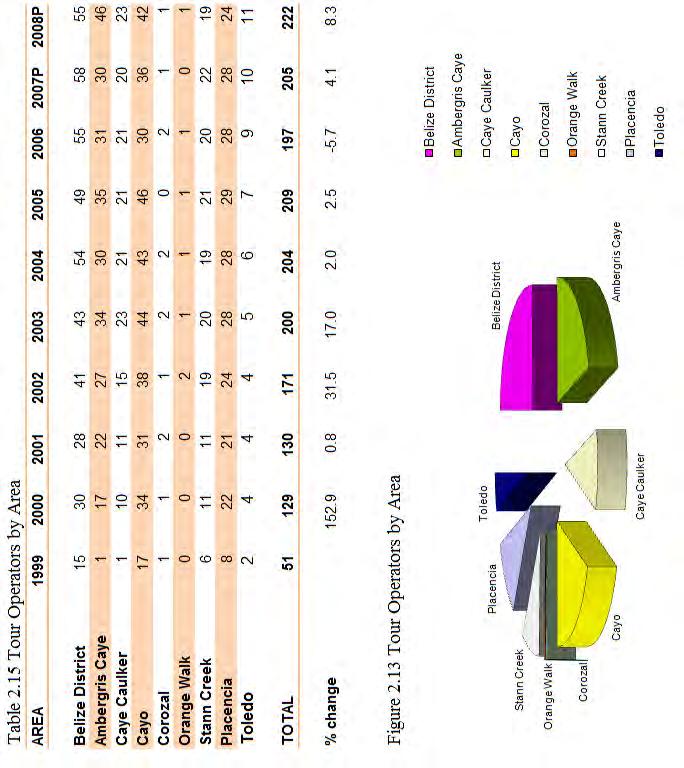
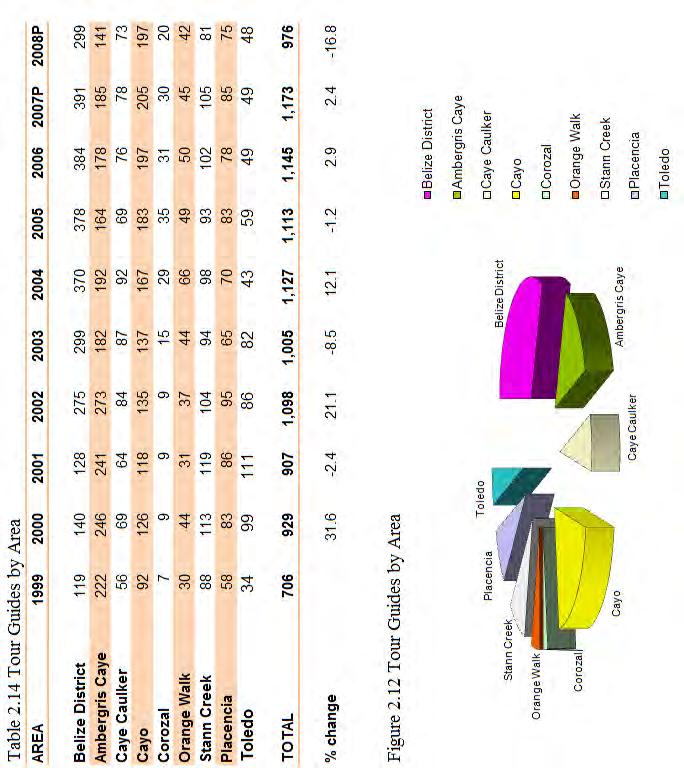
44 Employment in the Travel Trade A large number of tour guides did not renew their licenses in 2008, resulting in a 16.8% decrease in the number of tour guides countrywide from 2007 to This was most obvious in the Belize District, Ambergris Caye and the Stann Creek District where there were 92, 44 and 24 less guides respectively. In contrast, there were 17 more tour operators in 2008 than there were in 2007, reflecting an 8.3% increase. (By law, tour operators are required to hire only licensed tour guides.) Belize District had the most tour operators, followed by Ambergris Caye and the Cayo District. Ambergris Caye had the largest increase in the number of tour operators, from 30 in 2007 to 46 in 2008.
45
870 727 9882 + 44")

46 According to the WTTC s 2008 analysis, Belize s tourism horizon looks very promising. 1-2 Queen Victoria Terrace Sovereign Court London E1 W 3HA United Kingdom Tel: + 44 (0) (0) Fax: + 44 (0) (0) enquiries@wttc.travel UNWTO World Tourism Organization Capitan Haya Madrid, Spain Tel: Fax: omt@unwto.org
47 SECTION 3. VISITATION STATISTICS TO SELECTED ATTRACTIONS

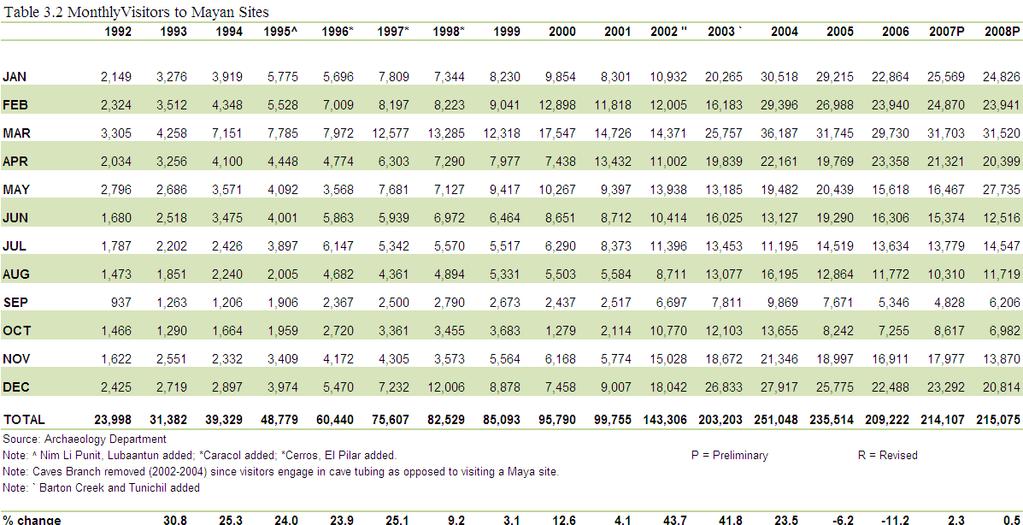
48 Site Visitation Statistics Belize is well known for its sites and attractions. These come in the form of the natural and built environments, both marine and terrestrial. This section reports on visits to selected sites by international visitors and Belizeans. Cruise ship visitors still account for a significant portion of visitors to many of these sites, and with the significant decrease of cruise passenger arrivals, it was likely that the visitation to sites and attractions would fall. Archaeological Sites The Institute of Archaeology ( reported an increase in visitors to the Mayan sites in This was the second consecutive year an increase was reported after two straight years of decrease had interrupted several years of increases in the number of visitors to these sites. The graph below shows the share by site visited. Altun Ha was by far the most visited destination with an 8.4% increase in 2008 compared to Looking at the 10-year time period, there has been an increase in visitation to Altun Ha of more than 350% since Figure 3.1 Site Share of Visitors to Maya Sites Xunantunich in western Belize, was the second most visited Maya site in 2008 and with approximately 48,000 visitors, saw an 8.0% decrease. Lamanai on the other hand, hosted approximately 32,000 visitors and experienced an 8.9% increase. Overall, there was a marginal increase of 0.5% in the number of visitors. Again, comparing the 1998 figure of 82,529 visitors to the 215,075 in 2008, it can be seen that there has been a 160.6% increase. Cruise passengers accounted for 79,360 of the 215,075 visitors to these sites. This 37% by cruise visitors were to four sites only, namely 7,205 to Lamanai in the Orange Walk District, 60,932 to Altun Ha in the Belize District, plus 1,676 to Cahal Pech and 9,547 to Xunantunich both in the Cayo District. Altun Ha is most convenient to cruise passengers as it is 6 miles off the Northern Highway at Sandhill Village, for a total of approximately 25 miles which can be covered in about fifty minutes.


49 Overnight tourists accounted for the largest share of visitors to archaeological sites, followed by cruise visitors. Other visitors combined represented less than 20% of total visitors in Figure 3.2 Visitors to Maya Sites by Type of Visitor
50

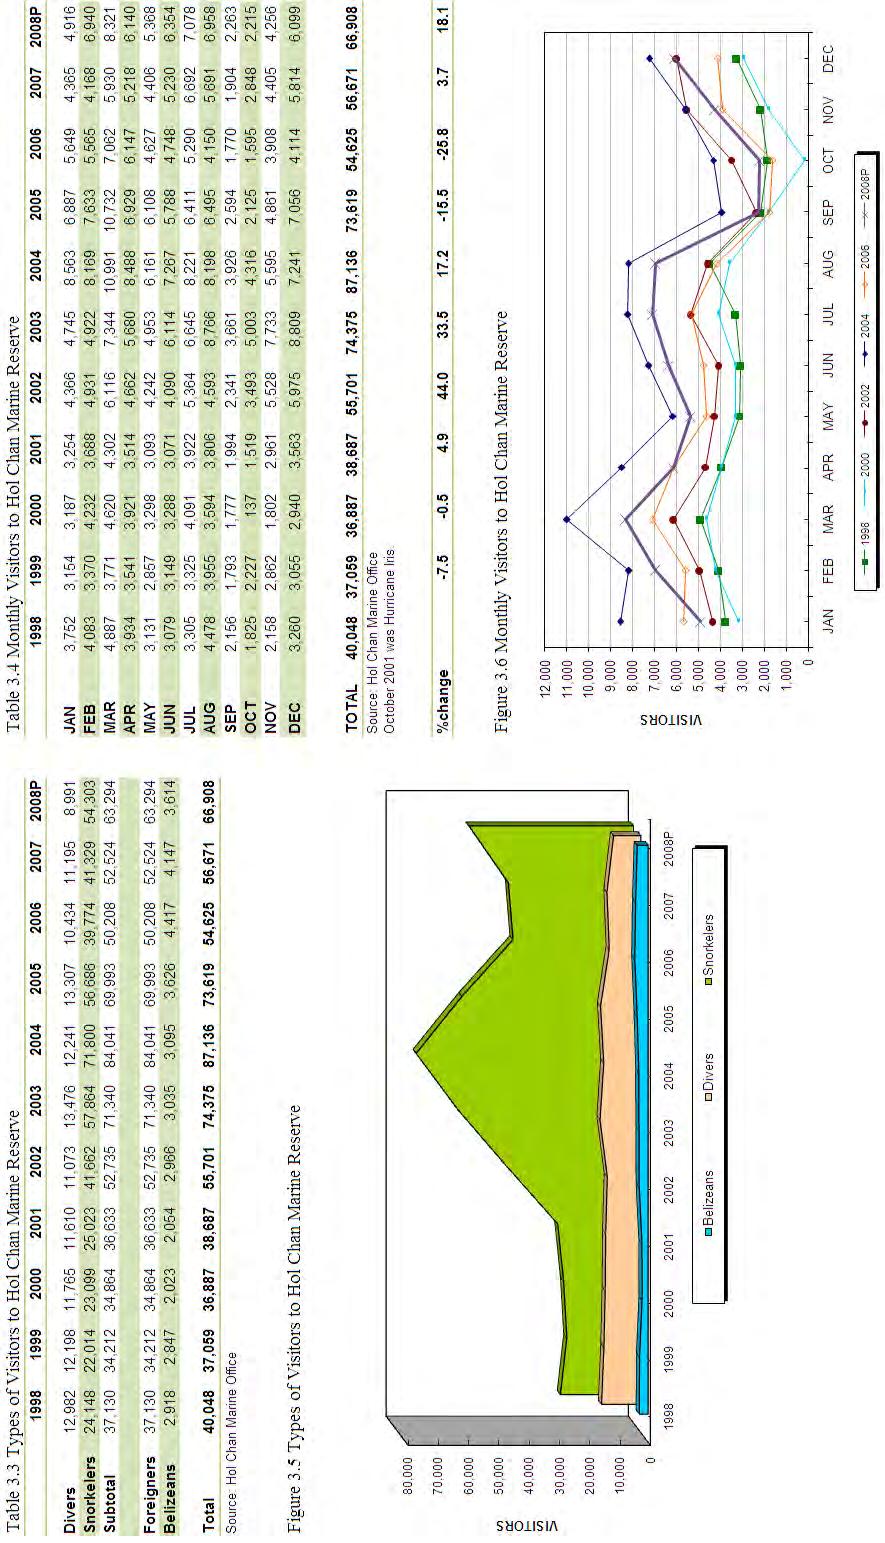
51 Hol Chan Marine Reserve Visitors to the Hol Chan Marine Reserve - HCMR ( for the years are documented in this publication. According to their website, Over 160 species of fish have been identified in the reserve, along with nearly 40 species of corals, 5 sponges, 8 algaes, 2 sea grasses, 3 marine mammals and 3 species of sea turtle. The entire reserve covers approximately three square miles (7.8 sq km) and is divided into four zones: Zone A - The Reef Zone B - The Sea grass Beds Zone C - The Mangroves Zone D - Shark Ray Alley Total visitors to the Hol Chan Marine Reserve were up for the second year in a row. The increase of 18.5% or roughly 10,000 persons was completely due to visitors from abroad, while Belizean visitors decreased by 12.9% or approximately 500 persons. Foreigners accounted for the divers (13.4%) and snorkelers (81.2%) visiting the HCMR, and represented 94.6% of visitors. Belizeans accounted for the remaining 5.4%.
52
 has been unavailable.")
53 The Belize Zoo Recent information on visitors to the Belize Zoo ( has been unavailable.
 manages nine protected areas including: Actun Tunichil Muknal (co-managed with the Institute of Archaeology) Blue Hole National Monument Cockscomb Basin Wildlife Sanctuary * Crooked Tree")
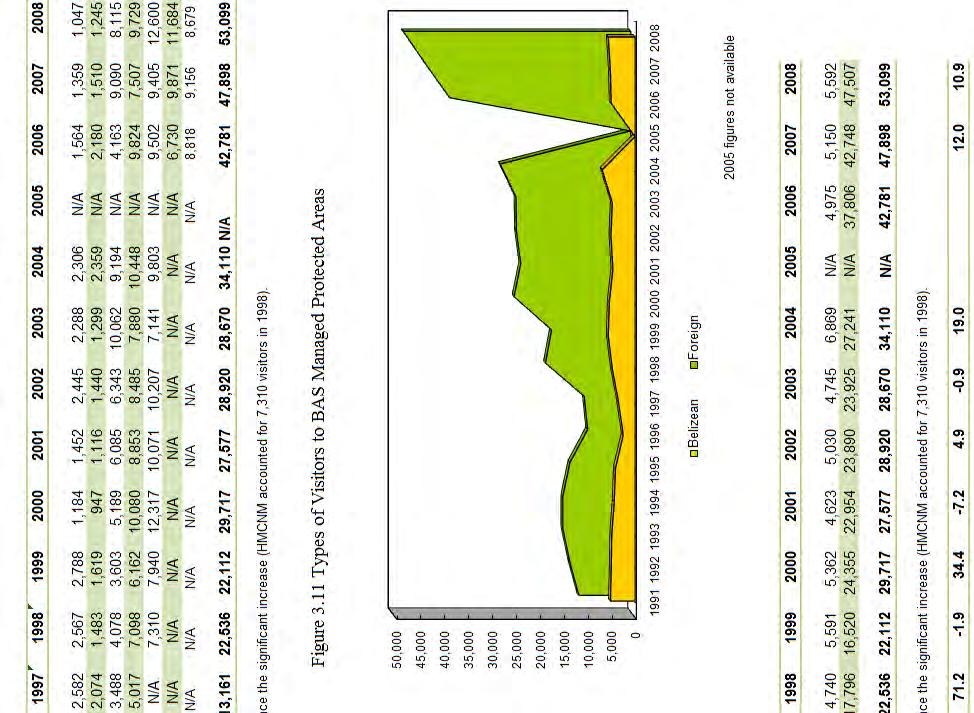
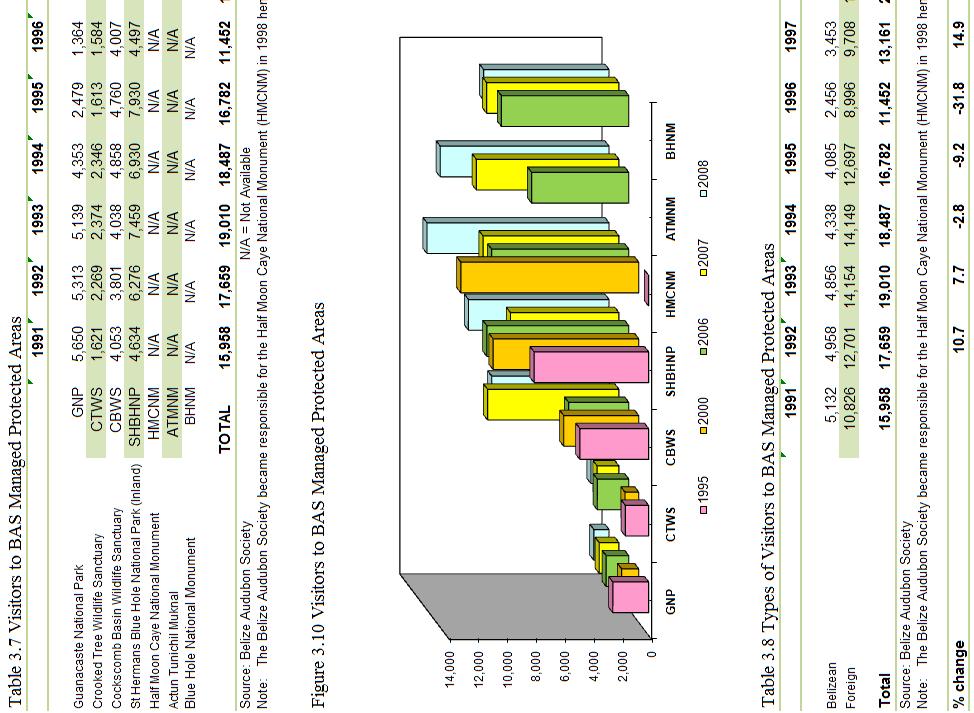
54 Protected Areas Managed by the Belize Audubon Society The Belize Audubon Society (BAS) ( manages nine protected areas including: Actun Tunichil Muknal (co-managed with the Institute of Archaeology) Blue Hole National Monument Cockscomb Basin Wildlife Sanctuary * Crooked Tree Wildlife Sanctuary * Guanacaste National Park * Half Moon Caye Natural Monument St. Herman's Blue Hole National Park * Tapir Mountain Nature Reserve Victoria Peak National Monument Figure 3.9 Visitors to B.A.S. Managed Sites in 1991 and 2008 The BAS reports annually the visitation to selected sites as shown in the tables that follow. Overall there was an increase of 10.9% in the total number of visitors to the sites reported by BAS. This was due mainly to the increase reported by the three parks, the Half Moon Caye Natural Monument (an island destination), St. Herman s Blue Hole National Park (inland sinkhole) and Actun Tunichil Muknal (cave site).
55
56

57 The Mountain Pine Ridge Forest Reserve This reserve ( has seen inconsistent numbers of visitors for several years. From 2001 onward the numbers reported by the Forestry Department also included workers of the Chalilo Dam. At the time of this publication, the figures for 2008 were not available.
, 2006 was the second consecutive year it saw more than a 20% decrease in visitors.")
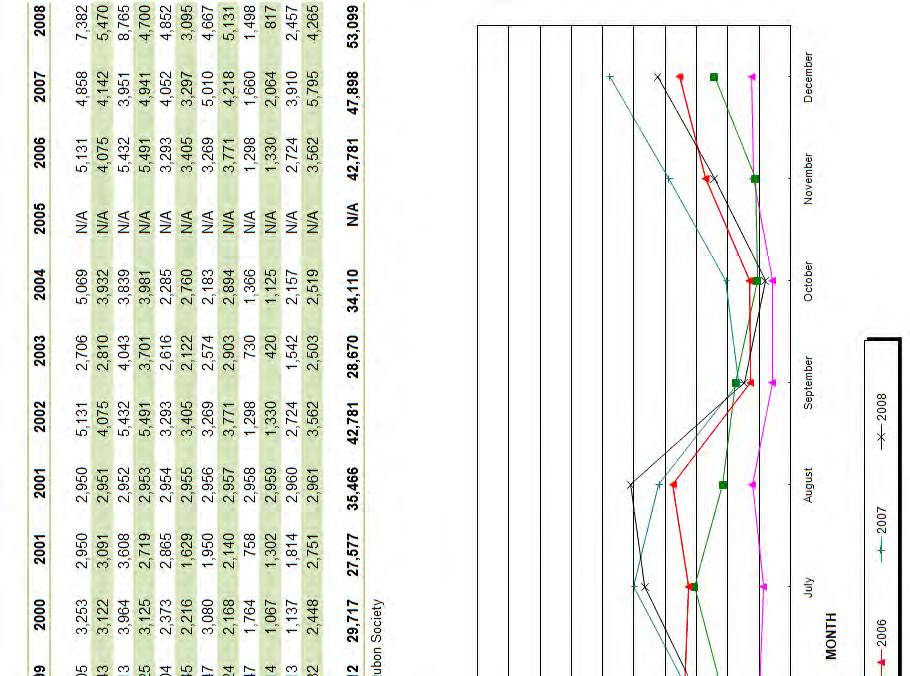
58 The Community Baboon Sanctuary After three consecutive years of increases in the number of visitors to the Community Baboon Sanctuary ( was the second consecutive year it saw more than a 20% decrease in visitors. Like other sites, the growth and decreases can be directly linked with the increases and subsequent decreases in cruise visitors to Belize. At the time of this publication, the figures for 2007 and 2008 were not available.

59 Caves Branch Caves Branch ( is a recent attraction and caters primarily to cruise visitors. At this location visitors can experience the thrill of an inner tube ride down the river through a series of caves. Table 3.13 Visitors to Caves Branch Year TOTAL 19,278 65,993 94, ,359 97, ,967 94,627 The Museum of Belize The Museum of Belize ( 2.html) was opened on February 12, Since then, it has been a popular stop for visitors and locals. The majority of locals are students. Table 3.14 Visitors to the Museum of Belize Year TOTAL 14,013 13,750 16,736 21,695 23,718 11,094 11,532
CARIBBEAN TOURISM ORGANIZATION LATEST STATISTICS 2008
 CARIBBEAN TOURISM ORGANIZATION LATEST STATISTICS 2008 December 9, 2008 Table 1: Tourist (Stop-over) Arrivals in 2008 Period Tourist Arrivals % Change Overall Winter# Summer# Anguilla Jan-Aug 53,077-10.8-13.9-7.0
CARIBBEAN TOURISM ORGANIZATION LATEST STATISTICS December 4, 2014
 CARIBBEAN TOURISM ORGANIZATION LATEST STATISTICS 2014 December 4, 2014 FINAL Destination Table 1: Tourist (Stop-over) Arrivals in 2014 Period Tourist Arrivals % Change Overall Winter# Summer# Anguilla
Published by the Caribbean Tourism Organization (CTO), All rights reserved.
, All rights reserved.") Copyright 2016, Caribbean Tourism Organization (CTO) Published by the Caribbean Tourism Organization (CTO), 2016. All rights reserved. The designations employed and the presentation of material in this
Copyright 2016, Caribbean Tourism Organization (CTO) Published by the Caribbean Tourism Organization (CTO), 2016. All rights reserved. The designations employed and the presentation of material in this
For authorization of the reproduction of CTO works, please contact the CTO at the address and above.
 Copyright 2018, Caribbean Tourism Organization (CTO) Published by the Caribbean Tourism Organization (CTO), 2018. All rights reserved. The designations employed and the presentation of material in this
CARIBBEAN TOURISM STATISTICAL REPORT Edition
 CARIBBEAN TOURISM STATISTICAL REPORT 2016 Edition CARIBBEAN TOURISM ORGANIZATION Seventh Floor, Baobab Tower Warrens, St Michael, BB22026 Barbados Tel.: (246) 427-5242 Website: www.onecaribbean.org E-mail:
CARIBBEAN TRENDS IN THE HOTEL INDUSTRY TWELFTH EDITION SAMPLE
 CARIBBEAN TRENDS IN THE HOTEL INDUSTRY TWELFTH EDITION - 2017 Maps Table of Contents Map of the Caribbean Region 5 One Step Back 6 Caribbean Hospitality Industry Updates Airbnb in the Caribbean 8 How Currency
ANGUILLA TOURISM HIGHLIGHTS FOR 2006 VISITOR ARRIVALS 72, % 60.1% Same Day Visitors 94,283. Tourist Arrivals I ( Winter ( Summer
 ANGUILLA TOURISM HIGHLIGHTS FOR 2006 VISITOR ARRIVALS Tourist Arrivals I ( Winter ( Summer 72,962 39.9% 60.1% Same Day Visitors 94,283 VISITOR PROFILE Average Length of Stay (nights) I 8.0 Tourist Arrivals
Caribbean Tourism Review
 Thousands PERCENTAGE Caribbean Tourism Review 1. Global Performance Worldwide international arrivals in the first eight months reached 781 million, 36 million more than in the same period of 2013 according
For authorization of the reproduction of CTO works, please contact the CTO at the address and above.
 Copyright 2018, Caribbean Tourism Organization (CTO) Published by the Caribbean Tourism Organization (CTO), 2018. All rights reserved. The designations employed and the presentation of material in this
Global Arrival Levels
 INTRODUCTION Current status - globally and regionally State of the major economies Individual market performance and prospects Cruise Activity in the Caribbean Hotel Performance Airline Capacity Prognosis
For authorization of the reproduction of CTO works, please contact the CTO at the address and above.
 Copyright 2018, Caribbean Tourism Organization (CTO) Published by the Caribbean Tourism Organization (CTO), 2018. All rights reserved. The designations employed and the presentation of material in this
TRAVEL & TOURISM S ECONOMIC IMPACT
 TRAVEL & TOURISM S 2011 ECONOMIC IMPACT The World Travel & Tourism Council (WTTC), which is the business leaders forum for Travel & Tourism, has spent more than 20 years developing its economic impact
DEVELOPMENT AID AT A GLANCE
 DEVELOPMENT AID AT A GLANCE STATISTICS BY REGION 3. AMERICA 2018 edition All the data in this report are available at: http://www.oecd.org/dac/financing-sustainable-development/ 3.1. ODA TO AMERICA - SUMMARY
Caribbean Tourism Organization
 Caribbean Tourism Organization 2017 year-to-date (Jan-Oct.) & Forward looking for next 6 months --- A focus on Travel Agencies Air reservation WTM - November 2017 SERVING MARKETS COVERED Retailers Financials
Countries of the World
 As of September 2017 Countries of the World Website: Countries of the World. com https://www.countries-ofthe-world.com/countries-of-north-america.html Website: CIA.gov https://www.cia.gov/index.html Tales
CTO State of the Industry Report Dissecting the Numbers Presented By Ryan Skeete, Director of Research & IT (ag) February 16 th, 2016
 February 16 th, 2016") CTO State of the Industry Report 2015 - Dissecting the Numbers Presented By Ryan Skeete, Director of Research & IT (ag) February 16 th, 2016 Overview: I am going to discuss the Caribbean tourism performance
CTO State of the Industry Report 2015 - Dissecting the Numbers Presented By Ryan Skeete, Director of Research & IT (ag) February 16 th, 2016 Overview: I am going to discuss the Caribbean tourism performance
BREA. PO Box 955 Exton, PA ECONOMIC CONTRIBUTION OF CRUISE TOURISM TO THE DESTINATION ECONOMIES
 BREA BREA PO Box 955 Exton, PA 19341 Phone: (610) 524-5973 Fax: (610) 363-9273 Website: www.breanet.com Business Research & Economic Advisors ECONOMIC CONTRIBUTION OF CRUISE TOURISM TO THE DESTINATION
TOURISM PERFORMANCE 2017
 3 RD QUARTER TOURISM PERFORMANCE TOTAL STAYOVER ARRIVALS 91,732 TOTAL CRUISE ARRIVALS 99,919 TOTAL VISITOR NIGHTS AVERAGE HOTEL OCCUPANCY 862,376 76.3% ECONOMIC IMPACT $124.7 million HOW WAS OUR THIRD
TOURISM PERFORMANCE 2017
 4 th QUARTER TOURISM PERFORMANCE 2017 TOTAL STAYOVER ARRIVALS 105,658 TOTAL CRUISE ARRIVALS 224,212 TOTAL VISITOR NIGHTS AVERAGE HOTEL OCCUPANCY 935,402 71.7% ECONOMIC IMPACT $142.6 million HOW WAS OUR
DEVELOPMENT AID AT A GLANCE
 DEVELOPMENT AID AT A GLANCE STATISTICS BY REGION 3. AMERICA 26 edition 3.. ODA TO AMERICA - SUMMARY 3... Top ODA receipts by recipient USD million, net disbursements in 24 3..3. Trends in ODA Colombia
World Tourism Organization Leading organization in the field of tourism today. Global forum for tourism policy issues and a practical source of
 World Tourism Organization Leading organization in the field of tourism today. Global forum for tourism policy issues and a practical source of tourism know how Members are 139 countries and 350 affiliate
GUYANA TOURISM STATISTICAL DIGEST 2015
 GUYANA TOURISM STATISTICAL DIGEST 2015 GUYANA TOURISM STATISTICAL DIGEST 2015 EDITION National Exhibition Centre Sophia, Greater Georgetown 413741 Guyana, South America. Tel: (592) 219-0094-6 E-mail: info@guyana-tourism.com
TABLE 1 VISITOR ARRIVALS. Total Visitor Arrivals +/ Month / / /18
 TABLE 1 VISITOR ARRIVALS Stopover Arrivals +/ Cruise Passengers +/ Total Visitor Arrivals +/ Month 2018 2019 2019/18 2018 2019 2019/18 2018 2019 2019/18 January 194,609 216,509 11.3% 249,635 249,239 0.2%
For authorization of the reproduction of CTO works, please contact the CTO at the address and above.
 Copyright 2018, Caribbean Tourism Organization (CTO) Published by the Caribbean Tourism Organization (CTO), 2018. All rights reserved. The designations employed and the presentation of material in this
Appendix A. PHYSICAL, SOCIAL, AND ECONOMIC STATISTICS
 Appendix A. PHYSICAL, SOCIAL, AND ECONOMIC STATISTICS FOR THE CARIBBEAN REGION TABLE A1. CORAL REEF AREA IN THE WIDER CARIBBEAN Estimates of Coral Reef Area Reefs at Risk in the World Atlas of Coral Reefs
ST. EUSTATIUS. Sea Arrivals II ( Summer ( Winter Yacht Arrivals I 12, % 32.5%
 ST. EUSTATIUS Visitor Arrival Summary Tourist Arrivals (excluding Antilleans) to St. Eustatius increased by 2.5 percent to reach a total of 12.0 thousand in 2009. Holland continues to be the most important
ST. EUSTATIUS. Sea Arrivals ( Summer ( Winter Yacht Arrivals 11, % 32.1%
 ST. EUSTATIUS TOURISM HIGHLIGHTS FOR 2007 VISITOR ARRIVALS Tourist Arrivals I ( Summer* ( Winter* 11,568 67.9% 32.1% Sea Arrivals ( Summer ( Winter Yacht Arrivals 5,858 48.5% 51.5% 707 ACCOMMODATION STATISTICS
ANGUILLA VISITOR ARRIVALS 61, % 61.2% VISITOR PROFILE TOURISM AND OTHER RELATED ECONOMIC STATISTICS $ $ $819
 ANGUILLA Visitor Arrival Summary Total visitor arrivals to Anguilla totaled 118.4 thousand in 2010 compared to 112.1 thousand in 2009, an increase of 5.6 percent. Stay-over Arrivals continued to exceed
JAMAICA. Cruise Passengers 1,678, % 35.7% Cruise Calls VISITOR PROFILE % 5.7% 15.5% TOURISM AND OTHER RELATED ECONOMIC STATISTICS
 JAMAICA TOURISM HIGHLIGHTS FOR 2006 VISITOR ARRIVALS Tourist Arrivals I ( Summer ( Winter 1,678,905 64.3% 35.7% Cruise Passengers ( Summer ( Winter Cruise Calls 1,336,453 61.4% 38.6% 563 VISITOR PROFILE
VISITOR ARRIVALS REPORT
 No. of Arrivals VISITOR ARRIVALS REPORT Stay Over Arrivals by Market (September, 217) 9, 8, 7, 6, 5, 4, 3, 2, 1, USA UK Caribbean Canada Rest of Europe Germany France 216 7,91 3,874 4,36 1,134 374 6 114
Monthly Update - Aruba s Tourism Industry: November 2016 and Year to Date 2016
 Summary Highlights. MONTHLY UPDATE - ARUBA S TOURISM INDUSTRY November 2016 and Year to Date 2016 The total number of stopovers visiting Aruba decreased by 28.7% in November, from 110,307 in November 2015
Airline Capacity in the Caribbean. Michael Lum Air Service Strategy and Development Consultant Sixel Consulting Group, Inc.
 Airline Capacity in the Caribbean Michael Lum Air Service Strategy and Development Consultant Sixel Consulting Group, Inc. October 2013 2 Today's Discussion How has airline capacity in the Caribbean changed
TOURIST ARRIVALS REPORT
 No. of Arrivals TOURIST ARRIVALS REPORT Stay Over Arrivals by Market (June, 217) 18, 16, 14, 12, 1, 8, 6, 4, 2, USA UK Caribbean Canada Rest of Europe Germany France Rest of World 216 15,24 3,941 4,425
Researched and compiled by Ms. Elvira Doyle, UNDESA, 27 April 2004
 Status /Overseas THE CARIBBEAN COUNTRIES & REGIONAL ENTITIES United Nations Researched and compiled by Ms. Elvira Doyle, UNDESA, 27 April 2004 CARICOM a/ CARI FORUM b/ ECLAC/ CDCC c/ 1. Anguilla United
Monthly Update - Aruba s Tourism Industry: October 2016 and Year to Date 2016
 Summary Highlights. MONTHLY UPDATE - ARUBA S TOURISM INDUSTRY October 2016 and Year to Date 2016 The total number of stopovers visiting Aruba decreased by 29.8% in October, from 109,024 in October 2015
INTEGRATION AND TRADE IN THE AMERICAS
 INTER-AMERICAN DEVELOPMENT BANK Department of Integration and Regional Programs Division of Integration, Trade and Hemispheric Issues Institute for the Integration of Latin America and the Caribbean Statistics
Daniel Titelman Director Economic Development Division
 Daniel Titelman Director Economic Development Division Economic trends in the region continue to be marked by: Uncertainty and risk in the global economy: External demand remains sluggish, which reflects
TOURIST (Stopover Arrivals) Europe. United States. Canada. Latin America. Monthly Statistical Report
 Europe. United States. Canada. Latin America. Monthly Statistical Report") J 2017 V XXV, I 1 Monthly Statistical Report IN 2017 Stopover arrivals up 3.5% US Market up 1.9% Canada up 6.3% Europe up 7.8% Cruise Passenger up by 10.2% TOURIST (Stopover Arrivals) Stopover arrivals
J 2017 V XXV, I 1 Monthly Statistical Report IN 2017 Stopover arrivals up 3.5% US Market up 1.9% Canada up 6.3% Europe up 7.8% Cruise Passenger up by 10.2% TOURIST (Stopover Arrivals) Stopover arrivals
International economic context and regional impact
 Contents I. GDP growth trends in Latin America and the Caribbean in 2012 II. Regional performance in 2012: Inflation, employment and wages External sector Policies: Fiscal and Monetary III. Conclusions
LatinAmericaand the Caribbean
 International ComparisonProgram(ICP) LatinAmericaand the Caribbean Giovanni Savio EC Statistics Division losure Authorized Public Disclosure Authorized Public Disclosure Authorized Public Disclosure Authorized
The OECS was hardest hit by reduced arrivals showing an overall 12.3% decline in 2009
 CTO Media Conference Feb. 8, 2010, 9AM EST Caribbean Tourism Overview 2009 1. Wider Caribbean Region Tourists arrivals in the Caribbean are on the rebound. Although aggregate tourist arrivals to the wider
Tourism in numbers
 Tourism in numbers 2013-2014 Glenda Varlack Introduction Tourism is a social, cultural and economic experience which involves the movement of people to countries or places outside their usual environment
TOURIST ARRIVALS REPORT
 No. of Arrivals TOURIST ARRIVALS REPORT Stay Over Arrivals by Market (March, 217) 18, 16, 14, 12, 1, 8, 6, 4, 2, USA UK Caribbean Canada Rest of Europe Germany France Rest of World 216 15,61 6,61 5,57
Millions of BZ Dollars M
 External Trade Bulletin ETB MARCH 2017 IMPORTS DOWN 2.2%, DOMESTIC EXPORTS UP 35.5% IN MARCH IMPORTS MARCH 2017: In March 2017, Belize imported goods valuing $155 million; this represented a 2.2 percent
TOURIST (Stopover Arrivals) Europe. United States. Canada. Latin America. Monthly Statistical Report
 Europe. United States. Canada. Latin America. Monthly Statistical Report") J 2018 V XXV, I 1 Monthly Statistical Report IN 2018 Stopover arrivals up 4.7% US Market up 7.2% Canada up 2.0% Europe up 0.7% Cruise Passenger up by 21.3% TOURIST (Stopover Arrivals) Stopover arrivals
J 2018 V XXV, I 1 Monthly Statistical Report IN 2018 Stopover arrivals up 4.7% US Market up 7.2% Canada up 2.0% Europe up 0.7% Cruise Passenger up by 21.3% TOURIST (Stopover Arrivals) Stopover arrivals
TOURIST ARRIVALS REPORT
 No. of Arrivals TOURIST ARRIVALS REPORT Stay Over Arrivals by Market (, 217) 16, 14, 12, 1, 8, 6, 4, 2, USA UK Caribbean Canada Rest of Europe Germany France Rest of World 216 13,454 5,969 4,154 5,881
Tourism as an Economic Pillar. Mary Vrolijk 25 September 2015
 Tourism as an Economic Pillar Mary Vrolijk 25 September 2015 Tourism Trends. Tourism: a key role player in economies. Spinoff effects: Job creation, New small and medium enterprises(sme s), Country competiveness,
Monthly Update - Aruba s Tourism Industry: August 2017 and 2017 YTD. MONTHLY UPDATE - ARUBA S TOURISM INDUSTRY August 2017 and Year to Date 2017.
 MONTHLY UPDATE - ARUBA S TOURISM INDUSTRY August 2017 and Year to Date 2017. Total stopovers fell by 5.7% in August. Summary Highlights. The total number of stopovers visiting Aruba fell by 5.7% in August
PRESENTATION ASSET RECOVERY INTER-AGENCY NETWORK FOR THE CARIBBEAN (ARIN-CARIB)
") Secretariat for Multidimensional Security XLIV MEETING OF THE GROUP OF EXPERTS FOR THE CONTROL OF MONEY LAUNDERING September 25-26, 2017 Asuncion, Paraguay OEA/Ser.L/XIV. 4.44 DDOT/LAVEX/doc.16/17 September
Secretariat for Multidimensional Security XLIV MEETING OF THE GROUP OF EXPERTS FOR THE CONTROL OF MONEY LAUNDERING September 25-26, 2017 Asuncion, Paraguay OEA/Ser.L/XIV. 4.44 DDOT/LAVEX/doc.16/17 September
WÄRTSILÄ IN CENTRAL AMERICA AND THE CARIBBEAN
 WÄRTSILÄ IN CENTRAL AMERICA AND THE CARIBBEAN Harri Antikainen Financial Analyst, Project Development Wärtsilä Energy Solutions March 2018 WÄRTSILÄ HAS STRONG PRESENCE IN THE REGION Wärtsilä has a decades
TOURIST ARRIVALS REPORT
 No. of Arrivals TOURIST ARRIVALS REPORT Stay Over Arrivals by Market (February 2016) 16,000 14,000 12,000 10,000 8,000 6,000 4,000 2,000 0 USA UK Caribbean Canada Rest of Europe Germany France Rest of
TOURIST (Stopover Arrivals) Europe. United States. Latin America. Canada. Monthly Statistical Report
 Europe. United States. Latin America. Canada. Monthly Statistical Report") F 2017 V XXV, I 2 Monthly Statistical Report IN FEBRUARY 2017 Stopover arrivals up 0.8% US Market flat -0.4% Canada up 2.6% Europe down 1.4% Cruise Passenger down by 2.4% TOURIST (Stopover Arrivals) Stopover
F 2017 V XXV, I 2 Monthly Statistical Report IN FEBRUARY 2017 Stopover arrivals up 0.8% US Market flat -0.4% Canada up 2.6% Europe down 1.4% Cruise Passenger down by 2.4% TOURIST (Stopover Arrivals) Stopover
ECONOMIC CONTRIBUTION OF CRUISE TOURISM TO THE DESTINATION ECONOMIES
 BREA 201 Strykers Rd Suite 19-132 Phillipsburg, NJ 08865 Phone: (908) 213-1971 Fax: (908) 777-3521 Website: www.breanet.com ECONOMIC CONTRIBUTION OF CRUISE TOURISM TO THE DESTINATION ECONOMIES A Survey-based
Monthly Update - Aruba s Tourism Industry: October 2017 and 2017 YTD. MONTHLY UPDATE - ARUBA S TOURISM INDUSTRY October 2017 and Year to Date 2017.
 MONTHLY UPDATE - ARUBA S TOURISM INDUSTRY October 2017 and Year to Date 2017. Summary Highlights. Total stopovers grew by 6.5% in October. The total number of stopovers visiting Aruba grew by 6.5% in October
ONE BILLION DOLLARS MORE
 The Caribbean Tourism Organization (CTO) reports that the business outperformed every other major tourism region in the world in 2015, setting new arrival and spend records in 2015. Management says 2015
TOURIST (Stopover Arrivals) Europe. United States. Canada. Latin America. Monthly Statistical Report USA 66.5% Canada 16.5% UK 8.2% All. Other 2.
 Europe. United States. Canada. Latin America. Monthly Statistical Report USA 66.5% Canada 16.5% UK 8.2% All. Other 2.") J 2018 V XXV, I 7 Monthly Statistical Report IN JULY 2018 Stopover arrivals up 3.4% US Market up 4.6% Canada down 2.0% Europe down 0.2% Cruise Passenger down by 5.4% TOURIST (Stopover Arrivals) Stopover
J 2018 V XXV, I 7 Monthly Statistical Report IN JULY 2018 Stopover arrivals up 3.4% US Market up 4.6% Canada down 2.0% Europe down 0.2% Cruise Passenger down by 5.4% TOURIST (Stopover Arrivals) Stopover
TOURIST (Stopover Arrivals) Europe. United States. Latin America. Canada. Monthly Statistical Report USA 64.4% Canada 16.9% UK 9.4% All Other 2.
 Europe. United States. Latin America. Canada. Monthly Statistical Report USA 64.4% Canada 16.9% UK 9.4% All Other 2.") N 2017 V XXV, I 11 Monthly Statistical Report IN NOVEMBER 2017 Stopover arrivals up 14.7% US Market up 18.6% Canada up 12.5% Europe up 5.2% Cruise Passenger up by 47.2% TOURIST (Stopover Arrivals) Stopover
N 2017 V XXV, I 11 Monthly Statistical Report IN NOVEMBER 2017 Stopover arrivals up 14.7% US Market up 18.6% Canada up 12.5% Europe up 5.2% Cruise Passenger up by 47.2% TOURIST (Stopover Arrivals) Stopover
TOURIST ARRIVALS REPORT
 No. of Arrivals TOURIST ARRIVALS REPORT Stay Over Arrivals by Market (May 2016) 16,000 14,000 12,000 10,000 8,000 6,000 4,000 2,000 0 USA UK Caribbean Canada Rest of Europe Germany France Rest of World
Tourism Statistics
 Tourism Statistics 2006-2010 TABLE OF CONTENTS FOREWORD 4 DEFINITIONS 5 STATISTICAL SUMMARY FOR 2010 6 INTERNATIONAL TOURIST ARRIVALS 7 International Tourist Arrivals: 1994-2010 7 International Tourist
Tourism Snapshot A focus on the markets in which the CTC and its partners are active
 Tourism Snapshot A focus on the markets in which the CTC and its partners are active www.canada.travel/corporate January 214 Volume 1, Issue 1 Key highlights Total arrivals from CTC s international markets
TOURIST (Stopover Arrivals) Europe. United States. Canada. Latin America. Monthly Statistical Report USA 66.0% Canada 15.9% UK 8.8% All Other 2.
 Europe. United States. Canada. Latin America. Monthly Statistical Report USA 66.0% Canada 15.9% UK 8.8% All Other 2.") N 2018 V XXV, I 11 Monthly Statistical Report IN NOVEMBER 2018 Stopover arrivals up 5.1% US Market up 9.0% Canada down 6.5% Europe up 4.6% Cruise Passenger down by 26.1% TOURIST (Stopover Arrivals) Stopover
N 2018 V XXV, I 11 Monthly Statistical Report IN NOVEMBER 2018 Stopover arrivals up 5.1% US Market up 9.0% Canada down 6.5% Europe up 4.6% Cruise Passenger down by 26.1% TOURIST (Stopover Arrivals) Stopover
Climate Change and Tourism A Caribbean Tourism Organization Perspective
 Climate Change and Tourism A Caribbean Tourism Organization Perspective Presented by: Gail N. Henry Sustainable Tourism Product Specialist Caribbean Tourism Organization CARIBSAVE Partners Symposium, The
TOURIST (Stopover Arrivals) Europe. United States. Latin America. Canada. Monthly Statistical Report USA 65.0% Canada 16.7% UK 9.2% All Other 2.
 Europe. United States. Latin America. Canada. Monthly Statistical Report USA 65.0% Canada 16.7% UK 9.2% All Other 2.") S 2017 V XXV, I 9 Monthly Statistical Report IN SEPTEMBER 2017 Stopover arrivals up 9.2% US Market up 3.2% Canada up 25.6% Europe up 20.5% Cruise Passenger up by 54.1% TOURIST (Stopover Arrivals) Stopover
S 2017 V XXV, I 9 Monthly Statistical Report IN SEPTEMBER 2017 Stopover arrivals up 9.2% US Market up 3.2% Canada up 25.6% Europe up 20.5% Cruise Passenger up by 54.1% TOURIST (Stopover Arrivals) Stopover
Lessons Learned from 50 Years of Cruise Tourism in the Caribbean
 Lessons Learned from 50 Years of Cruise Tourism in the Caribbean PRESENTED BY: MARTHA HONEY, PH.D., EXECUTIVE DIRECTOR CENTER FOR RESPONSIBLE TRAVEL (CREST) SESSION 1: NOVEMBER 27, 2017, TOURISM & SUSTAINABILITY
Paper for the Consideration by CBSC18. MACHC report
 CBSC16-05.1I 16 th MEETING OF THE IHO CAPACITY BUILDING SUB-COMMITTEE IHO-CBSC16 Goa, India, 30 May - 1 June 2018 Submitted by: Executive Summary: Paper for the Consideration by CBSC18 MACHC report MACHC
IMO/IHO World-Wide Navigational Warning Service NAVAREA IV / XII
 UNCLASSIFIED IMO/IHO World-Wide Navigational Warning Service NAVAREA IV / XII 10 December 2015 The World-Wide Navigational Warning Service (WWNWS) is the internationally and nationally coordinated service
TOURIST (Stopover Arrivals) Europe. United States. Latin America. Canada. Monthly Statistical Report USA 64.2% Canada 17.2% UK 9.3% All Other 2.
 Europe. United States. Latin America. Canada. Monthly Statistical Report USA 64.2% Canada 17.2% UK 9.3% All Other 2.") D 2017 V XXV, I 12 Monthly Statistical Report IN DECEMBER 2017 Stopover arrivals up 9.3% US Market up 9.4% Canada up 10.5% Europe up 9.0% Cruise Passenger up by 14.2% TOURIST (Stopover Arrivals) Stopover
D 2017 V XXV, I 12 Monthly Statistical Report IN DECEMBER 2017 Stopover arrivals up 9.3% US Market up 9.4% Canada up 10.5% Europe up 9.0% Cruise Passenger up by 14.2% TOURIST (Stopover Arrivals) Stopover
TOURIST (Stopover Arrivals) Europe. United States. Canada. Latin America. Monthly Statistical Report USA 66.4% Canada 15.8% UK 8.6% All Other 2.
 Europe. United States. Canada. Latin America. Monthly Statistical Report USA 66.4% Canada 15.8% UK 8.6% All Other 2.") S 2018 V XXV, I 9 Monthly Statistical Report IN SEPTEMBER 2018 Stopover arrivals up 2.7% US Market up 11.0% Canada down 16.7% Europe down 7.4% Cruise Passenger down by 36.5% TOURIST (Stopover Arrivals)
S 2018 V XXV, I 9 Monthly Statistical Report IN SEPTEMBER 2018 Stopover arrivals up 2.7% US Market up 11.0% Canada down 16.7% Europe down 7.4% Cruise Passenger down by 36.5% TOURIST (Stopover Arrivals)
Yukon Tourism Indicators Year-End Report Yukon Tourism Indicators Year-End Report 2015
 Yukon Tourism Indicators Overview The Yukon Tourism Indicators is published by the Department of Tourism and Culture as a companion to the monthly Yukon Tourism Visitation Report. This document is intended
TOURISM rd QUARTER PRESS CONFERENCE
 TOURISM 2018 3 rd QUARTER PRESS CONFERENCE CuraçaoPorts Authority Jan Sep cruise call arrivals 45 42 40 35 30 33 29 35 33 32 27 25 20 15 10 15 15 11 11 10 15 15 15 14 11 12 5 0 Jan Feb Mar Apr May Jun
IRR Viewpoint. Caribbean Hospitality Market Update 2 nd Quarter 2018 Report. By James V. Andrews MAI, CRE, FRICS, ASA/BV
 IRR Viewpoint Caribbean Hospitality Market Update 2 nd Quarter 2018 Report By James V. Andrews MAI, CRE, FRICS, ASA/BV Caribbean Hospitality Market Update 2 nd Quarter 2018 Report By James V. Andrews,
Tourism in the Caribbean Netherlands in 2017
 Paper Tourism in the Caribbean Netherlands in 2017 May 2018 CBS Paper, 1 Contents 1. Bonaire 3 1.1 Number of air tourist arrivals down by 5 percent in 2017 3 1.2 Number of cruise passengers on Bonaire
2016 October - December
 2016 October - December TOURIST ARRIVAL QUARTERLY REPORT Research and Statistics Department Ministry of Tourism, Economic Development, Investment & Energy Statistics Division 1 P a g e Foreword This report
Business Opportunities in the Caribbean Region. Presented by: Robert Jones Commercial Counselor - Caribbean Region
 Business Opportunities in the Caribbean Region Presented by: Robert Jones Commercial Counselor - Caribbean Region The Caribbean region imports $20.3 billion of US products and services Jamaica US$2.64
GoToBermuda.com. Q4 Arrivals and Statistics at December 31 st 2015
 Q4 Arrivals and Statistics at December 31 st 1 Q4 Total Vacation Visitor Arrivals Q4 Arrivals Air - Vacation 23,770 23,125-2.7% -645 141,509 139,820-1.2% -1,689 Cruise 39,118 48,344 23.6% 9,226 355,880
Prospects for sustainable fiscal policy: Transfers and subsidies examined
 Prospects for sustainable fiscal policy: Transfers and subsidies examined COTE 2014, UWI, St. Augustine Dr. Justin A. Ram, Director, Economics Department Presentation outline Caribbean economic overview
Results of Tourist Activity
 Results of Tourist Activity México, January, 2014 Ministry of Tourism Tourist Planning and Policy Undersecretariat Index Relevant Results, January, 2014.. Analysis of Main Results in the Sector..... 1
CTO PERFORMANCE REVIEW 2005 CARIBBEAN TOURISM PERFORMANCE
 CTO PERFORMANCE REVIEW 2005 CARIBBEAN TOURISM PERFORMANCE We can perhaps describe the Caribbean tourism sector as continuing to hold its own in 2005. Based upon the available returns from its 31 member
Oct-17 Nov-17. Sep-17. Travel is expected to grow over the coming 6 months; at a slightly faster rate
 Analysis provided by TRAVEL TRENDS INDEX SEPTEMBER 2018 CTI reading of.8 in September 2018 indicates that travel to or within the U.S. grew 1.6% in September 2018 compared to September 2017. LTI predicts
Contents of the Economic Survey 2012
 Contents of the Economic Survey 2012 I. Macroeconomic trends in Latin America and the Caribbean in 2012 II. Reactions of the countries of the region to the adversities of the global economy III. Savings
BRITISH VIRGIN ISLANDS
 BRITISH VIRGIN ISLANDS Visitor Arrival Summary Tourist Arrivals to the British Virgin Islands (BVI) continued the downward trend in 2009, slipping by 10.7 percent. The year end total was registered at
Produced by: Destination Research Sergi Jarques, Director
 Produced by: Destination Research Sergi Jarques, Director Economic Impact of Tourism Oxfordshire - 2015 Economic Impact of Tourism Headline Figures Oxfordshire - 2015 Total number of trips (day & staying)
49 May-17. Jun-17. Travel is expected to grow over the coming 6 months; at a slower rate
 Analysis provided by TRAVEL TRENDS INDEX MAY 2018 CTI reading of 51.7 in May 2018 shows that travel to or within the U.S. grew 3.4% in May 2018 compared to May 2017. LTI predicts moderating travel growth
PBN Implementation CAR/NAM Regions
 Regional Forum Creating More Lift PBN Implementation CAR/NAM Regions Victor Hernandez RO ATM/SAR ICAO North America, Central America and Caribbean Regional Office Project: PBN Implementation Regional Performance
BRAZIL INTERNATIONAL INBOUND TRAVEL MARKET PROFILE (2011) Copyright 2012 by the U.S. Travel Association. All Rights Reserved.
 Copyright 2012 by the U.S. Travel Association. All Rights Reserved.") BRAZIL INTERNATIONAL INBOUND TRAVEL MARKET PROFILE (211) Copyright 212 by the U.S. Travel Association. All Rights Reserved. EXECUTIVE SUMMARY With a population of nearly 2 million and a GDP exceeding $2
BRAZIL INTERNATIONAL INBOUND TRAVEL MARKET PROFILE (211) Copyright 212 by the U.S. Travel Association. All Rights Reserved. EXECUTIVE SUMMARY With a population of nearly 2 million and a GDP exceeding $2
Tourism Snapshot. June 2015 Volume 11, Issue 6. A focus on the markets in which Destination Canada (DC) and its partners are active.
 and its partners are active.") Tourism Snapshot Tourism PEI / Paul Baglole A focus on the markets in which Destination Canada (DC) and its partners are active. www.destinationcanada.com June Volume 11, Issue 6 Key highlights Over the
Tourism Snapshot Tourism PEI / Paul Baglole A focus on the markets in which Destination Canada (DC) and its partners are active. www.destinationcanada.com June Volume 11, Issue 6 Key highlights Over the
Oct-17 Nov-17. Travel is expected to grow over the coming 6 months; at a slower rate
 Analysis provided by TRAVEL TRENDS INDEX OCTOBER 2018 CTI reading of 51.6 in October 2018 indicates that travel to or within the U.S. grew 3.2% in October 2018 compared to October 2017. LTI predicts travel
Population, Territory and Sustainable Development The Case of the Caribbean Sub Region
 Population, Territory and Sustainable Development The Case of the Caribbean Sub Region Author: Godfrey St. Bernard Sir Arthur Lewis Institute of Social and Economic Studies The University of the West Indies
THE GROWTH OF THE HOSPITALITY INDUSTRY IN DUBAI
 THE GROWTH OF THE HOSPITALITY INDUSTRY IN DUBAI THE DEFINITION OF TOURISM Tourism is travel for recreational, leisure or business purposes. The World Tourism Organization defines tourists as people "traveling
Jan-18. Dec-17. Travel is expected to grow over the coming 6 months; at a slower rate
 Analysis provided by TRAVEL TRENDS INDEX DECEMBER 2018 CTI reading of 51.8 in December 2018 indicates that travel to or within the U.S. grew 3.6% in December 2018 compared to December 2017. LTI predicts
Tourism Quality and Standards: A Sustainable Tourism Policy Perspective
 Tourism Quality and Standards: A Sustainable Tourism Policy Perspective Presented by: Gail N. Henry Sustainable Tourism Product Specialist Caribbean Tourism Organization at CROSQ/GNBS SME Workshop Guyana,
IRR Viewpoint. Caribbean Hospitality Market Update 1 st Quarter 2018 Report. By James V. Andrews MAI, CRE, FRICS, ASA/BV
 IRR Viewpoint Caribbean Hospitality Market Update 1 st Quarter 2018 Report By James V. Andrews MAI, CRE, FRICS, ASA/BV Caribbean Hospitality Market Update 1 st Quarter 2018 Report By James V. Andrews,
Economic Benefits of Air Transport in Belize
 Economic Benefits of Air Transport in Belize Economic Benefits of Air Transport in Belize Acknowledgements Oxford Economics acknowledges the assistance from the International Air Transport Association
TOURISM PERFORMANCE 2018
 FIRST SIX MONTHS TOURISM PERFORMANCE TOTAL STAYOVER ARRIVALS 204,804 TOTAL CRUISE ARRIVALS 396,605 TOTAL VISITOR NIGHTS AVERAGE HOTEL OCCUPANCY 1,823,216 75.6% TOTAL ECONOMIC IMPACT (DIRECT + INDIRECT)
Results of Tourism Activity Mexico, February 2017
 Results of Tourism Activity Mexico, February Undersecretariat of Planning and Tourism Policy Available in http://www.datatur.sectur.gob.mx/sitepages/versionesrat.aspx DIRECTORy ENRIQUE DE LA MADRID CORDERO
Quarterly Bulletin of Statistics
 QUARTERLY BULLETIN OF STATISTICS 2nd Quarter Q2 GOVERNMENT OF BERMUDA Department of Statistics Quarterly Bulletin of Statistics Q2 Highlights Imports The value of imports decreased 15.8 per cent to $299.1
AfrICANDO th Annual
 THE FOUNDATION FOR DEMOCRACY IN AFRICA 19th Annual AfrICANDO 2017 U.S. Africa Trade & Investment Conference/Trade Show Supply Chain Development and Competitiveness under AGOA - Making AGOA Work for SME
Tourism Snapshot. A focus on the markets in which the CTC and its partners are active. February 2015 Volume 11, Issue 2.
 Tourism Snapshot Tourism Whistler/Mike Crane A focus on the markets in which the CTC and its partners are active www.canada.travel/corporate February Volume 11, Issue 2 Key highlights The strong beginning
Industry Update. ACI-NA Winter Board of Directors Meeting February 3, 2016 Orlando, FL
 Industry Update ACI-NA Winter Board of Directors Meeting February 3, 2016 Orlando, FL U.S. & Canadian GDP 8% 6% 4% U.S.* Canada** Estimate by BEA as of 02/11/16 2% 0% -2% -4% -6% -8% -10% The U.S. economy