MINIMUM INSTREAM FLOW ESTIMATION AT UNGAGED STREAM SITES IN PUERTO RICO
|
|
|
- Della Snow
- 5 years ago
- Views:
Transcription


 723-8005 Fax.")
1 MINIMUM INSTREAM FLOW ESTIMATION AT UNGAGED STREAM SITES IN PUERTO RICO June, 2009 PREPARED FOR: PREPARED BY: 250 Tanca St. P.O. Box Old San Juan Tel. (787) Fax. (787)
2 Table of Contents 1. INTRODUCTION Study Description Scope and Purpose of Report Limitations of the Analysis Authorization MEAN ANNUAL RAINFALL MAP Current Rainfall Map Rainfall Data Isoheytal Map LOW FLOW ESTIMATION AT UNGAGED SITES Regional Regression Analysis Methodology Streamflow Data Regression Analysis Regression Analysis Results Station Index Method CONCLUSIONS AND RECOMMENDATIONS REFERENCES APPENDIX A: SAMPLE CALCULATIONS..A-1
3 List of Figures Figure 1: Mean annual rainfall, prepared using rainfall data from 1931 to 1960 (Calversbert, 1970). Figure 2: Figure 3: Figure 4: Figure 5: Figure 6: Figure 7: Figure 8: Figure 9: Figure 10: Figure 11: Figure 12: Figure 13: Figure 14: Figure 15: Figure A-1: Figure A-2: Rain gages with more than 10% difference in mean annual rainfall between station data and DNER (2003) rainfall map. National Climatic Data Center rainfall gage stations used to generate mean annual rainfall map. Rainfall-runoff relationship resulting from the final rainfall contour map. Mean annual rainfall surface map for Puerto Rico. Mean annual rainfall contours map for Puerto Rico. USGS streamflow gage stations location used in regression analysis. Comparison of Mean Square Error for the different regression models. Relation between observed and predicted Q mean flow. Relation between observed and predicted Q 90 flow. Relation between observed and predicted Q 95 flow. Relation between observed and predicted Q 98 flow. Relation between observed and predicted Q 99 flow. Relation between observed and predicted flow for all recurrence intervals compared to line of perfect correlation to gage station data. Error between observed and predicted values for the different return intervals. Example 1. Q99 of an ungaged site at Río Bauta is determined using USGS Río Bauta Stations ( ) as reference. Example 2. Q99 of an ungaged site with an intake at Río Cialitos is determined using USGS Río Bauta Stations ( ) as reference.
4 MINIMUM INSTREAM FLOW ESTIMATION AT UNGAGED STREAM SITES IN PUERTO RICO 1. INTRODUCTION 1.1. Study Description Minimum streamflow information is commonly used to determine the water available for extraction and to analyze instream environmental parameters. Minimum streamflow estimates are frequently desired at ungaged locations, either on a stream having gages at other locations, or a stream without any gages. This study presents regional regression equations to estimate minimum streamflow using two parameters: watershed area and mean annual rainfall. These equations are based on a revised rainfall map which incorporates the available rainfall data from 127 raingage stations and also considers geographic parameters Scope and Purpose of Report This study describes a methodology for minimum streamflow estimation and consists of two major elements. A new isoheytal map for Puerto Rico showing contour lines of mean annual rainfall has been prepared based on contour curve fitting within the GIS environment, and adjusted based on geographic criteria such as proximity to the coastline, elevation, and vegetation mapping (Holdrige life zone). Regional regression equations for mean discharge and for minimum streamflow exceedances (Q 90, Q 95, Q 98, Q 99, and Q m) have been prepared based on the revised isoheytal map. The regression equations have been developed to simulate current natural runoff conditions, using streamflow data from gage stations with minimum influence by upstream reservoirs, diversions and loss to groundwater Limitations of the Analysis The minimum streamflow equations do not account for the effects produced by the existence of reservoir operations, intakes and diversions, or infiltration into coastal alluvial or karst aquifers. For those cases it is necessary to make a more detailed study in order to obtain more representative results. The equations should not be used in watersheds smaller than one square mile Authorization Preparation of this report has been authorized by the Department of Natural and Environmental Resources (DNER) by contract #
5 2. MEAN ANNUAL RAINFALL MAP 2.1. Current Rainfall Map Several isoheytal maps have been prepared for Puerto Rico over the past four decades (Calversbert, 1970; Black and Veatch, 1971; DNER, 2003). The map published by Calversbert (1970) presented in Figure 1, was prepared using rainfall data from 1930 to The map published by DNER (2003) has significant discrepancies with station rainfall at several locations. Table 1 presents those stations with more than 10% of difference between values obtained from that map and those obtained from the rain gage station data. The location of these stations is presented in Figure 2. The current analysis stemmed from the desire to use the most recently available data to minimize discrepancies between maps and station data. Table 1: Rain Gages with more than 10% of Difference from DNER (2003) Isoheytal Map. Rain Gage Mean Annual Rainfall (in/yr) Gage Station Data DNER Map % Difference San Juan City Peñuelas 1 NE Toro Negro Forest Río Blanco Lower Carite Dam Peñuelas Salto Garzas Lajas Substn Caguas 1 W Negro-Corozal Yauco 1 NW Aibonito 1 S Jayuya Melanía Dam Potala Río Piedras Exp Stn San Lorenzo Espino Sabana Grande 2 ENE Toro Negro Plt Isabela Substn Humacao 2 SSE
6 2.2. Rainfall Data Rainfall data were obtained from the US Department of Commerce National Climatic Data Center (NCDC). The NCDC database has 143 rain gages with record periods dating from A screening process was undertaken to eliminate from the analysis stations with less than 15 years of data. Other eliminated stations were those very close to other stations and with a notable difference in mean annual rainfall with other nearby gages having a longer period of record. Table 2 presents the omitted rain gages and the reasons. The rain gages used for the analysis are presented in Table 3 and Figure 3. Some stations with 14 years of record were included in the analysis because the area they are located lack of any surrounding station and the 14 years of data provides a better representation of the area. Table 2: Rain Gages Omitted in the Analysis. Rain Gage Record Begin Date Record End Date Record Years Rainfall (in/yr) Reason Bayaney Jun-1970 Aug Record < 15 Years Boca Jul-1996 Dec Record < 15 Years Caguas 2 ENE Aug-1960 May Record < 15 Years Garrochales Sep-1965 Apr Record < 15 Years Guayanilla Jan-1955 Aug Record < 15 Years Guineo RSVR Jan-1955 Mar Record < 15 Years Indiera Baja Nov-1952 Sep Record < 15 Years Jayuya 1 SE Mar-1960 May Inconsistent with nearby gage stations A/ Josefa Jan-1955 Jan Record < 15 Years La Fe Jan-1956 Mar Record < 15 Years Maricao Jan-1955 Apr Record < 15 Years Naguabo 3 E Apr-1972 May Record < 15 Years Naguabo 6 W Jan-1955 May Record < 15 Years Palmarito Mar-1963 Apr Record < 15 Years Ponce Mercedita Ap Jan-1957 Nov Record < 15 Years Potala Jan-1955 Feb Record < 15 Years Rincón 2 NNW Nov-1957 May Record < 15 Years Río Piedras Jan-1931 Dec Inconsistent with nearby gage stations B/ St Just Jan-1955 Dec Record < 15 Years Saltillo 2 Adjuntas May-1981 Dec Record < 15 Years Toa Baja Levitown Jan-2005 Dec Record < 15 Years Vieques Island #2 Mar-1983 Jan Record < 15 Years Yauco 1 S Jan-1955 Jun Record < 15 Years Yaurel 3 NNE Jan-1955 Mar Record < 15 Years A/ Inconsistent with gage station Jayuya (Period of Record , Rainfall of 75.5 in/yr). B/ Inconsistent with gage station Río Piedras Exp Stn (Period of Record , Rainfall of in/yr). 3
7 Table 3: Rain Gages Used to Generate Isoheytal Map. Rain Gage Record Begin Date Record End Date Rainfall (in/yr) Rain Gage Record Begin Date Record End Date Rainfall (in/yr) Aceituna Jan-1955 Dec Adjuntas 1 NW Jan-1955 Dec Adjuntas Substn Jan-1970 Dec Aguirre Jan-1931 Oct Aguirre Apr-1955 Dec Aibonito 1 S Jan-1906 Dec Arecibo 3 Ese Jul-1931 Jan Arecibo Obsy Feb-1980 Dec Barceloneta 2 Jan-1955 May Barceloneta 3 SW Sep-1990 Dec Barranquitas Jan-1955 Dec Benavente-Hormigueros Aug-1973 Aug Borinquen AP Feb-1974 Dec Cabo Rojo Jan-1955 Aug Cacaos-Orocovis May-1981 Dec Caguas May-1899 Aug Caguas 1 W Mar-1970 Mar Calero Camp Jan-1955 Dec Cambalache Exp Forest Jan-1932 Feb Candelaria Toa Baja Jan-1955 May Candelaria Toa Baja Oct-1973 Aug Canóvanas Jan-1955 Dec Caonillas Utuado Jan-1955 Nov Caonillas Villalba Jan-1955 Sep Carite Dam Jan-1955 Apr Carite Plt 1 Jan-1955 Mar Cataño Jan-1955 May Cayey 1 E Jan-1955 Jun Central San Francisco Jan-1955 Jun Cerro Gordo Ciales Oct-1969 Sep Cerro Maravilla Apr-1969 Dec Cidra 1 E Sep-1899 Jun Coamo 2 SW Jan-1955 Dec Coloso Oct-1899 Dec Comerío Falls Plt 2 Feb-1959 May Corozal Substn Jan-1931 Dec Corral Viejo Apr-1970 Dec Culebra Island Jan-1920 Jul Dorado 2 Wnw Jan-1931 May Dos Bocas Jan-1937 Dec Ensenada 1 W Jan-1955 Dec Fajardo Jan-1931 Jan
8 Rain Gage Record Begin Date Record End Date Rainfall (in/yr) Rain Gage Record Begin Date Record End Date Rainfall (in/yr) Garzas Jan-1939 Jan Guajataca Dam Jan-1955 Dec Guavate Camp Dec-1969 Jun Guayabal Jan-1955 Dec Guayama 2E Jan-1911 Dec Gurabo Apr-1946 May Gurabo Substn Mar-1956 Dec Hacienda Constanza Oct-1969 Dec Hato Arriba Arecibo Feb-1974 Aug Humacao 2 SSE Jan-1931 Jan Indiera Alta Oct-1962 Jun Isabela Substn Jan-1901 Dec Jájome Alto Jan-1955 Dec Jayuya Apr-1909 Aug Juana Díaz Camp Jan-1931 Dec Juncos 1 SE Jan-1931 Dec Lajas Substn Jan-1900 Dec La Muda Caguas Sep-1971 Jun Lares Jun-1903 Dec Los Caños Jan-1955 Aug Magüeyes Island Jan-1959 Nov Manatí 2 E Jan-1900 Dec Maricao 2 SSW May-1969 Dec Maricao Fish Hatchery Jan-1955 Dec Matrullas Dam Jan-1955 Apr Maunabo May-1899 Apr Mayagüez City Jan-1957 Dec Mayagüez AP Jan-1900 Dec Melania Dam A/ Jan-1955 Jan Mona Island Jan-1955 Aug Mona Island 2 Feb-1980 Dec Monte Bello Manatí Oct-1969 Sep Mora Camp Jan-1955 Dec Morovis 1 N Feb-1956 Dec Negro-Corozal Jan-1976 Dec Paraíso Jan-1956 Dec Patillas Apr-1982 Jun Patillas Dam Jan-1931 Jan Peñuelas Salto Garzas Mar-1971 Dec Peñuelas 1 NE Jan-1955 Feb Pico del Este Oct-1969 Jun Ponce 4 E Apr-1954 Dec Ponce City Jul-1970 Aug Puerto Real Jan-1955 Aug Quebradillas Jan-1955 Sep Rincón Jun-1968 Nov
9 Rain Gage Record Begin Date Record End Date Rainfall (in/yr) Rain Gage Record Begin Date Record End Date Rainfall (in/yr) Río Blanco Lower Jan-1955 Dec Río Blanco Upper Jan-1955 Mar Río Cañas Jan-1955 Dec Río Grande el Verde Feb-1956 Dec Río Jueyes A/ Jan-1955 Jan Río Piedras Exp Stn Jan-1959 Dec Roosevelt Roads Jul-1959 Mar Sabana Grande 2 ENE May-1977 Dec Sabater A/ Jan-1955 Jan San Cristóbal Jan-1956 Mar San Germán 4 W Nov-1904 Jul San Juan City Jan-1955 May San Juan Intl Ap Jan-1956 Dec San Lorenzo 3S Mar-1966 Dec San Lorenzo Espino A/ Jan-1945 Jun San Lorenzo Farm 2 NW Jan-1955 Sep San Sebastián 2 WNW Apr-1955 Oct Santa Isabel 2 ENE Jan-1955 Dec Santa Rita Jan-1955 Dec Toa Baja 1 SSW Jan-1955 Aug Toro Negro Forest Aug-1982 Dec Toro Negro PLT 2 Jan-1955 Jul Trujillo Alto 2 SSW Feb-1957 Dec Utuado Jan-1931 Jul Vieques Island Jan-1955 Sep Villalba 1 SE Jan-1955 Dec Yabucoa 1 NNE Jan-1955 Mar Yauco 1 NW Dec-1981 Dec A/ Station with 14 years of record included in the analysis. 6
10 2.3. Isoheytal Map The NCDC rainfall gage station data were used to interpolate a surface within the Arc- GIS environment using spline curves to create the initial isoheytal countours. Spline algorithms can create very smooth surfaces from moderately detailed data and provide exact interpolation within smoothing limits. This method is best suitable for gently varying surfaces, such as rainfall. The initial contour lines were then adjusted based on coastline proximity, elevation and vegetation mapping. The resulting contours were checked against USGS streamgage data, comparing rainfall and runoff per unit of watershed area to reveal any unusual discrepancies. The rainfall-runoff relationship resulting from the final isoheytal map is presented in Figure 4. presented in Figure 5 and Figure 6 respectively. The resulting rainfall surface and rainfall contour map are The following physical parameters were used to realign rainfall contours in areas of sparse gage data: Contours adjacent to the ocean were adjusted to lie roughly parallel to the coastline, instead of locally curving around coastal rain gage stations; Contours along the Cordillera Central were adjusted to run generally parallel to the mountains peaks to better reflects orographic effects; and Contours were also checked against Holdridge Life Zone vegetation map, since this mapping system reflects long-term rainfall patterns (Ewel and Whitemore, 1973). 7
11 3. LOW FLOW ESTIMATION AT UNGAGED SITES This section describes two methods to estimate low-flow at ungaged stream sites, regional regression analysis and station index method Regional Regression Analysis Methodology Multiple Linear Regression techniques were used to develop a series of equations to estimate average daily streamflow equaled or exceeded on 90%, 95%, 98%, and 99% of the time as well as mean streamflow, also referred as Q 90, Q 95, Q 98, Q 99, and Q m respectively. Equations used average daily streamflow as the dependent variable, and Watershesd Area and Mean Annual Rainfall as independent variable. These two independent parameters were selected because they have the highest predictive values and because these data are readily available. The Multiple Linear Regression analysis relates two or more explanatory variables with a response variable by fitting a linear equation to the observed data (McCuen, 1993). The Multiple Linear Regression Model for the analysis is defined by: where, Q = Streamflow (cfs) A = Basin area (mi 2 ) P = Mean annual rainfall (in/yr) a, b, c = Regression coefficients ȗȗ (3.1) The matrix notation of the model has the following form: where: ǣestimated discharge vector: ȉ Ⱦ Ԗ (3.2) : Watershed parameters matrix: ଵ ڭ (3.3) 8
12 ͳ ܣ ଵ ଵ ͳ ڭ ڭ ൩ (3.4) ͳ ܣ vector: Regression coefficient :ߚ : Residual (error term): (3.5) ቈ ߚ (3.6) where, = True streamflow vector = Estimated streamflow vector Logarithmic transformation was performed to linearize the hydrologic data. The resulting transformed equation was used for the analysis: ȗȗ (3.7) Appling antilogarithm to both sides of the equations, the previous equation can be rewritten as: ͳͳ ୟ ܣ ȗ ୠ ȗ ୡ (3.8) Eq. (3.8) is the form used for the regional regression equations Streamflow Data Daily streamflow data were obtained from the 22 USGS gage stations in Puerto Rico with more than ten years of daily data and where low flows were little affected by reservoir operation, water supply intakes and diversions, or infiltration into coastal alluvial or karst aquifers. The drainage area for these stations ranges from 1 to 100 square miles. Figure 7 shows the location of these stations and the watershed area tributary to each. Minimum streamflow values were determined at each station for exceedance probabilities of 99, 98, 95 and 90% using a daily flow duration analysis (Table 4). 9
13 Table 4: USGS Streamflow Data Used in Regression Analysis. Station Number Station Name Drainage Area (mi 2 ) Rainfall (in/yr) Qm (cfs) Q99 (cfs) Q98 (cfs) Q95 (cfs) Q90 (cfs) Río Saliente Río Bauta Río Piedras Río Piedras Río Grande de Loíza Río Turabo Río Cagüitas Río Cañas Río Mameyes Río Mameyes Río Icacos Rio Humacao Río Grande de Patillas Río Lapa Río Majada Río Descalabrado Río Toa Vaca Río Cerrillos Río Rosario Río Blanco Río Grande de Añasco Río Culebrinas
14 Regression Analysis Three multiple linear regression models were analyzed for this study: 1) Ordinary Least Squares (OLS): Hydrologists have commonly used OLS method to estimate the regression coefficient vector of the linear model for regression analyses. This method obtains parameter estimates that minimize the sum of squared residuals. The OLS regression coefficient vector ߚ) ሻ can be solved using matrix analysis by solving Eq. (3.9: (3.9) ሺ ȉ ሻ ଵ ȉ ȉ ߚ where: Y= Observed discharge vector = Matrix of the watershed parameters The OLS method is the faster regression method for this type of analysis and is analyzed very quickly once the data in Table 4 is setup in a spreadsheet. However, it introduces a significant error because the regression is calculated on logged parameter values, which represent a non-linear transformation of the original dataset. 2) Manual Numerical Search for Least Square Error (MNS): The MNS method consists of a numerical search of the least square error (MNS) using an iterative spreadsheet solver. This method used as initial values the results from the OLS, and by an iterative process the regression coefficients are varied until the minimum square error is found, as compared to original data (without the log transformation). This method required approximately twice the time required by the OLS analysis. 3) Generalized Least Squares (GLS): Recent studies of minimum streamflow analysis have employed the Generalized Least Squares (GLS) regression technique. This method takes into account varying sampling error and cross correlation among concurrent flows. It was developed by Stedinger and Tasker (1985) and has become a standard for regression analysis of flood frequency data. Stedinger and Tasker (1985) and Stedinger and Tasker (1986) showed that the GLS procedures provide more accurate parameter estimators, relatively unbiased estimate of the model error variance and a better estimation of parameter sampling variance than those estimated with OLS. Moss and Tasker (1991) showed that GLS procedures describe model accuracy in regional regression analysis better than OLS. A discussion and implementation of the GLS is presented in Stedinger and Tasker (1989) and Griffis and Stedinger (2007). The GLS estimate of Ⱦ is given by Stedinger and Tasker (1985) as: 11
15 Ⱦ ൫ Ȧ ଵ ൯ ଵ Ȧ ଵ (3.10) where Ȧ is the covariance of the model. In the GLS model Ȧ is estimated by Ȧ ߪ ଶ ఋ ȭ (3.11) where ߪ ଶ ఋ is an estimate of the model error variance and ȭ is an (i i) matrix of sampling covariance with elements: Diagonal elements (i = j): ȭ ୧୨ ሾ ୧ ሿ (3.12) Chowdury and Stedinger (1991) provide the following first order approximation of the sampling error (ሾ ୧ ሿ), ሾ ୧ ሿ ቈͳ ୧ ɀ ୧ ଶ ୧ ൬ ͳʹ ͺ ɀ୧ ଶ μ ୧ ൰ ୧ ɀ ୧ ୧ ൬ ɀ μɀ ୧ ୧ Ͷ ɀ ୧ ଷ ൰ ଶ ୧ ൬ μ ଶ ୧ ൰ ൬ ͻɀ ଶ μɀ ୧ ͳͷ ୧ ͺ ɀ୧ ସ ൰ ɐ ଶ ୧ ሺͳ ୧ ሻ ଶ ɐ ଶ ୧ ஓ ൬ μ ଶ ୧ ൰ ୧ μɀ ୧ (3.13) Off-diagonal elements (i j): ȭ ୧୨ ɏ ୧୨ ୧୨ɐ ୧ ɐ ୨ ୧ ୨ ͳ ୧ɀ ୧ ʹ ୨ɀ ୨ ʹ ୧ ୨ ʹ ൫ɏ ୧୨ ͲǤͷɀ ୧ ɀ ୨ ൯ ୨ ɀ ୧ ୧ μ ୧ μɀ ୧ ൫ ɏ ୧୨ ͲǤͷɀ ୧ ɀ ୨ ൯ ୧ ɀ ୨ ୨ μ ୨ μɀ ୨ ൫ ɏ ୧୨ ͲǤͷɀ ୧ ɀ ୨ ൯ ୧ ୨ ɐ ୧ ɐ ୨ μ ୧ μɀ ୧ μ ୨ μɀ ୨ ɀ ୧ ǡ ɀ ୨ ൧൩ (3.14) where: ɐ ୧ = estimate of the standard deviation of flows at site i K i = T-year frequency factor for the distribution used ୧ = record length at site i ɀ ୧ = station skew at site i ୧୨ = concurrent record length of sites i and j ɏ ୧୨ = estimate of the lag zero correlation of flows between sites i and j ɀ ୧ ǡ ɀ ୨ ൧ = covariance matrix estimator, 12
16 ɀ ୧ ǡ ɀ ୨ ൧ ɏ ஓౠ ஓ ඥሺሾɀ ୧ ሿሾɀ ୧ ሿሻ (3.15) Methodologies for estimating station skew are presented in IACWD (1982). The cross correlation ቀɏ ஓౠ ஓ ቁ is estimated using the approximation developed by Martins and Stedinger (2002), ஔ ɏ ஓౠ ஓ ൫ɏ ୧୨ ൯ ቆ ୧୨ ට൫ ୧୨ ୧ ൯൫ ୧୨ ୨ ൯ቇ (3.16) and Griffis (2003) provides and approximation for ሺሾɀ ୧ ሿሾɀ ୧ ሿሻ, ሾɀ ୧ ሿ ୧ ሺ ୧ ሻ൨ ͳ ቆ ͻ ሺ ୧ሻቇ ɀ ୧ ଶ ൭ ͳͷ Ͷͺ ሺ ୧ሻ൱ ɀ ୧ ସ ൩ (3.17) The model error variance ɐ ஔ ଶ and the vector of regression coefficients Ⱦ are estimated jointly by iteratively searching for a nonnegative solution to the equation (Stedinger and Tasker, 1985), ൫ כ ߪ൯ ൫ߚ ఋ ଶ ܫ כ ȭ൯ ଵ ൫ כ ൯ߚ ሺ ͳሻ (3.18) where ɐ ଶ ஔ is the estimator of the unknown model error variance and Ⱦ is given by Eq.(3.10). This method takes approximately eighty times the effort required to the OLS analysis because of the need to research and calculate many intermediate parameter values Regression Analysis Results The mean square error was used as an indicator of the goodness of fit of the regression model. The mean square error is defined as average squared difference between the observed and estimated values as defined by: ܧ ܯ ଶ ͳ ଵ ͳ ൫ ൯ ଶ ଵ (3.19) Table 5 shows the mean square error produced by the different models. These results are presented graphically in Figure 7. 13
17 Table 5: Mean Square Error Comparison. Equation OLS MNS GLS Q Q Q Q Q mean Results of Table 5 show that the best fit to the observed data is provided by the GLS method, and the worst fit is provided by the OLS method. Results of MNS method are close to the GLS results. Based on these results, the GLS model was selected as the model which provides the best approximation to the observed data. Table 6 presents the regression parameters obtained from the GLS analysis. Table 6: Regression Equation Parameters for Estimating Runoff. Parameter Regression Coefficients Q mean Q 90 Q 95 Q 98 Q a 9.869E E E E E-07 b c The following are the equations obtained from this analysis: ͻǥͺͻ כ ͳͳ ସ כ ܣ ଵǤହ כ ଵǤ ଽ Ǥͳʹ כ ͳͳ כ ܣ Ǥଽ כ ଶǤହ ଽହ ͺǤͻͷͺ כ ͳͳ כ ܣ ଵǤଵ כ ଶǤଽ ଽ ʹǤʹ כ ͳͳ כ ܣ ଵǤହ כ ଷǤଶ ଽଽ ͳǥʹ כ ͳͳ כ ܣ ଵǤହଽ כ ଷǤଷ (3.20) (3.21) (3.22) (3.23) (3.24) Figure 9 to Figure 13 compare actual streamflows to the values estimated by the regression equations. The equations produce a good fit to the observed data when the estimated flow exceeds 2 cfs (Figure 14). When the estimated values were less than 2 cfs 14
18 the equations are not reliable, as can be seen in Figure 14. Figure 15 shows how the percent error between the observed and estimated values increases as the estimated flow decreases. Stations with estimated low flow less than 2 cfs and large error correspond to small south coast watershed Station Index Method The station index method determines streamflow at an ungaged site using as reference a streamflow data from a nearby gage station. The most common procedure is the Drainage-Area ratio method. This method computes the streamflow at the ungaged location based on the ratio of drainage areas between the gaged and ungaged location. This method is suitable when the mean annual rainfall is similar for both watersheds. This method is defined by the following equation: where: ௨ = minimum streamflow at the ungaged site = minimum streamflow at the gaged site ௨ = drainage area at the ungaged site ܣ = drainage area at the gaged site ܣ ௨ ܣ ௨ ܣ (3.25) However in Puerto Rico rainfall variations are frequently large over short distances due to orographic effects. Because of this a more appropriate method to use in Puerto Rico is to translate the data from the gaged site to the ungaged site by the ratio of mean flows computed by the regression equation (Eq. 3.20). The following equation defines this method: where: ଵǤହܣ ௨ כ ௨ଵǤ כ ଵǤହ ܣ (3.26) ଵǤ ௨ ௨ ௨ = minimum streamflow at the ungaged site = minimum streamflow at the gaged site ௨ = mean streamflow computed at ungaged site (Eq. 3.20) = mean streamflow computed at gaged site (Eq. 3.20) ௨ = mean annual rainfall (in/yr) at ungaged site = mean annual rainfall (in/yr) at gaged site 15
19 4. CONCLUSIONS AND RECOMMENDATIONS This report presents a new mean annual rainfall map for Puerto Rico (Figure 5 and Figure 6). Regional regression equations (Eq to 3.24) for mean discharge and for minimum streamflow (Q m, Q 90, Q 95, Q 98, and Q 99) are presented in section of this report. The regression equations are not reliable for estimated discharges less than 2.0 cfs (Figure 14 and Figure 15). The regional regression equations are not suitable for watersheds with less than 1 square mile of drainage area. In these small watersheds factors such as vegetative cover, soils and local groundwater interactions and the possibility of unknown private withdrawals, have a much larger role in determining low flow. 16
20 5. REFERENCES Calvesbert, R.J., 1970, Climate of Puerto Rico and U.S. Virgin Islands, revised: U.S. Environmental Science Services Administration, Climatography of the United States. Chowdury, J.U. and Stedinger, J.R., Confidence interval for design floods with estimated skew coefficient. Journal of Hydraulic Engineering, 117 (7), Ewel, J.J. and Whitemore, J.L., The Ecological Life Zones of Puerto Rico and the U.S. Virgin Islands. Puerto Rico. Griffis, V.W., Evaluation of Log-Pearson type 3 Flood Frequency Analysis Methods Addressing Regional Skew and Low Outliers. M.S. Thesis, Cornell University. Griffis, V. W. and Stedinger, J. R., The use of GLS regression in regional hydrologic analyses. Journal of Hydrology, 344(1-2), Interagency Committee on Water Data (IACWD), Guidelines for Determining Flood Flow Frequency: Bulletin 17-B (revised and corrected). Hydrology Subcommittee, Washington, DC, March 1982, pp. 28. Martins, E.S. and Stedinger, J.R., Cross correlations among estimators of shape. Water Resources Research, 38 (11), doi: /2002wr McCuen, R.H., Microcomputer Applications in Statistical Hydrology. New Jersey: Prentice Hall. Moss, M.E. and Tasker, G.D., An intercomparison of hydrological network-design technologies. Hydrology Scientific Journal, 36 (3), 209. Stedinger, J.R. and Tasker, G.D., Regional hydrologic analysis 1. Ordinary, weighted, and generalized least squares compared. Water Resources Research, 21 (9), Stedinger, J.R. and Tasker, G.D., Regional hydrologic analysis 2. Model-error estimators, estimation of sigma and log-pearson type 3 distributions. Water Resources Research, 22 (10), Tasker, G.D. and Stedinger, J.R., An operational GLS model for hydrologic regression. Journal of Hydrology, 111,
21 F I G U R E S


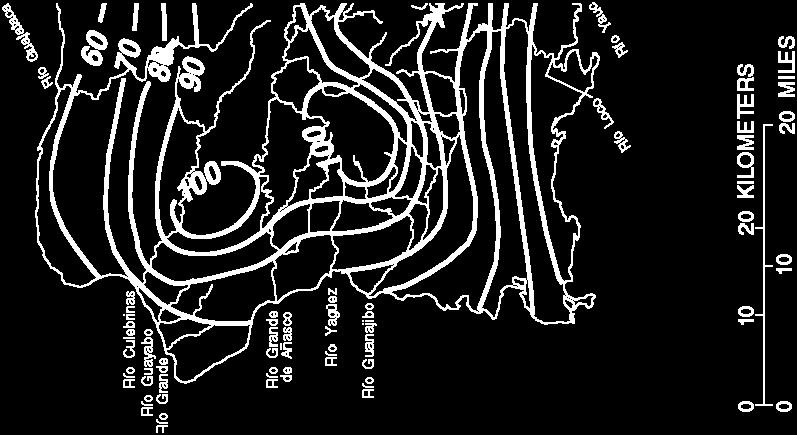
22 67 20'0"W 67 10'0"W 67 0'0"W 66 50'0"W 66 40'0"W 66 30'0"W 66 20'0"W 66 10'0"W 66 0'0"W 65 50'0"W 65 40'0"W 65 30'0"W 18 40'0"N ± 17 40'0"N 17 40'0"N 17 50'0"N 17 50'0"N 18 0'0"N 18 0'0"N 18 10'0"N 18 10'0"N 18 20'0"N 18 20'0"N 18 30'0"N 18 40'0"N 18 30'0"N 67 20'0"W 67 10'0"W 67 0'0"W 66 50'0"W 66 40'0"W 66 30'0"W 66 20'0"W 66 10'0"W 66 0'0"W 65 50'0"W 65 40'0"W 65 30'0"W Figure 1: Mean annual rainfall, prepared using rainfall data from 1931 to 1960 (Calversbert, 1970).
23 67 10'0"W 67 0'0"W 66 50'0"W 66 40'0"W 66 30'0"W 66 20'0"W 66 10'0"W 66 0'0"W 65 50'0"W 65 40'0"W 18 40'0"N ± 18 40'0"N 18 0'0"N 18 10'0"N 18 20'0"N 18 30'0"N!! SABANA GRANDE 2 ENE 11% LAJAS SUBSTN 15% ISABELA SUBSTN 11%! YAUCO 1 NW 15%! NEGRO-COROZAL TORO NEGRO PLT 2 15% 11%! CAGUAS 1 W RIO BLANCO LOWER JAYUYA 15% 18% 13%!!! TORO NEGRO FOREST 23% AIBONITO 1 S!! 14% SAN LORENZO ESPINO PENUELAS SALTO GARZAS! 11% 17%!!! PENUELAS 1 NE 25% POTALA 12% SAN JUAN CITY 25% MELANIA DAM 12%!!!! RIO PIEDRAS EXP STN 12%! CARITE DAM 18% 18 0'0"N 18 10'0"N 18 20'0"N 18 30'0"N 17 50'0"N 17 50'0"N 17 40'0"N Rainfall Station! Stations Name Difference Percent 17 40'0"N 67 10'0"W 67 0'0"W 66 50'0"W 66 40'0"W 66 30'0"W 66 20'0"W 66 10'0"W 66 0'0"W 65 50'0"W 65 40'0"W Figure 2: Rain gages with more than 10% difference in mean annual rainfall between station data and DNER (2003) rainfall map.
24 67 10'0"W 67 0'0"W 66 50'0"W 66 40'0"W 66 30'0"W 66 20'0"W 66 10'0"W 66 0'0"W 65 50'0"W 65 40'0"W 18 0'0"N 18 10'0"N 18 20'0"N 18 30'0"N ± Legend 18 0'0"N 18 10'0"N 18 20'0"N 18 30'0"N Rainfall Gage Stations 67 10'0"W 67 0'0"W 66 50'0"W 66 40'0"W 66 30'0"W 66 20'0"W 66 10'0"W 66 0'0"W 65 50'0"W 65 40'0"W Station Name ID Station Name ID Station Name ID Station Name ID Station Name ID Station Name ID Station Name ID Rincón 1 Guajataca Dam 18 Garzas 35 Manatí 2 E 52 Candelaria Toa Baja 69 Cayey 1 E 86 Maunabo 103 Puerto Real 2 Lares 19 Peñuelas 1 NE 36 Morovis 1 N 53 Candelaria Toa Baja 70 Guavate Camp 87 Río Grande el Verde 104 Borinquen AP 3 Maricao Fish Hatchery 20 Peñuelas Salto Garzas 37 Corozal Substn 54 Comerío Falls Plt 2 71 Jajome Alto 88 Río Blanco Upper 105 Calero Camp 4 Maricao 2 SSW 21 Central San Francisco 38 Negro-Corozal 55 Barranquitas 72 Carite Dam 89 Pico del Este 106 Isabela Substn 5 Indiera Alta 22 Cambalache Exp Forest 39 Matrullas Dam 56 Aibonito 1 S 73 Carite Plt 1 90 Río Blanco Lower 107 Mora Camp 6 Sabana Grande 2 ENE 23 Barceloneta 3 SW 40 Toro Negro Forest 57 Sabater 74 Patillas Dam 91 Paraíso 108 Coloso 7 Yauco 1 NW 24 Barceloneta 2 41 Aceituna 58 Aguirre 75 Melania Dam 92 San Cristóbal 109 San Sebastián 2 WNW 8 Santa Rita 25 Monte Bello Manatí 42 Villalba 1 SE 59 Aguirre 76 Guayama 2E 93 Humacao 2 SSE 110 Mayagüez City 9 Ensenada 1 W 26 Caonillas Utuado 43 Caonillas Villalba 60 San Juan City 77 Patillas 94 Fajardo 111 Hacienda Constanza 10 Hato Arriba Arecibo 27 Cerro Gordo Ciales 44 Guayabal 61 Cataño 78 Canóvanas 95 Roosevelt Roads 112 Mayagüez AP 11 Los Caños 28 Jayuya 45 Juana Díaz Camp 62 Río Piedras Exp Stn 79 Gurabo Substn 96 Vieques Island 113 Benavente-Hormigueros 12 Arecibo 3 Ese 29 Cacaos-Orocovis 46 Río Cañas 63 San Juan Intl Ap 80 Gurabo 97 Culebra Island 114 Cabo Rojo 13 Arecibo Obsy 30 Cerro Maravilla 47 Coamo 2 SW 64 La Muda Caguas 81 Juncos 1 SE 98 San Germán 4 W 14 Dos Bocas 31 Toro Negro PLT 2 48 Río Jueyes 65 Trujillo Alto 2 SSW 82 San Lorenzo Farm 2 NW 99 Lajas Substn 15 Utuado 32 Corral Viejo 49 Santa Isabel 2 ENE 66 Caguas 1 W 83 San Lorenzo 3S 100 Magüeyes Island 16 Adjuntas Substn 33 Ponce 4 E 50 Dorado 2 Wnw 67 Caguas 84 San Lorenzo Espino 101 Quebradillas 17 Adjuntas 1 NW 34 Ponce City 51 Toa Baja 1 SSW 68 Cidra 1 E 85 Yabucoa 1 NNE 102 Figure 3: National Climatic Data Center rainfall gage stations used to generate mean annual rainfall map.
25 180 Rainfall-Runoff Relationship Runoff Depth (in/ yr) Runoff = 1.15* Rainfall c Rainfall Depth (in/ yr) Figure 4: Rainfall-runoff relationship resulting from the final mean annual rainfall map.
26 Figure 5: Mean annual rainfall surface map for Puerto Rico.

27 Figure 6: Mean annual rainfall contours map for Puerto Rico.
28 67 10'0"W 67 0'0"W 66 50'0"W 66 40'0"W 66 30'0"W 66 20'0"W 66 10'0"W 66 0'0"W 65 50'0"W 65 40'0"W 18 40'0"N ± 18 40'0"N 18 30'0"N 18 30'0"N '0"N 18 10'0"N '0"N 18 10'0"N '0"N '0"N 17 50'0"N Legend 17 50'0"N USGS Gage Stations 17 40'0"N Watershed Limits Reservoirs Rivers 17 40'0"N 67 10'0"W 67 0'0"W 66 50'0"W 66 40'0"W 66 30'0"W 66 20'0"W 66 10'0"W 66 0'0"W 65 50'0"W 65 40'0"W Figure 7: USGS streamflow gage stations location used in regression analysis.
29 1,000 Comparison of Mean Square Error for the Different Regression Models Mean Square Error OLS GLS MNS GLS MNS OLS GLS c MNS OLS GLS MNS OLS GLS MNS OLS 1 Qmean Q90 Q95 Q98 Q99 Regression Methods Figure 8: Comparison of Mean Square Error for the different regression models.
30 1,000 Mean Streamflow Q mean = 9.869*10-04 * A * P Predicted Qmean (cfs) ,000 Observed Qmean (cfs) Figure 9: Relation between observed and predicted Q mean flow.
31 100 90% Excedence Streamflow Q 90 = 3.127*10-06 * A * P Predicted Q90 (cfs) Observed Q90 (cfs) Figure 10: Relation between observed and predicted Q 90 flow.
32 100 95% Excedence Streamflow Q 95 = 8.985*10-07 * A * P Predicted Q95 (cfs) Observed Q95 (cfs) Figure 11: Relation between observed and predicted Q 95 flow.
33 100 98% Excedence Streamflow Q 98 = 2.237*10-07 * A * P Predicted Q98 (cfs) Observed Q98 (cfs) Figure 12: Relation between observed and predicted Q 98 flow.
34 100 99% Excedence Streamflow Q 99 = 1.237*10-07 * A * P Predicted Q99 (cfs) Observed Q99 (cfs) Figure 13: Relation between observed and predicted Q 99 flow.
35 Comparison between Observed and Estimated Values Above line flows are over estimated Estimated Flow (cfs) 2 cfs Range of values not suitable for use the equations Below line flows are over underestimated Observed Flow (cfs) Figure 14: Relation between observed and predicted flow for all recurrence intervals compared to line of perfect correlation to gage station data.
36 Comparison of Absolute Error between Observed and Estimated Values 100 Q90 10, Q95 Q98 Q99 Percent of Error (Mean) Absolute Error 1,000 Absolute Error (cfs) 1 c 100 Percent of Error (%) cfs Estimated Flow (cfs) Figure 15: Error between observed and predicted values for the different return intervals.
37 A P P E N D I X E S
38 APPENDIX A: SAMPLE CALCULATIONS A-1
39 Example 1: Determination of Q 99 at Río Bauta using the Station Index Method. The station index method can be used if there is a gage station near the interest point watershed with enough data to perform an exceedance analysis (>10 years). The data from the gaged site is translated to the ungaged site by the ratio of mean flows computed by the regression equation (Eq. 3.20). In this example, the Q 99 of a point at Río Bauta is desired. The interest point is located downstream the USGS gage station Río Bauta Station ( ) as presented in Figure A-1. Information of the interest point: Watershed area (A) = mi 2 Mean annual rainfall (P) = in Information of the gage site: Watershed area (A) = mi 2 Mean annual rainfall (P) = in Q 99g obtained from the USGS Streamflow Data = 3.4 cfs Calculate Q mean for both sites using Equation (3.20): ͻǥͺͻ כ ͳͳ ସ ܣ כ ଵǤହ כ ଵǤ Ungaged site: ͻǥͺͻ כ ͳͳ ସ כ ʹͺǤʹͻ ଵǤହ כ ͺͲǤͷͶ ଵǤ ݏͻͳǤ ͺ Gaged site: ͻǥͺͻ כ ͳͳ ସ כ ͳǥͷ ଵǤହ כ ͺͲǤͳʹଵǤ ݏ ʹ ͷͳǥͷ Determine Q 99 for the ungaged site with the Equation (3.26): ଽଽ௨ ௨ ଽଽ ଽଽ௨ ൬ ͻͳǥ ͺ ͷͳǥͷʹ൰ ǤͶ Ǥ A-2


40 Interest Point Ungaged Site Limit Río Bauta Station ( ) Río Bauta Station Site (Gaged Site) Limit Figure A-1: Example 1. Q 99 of an ungaged site at Río Bauta is determined using USGS Río Bauta Stations ( ) as reference.
41 Example 2: Determination of Q 99 at Río Cialitos using the Station Index Method. As in Example 1, the interest point is near a gage station thus the Station Index method can be applied (Figure A-2). The interest point is located in Río Cialitos (Figure A-2) and the Q 99 this point will be estimated using the streamflow data of the Río Bauta Station ( ). Information of the interest point: Watershed area (A) = mi 2 Mean annual rainfall (P) = in Information of the gage site: Watershed area (A) = mi 2 Mean annual rainfall (P) = in Q 99 obtained from the USGS Streamflow Data = 3.4 cfs Calculate Q mean for both sites with Equation (3.20): ͻǥͺͻ כ ͳͳ ସ ܣ כ ଵǤହ כ ଵǤ Ungaged site: ͻǥͺͻ כ ͳͳ ସ כ ͳͷǥͷͺଵǥହ כ ͺͲǤͳ ଵǤ ݏ ʹ ͶǤͶ Gaged site: ͻǥͺͻ כ ͳͳ ସ כ ͳǥͷ ଵǤହ כ ͺͲǤͳʹଵǤ ݏ ʹ ͷͳǥͷ Determine Q 99 for the ungaged site with the Equation (3.26): ଽଽ௨ ௨ ଽଽ ଽଽ௨ ൬ ͶǤͶʹ ͷͳǥͷʹ൰ ǤͶ Ǥ A-4

 Figure A-2:")


42 Interest Point Ungaged Site Limit Río Bauta Station Site (Gaged Site) Limit Río Bauta Station ( ) Figure A-2: Example 2. Q 99 of an ungaged site with an intake at Río Cialitos is determined using USGS Río Bauta Stations ( ) as reference.
43 Example 3: Determination of Q 99 at Río Bauta using the Regression Equation. If there is no streamflow station near the interest point, the minimum flows can be estimated using Equation (3.24. For this example, data from Example 1 will be used for comparison purposes. Example 1 information of the site: Watershed area (A) = mi 2 Mean annual rainfall (P) = in Determine Q 99 using Equation (3.24: ଽଽ ͳǥʹ כ ͳͳ ܣ כ ଵǤହଽ כ ଷǤଷ ଽଽ ͳǥʹ כ ͳͳ כ ʹͺǤʹͻ ଵǤହଽ כ ͺͲǤͷͶ ଷǤଷ ૠ ૡǤ A-6
$ FACTS ABOUT PUERTO RICO: WAGE HOUSING MOST EXPENSIVE AREAS WAGE RANKING
 STATE #52 * RANKING In Puerto Rico, the Fair Market Rent () for a two-bedroom apartment is $480. In order this level of and utilities without paying more than 30% of income on housing a household must
$9.68 PER HOUR STATE HOUSING WAGE
 PUERTO RICO STATE #2 * RANKING In Puerto Rico, the Fair Market Rent () for a two-bedroom apartment is $04. In order to afford this level of and utilities without paying more than of income on housing a
October 10, Michael Moriarty Mitigation Division Director FEMA Region II
 U. S. Department of Homeland Security Region II One World Trade Center, 52nd Floor New York, NY 10007 October 10, 2017 MEMORANDUM FOR: Alejandro De La Campa Federal Coordinating Officer FEMA-4339-DR &
Hazus: Estimated Damage and Economic Losses. Puerto Rico, United States
 HURRICANE MARIA Initial Hazus Run, 27 November 2017 ARA wind field Hazus: Estimated and Economic es, United States Initial Hazus Wind Estimates for Hurricane Maria using the ARA wind field. Note: Model
How Maria Forges PR s Future
 H.Calero Consulting Group, Inc. How Maria Forges PR s Future Assessment and Forecast An economy in recession Real GNP growth, % High Moderate Negative 8.0% 0% -1.1% Source: PR Planning Board with investment
GDB Supplemental Information
 GDB Supplemental Information May 2017 Table of Contents I. Summary of Outstanding Loan and Deposit Balances II. Summary Detail of Municipal Cash Flow Projections and Loan Detail III. Summary of Gross Deposits
Final Report Waste Characterization Study
 Final Report Waste Characterization Study Prepared For: Prepared By: October 24, 2003 1 INTRODUCTION AND BACKGROUND The Solid Waste Management Authority of Puerto Rico (SWMA) contracted with Wehran Puerto
Agenda RECOVERY UPDATES HURRICANE HARVEY HURRICANE IRMA HURRICANE MARIA USPS COMMUNICATION
 October 4, 2017 1 Agenda RECOVERY UPDATES HURRICANE HARVEY HURRICANE IRMA HURRICANE MARIA USPS COMMUNICATION 2 3 Harvey Recovery Texas All Plants operational, including BMEUs and drop shipments Customers
Children in Puerto Rico: Results from the 2000 Census. By Mark Mather
 Children in Puerto Rico: Results from the 2000 Census By Mark Mather The Annie E. Casey Foundation and the Population Reference Bureau August 2003 KIDS COUNT KIDS COUNT, a project of the Annie E. Casey
Dynamic Itinerary for Infrastructure Projects Public Policy Document
 Apartado 40285 San Juan, Puerto Rico 00940 Dynamic Itinerary for Infrastructure Projects May 2008 Report Prepared By: MP Engineers of Puerto Rico, P.S.C. Las Vistas Shopping Village 300 Ave Felisa Rincon
Case 3:14-cv Document 1 Filed 02/19/14 Page 1 of 12 IN THE UNITED STATES DISTRICT COURT FOR THE DISTRICT OF PUERTO RICO
 Case 3:14-cv-01136 Document 1 Filed 02/19/14 Page 1 of 12 IN THE UNITED STATES DISTRICT COURT FOR THE DISTRICT OF PUERTO RICO MUNICIPALITY OF SAN SEBASTIAN Plaintiff CIVIL NO. 14-1136 CIVIL RIGHTS DECLARATORYJUDGMENT
Evidence from the FRBNY Puerto Rico Small Business Survey REGIONAL PERSPECTIVES ON PUERTO RICO SMALL BUSINESS
 Evidence from the FRBNY Puerto Rico Small Business Survey REGIONAL PERSPECTIVES ON PUERTO RICO SMALL BUSINESS I Evidence from the FRBNY Puerto Rico Small Business Survey REGIONAL PERSPECTIVES ON PUERTO
A Conceptual Framework for Measuring the Exposure to Tsunamis of Puerto Rican Coastal Communities
 Meulaboh, Aceh A Conceptual Framework for Measuring the Exposure to Tsunamis of Puerto Rican Coastal Communities Jean-Edouard Faucher Saylisse Dávila, PhD Department of Industrial Engineering University
Puerto Rico Department of Transportation and Public Works Highway and Transportation Authority
 Puerto Rico Department of Transportation and Public Works Highway and Transportation Authority San Juan Urbanized Area (SJUA) Urbanized Areas Under 200,000 in Population (UZA) Aguadilla Urbanized Area
Simple practices to improve and optimize on site wastewater disposal systems (OSDS) in Special Communities of Río Grande de Añasco Watershed
 in Special Communities of Río Grande de Añasco Watershed") Simple practices to improve and optimize on site wastewater disposal systems (OSDS) in Special Communities of Río Grande de Añasco Watershed UNIVERSITY OF PUERTO RICO Mayagüez Campus Ana Navarro, Sea Grant
Simple practices to improve and optimize on site wastewater disposal systems (OSDS) in Special Communities of Río Grande de Añasco Watershed UNIVERSITY OF PUERTO RICO Mayagüez Campus Ana Navarro, Sea Grant
Hydrological study for the operation of Aposelemis reservoir Extended abstract
 Hydrological study for the operation of Aposelemis Extended abstract Scope and contents of the study The scope of the study was the analytic and systematic approach of the Aposelemis operation, based on
MANAGING FRESHWATER INFLOWS TO ESTUARIES
 MANAGING FRESHWATER INFLOWS TO ESTUARIES Yuna River Hydrologic Characterization A. Warner Warner, A. (2005). Yuna River Hydrologic Characterization. University Park, Pennsylvania: The Nature Conservancy.
NEW PSG Pharmacy Network
 4001587 Farmacia Giannoni INDEPENDENT Adjuntas SurOeste 1790829448 787-829-3870 4020157 Farmacia Hospital General Castañer INDEPENDENT Adjuntas SurOeste 1336341379 787-829-3215 4000321 Farmacia Jenny,
Regional Economic Conditions
 Regional Economic Conditions Jason Bram, Research Officer Community Advisory Group Meeting March 29, 2018 The views expressed here are those of the presenter and do not necessarily represent those of the
Service Sector: Puerto Rico as a Knowledge-Exporting Economy. Javier Vázquez-Morales, Esq. Puerto Rico Industrial Development Company
 Service Sector: Puerto Rico as a Knowledge-Exporting Economy Javier Vázquez-Morales, Esq. Puerto Rico Industrial Development Company Manufacturing: Key Component of Puerto Rico s Economy for Decades Puerto
Puerto Rico Seismic Network Response Guide for Puerto Rico and the Virgin Islands Region LANTEX 12 EXERCISE
 Puerto Rico Seismic Network Response Guide for Puerto Rico and the Virgin Islands Region LANTEX 12 EXERCISE Tsunami Warning Exercise March 28 th, 2012 Puerto Rico Seismic Network Geology Department University
Population Composition, Geographic Distribution, and Natural Hazards: Vulnerability in the Coastal Regions of Puerto Rico
 Population Composition, Geographic Distribution, and Natural Hazards: Vulnerability in the Coastal Regions of Puerto Rico Researchers Havidán Rodríguez, Ph.D. (DRC-UDel) Walter Díaz, Ph. D. (CISA-UPRM)
Hydrology Input for West Souris River IWMP
 Hydrology Input for West Souris River IWMP Prepared by: Mark Lee Manitoba Water Stewardship 1 1 1 Overall view of: drainage area watershed characteristics gauging stations meteorological stations Runoff
LIHTC Properties in Puerto Rico through 2015
 LIHTC Properties in Puerto Rico through 2015 nprofit PIS ALAMEDA II 4 CARR 21 SAN JUAN PR 1988 t Indicated 1988 Acquisition and Rehab 150 150 ALAMEDA TOWER III SAN JUAN PR 1989 $533,862 1989 Acquisition
4 *Contours generalized for estimating average watershed precipitation; adopted from larger map by Geomatrix, 1999.
 Selected USGS Stream Gaging Stations San Lorenzo River watershed A. Pescadero Ck B. San Lorenzo R. Waterman Switch C. Boulder Ck D. Zayante Ck E. Bean Ck F. San Vicente Ck G. San Lorenzo R. at Big Trees
SATISFIED CUSTOMERS AND PROJECTS COMPLETED
 SATISFIED CUSTOMERS AND PROJECTS COMPLETED Volleyball Equipment - 2010 Central American And Caribbean Games, Boquerón Sport Flooring Warm-Up Courts- Palacio de Recreación y Deportes at the Municipality
Produced by: Destination Research Sergi Jarques, Director
 Produced by: Destination Research Sergi Jarques, Director Economic Impact of Tourism Oxfordshire - 2015 Economic Impact of Tourism Headline Figures Oxfordshire - 2015 Total number of trips (day & staying)
The Housing Crisis in Puerto Rico and the Impact of Hurricane Maria*
 The Housing Crisis in Puerto Rico and the Impact of Hurricane Maria* Jennifer Hinojosa and Edwin Meléndez *We would like to acknowledge the invaluable comments on an earlier version from: the staff from
TREN URBANO TITLE VI REQUIREMENTS SURVEY MARCH 2015 PREPARED BY FRANCISCO E. MARTINEZ, MSCE, PE
 TREN URBANO TITLE VI REQUIREMENTS SURVEY MARCH 2015 PREPARED BY FRANCISCO E. MARTINEZ, MSCE, PE FOR: Alternate Concepts, Inc. April 22, 2015 TABLE OF CONTENT 1. INTRODUCTION... 1 2. METODOLOGY... 2 2.1
INACTIVE SITES LUST LIST
 00-0008 Former Ramey Air Force Base Aguadilla U.S. Naval Station Roosevelt Roads Building # 561 Ramey AFB Yes 14-Jan-04 Ust Removal 30-Jan-96 00-0016 Building 445 & 449 San Juan Parada 71/2 San Juan Naval
Produced by: Destination Research Sergi Jarques, Director
 Produced by: Destination Research Sergi Jarques, Director Economic Impact of Tourism Epping Forest - 2014 Economic Impact of Tourism Headline Figures Epping Forest - 2014 Total number of trips (day & staying)
LESOTHO HIGHLANDS DEVELOPMENT AUTHORITY
 LESOTHO HIGHLANDS DEVELOPMENT AUTHORITY ANNUAL FLOW RELEASES INSTREAM FLOW REQUIREMENT (IFR) IMPLEMENTATION AND MONITORING (October 2004 to September 2005) TOWER ON MALIBAMATŠO RIVER @ KAO REPORT N0.6
January 2018 Air Traffic Activity Summary
 January 2018 Air Traffic Activity Summary Jan-2018 Jan-2017 CY-2018 CY-2017 Passengers 528,947 505,421 4.7% 528,947 505,421 4.7% Passengers 537,332 515,787 4.2% 537,332 515,787 4.2% Passengers 1,066,279
Measuring Ground Delay Program Effectiveness Using the Rate Control Index. March 29, 2000
 Measuring Ground Delay Program Effectiveness Using the Rate Control Index Robert L. Hoffman Metron Scientific Consultants 11911 Freedom Drive Reston VA 20190 hoff@metsci.com 703-787-8700 Michael O. Ball
Formulation of econometric solutions of immediate resources for a disaster area in Mayagüez, Puerto Rico
 Department of Civil Engineering and Surveying University of Puerto Rico Mayagüez Campus Formulation of econometric solutions of immediate resources for a disaster area in Mayagüez, Puerto Rico Coral A.
The Seychelles National Meteorological Services. Mahé Seychelles
 Report for the fishermen Finding the best days to process sea-cucumber in the Seychelles during the months of March, April and May. The Seychelles National Meteorological Services Mahé Seychelles By: Hyacinth
Produced by: Destination Research Sergi Jarques, Director
 Produced by: Destination Research Sergi Jarques, Director Economic Impact of Tourism North Norfolk District - 2016 Contents Page Summary Results 2 Contextual analysis 4 Volume of Tourism 7 Staying Visitors
Produced by: Destination Research Sergi Jarques, Director
 Produced by: Destination Research Sergi Jarques, Director Economic Impact of Tourism Norfolk - 2016 Contents Page Summary Results 2 Contextual analysis 4 Volume of Tourism 7 Staying Visitors - Accommodation
Puerto Rico in the Aftermath of Hurricanes Irma and Maria Jason Bram, Officer Research Economist
 Puerto Rico in the Aftermath of Hurricanes Irma and Maria Jason Bram, Officer Research Economist March 7, 2018 The views expressed here are those of the presenter and do not necessarily represent those
HYDRAULIC DESIGN OF THE TOURISTIC BERTHING IN ASWAN CITY
 HYDRAULIC DESIGN OF THE TOURISTIC BERTHING IN ASWAN CITY Dr. Hossam El-Sersawy Researcher, Nile Research Institute (NRI), National Water Research Center (NWRC), Egypt E-mail: h_sersawy@hotmail.com Dr.
Monthly Pass Corporate Channel Non-Participating Locations
 Monthly Pass Corporate Channel Non-Participating Locations Monthly Pass is sold in most locations in the U.S. The following is a list of areas where Monthly Pass is not provided through your employer or
Produced by: Destination Research Sergi Jarques, Director
 Produced by: Destination Research Sergi Jarques, Director Economic Impact of Tourism Norfolk - 2017 Contents Page Summary Results 2 Contextual analysis 4 Volume of Tourism 7 Staying Visitors - Accommodation
San Juan Harbor Navigation Improvements Feasibility Study
 San Juan Harbor Navigation Improvements Feasibility Study DRAFT Economics Appendix RELEASED 8/8/17 1 EXECUTIVE SUMMARY San Juan Harbor is located on the northeastern coast of Puerto Rico and is the island
PERFORMANCE MEASURE INFORMATION SHEET #16
 PERFORMANCE MEASURE INFORMATION SHEET #16 ARROW LAKES RESERVOIR: RECREATION Objective / Location Recreation/Arrow Lakes Reservoir Performance Measure Access Days Units Description MSIC 1) # Access Days
International Osoyoos Lake Board of Control Annual Report to the International Joint Commission
 International Osoyoos Lake Board of Control 2015 Annual Report to the International Joint Commission Cover: Northern extent of Osoyoos Lake, where the Okanagan River enters the lake, 2015. View is to the
ATM Network Performance Report
 ATM Network Performance Report 2018. Page 1 of 16 Table of contents Summary... 3 Network Wide Performance... 4 Airborne delay... 4 Sydney... 6 Airborne delay... 6 Notable events... 6 Melbourne... 9 Airborne
Produced by: Destination Research Sergi Jarques, Director
 Produced by: Destination Research Sergi Jarques, Director Economic Impact of Tourism Oxfordshire - 2016 Economic Impact of Tourism Headline Figures Oxfordshire - 2016 number of trips (day & staying) 27,592,106
The Geography of Climate
 The Geography of Climate Objective for Today: Today we will examine ways that latitude and landforms influence climate The focus of our study will be the South American Continent in the Formal Region known
Commissioned by: Economic Impact of Tourism. Stevenage Results. Produced by: Destination Research
 Commissioned by: Produced by: Destination Research www.destinationresearch.co.uk December 2016 Contents Page Introduction and Contextual Analysis 3 Headline Figures 5 Volume of Tourism 7 Staying Visitors
Economic Impact of Tourism. Hertfordshire Results. Commissioned by: Visit Herts. Produced by:
 Commissioned by: Visit Herts Produced by: Destination Research www.destinationresearch.co.uk December 2016 Contents Page Introduction and Contextual Analysis 3 Headline Figures 5 Volume of Tourism 7 Staying
Watershed Runoff Analysis
 CREATING SOLUTIONS FOR A CHANGING WORLD Watershed Runoff Analysis April 18, 2017 John Melack, UCSB Ed Beighley & Dongmei Feng, Northeastern University Study Workflow Civil and Environmental Engineering
Hydraulic Report. Trail 5 Snowmobile Trail Over Mulligan Creek. Prepared By: COLEMAN ENGINEERING COMPANY Karisa V. Falls, P.E.
 Prepared for: Prepared by: Marquette County Road Commission Coleman Engineering Company Marquette, Michigan Iron Mountain, MI December 2011 Hydraulic Report Trail 5 Snowmobile Trail Over Mulligan Creek
Blocking Sea Intrusion in Brackish Karstic Springs
 European Water 1/2: 17-23, 3. 3 E.W. Publications Blocking Sea Intrusion in Brackish Karstic Springs The Case of Almiros Spring at Heraklion Crete, Greece A. Maramathas, Z. Maroulis, D. Marinos-Kouris
International Osoyoos Lake Board of Control Annual Report to the International Joint Commission
 International Osoyoos Lake Board of Control 2013 Annual Report to the International Joint Commission TABLE OF CONTENTS ACTIVITIES OF THE BOARD... 1 HYDROLOGIC CONDITIONS IN 2013... 2 Drought Criteria...
Airport Capacity, Airport Delay, and Airline Service Supply: The Case of DFW
 Airport Capacity, Airport Delay, and Airline Service Supply: The Case of DFW Faculty and Staff: D. Gillen, M. Hansen, A. Kanafani, J. Tsao Visiting Scholar: G. Nero and Students: S. A. Huang and W. Wei
International Osoyoos Lake Board of Control Annual Report to the International Joint Commission
 International Osoyoos Lake Board of Control 2010 Annual Report to the International Joint Commission TABLE OF CONTENTS ACTIVITIES OF THE BOARD... 1 HYDROLOGIC CONDITIONS IN 2010... 2 Drought Criteria...
U.S. Fish & Wildlife Service. Critical Habitat Designations for Puerto Rico and the U.S. Virgin Islands
 U.S. Fish & Wildlife Service Critical Habitat Designations for Puerto Rico and the U.S. Virgin Islands 2007 List of Species with Critical Habitat Designations in Puerto Rico and the U.S. Virgin Islands:
American Airlines Next Top Model
 Page 1 of 12 American Airlines Next Top Model Introduction Airlines employ several distinct strategies for the boarding and deboarding of airplanes in an attempt to minimize the time each plane spends
NOISE AND FLIGHT PATH MONITORING SYSTEM BRISBANE QUARTERLY REPORT JULY - SEPTEMBER 2011
 NOISE AND FLIGHT PATH MONITORING SYSTEM BRISBANE QUARTERLY REPORT JULY - SEPTEMBER 211 Date Version Comments Page 2 Foreword Airservices Australia has established a Noise and Flight Path Monitoring System
$6.60 NEW SOUTH WALES. Both METRIC and Feet and Inches TIMES: am/pm Sunrise/Sunset Moon Phases Moon Rise/Set DIARY NOTES.
 $6.60 (incl. GST) 2019 2014 November 28, 2013 November 22, 2018 TO to January 1, 7, 2020 2015 Both METRIC and Feet and Inches TIMES: am/pm Sunrise/Sunset Moon Phases Moon Rise/Set DIARY NOTES NEW SOUTH
Airspace Complexity Measurement: An Air Traffic Control Simulation Analysis
 Airspace Complexity Measurement: An Air Traffic Control Simulation Analysis Parimal Kopardekar NASA Ames Research Center Albert Schwartz, Sherri Magyarits, and Jessica Rhodes FAA William J. Hughes Technical
NOISE AND FLIGHT PATH MONITORING SYSTEM BRISBANE QUARTERLY REPORT OCTOBER - DECEMBER 2013
 NOISE AND FLIGHT PATH MONITORING SYSTEM BRISBANE QUARTERLY REPORT OCTOBER - DECEMBER 213 Date Version Comments Page 2 Foreword Airservices Australia has established a Noise and Flight Path Monitoring System
Hydrological Analysis for Simanggo-2 HEPP
 Part 15 Hydrological Analysis for Simanggo-2 HEPP PART 15 HYDROLOGICAL ANALYSIS FOR SIMANGGO-2 HEPP 15.1 METEOROLOGY AND HYDROLOGY Meteorological Records and Hydrological Records are collected from Meteorological
Puerto Rico and the U.S. Virgin Islands After Hurricanes Irma and Maria Jason Bram, Officer Research Economist
 Puerto Rico and the U.S. Virgin Islands After Hurricanes Irma and Maria Jason Bram, Officer Research Economist Economic Press Briefing: February 22, 2018 The views expressed here are those of the presenter
Northeast Stoney Trail In Calgary, Alberta
 aci Acoustical Consultants Inc. 5031 210 Street Edmonton, Alberta, Canada T6M 0A8 Phone: (780) 414-6373, Fax: (780) 414-6376 www.aciacoustical.com Environmental Noise Computer Modelling For Northeast Stoney
Annual Weather Book RECORDED BY NW RESEARCH & OUTREACH CTR. By: Michael Leiseth
 Annual Weather Book RECORDED BY NW RESEARCH & OUTREACH CTR. By: Michael Leiseth Table I II 1 2 3 4 5 6 7 8 9, 10 11, 12 13, 14 15, 16 17 18 An average year in Crookston, MN. Seasonal extremes in Crookston,
Discriminate Analysis of Synthetic Vision System Equivalent Safety Metric 4 (SVS-ESM-4)
") Discriminate Analysis of Synthetic Vision System Equivalent Safety Metric 4 (SVS-ESM-4) Cicely J. Daye Morgan State University Louis Glaab Aviation Safety and Security, SVS GA Discriminate Analysis of
Discriminate Analysis of Synthetic Vision System Equivalent Safety Metric 4 (SVS-ESM-4) Cicely J. Daye Morgan State University Louis Glaab Aviation Safety and Security, SVS GA Discriminate Analysis of
CITY OF LYNDEN STORMWATER MANAGEMENT PROGRAM REPORT MARCH 1, 2016
 CITY OF LYNDEN STORMWATER MANAGEMENT PROGRAM 2015 WATER QUALITY MONITORING REPORT CITY OF LYNDEN 300 4 TH STREET LYNDEN, WASHINGTON 98264 PHONE (360) 354-3446 MARCH 1, 2016 This document serves as an attachment
Introduction. The System. Model Limitations, Assumptions, and Parameters. Optional Services Tech Memo
 Optional Services Tech Memo Introduction This technical memo evaluates the impact of a tide gate to be installed at the confluence of the Left Bank Tributary of Thalia Creek and Lake Windsor. Specifically,
Coverage of Mangrove Ecosystem along Three Coastal Zones of Puerto Rico using IKONOS Sensor
 Coverage of Mangrove Ecosystem along Three Coastal Zones of Puerto Rico using IKONOS Sensor Jennifer Toledo Rivera Geology Department, University of Puerto Rico, Mayagüez Campus P.O. Box 9017 Mayagüez,
$6.60 NEW SOUTH WALES. Both METRIC and Feet and Inches TIMES: am/pm Sunrise/Sunset Moon Phases Moon Rise/Set DIARY NOTES.
 $6.60 (incl. GST) 2018 2014 November 28, 2013 November 23, 2017 TO to January 2, 7, 2019 2015 Both METRIC and Feet and Inches TIMES: am/pm Sunrise/Sunset Moon Phases Moon Rise/Set DIARY NOTES NEW SOUTH
Recommendations for Northbound Aircraft Departure Concerns over South Minneapolis
 Recommendations for Northbound Aircraft Departure Concerns over South Minneapolis March 21, 2012 Noise Oversight Committee Agenda Item #4 Minneapolis Council Member John Quincy Background Summer of 2011
AIRSERVICES AUSTRALI A
 AIRSERVICES AUSTRALI A NOISE AND FLIGHT PATH MONITORING SYSTEM BRISBANE QUARTERLY REPORT JANUARY - MARCH 211 Page 2 Foreword Airservices Australia has established a Noise and Flight Path Monitoring System
Aircraft Noise. Why Aircraft Noise Calculations? Aircraft Noise. SoundPLAN s Aircraft Noise Module
 Aircraft Noise Why Aircraft Noise Calculations? Aircraft Noise Aircraft noise can be measured and simulated with specialized software like SoundPLAN. Noise monitoring and measurement can only measure the
Size data for all Gulf areas are available starting Fishing areas in the Headboat survey are described in Table 1.
 SEDAR7 - DW - 46 Size frequency distribution of red snapper from dockside sampling of recreational landings in the Gulf of Mexico 1984-22 (TXPW, MRFSS, and s size data) by Guillermo A. Diaz Southeast Fisheries
David S Brookshire (UNM) Craig D. Broadbent (IWU) Don Coursey (U of C) Vince Tidwell (Sandia) SILPE
 Craig D. Broadbent (IWU) Don Coursey (U of C) Vince Tidwell (Sandia) SILPE") David S Brookshire (UNM) Craig D. Broadbent (IWU) Don Coursey (U of C) Vince Tidwell (Sandia) SILPE 1 Introduction Over the course of 5 years we engaged with stake holders to design a real-time marketplace
David S Brookshire (UNM) Craig D. Broadbent (IWU) Don Coursey (U of C) Vince Tidwell (Sandia) SILPE 1 Introduction Over the course of 5 years we engaged with stake holders to design a real-time marketplace
(No. 9) (Approved April 8, 2001) AN ACT
 (Approved April 8, 2001) AN ACT") (S. B. 148) (No. 9) (Approved April 8, 2001) AN ACT To establish the Puerto Rico National Parks System, establish its objectives, its administration, the powers and duties of the Executive Director of
(S. B. 148) (No. 9) (Approved April 8, 2001) AN ACT To establish the Puerto Rico National Parks System, establish its objectives, its administration, the powers and duties of the Executive Director of
Figure 1. Overview map of Burrard Inlet, showing location of False Creek inlet.
 Figure 1. Overview map of Burrard Inlet, showing location of False Creek inlet. 65 Figure 2. Location map of False Creek and shoreline and mid-channel monitoring sites. 66 Figure 3. Location of CSO's,
Technical Report. Aircraft Overflight and Noise Analysis. Brisbane, California. December Prepared by:
 Aircraft Noise Abatement Office Technical Report Aircraft Overflight and Noise Analysis Brisbane, California Prepared by: P.O. Box 8097 San Francisco, California 94128 (650) 821-5100 Introduction In response
NEW SOUTH WALES. Both METRIC and Feet and Inches TIMES: am/pm Sunrise/Sunset Moon Phases Moon Rise/Set DIARY NOTES.
 2016 2014 November 28, 2013 November 26, 2015 TO to January 4, 7, 2017 2015 Both METRIC and Feet and Inches TIMES: am/pm Sunrise/Sunset Moon Phases Moon Rise/Set DIARY NOTES NEW SOUTH WALES Public Works
Bristol-Myers Squibb Manufacturing Company
 21 nov. 2005 Listado parcial de sustancias informadas bajo la Sección 312 de S.A.R.A. Título III correpondiente al año 2004 Instalación Pueblo Sustancia Informada Bristol-Myers Squibb Manufacturing Company
LESOTHO HIGHLANDS DEVELOPMENT AUTHORITY
 LESOTHO HIGHLANDS DEVELOPMENT AUTHORITY ANNUAL FLOW RELEASES INSTREAM FLOW REQUIREMENT (IFR) IMPLEMENTATION AND MONITORING (October 2005 to September 2006) REPORT N0.7 OCTOBER 2007 STRATEGIC AND CORPORATE
NOISE AND FLIGHT PATH MONITORING SYSTEM MELBOURNE QUARTERLY REPORT JULY - SEPTEMBER 2011
 NOISE AND FLIGHT PATH MONITORING SYSTEM MELBOURNE QUARTERLY REPORT JULY - SEPTEMBER 211 Date Version Comments Page 2 Foreword Airservices Australia has established a Noise and Flight Path Monitoring System
AIRSERVICES AUSTRALI A
 AIRSERVICES AUSTRALI A NOISE AND FLIGHT PATH MONITORING SYSTEM BRISBANE QUARTERLY REPORT APRIL - JUNE 211 Date Version Comments Page 2 Foreword Airservices Australia has established a Noise and Flight
Glacial lakes as sentinels of climate change in Central Himalaya, Nepal
 Glacial lakes as sentinels of climate change in Central Himalaya, Nepal Sudeep Thakuri 1,2,3, Franco Salerno 1,3, Claudio Smiraglia 2,3, Carlo D Agata 2,3, Gaetano Viviano 1,3, Emanuela C. Manfredi 1,3,
Environmental Impact Assessment in Chile, its application in the case of glaciers. Carlos Salazar Hydro21 Consultores Ltda.
 Environmental Impact Assessment in Chile, its application in the case of glaciers Carlos Salazar Hydro21 Consultores Ltda. carlos.salazar@hydro21.cl Introduction Changes in the environmental law in Chile
Snow, Glacier and GLOF
 Snow, Glacier and GLOF & Report on Demonstration River Basin Activities Upper Indus Basin The 5th International Coordination Group (ICG) Meeting GEOSS Asian Water Cycle Initiative (AWCI) Tokyo, Japan,
NOISE AND FLIGHT PATH MONITORING SYSTEM MELBOURNE QUARTERLY REPORT JULY - SEPTEMBER 2013
 NOISE AND FLIGHT PATH MONITORING SYSTEM MELBOURNE QUARTERLY REPORT JULY - SEPTEMBER 213 Date Version Comments Page 2 Foreword Airservices Australia has established a Noise and Flight Path Monitoring System
Duncan Hastie, P.E. Dewberry
 FEMA s Riverine High Water Marks for Atlanta s September 2009 Flood Event Duncan Hastie, P.E. Dewberry Background High Water Mark Recovery Performed Through FEMA s Hazard Mitigation Technical Assistance
Water Quality Trends for Patchogue Bay
 Water Quality Trends for Patchogue Bay 2018 This report summarizes water quality data for fecal coliform and total coliform in Patchogue Bay for the years 2003-2017. Prepared by: Brian M. McCaffrey Stormwater
NOISE AND FLIGHT PATH MONITORING SYSTEM MELBOURNE QUARTERLY REPORT OCTOBER - DECEMBER 2012
 NOISE AND FLIGHT PATH MONITORING SYSTEM MELBOURNE QUARTERLY REPORT OCTOBER - DECEMBER 212 Date Version Comments Page 2 Foreword Airservices Australia has established a Noise and Flight Path Monitoring
FLOODS IN FRANCE Is there a change?
 Local and regional estimation of extreme hydrological events Lyon 2003 FLOODS IN FRANCE Is there a change? Hélène NIEL & Laurie GIRAUD Objective To answer questions raised by society and the scientific
Rainfall Appendix. Summary Statistics of Rainfall Data for Sites in the West-Central Florida. A Simple Conceptualized Rainfall/Discharge Relationship
 Rainfall Appendix Summary Statistics of Rainfall Data for Sites in the West-Central Florida A Simple Conceptualized Rainfall/Discharge Relationship Stream or river flows are, of course, integrally associated
Puerto Rico & the US Virgin Islands in the Aftermath of Hurricanes Irma and Maria Jason Bram, Officer Research Economist
 Puerto Rico & the US Virgin Islands in the Aftermath of Hurricanes Irma and Maria Jason Bram, Officer Research Economist Presentation to Community Advisory Group June 21, 2018 The views expressed here
CANOVANAS URBAN DEVELOPMENT CORP. P.O. BOX SAN JUAN, P.R
 CANOVANAS URBAN DEVELOPMENT CORP. P.O. BOX 9021990 SAN JUAN, P.R. 00902-1990 787-602-8955 proyectosnuevospr@gmail.com COMMERCIAL LOTS FOR SALE UP TO 60,000 S.F. AVAILABLE FOR CONSTRUCTION Karla Mas O Neill
Number of tourism trips of residents increased namely for leisure
 Tourism Demand of Residents 1 st Quarter 2018 25 July 2018 Number of tourism trips of residents increased namely for leisure In the 1 st quarter 2018, residents in Portugal took a total of 4.5 million
HOW TO IMPROVE HIGH-FREQUENCY BUS SERVICE RELIABILITY THROUGH SCHEDULING
 HOW TO IMPROVE HIGH-FREQUENCY BUS SERVICE RELIABILITY THROUGH SCHEDULING Ms. Grace Fattouche Abstract This paper outlines a scheduling process for improving high-frequency bus service reliability based
This Advisory Circular relates specifically to Civil Aviation Rule Parts 121, 125, and 135.
 Advisory Circular AC 119-4 Revision 1 Passenger, Crew and Baggage Weights 28 October 2005 General Civil Aviation Authority Advisory Circulars contain information about standards, practices, and procedures
SITUATION AT A GLANCE SITUATION UPDATE. Background
 SITUATION AT A GLANCE International Medical Corps is responding to the aftermath of multiple hurricanes in Puerto Rico, Dominica, and Florida. In Dominica, International Medical Corps has provided 411,658
Commissioned by: Visit Kent. Economic Impact of Tourism. Canterbury Results. Produced by: Destination Research
 Commissioned by: Visit Kent Produced by: Destination Research www.destinationresearch.co.uk November 2016 Contents Page Introduction and Contextual Analysis 3 Headline Figures 6 Volume of Tourism 8 Staying