TREN URBANO TITLE VI REQUIREMENTS SURVEY MARCH 2015 PREPARED BY FRANCISCO E. MARTINEZ, MSCE, PE
|
|
|
- Ralf Greene
- 5 years ago
- Views:
Transcription
1 TREN URBANO TITLE VI REQUIREMENTS SURVEY MARCH 2015 PREPARED BY FRANCISCO E. MARTINEZ, MSCE, PE FOR: Alternate Concepts, Inc. April 22, 2015
2 TABLE OF CONTENT 1. INTRODUCTION METODOLOGY Stage I: Planning Design and Training Data Collection and Management Data Analysis SURVEY RESULTS Gender and Age Users with Disabilities Ethnicity Race Language Users Civil Status Household Income and Household Size Users Highest Level of Education Users Residence Municipality and Neighborhood Fare Plan Usage Car ownership and amount of cars per household Users Arrival Modal Distribution Users Destination Stations Final Destination and Radius of Action Trip Purpose Users Travel Frequencies Users Typical Boarding Time Urbano TREN URBANO USER PROFILE BY PERIOD Gender, Age and Users with Disabilities Household Income, Car Ownership and Educational Level Users Travel Frequency and Used Fares COMPARISON TO 2012 SURVEY Socio-demographic characteristics of the Tren Urbano users Tren Urbano users Trips Patterns ADDENDUM I: TITLE VI REQUIREMENTS SURVEY QUESTIONNAIRE ADDENDUM II: TREN URBANO USERS RESIDENCE MUNICIPALITY ADDENDUM III: TREN URBANBO USERS BY NEIGHBORHOOD ADDENDUM IV: USERS DESTINATIONS AND DISTANCE FROM THE STATIONS ADDENDUM V: STATIONS RADIUS OF ACTIONS ADDENDUM VI: PR 2010 CENSUS SUMMARY ADDENDUM VII: U.S. CENSUS BUREAU POVERTY THRESHOLDS FOR ii
3 1. INTRODUCTION This report summarizes the most important findings of the Tren Urbano Title VI Requirement Survey for compliance of Federal Requirements. The main objectives of the survey were: 1. Evaluate if Tren Urbano service is given to everyone without limitations 2. Identify the main characteristics of the Tren Urbano user population 3. Establish Tren Urbano trips patterns and the radius of action of each station In order to accomplish the proposed objectives, the questionnaire used in the 2012 Title VI Requirements survey was revised and was used to interview the TU users. Addendum I presents a copy of the questionnaire used for this survey. A total of 1080 surveys were completed from March 10 to March 12, 2015 between 6:00 AM and 11:00 PM. The first part of the study evaluates the main socio-demographic characteristics of the Tren Urbano users. The questions in this section were focused on: age group, gender, declared disability, ethnic origins, race, language, annual household income, civil status, highest educational level attained and occupation. The second part of the study evaluates trips patterns of Tren Urbano users. This section of the report was focused on: type of fare used municipality of residence how the user arrived to the origin station destination station final destination trip purpose travel frequency and typical period when they use the TU service The last section of the report presents a comparison of the parameters in common with the 2012 survey. 1
4 2. METODOLOGY The process to perform this study was subdivided into the following stages: Stage I Planning,Design and Training Jan23-Mar Stage II Data Collection and Management Mar 10-Mar Stage III Data analysis Mar 18 -Mar Stage IV Report Elaboration and Submital Mar 26 to April Stage I: Planning Design and Training This phase consisted of the design of the questionnaire that was used for the survey, the sample size design, personnel recruiting and training Questionnaire Design The first stage of the project consisted of the revision of the questionnaire previously used in the 2012 Title VI Requirements Survey. An example of the revised questionnaire is presented in the Addendum I. The 2012 Survey questionnaire was modified to include four (4) new questions that provide more insight of the user profile. Also, the order of the questionnaire was changed, so the last questions relate to more personal information such as household income; this change helped improve the flow of the interview. Of the four new questions, the first two questions consider if the user owns a car and how many cars are in the same household. These questions are intended to determine if the user depends on the system or has other options to reach his/her final destination. The third question is intended to establish the typical time of day the user rides the train. This information is useful to determine a typical user profile by time of the day. The fourth question provides information about how many persons live in the household. Other changes included to the 2012 Survey questions are related to annual income and ethnicity. These questions were tempered to 2010 Census Questionnaire. The Tren Urbano Title VI Requirement Survey questionnaire has two parts and 21 questions. The first part of the questionnaire evaluates the main socio-demographic characteristics of the Tren Urbano users. This section has 10 questions to evaluate the Tren Urbano Users: age group, gender, declared disability, ethnic origins, race, language, annual household income, civil status, highest educational level attained and occupation. The second part of the questionnaire was developed to evaluate the Tren Urbano user trips patterns and the radius of activity of each station. This section has 11 questions to designed to evaluate the: type of fares used residence municipality how the user arrives to the origin station 2


5 Station were they trip end (destination station) final destination trip purpose travel frequency and the typical period when they use the TU service Sample Size Design The survey sample size was designed based on Tren Urbano weekday average ridership for September 2014, which is a regular month when the universities, schools and colleges are in session. Table 2.1 presents the estimation of the Tren Urbano average ridership used to determine the sample size for a 95% confidence level and a 3% margin of error. After completing the appropriate calculations, the required sample size was 1,041 surveys. Figure 2.1 shows the sample size estimation based on Tren Urbano weekday average ridership for September 2014 (month with highest recorded usage without special events). Table 2.1 Tren Urbano Average Weekday Ridership Date Ridership Employee SOC Total Entries Tuesday, September 02, , ,020 Wednesday, September 03, , ,352 Thursday, September 04, , ,698 Tuesday, September 09, , ,752 Wednesday, September 10, , ,784 Thursday, September 11, , ,027 Tuesday, September 16, , ,049 Wednesday, September 17, , ,221 Thursday, September 18, , ,657 Wednesday, September 24, , ,729 Thursday, September 25, , ,675 Tuesday, September 30, , ,992 Average 42, ,746 Figure 2.1 Sample Size
6 After the sample size was determined, it was distributed throughout the stations, based on the daily hourly average passenger entries registered per TU station during the study time period. This information was used to determine the proper AM and PM proportions per station. The result of this step of the analysis is presented in Table 2.2. Table 2.2 AM, PM and Night Users Surveys per Tren Urbano Station Programed Completed Station AM PM Night AM PM Night 6:00-12:00-7:00- Total 6:00-12:00-7:00- Total 11:59 6:59 11:00 11:59 6:59 11:00 01 Bayamón Deportivo Jardines Torrimar Martínez Nadal Las Lomas San Francisco Centro Médico Cupey Río Piedras Universidad Piñero Domenech Roosevelt Hato Rey Sagrado Corazón Total , , Recruitment and Training The last part of this stage consisted in the recruitment of 10 surveyors to perform the field work and the data entry process. The selected team was a multidisciplinary group that included students and professionals in the disciplines of marketing, management, human relations, engineering and education. The Survey Team was trained on March 9, The training topics included Project Scope and Methodology, ACI policies regarding Safety and Security, Human Resources and Right of Way protocols and an overall Tren Urbano familiarization briefing. 2.2 Data Collection and Management The main portion of this phase was accomplished on the field. The data was collected using a hard copy of the questionnaire. The data was collected between the March 10, 2015 and March 4
7 12, 2015, between 6:00 AM and 11:00 PM. The table 2.3 presents details of the time period covered each day. Table 2.3 Data Collection Schedule Date From To Surveyors Tuesday, March 10, :00 AM 3:00 PM 10 Wednesday, March 11, :00 AM 8:00 PM 10 Thursday, March 12, :00 AM 8:00 PM 5 Thursday, March 12, :00 PM 11:00 PM 5 In order to accelerate the data entry process and reduce clerical errors, the survey questionnaire was adapted to a VBA macro interface in Microsoft Excel. During the data entry process, the questionnaires were reviewed to determine if they were complete and fulfilled the study requirements. Incomplete and inconsistent questionnaires were excluded from the analysis. Of the total of 1080 questionnaires collected in the field, 12 of them (2.2% of the total) were discarded resulting in a total of 1068 valid questionnaires. 2.3 Data Analysis The data analysis process was initiated with the evaluation of the surveyed users responses for each question in the survey. A graphical approach was used to establish frequency distribution, variability and central tendencies. After the tendencies were clearly stated for each question, a cross tabulation analysis was performed by using contingency tables to further evaluate the correlation of data. The cross tab analysis in this study was focused on determining the main characteristics of the Tren Urbano user population and how it varies during the day. This study takes into consideration the user socioeconomics characteristics as well as how the user interacts with the system (type of fare, travel frequency, and destination, among others). Correlations such as gender and age, income and household size, time of day and transportation mode to access TU, time of day and destination station, among others, were also evaluated as part of this study. Finally, this study uses a longitudinal analysis to compare the results with the 2012 Study. This analysis is used to track user responses to specific questions over time. Once the 2012 benchmark is established, it is easy to discern how user profile and travel patterns have changed in the last years. 5
8 3. SURVEY RESULTS This section summarizes the Tren Urbano user characteristics and trips patterns based on the Title VI Requirements questionnaire. 3.1 Gender and Age As presented in Figure 3.1, 56% of the interviewed persons are females and 44% are male. These results maintain consistency with results observed on the 2010 Census 2. Figure 3.1 Users Gender Male 43.5% Female 56.5% The Tren Urbano user s average age is 36 years. As presented in Figure 3.2 and Table 3.1, the most common age group for service users was between the ages of 15 to 34 years. Within that age range, users between the ages of 15 to 24 years were the largest sub-group representing 37.6% of the total. The group of 25 to 34 years represented 16.8% of users. These age groups are followed by the age groups of 45 to 54 years and 35 to 44 years with 13.8% representation of users surveyed. Figure 3.2 Users Age from 85 years or more from 75 to 84 years from 65 to 74 years from 60 to 64 years from 55 to 59 years from 45 to 54 years from 35 to 44 years from 25 to 34 years from 15 to 24 years 15 year or less 0.3% 2.1% 3.6% 4.5% 6.1% 0.4% 13.8% 13.8% 16.8% 37.6% Census Demographic Profiles; Addendum VI 6
9 Table 3.1 Users Age and Gender Female Male Total % 15 year or less % from 15 to 24 years % from 25 to 34 years % from 35 to 44 years % from 45 to 54 years % from 55 to 59 years % from 60 to 64 years % from 65 to 74 years % from 75 to 84 years % from 85 years or more % Not Answered % Total , Users with Disabilities As presented in Figure 3.3, 92% of the interviewed persons indicated not having any disabilities, while a 5% stated having some sort of disability. Another 3% did not answer this question. Table 3.3 Users with Disabilities Yes 5% No Answer 3% No 92% 3.3 Ethnicity With regard to ethnic origin, 97.7% of the users self-identified as Hispanic or Latin, 1.22% did not answer this question and 1.1% where non-hispanic or Latin. This question was expanded to have a clearer picture of the user s national origin. As presented in Figure 3.4, 88.1% where Puerto Rican, 7.7% were Dominican, 1.9% were other Hispanic which included Venezuelans, Cubans, Mexicans among others. 7
10 Not Answered 1.2% Figure 3.4 Users Ethnicity Dominicans 7.7% Non Hispanic or Latin 1.1% Other Hispanic 1.9% Puertorican 88.1% 3.4 Race Users were also questioned about their race. This question was formulated based on the 2010 Census questionnaires (Addendum VI). As presented in Figure 3.5, 54.6% of the survey respondents were white, 22.4% Black or Afro-American, 13.5% Latin, 2.3%, 1.1% Hispanic, and 3.76% other. Figure 3.5 Users Race Others 3.7% Hispanic 2.3% Not Answered 3.5% Latino 13.5% Black or Afro-American 22.4% White 54.6% 3.5 Language For the primary language, 94.5% of Tren Urbano users identified Spanish as their native language, 3.4% indicated Spanish and English, 1.6% English spoke English only and 0.6% indicated either other language or did not answer this question. 8
11 English 1.6% Figure 3.6 Language Spanish and English 3.4% Others 0.3% Not Answer 0.3% Spanish 94.5% 3.6 Users Civil Status Most of the users who answered this question stated they were single (65%), while 23% were married. Other civil status mentioned were: divorced 7%, and widowed 3%. Finally, 2% of those interviewed did not answer this question. Figure 3.7 Users Civil Status Widowed 3% Married 23% Divorced 7% Single 65% Not Answered 2% 3.7 Household Income and Household Size The household income and household size were evaluated jointly because these two parameters allow a better understanding the economic condition of the Tren Urbano users. As presented in Figure 3.8, the annual household income of the 71.2% of the surveyed respondents is less than $25,000. This percentage is divided as follow: 36.5% under $10, % between $10,000 and $14,999 and 19.5% between $15,000 and $24,999 per year. 8.4% 9
12 of the survey respondents indicated having annual household incomes between $25,000 to $34,999, while 8.7% had household incomes of $35,000 to $49,999, and 5.5% had a household income of $50,000 to $75,000. Only 6.2% indicated having an annual household income of more than $75,000. This analysis does not take into consideration 227 users (21.3% of the study sample) who declined to answer this question. Figure 3.8 Household Income $200,000 or more $150,000 to $199,999 $100,000 to $149, % 0.4% 1.2% $75,000 to $99,999 $50,000 to $74, % 5.5% $35,000 to $49,999 $25,000 to $34, % 8.4% $15,000 to $ 24, % $10,000 to $14, % Less than $10, % The average amount of persons per household is 3.05 persons. As presented in Figure 3.9, typically the household size of the survey respondent is between 1 and 4 persons per household. 26.2% of the interviewed users indicated that their household size is 3 persons, 23% indicated 4 persons, 22.5% indicated 2 persons, 14.4% indicated 1 person and 13.9% indicated a household size greater than 5 persons. This analysis does not take into consideration 38 customers (3.6% of the study sample) declined to answer this question. Figure 3.9 Household Size % 0.6% 3.3% 9.5% 14.4% 23.0% 22.5% 26.2% 10
13 Based on the U.S. Census Bureau Poverty Thresholds for 2013, 61.8% of TU users are under poverty levels (sum of highlighted fields on Table 3.2). As presented in Table 3.2, 35.6% of the interviewed passengers have an income of less than $10,000 and a household average of 3 persons. Table 3.2: Household Income and Size Correlation Annual Household Size Income Total Less than $10, % 7.1% 9.9% 8.3% 3.8% 0.9% 0.4% 0.1% 36.9% $10,000 to $14, % 3.5% 3.7% 2.7% 1.1% 0.9% 0.2% 0.1% 15.0% $15,000 to $ 24, % 4.9% 5.2% 4.1% 1.7% 0.7% 0.0% 0.1% 19.2% $25,000 to $34, % 1.9% 2.7% 1.9% 0.4% 0.4% 0.0% 0.0% 8.5% $35,000 to $49, % 2.8% 2.6% 2.4% 0.6% 0.0% 0.0% 0.0% 8.8% $50,000 to $74, % 1.6% 1.1% 1.6% 0.4% 0.2% 0.0% 0.1% 5.5% $75,000 to $99, % 0.7% 1.5% 1.3% 0.2% 0.0% 0.1% 0.0% 4.4% $100,000 to $149, % 0.2% 0.2% 0.5% 0.2% 0.0% 0.0% 0.0% 1.2% $150,000 to $199, % 0.0% 0.1% 0.1% 0.0% 0.0% 0.0% 0.0% 0.4% $200,000 or more 0.0% 0.0% 0.0% 0.1% 0.0% 0.0% 0.0% 0.0% 0.1% Total 14.5% 22.8% 26.9% 23.1% 8.4% 3.0% 0.7% 0.5% Legend: Range under poverty level based on U.S. Census Bureau Poverty Thresholds for Users Highest Level of Education Tren Urbano users have a high education level. 44.6% of the TU users have a university or technical degree (22% bachelor degree, 8.4% master s degree, 2.2% doctoral degree, 10.9% an associate degree and a 1.1% a technical career). As presented in Figure 3.10, 28.6% of the interviewed users have 1 to 2 years of university studies. 18.6% of the users reported that their highest academic level received was high school. 5.2% indicated not completing high school. 3% of the interviewed users did not answer this question. 11
14 Figure 3.10: User Highest Level of Education Attained Not Opinion Doctoral Degree 3.0% 2.2% Master degree 8.4% Bachelor Degree 22.0% Associate Degree 10.9% Technical Career 1.1% 1 or 2 Years University Studies 28.6% High School 18.6% Without High School 5.2% 3.9 Users Residence Municipality and Neighborhood As part of the survey, the users were asked about the municipality where they live. As shown in Table 3.3 the 76.8% of the interviewed users live in the three municipalities serviced by the Tren Urbano system. The other 23.2% lives in surrounding municipalities. Figure 3.11 presents the Municipalities where the TU users live, the dots will vary from intense colors to more light colors depending on the users per municipality. Addendum II contains a complete list of TU user municipalities.. Table 3.3 Top 10 Tren Urbano Users Residence Place Municipality Municipality Frequency % San Juan % Bayamón % Guaynabo % Toa Baja % Toa Alta % Carolina % Dorado % Trujillo Alto % Cataño % Caguas % Others % Total 1,068 12

15 Figure 3.11: Tren Urbano Users Municipalities In order to have more detailed information about the users place of residence; additional questions were asked about the neighborhood in which they live. Table 3.4 summarizes the top 25 places of residence; a complete list of TU users places of residence is presented in Addendum III. The Figure 3.12 presents the principal TU users neighborhoods; the circles will vary from intense colors to more light colors depending on the density of residents in each neighborhood. Figure 3.12: Tren Urbano Users Neighborhood of Residence 13
16 Table 3.4 Top 25 Tren Urbano Users Neighborhood of Residence Ranking Municipality-Neighborhood Total % 1 San Juan, Río Piedras % 2 San Juan, Santurce % 3 Bayamón, Unknown % 4 San Juan, Hato Rey % 5 Bayamón, Santa Juanita % 6 San Juan, Las Lomas % 7 Bayamón, Jardines de Caparra % 8 San Juan, Barrio Obrero % 9 San Juan, Puerto Nuevo % 10 San Juan, Unknown % 11 Bayamón, Lomas Verdes % 12 Guaynabo, Unknown % 13 Bayamón, Rexville % 14 San Juan, Cupey % 15 San Juan, Villa Palmeras % 16 Bayamón, Pueblo (centro) % 17 Bayamón, Santa Rosa % 18 Bayamón, Sierra Bayamón % 19 Guaynabo, Torrimar % 20 San Juan, Caparra Terrace % 21 San Juan, Viejo San Juan % 22 Toa Baja, Levittown % 23 Unknown % 24 Bayamón, Hato Tejas % 25 Toa Baja, Sabana Seca % Other % Total 1, Fare Plan Usage Most of the Tren Urbano users who answered this question stated they use the regular fare. 55% use the regular fare, 34% use a reduced fare ticket and a 10% use an unlimited pass. The Table 3.5 and the Figure 3.13 show a detailed fare distribution. 14
17 Figure 3.13 Fare Plan Usage Person with Disabilities 1% Super Senior (>75 years) 2% Golden Age (60 to 74years) 5% Unlimited Passes (1d, 7d, 30d, 9 d) 8% Students 26% Corporate 2% Other 1% Regular Fare ($1.50) 55% No Answer 0% Table 3.5 Tren Urbano Fare Usages Fare Frequency % Regular Fare ($1.50) % Students % Golden Age (60 to 74years) % Super Senior (>75 years) % Person with Disabilities % 90 Days Unlimited Pass ($90.00) % 7 Days Unlimited Pass ($15.00) % 30 Days Unlimited Pass ($50.00) % 1 Day Unlimited Pass ($5.00) 9 0.8% Corporate % Other (Medicare) 5 0.5% No Answer 4 0.4% Total 1, Car ownership and amount of cars per household About a half of the users who answered the questionnaire stated that they have their own car. This represents a 49.7% of the interviewed users. These customers use Tren Urbano instead of their own cars to get to their final destination. Figure 3.14 shows the distribution of Tren Urbano users that have their own car and the Tren Urbano users that do not have a car. 15
18 Figure 3.14: Users with Car Have Car 49.7% No Car 49.7% No Answer 0.6% The TU users were asked about the amount of cars in their households. 21.4% of the users households do not have a car. 76.8% of the users household has at least one car. Figure 3.15 presents in more detail the amount of cars per user household. Figure 3.15: Cars per Household 3 Cars 11.4% 4 Cars or More 5.8% Not Answer 1.8% 1 Car 31.6% Don't have a car 21.4% 2 Cars 27.9% 3.12 Users Arrival Modal Distribution As presented in Figure 3.16, most of the surveyed passengers indicated that they used an automobile as the mode of transportation to get to the TU station. 30.2% answered that they drive to the station in a personal car and another 20.4 % indicated they got a ride to the station. On the other hand, 30.8% of the persons surveyed indicated they walked to the station. The uses of other public transit options to arrive to a station is limited, a total of 14.3% of the surveyed passengers arrive to the station in bus or Públicos. AMA was the most frequently used transit service with 8.0%. 4.1% used private bus or Públicos, 1.2% used Metro Urbano and 1% Metrobus. The use of the trolleys represented 3% of the interviewed passengers and 1.2% use other transportation methods to get to the station. 16
19 As presented in Table 3.6, the different transportation modes practically have similar pattern during the morning, afternoon and night. Figure 3.16 Modal Distributions 30.2% 30.8% 20.4% 8.0% 4.1% 3.0% 1.0% 1.2% 1.2% Table 3.6 Modal Distributions Frequenency Rate Mode AM PM Night Total AM PM Night Total Personal Car % 29.1% 34.0% 30.2% Walking % 29.6% 30.8% 30.8% AMA % 8.2% 9.6% 8.0% Get a Ride % 21.4% 19.2% 20.4% Público % 3.8% 1.9% 4.1% Trolley % 3.8% 2.6% 3.0% Metrobús % 1.3% 0.0% 1.0% Metro Urbano % 0.8% 0.6% 1.2% Other % 1.9% 1.3% 1.2% Total , Users Destination Stations The surveyed users were asked to indicate the destination station for their current trip. This information allows us to understand how the passengers flow around the system. The most frequent destination stations were: Bayamón (16.2%) and Sagrado Corazon (14%) which are terminus stations. The trip pattern in Tren Urbano is similar to the typical travel patterns of the San Juan Metropolitan Area. During the morning the greatest concentration of passenger flow is coming into the Metropolitan Area where the main workplace destinations as well as major hospitals and universities are located. During the afternoon and evening most of the flow is coming out of the San Juan Metropolitan Area to the suburbs of the city where the largest residential concentrations are located. 17
20 As presented in table 3.7, in addition to the terminus stations, during the morning the most frequent destinations were located east of San Francisco Station. The most frequent station destinations during the morning where: Universidad (11.1%), Rio Piedras (9.8%), Centro Medico (8%), Hato Rey (6.4%) and Roosevelt (5.9%). These stations are located near to important trips generators such as Metropolitan Area Medical Center, University of Puerto Rico, and the banking area known as La Milla de Oro or The Golden Mile. Table 3.7 Destination Stations Station Frequency % AM PM Night Total AM PM Night Total Bayamón % 17.2% 18.6% 16.2% Deportivo % 10.1% 11.5% 8.3% Jardines % 1.9% 1.9% 1.6% Torrimar % 1.9% 0.6% 1.8% Martínez Nadal % 7.6% 8.3% 6.6% Las Lomas % 3.4% 4.5% 2.7% San Francisco % 4.2% 2.6% 3.7% Centro Médico % 4.4% 5.1% 5.8% Cupey % 5.4% 7.1% 5.8% Río Piedras % 10.7% 7.7% 9.9% Universidad % 6.7% 6.4% 8.2% Piñero % 3.1% 2.6% 3.7% Domenech % 2.7% 2.6% 2.8% Roosevelt % 4.6% 1.3% 4.6% Hato Rey % 3.4% 2.6% 4.4% Sagrado Corazón % 12.6% 16.7% 14.0% Total ,068 During the afternoon between 12:00 PM and 7:00 PM, the most frequent destinations were located to the west of Universidad Station with the exception of Sagrado Corazon which is a terminus station. The most frequent station destinations during the afternoon were: Bayamon (17.2%), Sagrado Corazon 12.6%, Rio Piedras (10.7%), Deportivo (10.1%), and Martinez Nadal (7.6%). These stations have parking or are located near a bus terminal. After 7:00 PM and until closing at 11:30 PM ( night ), the most frequent destinations were similar to the afternoon destinations. The most frequent destinations were: Bayamon (18.6%), Sagrado Corazon (16.7%), Deportivo (11.5%), Rio Piedras (8.3%), and Martinez Nadal (7.7%). In addition, there is a considerable amount of passengers in stations located near universities such as Cupey Station (7.1%) located near the Universidad Metropolitana and Universidad Station (6.4%) located near the Universidad de Puerto Rico, Recinto de Rio Piedras. 18
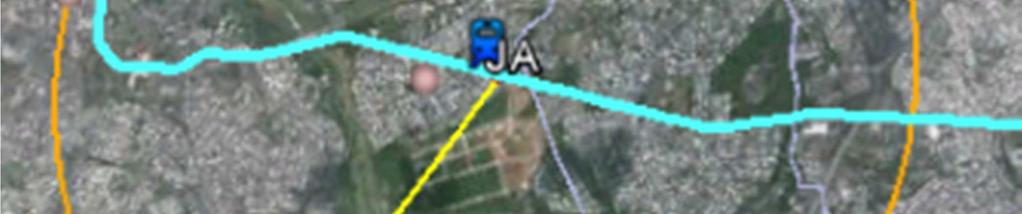
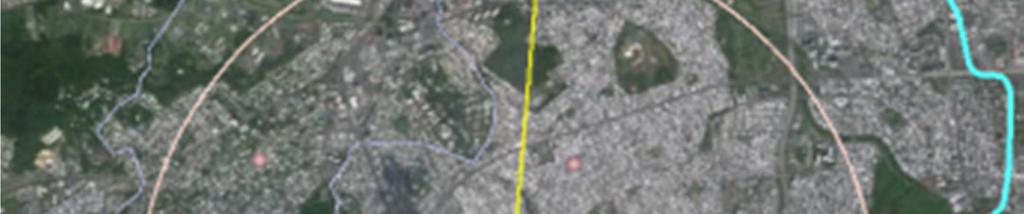
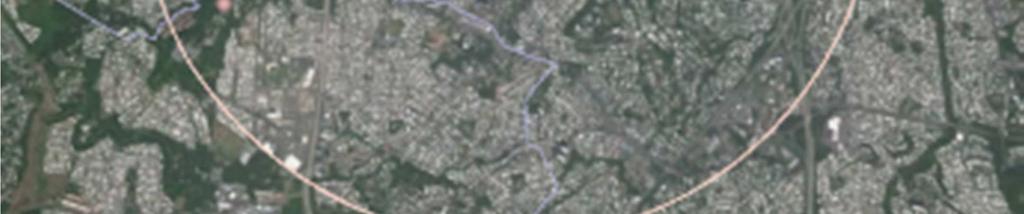
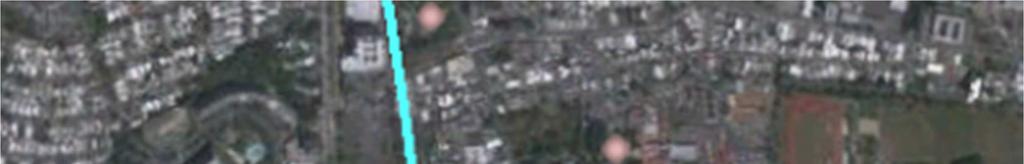
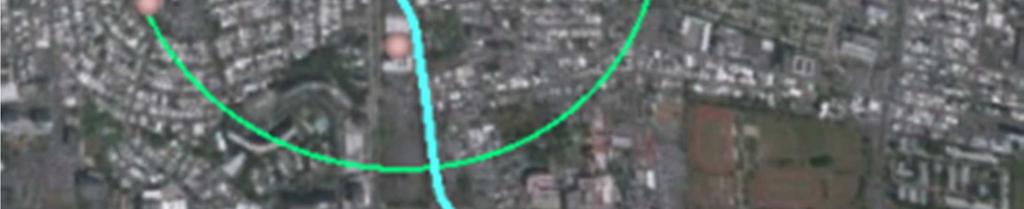
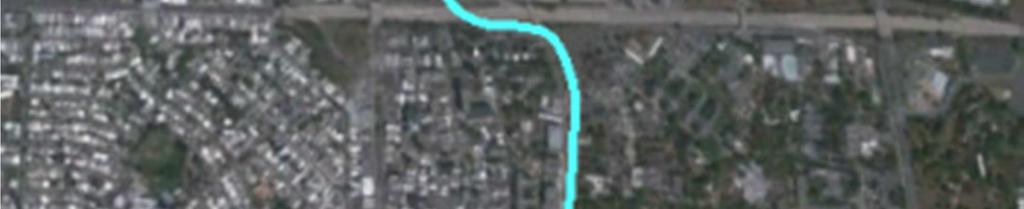
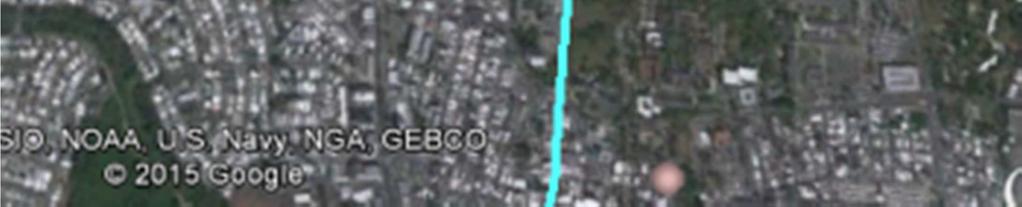
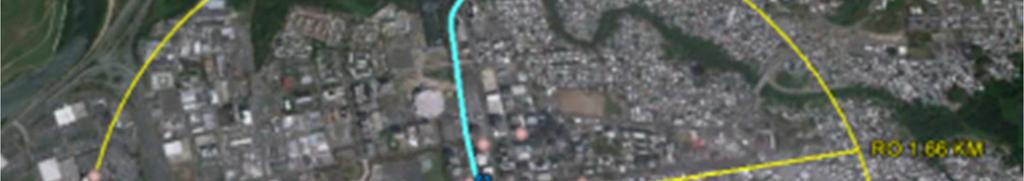
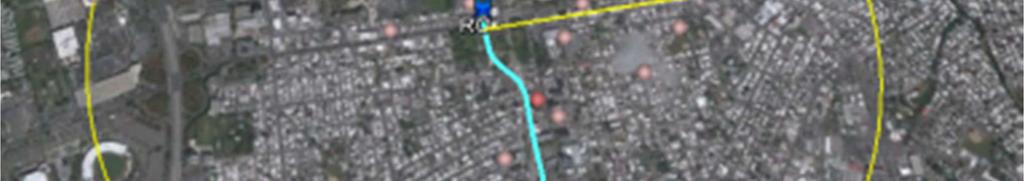
21 3.14 Final Destination and Radius of Action The surveyed patrons were asked to indicate their final destinations. This information was used to estimate how far the Tren Urbano users move around the Station. This question was answered by 83.8% of the surveyed users. 16.2% of the users did not answer the question or their destinations could not be determined in a map. The top final destinations include several universities, medical centers, business centers and residential areas. Table 3.8 summarizes the most typical final destination observed during the study. Addendum IV contains a complete list of TU users final destination by station. Table 3.8 Top 25 Final Destinations Ranking Final Destination Frequency % 1 UPR Rio Piedras % 2 Río Piedras % 3 Centro Médico % 4 Santurce % 5 Bayamón, Pueblo % 6 UMET Cupey % 7 Milla de Oro % 8 Universidad Sagrado Corazón % 9 Hato Rey % 10 Santa Juanita % 11 Hosp. Auxilio Mutuo % 12 Guaynabo pueblo % 13 Rexville % 14 Paseo de Diego % 15 Universidad Politécnica % 16 Viejo San Juan % 17 Barrio Obrero 9 1.0% 18 Jardines de Caparra 9 1.0% 19 Las Lomas 9 1.0% 20 San Juan 9 1.0% 21 UPR Bayamón 9 1.0% 22 Centro Judicial 8 0.9% 23 Cupey 8 0.9% 24 Puerto Nuevo 8 0.9% 25 Lomas Verdes 7 0.8% Others % Total 895 Final destination information was used to determine the radius of activities relative to each station. Figure 3.17 presents an aerial view with the area of influence of each station and the Table 3.9 presents more detailed information for each station. Addendum V presents an aerial view of each station with their respective destinations. 19
22 Figure 3.17 Tren Urbano Area of Action Stations with larger radius of action are also those stations with parking lots. These stations are also considered trip origin stations. Bayamon and Deportivo stand out as stations with larger radius of action. These stations are located to the west side of the alignment and collect users from Bayamon, Cataño, Toa Baja, Toa Alta, and Dorado among others. 85% of the users on these stations travel a distance of at least 10 KM. Stations with small radius of action are typically urban center. These stations are also considered trip destination stations. Universidad and Domenech stations have the smaller radius of influence, where 85% of the users are moving a distance of at least 0.76 KM from the station. 20
23 Table 3.9: Tren Urbano Stations Radius of Action 85 Percentile Average Station Radius of Influence (KM) Radius of Influence (KM) 01 Bayamón Deportivo Jardines Torrimar Martínez Nadal Las Lomas San Francisco Centro Médico Cupey Río Piedras Universidad Piñero Domenech Roosevelt Hato Rey Sagrado Corazón Trip Purpose As presented in Figure 3.18, 26.4% of the interviewed passengers used Tren Urbano to return to their residence, 26.2% used the Tren Urbano to travel to work and 24.4% used the system with educational centers as their primary destination. Other trip purposes were: 9.6% run errands and 6% to visit doctors and hospitals. Figure 3.18: Trip Purpose No Answer Other Entertainment For leisure Shopping Visit Family or Firends Hospital or Medical Appointment Run errands Study Go Home Work 0.3% 0.5% 0.9% 0.9% 2.2% 2.7% 5.9% 9.6% 24.4% 26.4% 26.2% 21
24 3.16 Users Travel Frequencies As presented in Figure 3.19, 75.2% of the surveyed customers use Tren Urbano 3 days per week or more. This percentage is distributed as follows: 37.2% use the Tren Urbano 5 days per week, 12.5% travel on Tren Urbano more than 5 days per week and 25.5% ride 3 to 4 days per week. Another 11.1% use the Tren Urbano 2 days per week, 7.6% use the Tren Urbano 1 day per week and only 5.5% use the Tren Urbano only for special events. Figure 3.19 Tren Urbano User Travel Frequencies No Answer Special Events One day per week 2 days per week More than 5 days per week 3 to 4 days per week 5 days per week 0.6% 5.5% 7.6% 11.1% 12.5% 25.5% 37.2% 3.17 Users Typical Boarding Time Urbano The users were asked about the time that they typically use Tren Urbano. As presented in Figure 3.20 the 28.2% indicate that they use Tren Urbano during the morning rush period from 5:30AM to 8:30 AM. 27.8% use Tren Urbano during the afternoon rush period from 2:30 PM to 5:30 PM which is similar to the morning hour. The time period from 8:30 PM to 11:30PM was when the least number of persons indicated that they use Tren Urbano. A total of 5.3% of persons indicated that they use Tren Urbano during this period. Figure 3.20 presents the distribution of the time in which the customers typically use Tren Urbano. Figure 3.20 Users Typical Boarding Time 8:30PM-11:30PM 5.3% 11:30AM-2:30PM 5:30PM-8:30PM 10.8% 12.1% 8:30AM-11:30AM 15.6% 2:30PM-5:30PM 5:30AM-8:30AM 27.8% 28.4% 22
25 4. TREN URBANO USER PROFILE BY PERIOD This section presents data regarding usage by time of day based on the answer of the question 11 of the Title VI Survey Questionnaire. This information is useful to understand the composition of system users and their needs during the day. Based on the obtained results, the profile of the Tren Urbano user is consistent throughout the day. Most noticeable changes were observed after 5:30 PM. 4.1 Gender, Age and Users with Disabilities There are stark differentiations in user profile by time of day along gender and age classifications. As presented in Table 4.1, between 5:30 AM to 5:30 PM more than 55% of users are females while in the period from 5:30 PM to 11:30 PM most users are males. The user age ranges maintain a similar behavior throughout the day until 5:30 PM. After this time the proportion of people over 65 decreased from a ratio of more than 5% before 5:30 PM to less than 3% after 5:30 PM. The proportion of age ranges from 15 to 24 years and 25 to 34 years increased from 29% before 5:30 PM to 40% after 5:30 PM. The proportion of people with disabilities remained constant throughout the day, although after 5:30 PM the number drops slightly. Table 4.1 Gender, Age and Users with Disabilities 5:30 AM to 8:30 AM 8:30AM to 11:30 AM 11:30 AM to 2:30 PM 2:30 PM to 5:30 PM 5:30 PM to 8:30 PM 8:30 PM to 11:30 PM Gender Age Users with Disabilities Female 55.4% 61.8% 59.0% 56.1% 49.2% 44.6% Male 44.6% 38.2% 41.0% 43.9% 50.8% 55.4% Less than 15 years 0.3% 0.3% 0.4% 0.5% 0.0% 0.0% 15 to 24 years 36.2% 39.4% 41.4% 39.5% 33.1% 37.5% 25 to 34 years 15.6% 18.0% 18.5% 15.8% 21.3% 25.0% 35 to 44 years 15.8% 11.0% 10.6% 12.7% 20.5% 14.3% 45 to 54 years 14.6% 11.3% 12.8% 13.6% 13.8% 7.1% 55 to 59 years 7.6% 5.8% 3.5% 6.3% 4.3% 8.0% 60 to 64 years 3.9% 5.8% 4.8% 5.3% 3.9% 7.1% 65 to 74 years 2.9% 3.4% 4.4% 3.3% 2.0% 0.9% 75 to 84 years 2.0% 2.4% 2.2% 1.9% 0.8% 0.0% 85 years or more 0.3% 0.3% 0.4% 0.3% 0.0% 0.0% Not Answered 0.8% 2.1% 0.9% 0.9% 0.4% 0.0% Yes 5.7% 5.5% 6.6% 5.3% 3.5% 3.6% No 91.9% 89.9% 91.2% 92.5% 94.9% 94.6% Not Answer 2.3% 4.6% 2.2% 2.2% 1.6% 1.8% 23
26 4.2 Ethnicity and Race The ethnicity of Tren Urbano users remains constant throughout the day. Overall more than 86% of users during the day are Puerto Ricans, after 5:30 PM this proportion increases to more than 92%. As shown in Table 4.2, the proportion of Dominican users peak during two distinct periods of the day. The first peak is from 5:30 AM to 8:30 AM with a 9.2% Dominican users with a second peak of 8.9% between 2:30 PM and 5:30 PM. Outside these hours this group maintains an average profile of close to 6%. The race distribution of the users practically does not vary throughout the day. Most users (55%) self-identify as white. 25% of the users who typically use the system during the day are Black or Afro-Americans, but during the period from 8:30 a.m. to 11:30 a.m. and the period of 8:30 PM to 11:30 PM this proportion was close 15% of users. Ethnic Origin Race Table 4.2 Users Ethnicity and Race 5:30 AM to 8:30 AM 8:30AM to 11:30 AM 11:30 AM to 2:30 PM 2:30 PM to 5:30 PM 5:30 PM to 8:30 PM 8:30 PM to 11:30 PM Puerto Rican 86.9% 88.7% 87.7% 87.8% 92.1% 93.8% Dominican 9.2% 5.8% 6.6% 8.9% 4.3% 1.8% Other Hispanic 1.8% 2.4% 2.2% 1.9% 2.4% 3.6% Non Hispanic 1.5% 1.2% 1.8% 0.9% 0.8% 0.9% Not Answered 0.5% 1.8% 1.8% 0.5% 0.4% 0.0% White 55.5% 54.7% 53.3% 56.8% 57.9% 58.0% Black or Afroamerican 27.2% 15.3% 23.3% 26.2% 20.1% 14.3% Latino 10.6% 19.3% 10.1% 10.1% 13.4% 16.1% Other 4.0% 7.0% 10.6% 4.3% 5.9% 8.0% Not Answered 2.7% 3.7% 2.6% 2.6% 2.8% 3.6% 4.3 Household Income, Car Ownership and Educational Level Users household income varies little throughout the day. The largest concentration of persons using the train by time of day correlated by income occurs between 11:30 AM and 2:30 PM when 35% of riders earn less than $10,000/year. During the remainder of operating hours, this income group approximately represents the 27% of the users. As shown in Table 4.3, during periods of 8:30 a.m. to 11:30 a.m. and 11:30 a.m. to 2:30 PM less than 0.5% of users have income greater than $ 100,000, while during other periods of the day this group increases to nearly 2%. As previously mentioned, users who own a car are an indicator of the number of customers by conviction. As shown in Table 4.3, more than a 51% of the costumers that use the Tren Urbano from 8:30 AM to 11:30 PM and from 5:30 PM until-11:30 PM have their own car. This statistic indicates that these customers are using the Tren Urbano by conviction, because they prefer to use the system to reach to their destinations, despite having a car to perform their trips. The educational level of the Tren Urbano users has a quite similar behavior throughout the day. 24
27 Users Educational Level own a Household Income car Table 4.3 Household Income, Car Ownership and Educational Level 5:30 AM to 8:30 AM 8:30AM to 11:30 AM 11:30 AM to 2:30 PM 2:30 PM to 5:30 PM 5:30 PM to 8:30 PM 8:30 PM to 11:30 PM Less than $10, % 28.4% 34.8% 28.1% 20.9% 29.5% $10,000 to $14, % 12.2% 12.3% 13.2% 9.4% 8.0% $15,000 to $ 24, % 13.1% 11.5% 15.6% 15.0% 16.1% $25,000 to $34, % 6.4% 5.7% 7.2% 9.1% 9.8% $35,000 to $49, % 8.3% 6.6% 5.5% 8.3% 5.4% $50,000 to $74, % 5.2% 3.1% 3.6% 7.1% 4.5% $75,000 to $99, % 3.1% 2.6% 2.9% 4.3% 4.5% More than $100, % 0.6% 0.0% 2.1% 1.2% 1.8% Not Answer 20.6% 22.6% 23.3% 21.8% 24.8% 20.5% Yes 48.2% 51.7% 46.3% 43.9% 57.9% 55.4% No 51.5% 48.0% 52.9% 55.9% 41.7% 44.6% Not Answer 0.3% 0.3% 0.9% 0.2% 0.4% 0.0% Without High 5.4% 4.6% 3.5% 6.3% 3.5% 5.4% High School 18.0% 17.7% 23.8% 19.2% 8.7% 16.1% 1 to 2 Years University Studies 27.2% 30.3% 30.0% 30.2% 29.5% 25.9% Professional Career 1.0% 1.2% 2.6% 1.2% 1.2% 2.7% Associate Degree 12.8% 9.5% 10.6% 10.1% 10.2% 9.8% Bachelor Degree 23.3% 22.6% 16.7% 21.3% 28.7% 22.3% Master Degree 7.9% 7.6% 8.8% 6.9% 13.0% 12.5% Doctoral Degree 1.7% 3.1% 2.2% 2.4% 2.4% 4.5% Not Answer 2.9% 3.4% 1.8% 2.4% 2.8% 0.9% 4.4 Users Travel Frequency and Used Fares Most of the persons that use Tren Urbano five days per week do so during peak hours. As presented in Table 4.4, 46.8% of the morning customers (5:30 AM to 8:30 AM) and 41.9% of afternoon customers (2:30 PM to 5:30 PM) use the system 5 days per week. Persons that used Tren Urbano occasionally or during special events are typically observed between 8:30 AM and 2:30 PM representing 7% of the users. Tren Urbano customers fare preference maintains a fairly constant pattern throughout the day. Overall more than 50% of users opt for regular fare. Unlimited passes represent 11% of the passengers who typically use Tren Urbano during different periods of the day, except for the period from 8:30 AM to 2:30 PM, with less than 6.7% of the costumers using unlimited passes to pay their trips. The reduced fare tickets plans maintain a fairly constant behavior throughout the day. 25
28 Used Fare Travel Frequency Table 4.4 TU Users Travel Frequency and Used Fares 5:30 AM to 8:30 AM 8:30AM to 11:30 AM 11:30 AM to 2:30 PM 2:30 PM to 5:30 PM 5:30 PM to 8:30 PM 8:30 PM to 11:30 PM 2 days per week 7.7% 11.6% 16.7% 9.3% 9.8% 13.4% 3 to 4 days per 22.8% 28.1% 30.4% 27.8% 26.8% 23.2% 5 days per week 46.8% 30.6% 26.4% 41.9% 38.2% 33.9% More than 5 days 13.3% 16.8% 11.0% 11.5% 16.9% 25.0% Only on special 2.7% 7.6% 7.0% 3.1% 3.9% 1.8% 1 day per week 6.4% 4.9% 8.4% 6.2% 3.9% 2.7% Not Answer 0.3% 0.3% 0.0% 0.3% 0.4% 0.0% Regular Fare 52.3% 52.0% 54.2% 52.1% 58.7% 52.7% Unlimited Passes 10.4% 6.7% 4.0% 9.6% 11.0% 11.6% Corporate Passes 2.2% 1.8% 1.3% 2.1% 2.4% 0.9% Student 27.5% 29.1% 30.8% 27.8% 20.1% 25.0% Persons with 1.0% 2.1% 0.9% 1.4% 2.0% 2.7% Senior (60 to % 5.5% 6.6% 4.1% 3.9% 7.1% Golden Age (75 or more years ) 2.3% 2.4% 1.8% 2.2% 0.8% 0.0% Other 1.0% 0.3% 0.4% 0.7% 1.2% 0.0% 26
29 5. COMPARISON TO 2012 SURVEY This section of the study evaluates how the User Profile and Travel Patterns have changed during the last years. This is accomplished by comparing the responses to the questions in common between this study and the 2012 study. The results in this section are presented in two subsections: Socio-Demographic Characteristics and User Trips Patterns. The Socio-Demographic Characteristics subsection compares the following parameters: Gender, Age, Race, Ethnicity, Household Income, Educational Level, Users with Disabilities, Civil Status and Language. The Trips Patterns subsection compares the following parameters: Transportation Method Used to get to the Stations, Trip Purpose, Travel Frequency and Discount Fare usage. 5.1 Socio-demographic characteristics of the Tren Urbano users The results of the social-demographic characteristics of the Tren Urbano users are similar to the 2012 survey. Characteristics that observed the highest variation were user race, ethnicity origins and educational level. As presented in Table 5.1, Male users increased 3% in comparison to the 2012 survey while the female user profile decreased by that same amount. Table 5.1 Gender Gender Change Male 44% 41% 3% Female 56% 59% -3% The Tren Urbano User Age distribution practically did not change in comparison to the 2012 Survey. The range with highest variation was the 15 to 24 years, which increased 7% in comparison to the Table 5.2 presents in more detail the age range comparison against the 2012 survey. Table 5.2 Users Age Age Range Change 15 year or less 0.4% 2.0% -1.6 % from 15 to 24 years 37.6% 30.6% 7.0% from 25 to 34 years 16.8% 18.6% -1.8% from 35 to 44 years 13.8% 15.9% -2.1% from 45 to 54 years 13.8% 16.3% -2.5% from 55 to 59 years 6.1% 5.6% 0.5% from 60 to 64 years 4.5% 4.2% 0.3% from 65 to 74 years 3.6% 4.2% -0.6% from 75 to 84 years 2.1% 1.6% 0.5% from 85 years or more 0.3% 0.7% -0.4% No Opinion 1% 0.3% 0.7% 27
30 During the 2015 survey, the question about race received the highest variation when compared to the 2012 survey. During this year s survey many users opted to use the other field, where they answered that their race was Latino (13 %) or Hispanic (2%). Even so most users (55%) say they are white for a 13% reduction compared with Users who say that they are black represent 22% of interviewed customers for an increase of 3% compared to the Table 5.3 presents in more detail the age range comparison against the 2012 survey. Table 5.3 Users Race Race Change White 55% 68% -13% Black or Afro-American 22% 19% 3% Latino 14% 1% 13% Hispanic 2% 0% 2% Others 4% 7% -3% Not Answered 4% 5% -2% Within the 2015 survey most of the Tren Urbano users self-identified as Hispanic. 86% of users say that they are Hispanic for a reduction of 12% compared to During this year's survey 13% of respondents did not answer this question for an increase of 12% compared with Table 5.4 presents the comparative analysis. Table 5.4 Ethnicity Hispanic Change Yes 86% 98% -12% No 1% 1% 0% Not Answered 13% 1% 12% The Tren Urbano user s household Income remains similar to the 2012 survey. Users with an annual income greater than $50,000 increased a 6% in comparison to the 2012 survey. Table 5.5 presents the comparative analysis in more detail. Table 5.5 Tren Urbano Household Income Income Range Change Less Than $10,000 29% 32% -3% from $10,000 to $14,999 12% 13% -1% from $15,000 to $ 24,999 15% 14% 1% from $25,000 to $ 34,999 7% 10% -3% from $35,000 to $49,999 7% 4% 3% from $50,000 or more 9% 3% 6% Not Opinion 21% 24% -3% The Tren Urbano highest level of education parameter indicates that the majority of the users are professionals and students. As presented in Table 5.6 the user s highest level of education has a significant change in comparison to the 2012 study with respect to following groups: High School, 1 to 2 Years University Studies and Without High School. The other groups do not observe relevant changes in comparison to the 2012 survey. 28
31 Table 5.6 Tren Urbano Highest Level of Education Group Change Without High School 5% 13% -8% High School 19% 26% -7% 1 to 2 Years University Studies 29% 13% 16% Professional Career 1% 3% -2% Associate Degree 11% 12% -1% Bachelor Degree 22% 24% -2% Master Degree 8% 6% 2% Doctoral Degree 2% 2% 0% Not Opinion 3% 1% 2% There was no significant change in users with disabilities or within civil status or language parameters as compared to the 2012 survey. See Tables 5.7, 5.8 and 5.9. Table 5.7 Users with Disabilities Table 5.8 Civil Status User with Change Status Change Disabilities Married 23% 25% -2% Yes 5% 5% 0% Divorced 7% 5% 2% No 92% 90% 2% Single 65% 61% 4% Not Answered 3% 5% -2% Widowed 3% 3% 0% Not Opinion 6% 5% 1% Table 5.9 Language Language Change Spanish 95% 94% 1% English 2% 2% 0% Spanish and English 3% 3% 0% Others 0% 0% 0% Not Answered 0% 1% -1% 5.2 Tren Urbano users Trips Patterns The trip patterns of Tren Urbano users have minimum changes in comparison to the 2012 survey. The most relevant change was observed in the arrival modal distribution. The amount of users that get to the stations via AMA or Metrobus decreased from 17% in 2012 to 10% in Table 5.10 summarizes the modal distribution changes in comparison to the 2012 survey. Table 5.10 Tren Urbano Arrival Modal Distribution Mode Change Personal Car 30% 30% 0% Walking 31% 30% 1% AMA/Metrobus 10% 17% -7% Kiss & Ride 20% 13% 7% Públicos 4% 6% -2% Other 4% 4% 0% 29
32 As presented in Table 5.11 the Tren Urbano users trip purpose observed a significant change in comparison to the 2012 study within the Go to Work category, decreasing 14% and within the Get Home, increasing 18%. The other groups do not present relevant changes in comparison to the 2012 study. Table 5.11 Tren Urbano Users Trip Purpose Purpose Change Get Home 26% 8% 18% Go to Work 26% 40% -14% To Study/ Go to School 24% 27% -3% Run Errands 10% 12% -2% Visiting doctor or hospital 6% 7% -1% Visiting Friends or Family 3% 1% 2% Go Shopping 2% 1% 1% For leisure 1% 2% -1% Other 2% 1% 1% As presented in table 5.12, the amounts of costumers that use the train 4 days per week increase a 7% in comparison to the 2012 study. Also it is observed a reduction in the customers who use the train more than 5 days per week (-6%) and 5 days a week (-5%). Table 5.12 Tren Urbano Users Travel Frequency Frequency Change 5 days per week 37% 42% -5% 3 to 4 days per week 26% 19% 7% more than 5 days per week 13% 18% -6% 1 day per week 11% 8% 3% 2 days per week 8% 7% 1% Only on special events 5% 4% 1% Not answer 1% 2% -2% The Discount Fare usage does not present a significant change in comparison to the 2012 survey. Table 5.13 presents the comparisons between the 2015 survey and the 2012 survey. Table 5.13 Tren Urbano Users Discount Fare Usage Fare Change Senior (60 a 74 years) 6% 4% 2% Students 25% 29% -4% Person with a Disability 2% 1% 1% Super Senior (75 years or More) 2% 1% 1% Regular Fare and Unlimited Passes 63% 63% 0% Other or not answer 3% 2% 1% 30

33 ADDENDUM I: TITLE VI REQUIREMENTS SURVEY QUESTIONNAIRE 31
34 ADDENDUM II: TREN URBANO USERS RESIDENCE MUNICIPALITY Municipality Frequency % San Juan % Bayamón % Guaynabo % Toa Baja % Toa Alta % Carolina % Dorado % Trujillo Alto % Cataño % Caguas % Unknow % Naranjito % Corozal % Barranquitas % Gurabo % Vega Baja % Cidra % Luquillo % Morovis % Orocovis % Municipality Frequency % Ponce % Quebradillas % Vega Alta % Aguada Aguadilla Aguas Buenas Canóvanas Comerío Cupey Fajardo Hato Rey Isabela Juncos Loiza Manatí Río Grande Salinas Utuado Yabucoa 32
35 ADDENDUM III: TREN URBANBO USERS BY NEIGHBORHOOD Municipality-Neighborhood Frequency % San Juan, Río Piedras % San Juan, Santurce % Bayamón, Unknown % San Juan, Hato Rey % Bayamón, Santa Juanita % San Juan, Las Lomas % Bayamón, Jardines de % Caparra San Juan, Barrio Obrero % San Juan, Puerto Nuevo % San Juan, Unknown % Bayamón, Lomas Verdes % Guaynabo, Unknown % Bayamón, Rexville % San Juan, Cupey % San Juan, Villa Palmeras % Bayamón, Pueblo (centro) % Bayamón, Santa Rosa % Bayamón, Sierra Bayamón % Guaynabo, Torrimar % San Juan, Caparra Terrace % San Juan, Viejo San Juan % Toa Baja, Levittown % Unknown % Bayamón, Hato Tejas % Toa Baja, Sabana Seca % Bayamón, Río Hondo % Dorado, Higuillar % Guaynabo, Pueblo (centro) % Toa Alta, Unknown % Cataño, Las Vegas % San Juan, Reparto % Metropolitano Toa Baja, Unknown % Bayamón, Bayamón Gardens % Bayamón, Urbanización % Carolina, Country Club % Dorado, Unknown % San Juan, Altamesa % San Juan, San Francisco % San Juan, Santa Rita % Toa Alta, Toa Alta Heights % Toa Baja, Candelaria % Bayamón, Cerro Gordo % Bayamón, Forest Hills % Municipality-Neighborhood Frequency % Bayamón, Guaraguao % Bayamón, Hermanas Dávila % Bayamón, Santa Monica % Guaynabo, Guaraguao % Guaynabo, Martínez Nadal % Guaynabo, San Patricio % Guaynabo, Santa Rosa III % San Juan, Caimito % San Juan, Miramar % Toa Alta, Monte Casino % Bayamón, Bayamón Pueblo % Bayamón, Bo. Pájaros % Bayamón, Flamboyan % Gardens Bayamón, Juan Sánchez % Bayamón, Royal Town % Bayamón, Santa Olaya % Bayamón, Sta. Juanita % Caguas, Unknown % Carolina, Los Ángeles % Dorado, Pueblo (centro) % Guaynabo, Amelia % Guaynabo, Santa Maria % San Juan, Condado % Toa Baja, Covadonga % Toa Baja, Pueblo (centro) % Trujillo Alto, Unknown % Bayamón, Alturas de % Flamboyán Bayamón, Ave. Barbosa % Bayamón, Bella Vista % Bayamón, Bo. Juan Sánchez % Bayamón, Bo. Nuevo % Bayamón, Cortijo % Bayamón, Flamingo Hills % Bayamón, Río Bayamon % Bayamón, Sierra Linda % Bayamón, Versalles % Bayamón, Villa Rica % Carolina, Escorial % Carolina, Unknown % Carolina, Villa Carolina % Cataño, Pueblo (centro) % Cataño, Unknown % 33
36 Municipality-Neighborhood Frequency % Guaynabo, Bo. Hato Nuevo % Guaynabo, Bo. Mamey II % Guaynabo, Canta Gallo % Guaynabo, Caparra % Guaynabo, Jardines de % Caparra Guaynabo, Juan Domingo % Guaynabo, Parkville % Guaynabo, Piedras Blancas % Guaynabo, Tortugo % Naranjito, Bo. Nuevo % Orocovis, Bo. Gato % San Juan, Ave. Barbosa % San Juan, Bo. Buen Consejo % San Juan, Buena Vista % San Juan, Country Club % San Juan, Cupey Bajo % San Juan, Dos Pinos % San Juan, Las Cumbres % San Juan, Paseo de Diego % San Juan, Piñero % San Juan, Res. Jardines del % Paraíso San Juan, Sagrado Corazón % San Juan, Santiago Iglesias % San Juan, Urbanización % San Juan, Villa Prades % San Juan, Vista Hermosa % Toa Alta, Bo. Piñas % Toa Alta, Bucarabones % Toa Alta, Quebrada Cruz % Toa Alta, Rexville % Toa Baja, Bo. Macon % Toa Baja, Bo. Pájaros % Toa Baja, Río Piedras % Trujillo Alto, El % Conquistador Trujillo Alto, Carraizo % Trujillo Alto, Pueblo (centro) % Aguada, Piedras Blancas Aguadilla, Unknown Aguas Buenas, Jagueyes Barranquitas, Las Orquideas Barranquitas, Pueblo (centro) Barranquitas, Quebrada Grande Bayamón, Bella Vista Bayamón, Country State Municipality-Neighborhood Frequency % Bayamón, Flamboyan Gardens Bayamón, Forrest View Bayamón, La Milagrosa Bayamón, Lomas Verdes Bayamón, Los Almendros Bayamón, Los Faroles Bayamón, Parque San Miguel Bayamón, Royal Town Bayamón, Alturas de Bayamón Bayamón, área Rural Bayamón, Ave. Betances Bayamón, Betances Bayamón, Bo. Minillas Bayamón, Brisas Bayamón, Buena Vista Bayamón, Bulevard del Río Bayamón, Calle Santa Cruz Bayamón, Cana Bayamón, Canton Mall Bayamón, Carr. 167 Bayamón, Carretera 174 Bayamón, Cerro Bayamon Bayamón, Challets de Bayamon Bayamón, Chinea Bayamón, Colinas del Sol Bayamón, Comerio Bayamón, Cond. Riverside Bayamón, Covadonga Bayamón, Dajous Bayamón, El Plantio Bayamón, Jdnes de Bayamón Bayamón, Las Lomas Bayamón, Magnolia Bayamón, Minilla Bayamón, Miraflores Bayamón, Monte Claro Bayamón, Monte Frío Bayamón, Project Town Bayamón, Quintas del Norte Bayamón, Regional Bayamón, Río Piedras Bayamón, Rio Plantation Bayamón, River Park Bayamón, Riverview 34
37 Municipality-Neighborhood Frequency % Bayamón, San Agustin Bayamón, San Fernando Bayamón, San José Bayamón, Santa Cruz Bayamón, Sector 3 Calles Bayamón, Sector Los Gobeos Bayamón, Sector Montesino Bayamón, Sta. Mónica Bayamón, Sto. Olaya Bayamón, UPRB Bayamón, Vanscoig Bayamón, Villa Espana Bayamón, Villa Verde Bayamón, Villas de San Miguel Bayamón, Vista Alegre Caguas, Bairoa Caguas, Barriada Morales Caguas, Caguas Sur Caguas, Los Prados Caguas, Pueblo (centro) Caguas, Vía 3 Caguas, Villa Blanca Caguas, Villas de Turabo Canóvanas, Bo. Lomas Carolina, 2da. sección Villa Carolina Carolina, Carolina Heights Carolina, Jardines de Country Club Carolina, Metropolis Carolina, Miramar Carolina, Parque Cuestre Carolina, Pueblo (centro) Carolina, Rolling Hills Carolina, Sabana Abajo Carolina, Urbanización Carolina, Villa Fontana Carolina, Villa Justicia Carolina, Vista Mar Cataño, Las Vegas Cataño, Amelia Cataño, Palmas Cucharitas Cataño, Res. Rosendo Matienzo Cataño, Vietnam Cidra, Bo. Sud Arriba Cidra, Sector Rabanal Municipality-Neighborhood Frequency % Comerío, Sector El Verde Corozal, Bo. Cibuco Corozal, Cibuco Corozal, Sector Julio Ortega Corozal, Unknown Cupey, Cupey Alto Dorado, Ave. Front Dorado, Bo. Higuillar Dorado, Bo. Marismilla Dorado, Dorado Playa Dorado, Guarisco Dorado, Las Calandrinas Dorado, Rio Lajas Dorado, Urbanización Fajardo, Calle Desvío Guaynabo, Mansiones Reales Guaynabo, San Ramón Guaynabo, Sierra Berdecia Guaynabo, Alto del Camaron Guaynabo, Ave. Esmeralda Guaynabo, Ave. Los Filtros Guaynabo, Ave.Washington Guaynabo, Balcones de San Pedro Guaynabo, Bello Monte Guaynabo, Bo. Buen Samaritano Guaynabo, Bo. Los Catala Guaynabo, Caimito Guaynabo, Camarones Guaynabo, Carretera #1 Guaynabo, Centro Guaynabo, Cerca de la Alcaldía Guaynabo, Cerca del Colegio Rosabel Guaynabo, Cines Guaynabo, Colinas Metropolitanas Guaynabo, Comunidad Río Bayamón Guaynabo, Garden Hills Guaynabo, Guaynabo Lincoln Park Guaynabo, Las Lomas Guaynabo, Lomas Guaynabo, Los Filtros Guaynabo, Los Frailes 35
38 Municipality-Neighborhood Frequency % Guaynabo, Monacillos Guaynabo, Muda Guaynabo, Muñoz Rivera Guaynabo, Parcela Caneja Guaynabo, Plaza Esmeralda Guaynabo, Plaza Guayanabo Guaynabo, Plaza Torrimar I Guaynabo, Ponce de León Guaynabo, Pueblo Viejo Guaynabo, Quinta Valle Guaynabo, Reparto Vista Verde Guaynabo, Río Bayamon Guaynabo, San Ignacio Guaynabo, Santa Paula Guaynabo, Santa Rosa Guaynabo, Sector Pedro Reyes, Mamey I Guaynabo, Sonadora Guaynabo, Sunny Hills Guaynabo, Valles de Torrimar Guaynabo, Wapa TV Gurabo, El Encanto, Bo. Mamey Gurabo, La Gloria Gurabo, Res. Luis del Carmen Echevarría Hato Rey, Domenech Isabela, Pueblo (centro) Juncos, Estancias Monte Verde Loiza, Jardines en Loiza Luquillo, Vistas de Luquillo Luquillo, Unknown Manatí, Tierras Nuevas Morovis, Bo. Percha Morovis, Unibón Naranjito, Anones Naranjito, Bo. Cedro Abajo Naranjito, Cedro Abajo Naranjito, Cerro Abajo Naranjito, Guadiana Naranjito, Unknown Ponce, Unknown Ponce, Valle Real Quebradillas, Bo. Cacao Quebradillas, La #2 Río Grande, Bo. Palmer Municipality-Neighborhood Frequency % Salinas, Pueblo (centro) San Juan, Baldrich San Juan, La Riviera San Juan, Las Delicias San Juan, Venus Gardens San Juan, Villa Prades San Juan, Alameda San Juan, Ave. Borinquen San Juan, Ave. De Diego San Juan, Ave. San Patricio San Juan, Barriada Venezuela San Juan, Bo. Figueroa San Juan, Bo. Monacillos San Juan, Bo. Tortugo San Juan, Bo. Venezuela San Juan, Calle Francia San Juan, Calle Piñero San Juan, Camino Los Pizarros San Juan, Centro Medico San Juan, Coliseo de P.R. San Juan, Cond. El Norte Monte San Juan, Cond. French Plaza San Juan, Condominio Las Lomas San Juan, Cupey Gardens San Juan, Detras de la UMET San Juan, Domenech San Juan, El Señorial San Juan, El Viejo San Juan San Juan, Highland Park San Juan, Hipodromo San Juan, Hyde Park San Juan, La Georgetti San Juan, Los Paseos San Juan, Medias Casas Sagrado San Juan, Monacillos San Juan, Monte Sur San Juan, Montehiedra San Juan, Parada 20 San Juan, Parcelas Falu San Juan, Park Gardens San Juan, Parque Monacillos San Juan, Pueblo (centro) San Juan, Puerta de Tierra San Juan, Roosevelt 36
39 Municipality-Neighborhood Frequency % San Juan, Sabana Llana San Juan, San Fernando San Juan, San Gerardo (Cupey) San Juan, Santurce frente laguna Condado San Juan, Santurce Parada 18 San Juan, Santurce, Parada 17 San Juan, Santurce, Parada 25 San Juan, Supermercado Unbo San Juan, University Gardens San Juan, Villa España San Juan, Villa Nevarez San Juan, Villa Olímpica Toa Alta, Toa Linda Toa Alta, Bo. Ortiz Toa Alta, Bo. Pájaros Toa Alta, Ciudad Jardín III Toa Alta, Galateo Toa Alta, Jardines Casa Blanca Toa Alta, Los Frailes Toa Alta, Monte Sol Toa Alta, Montecasino Heights Toa Alta, Ortíz Toa Alta, Pueblo (centro) Toa Alta, Rabo del Guey Toa Alta, Río Piedras Toa Alta, Sector 4 Toa Alta, Terrazas del Toa Toa Alta, Urbanización Toa Alta, Walmart La Virgencita Municipality-Neighborhood Frequency % Toa Baja, Altagracia Toa Baja, Covadonga Toa Baja, El Plantío Toa Baja, Altagracia Toa Baja, Area de la Virgensita Toa Baja, Bo. Candelaria Toa Baja, Campanilla Toa Baja, Estancias de la Fuente Toa Baja, Ingenio Toa Baja, Número 2 Toa Baja, Sector 26 Toa Baja, Villa Calma Trujillo Alto, Interamericana Trujillo Alto, Apartamentos Interamericana Trujillo Alto, Bo. Cuevas Trujillo Alto, Bo. La Gloria Trujillo Alto, Caney Trujillo Alto, Cerca de Andalucía Trujillo Alto, Cooperativa Trujillo Alto, Fairview Trujillo Alto, Saint Just Trujillo Alto, Venus Gardens Utuado, Pueblo (centro) Vega Alta, Bo. Espinosa Vega Alta, Cerro Gordo Vega Baja, Las Flores Vega Baja, Alimirante Sur Vega Baja, Bo. La Trocha Yabucoa, Aguacate 37
40 ADDENDUM IV: USERS DESTINATIONS AND DISTANCE FROM THE STATIONS A. Bayamon Station Final Destination Frequency Distance to Final Destination (km) Bayamon Centro Toa Baja UPR Bayamon Canton Mall Cataño Pueblo Levittown Rio Piedras Toa Baja, BO Pajaros Arecibo Bayamon Guaraguao Bayamon Minillas Bayamon Sector el 8 Centro Medico Bayamon Santa Rosa Vega Alta Alturas de Bucarabones Barrio la Mancion Barranquitas Bayamon Gardens Bayamon, Secor Los Gobeos Universidad Interamericana Bayamon Final Destination Frequency Distance to Final Destination (km) Bella Vista Cataño Puente Blanco Cataño, Bo. Las Palmas Cierra Bayamon Colegio Plaza Bayamon Energia Electrica Bayamon Hato Tejas Hosp. Hermanos Melendes ICPR Bayamon Lomas Verde Puertos-Dorado Res. Virgilio Davila Rexville Rio Hondo Santa Olaya Sector Tito Torres Sierra Bayamon Sierra Linda Santa Juanita Toa Alta Toa Baja, Bo Candelaria Tribunal Bayamon Vega Baja Villa Conteza
41 B. Deportivo Station Final Destination Frequency Distance to Final Destination (km) Deportivo Santa Rosa Bayamon Centro Bayamon Santa Juanita Tribunal De Bayamon Toa Baja UPR Bayamon Barrio Nuevo Buena Vista CAMA Camuy Canton Mall Forest Hill-Bayamon Rexville Santa Rosa Mall Santa Teresita Sector "Cerca Del Amigo" Sector El Riito Toa Baja, Sabana Seca Van Scoy C. Jardines Station Final Destination Frequency Distance to Final Destination (km) Jardines De Caparra Guaynabo Jardines de Caparra MEPSI Center UPRB. Juan Sanchez D. Torrimar Station Final Destination Frequency Distance to Final Destination (km) Guaynabo Torrimar Garden Hills Juan Domingo Sagrado Corazon San Patricio Escuela detorrimar
42 E. Martinez Nadal Station Final Destination Frequency Distance to Final Destination (km) Martínez Nadal Guaynabo Alameda Tower Los Frailes Altamira Atlantic University College Ave piñero Bayamon Bello Monte Bo. Camarones, Guaynabo Residencial Vista Hermosa Encantada Guaynabo City View Plaza Gurabo Hato Rey Hospital Metropolitano Las Lomas Lomas Verdes Monacillos Urb. Muños Rivera Rio Piedras Sagrado Corazón San Juan San Patricio Santa Rosa II Sector Laberinto Señorial Banco Popular Universidad
43 F. Las Lomas Station 06 Las Lomas Final Destination Frequency Distance to Final Destination (km) Las Lomas Caparra Terrace Santa Rita Santiago Iglecias Cerca de la Estacion Farmacia Yarimar Departamento de Hacienda, Viejo San Juan Res. Villa España Rio Piedras SAN PATRICIO Santurce-Barrio Obrero Trabajo en Colegio Urb. Altamesa G. San Francisco Station Final Destination Frequency Distance to Final Destination (km) San Francisco, Rio Piedras Fondo del Seguro del Estado Domenech Hosp De Veteranos Puerto Nuevo Vista Hermosa AMA Ave. San Patricio Bo. Barrazas Carolina Caguas Caparra Terrace Cupey Guaynabo Monacillos Res. Vista Hermosa Rio Piedras Sagrado Corazon San Fernando Bayamon San Fernando, Ave De Diego
44 H. Centro Medico Station I. Cupey Station Final Destination Frequency Distance to Final Destination (km) Centro Medico Hosp De Veteranos Ciencias Medicas Rio Piedras COSVI Hato Rey Reparto Metropolitano Hospital Industrial Hospital Municipal Hospital Universitario Santurce Villa Nevarez Final Destination Frequency Distance to Final Destination (km) Cupey Cupey Universidad (UMET) Interamericana Trujillo Alto Bayon El Cinco Etica Gubernamental Hospital de Veteranos Las Curias las lomas rio piedras san francisco Trabajo-Chofer de Guagua Sierra Bayamon Urb. Caribe
45 J. Rio Piedras Station Final Destination Frequency Distance to Final Destination (km) Río Piedras Centro UPR Rio Piedras PASEO DE DIEGO Santa Rita Caguas Carraizo Hato Rey Munoz Rivera Bayamon Bo. Venezuela Buen Consejo canovanillas Carolina Condominio Berwing Cupey Delicias Fajardo Hosp De Veteranos Hospital de Rio Piedras Luqillo Plaza de Recreo Rio Piedras Plaza del Mercado de Rio Piedras Res. Manuala Perez Res quintana Rio Piedras CESCO Santa Rosa Santa Teresita Terminal AMA Trujillo Alto K. Universidad Station Final Destination Frequency Distance to Final Destination (km) UPR Rio Piedras Río Piedras Centro Santa Rita-Rio Piedras Bayamon Caimito Hato Rey JARDINES Pase de Diego
46 L. Piñero Station Final Destination Frequency Distance to Final Destination (km) Hato Rey Piñero Centro Judicial Esc. Hotelera San Juan Hospital Auxilio Mutuo Rio Piedras VILLA PRADES Aeropuerto Banco Popular Barrio San Jose, Rio Piedras Calle Mayaguez Carolina, Country Club Country Club Dept. Vivienda Ave. Domenech Floral Park Isla Verde Loiza Miramar San Juan, Floral Park Tribunal Supremo Trujillo Alto M. Piñero Station Final Destination Frequency Distance to Final Destination (km) Hato Rey Domenech AELA Dpto. Del Trabajo Hospital Pavia- Hato Rey Sagrado Corazon Ave. Munoz Rivera Domenech EDP College Guayama Santurce Santurce-Barrio Obrero Urb. Perez Moris Villa Palmera
47 N. Roosevelt Station Final Destination Frequency Distance to Final Destination (km) Milla De Oro Roosevelt Univ. Politecnica MCS Antiguo Conservatorio de Musica Bayamon Floral Park Manuel A. Perez Minillas Naranjito Puerto Nuevo Rio Piedras O. Hato Rey Station Final Destination Frequency Distance to Final Destination (km) Hato Rey La Milla de Oro Coliseo de Puerto Rico Las Monjas Buena Vista, Hato Rey Dept. De Educacion Instituto de Banca San Juan Capital Center Centro Medico Colegio Universitario de San Juan Corte Federal Escuela de Musica Plaza las Americas Retiro del Gobierno Rio Piedras, San Jose Santa Rita Rio Piedras
48 P. Sagrado Corazon Station 16 Sagrado Corazón Final Destination Frequency Distance to Final Destination (km) Sagrado Corazon Santurce Universidad Sagrado Corazon San Juan Santurce Barrio Obrero Milla De Oro Villa Palmeras Centro Gubernamental Minillas Parada Carolina CONDADO Puerta de Tierra Viejo San Juan Bayamon Dept. De Justicia HOSPITAL Levittown Llorens Torres Mercantil Plaza Miramar Off. Municipio de San Juan Parada Parada Pueblo Guaynabo Sadrado Corazon-Servicio al Cliente SAN FERNANDO Santa Monica Santa Rosa Universal Carrer


:")
")
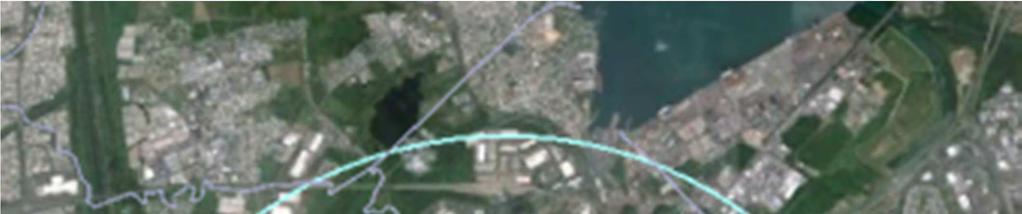
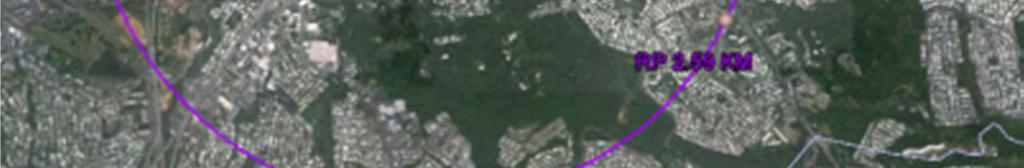
49 ADDENDUM V: STATIONS RADIUS OF ACTIONS Bayamon (10.21 KM): Deportivo (6.36 KM) 47
:")
:")


50 Jardines (3.0 KM): Torrimar (3.9 km): 48


51 Martinez Nadal (5.56 KM) Las Lomas (3.18 km) 49


 50")

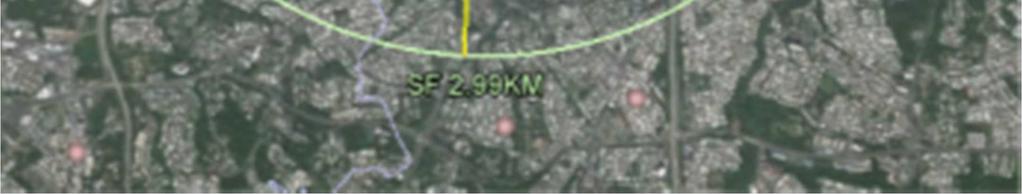
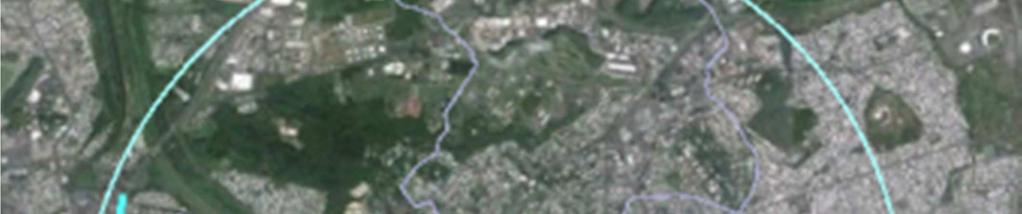
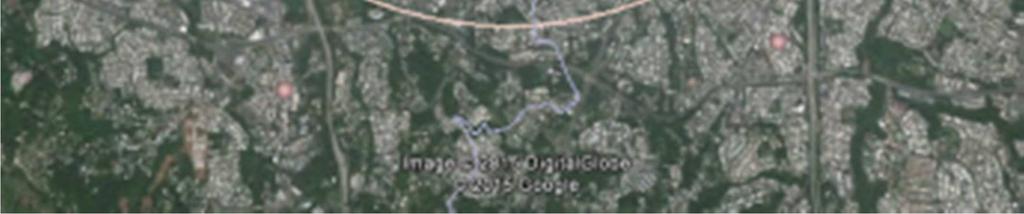
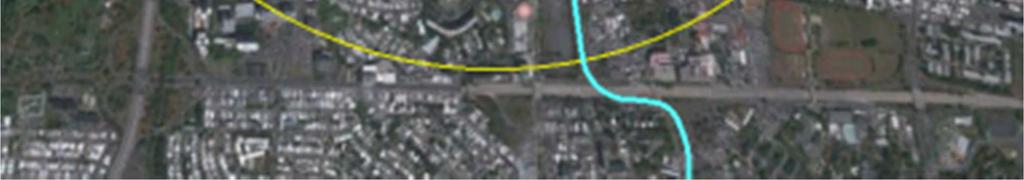
52 San Francisco (2.99KM): Centro Medico (2.84 km) 50
")


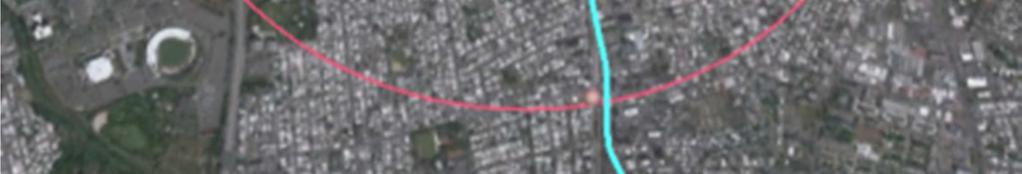
53 Cupey (2.82 KM) Rio Piedras (2.59 km) 51


54 Universidad (0.33KM) Piñero (1.17 km) 52
")
")


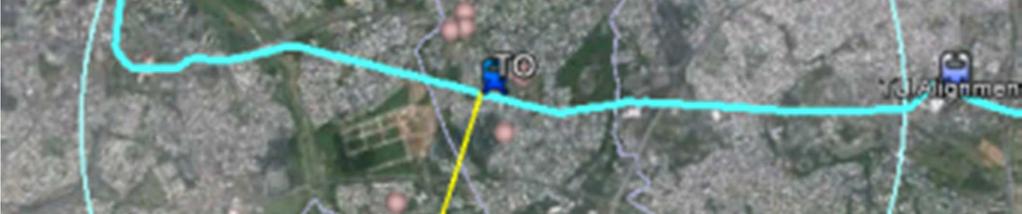
55 Domenech (0.76 KM) Roosevelt (1.66 km) 53
")


56 Hato Rey (1.59 km) Sagrado Corazon (3.88 km) 54

57 ADDENDUM VI: PR 2010 CENSUS SUMMARY 55
$ FACTS ABOUT PUERTO RICO: WAGE HOUSING MOST EXPENSIVE AREAS WAGE RANKING
 STATE #52 * RANKING In Puerto Rico, the Fair Market Rent () for a two-bedroom apartment is $480. In order this level of and utilities without paying more than 30% of income on housing a household must
$9.68 PER HOUR STATE HOUSING WAGE
 PUERTO RICO STATE #2 * RANKING In Puerto Rico, the Fair Market Rent () for a two-bedroom apartment is $04. In order to afford this level of and utilities without paying more than of income on housing a
Hazus: Estimated Damage and Economic Losses. Puerto Rico, United States
 HURRICANE MARIA Initial Hazus Run, 27 November 2017 ARA wind field Hazus: Estimated and Economic es, United States Initial Hazus Wind Estimates for Hurricane Maria using the ARA wind field. Note: Model
October 10, Michael Moriarty Mitigation Division Director FEMA Region II
 U. S. Department of Homeland Security Region II One World Trade Center, 52nd Floor New York, NY 10007 October 10, 2017 MEMORANDUM FOR: Alejandro De La Campa Federal Coordinating Officer FEMA-4339-DR &
LIHTC Properties in Puerto Rico through 2015
 LIHTC Properties in Puerto Rico through 2015 nprofit PIS ALAMEDA II 4 CARR 21 SAN JUAN PR 1988 t Indicated 1988 Acquisition and Rehab 150 150 ALAMEDA TOWER III SAN JUAN PR 1989 $533,862 1989 Acquisition
Children in Puerto Rico: Results from the 2000 Census. By Mark Mather
 Children in Puerto Rico: Results from the 2000 Census By Mark Mather The Annie E. Casey Foundation and the Population Reference Bureau August 2003 KIDS COUNT KIDS COUNT, a project of the Annie E. Casey
Making the TOD Vision a Reality: Two US Case Studies
 Making the TOD Vision a Reality: Two US Case Studies The World Bank Transport Forum 2006 Washington, DC The South Boston Waterfront Boston, Massachusetts Boston s Unique Opportunity: 300 Acres Next to
How Maria Forges PR s Future
 H.Calero Consulting Group, Inc. How Maria Forges PR s Future Assessment and Forecast An economy in recession Real GNP growth, % High Moderate Negative 8.0% 0% -1.1% Source: PR Planning Board with investment
Agenda RECOVERY UPDATES HURRICANE HARVEY HURRICANE IRMA HURRICANE MARIA USPS COMMUNICATION
 October 4, 2017 1 Agenda RECOVERY UPDATES HURRICANE HARVEY HURRICANE IRMA HURRICANE MARIA USPS COMMUNICATION 2 3 Harvey Recovery Texas All Plants operational, including BMEUs and drop shipments Customers
Puerto Rico Department of Transportation and Public Works Highway and Transportation Authority
 Puerto Rico Department of Transportation and Public Works Highway and Transportation Authority San Juan Urbanized Area (SJUA) Urbanized Areas Under 200,000 in Population (UZA) Aguadilla Urbanized Area
JATA Market Research Study Passenger Survey Results
 JATA Market Research Study Passenger Survey Results Prepared for the Jackson Area Transportation Authority (JATA) April, 2015 3131 South Dixie Hwy. Suite 545 Dayton, OH 45439 937.299.5007 www.rlsandassoc.com
A Conceptual Framework for Measuring the Exposure to Tsunamis of Puerto Rican Coastal Communities
 Meulaboh, Aceh A Conceptual Framework for Measuring the Exposure to Tsunamis of Puerto Rican Coastal Communities Jean-Edouard Faucher Saylisse Dávila, PhD Department of Industrial Engineering University
Final Report Waste Characterization Study
 Final Report Waste Characterization Study Prepared For: Prepared By: October 24, 2003 1 INTRODUCTION AND BACKGROUND The Solid Waste Management Authority of Puerto Rico (SWMA) contracted with Wehran Puerto
San Juan Harbor Navigation Improvements Feasibility Study
 San Juan Harbor Navigation Improvements Feasibility Study DRAFT Economics Appendix RELEASED 8/8/17 1 EXECUTIVE SUMMARY San Juan Harbor is located on the northeastern coast of Puerto Rico and is the island
Population Composition, Geographic Distribution, and Natural Hazards: Vulnerability in the Coastal Regions of Puerto Rico
 Population Composition, Geographic Distribution, and Natural Hazards: Vulnerability in the Coastal Regions of Puerto Rico Researchers Havidán Rodríguez, Ph.D. (DRC-UDel) Walter Díaz, Ph. D. (CISA-UPRM)
GDB Supplemental Information
 GDB Supplemental Information May 2017 Table of Contents I. Summary of Outstanding Loan and Deposit Balances II. Summary Detail of Municipal Cash Flow Projections and Loan Detail III. Summary of Gross Deposits
San Francisco Municipal Transportation Agency (SFMTA) Travel Decision Survey 2012
 Travel Decision Survey 2012") Note: The weighting used in this report is not consistent with Travel Decision Surveys (TDS) 2013 and 2014, and findings from this report should not be compared with findings from TDS 2013 and TDS 2014.
Note: The weighting used in this report is not consistent with Travel Decision Surveys (TDS) 2013 and 2014, and findings from this report should not be compared with findings from TDS 2013 and TDS 2014.
Travel Decision Survey Summary Report. San Francisco Municipal Transportation Agency (SFMTA)
") Note: The weighting used in this report is not consistent with Travel Decision Surveys (TDS) 2013 and 2014, and findings from this report should not be compared with findings from TDS 2013 and TDS 2014.
Note: The weighting used in this report is not consistent with Travel Decision Surveys (TDS) 2013 and 2014, and findings from this report should not be compared with findings from TDS 2013 and TDS 2014.
Reference Number. Station
 Table A.7 Population and Number of Households within 800m Radius of Proposed s ALTERNATIVE 1 ALTERNATIVE 2 ALTERNATIVE 3 Reference Number Population Households Reference Number Population Households Population
PREFACE. Service frequency; Hours of service; Service coverage; Passenger loading; Reliability, and Transit vs. auto travel time.
 PREFACE The Florida Department of Transportation (FDOT) has embarked upon a statewide evaluation of transit system performance. The outcome of this evaluation is a benchmark of transit performance that
Cedar Rapids Area Convention and Visitors Bureau Visitor Study
 Cedar Rapids Area Convention and Visitors Bureau Visitor Study 2003-2004 University of Northern Iowa Sustainable Tourism & The Environment Program www.uni.edu/step Project Directors: Sam Lankford, Ph.D.
Dynamic Itinerary for Infrastructure Projects Public Policy Document
 Apartado 40285 San Juan, Puerto Rico 00940 Dynamic Itinerary for Infrastructure Projects May 2008 Report Prepared By: MP Engineers of Puerto Rico, P.S.C. Las Vistas Shopping Village 300 Ave Felisa Rincon
Puerto Ricans in Ohio, the United States, and Puerto Rico, 2014
 Issued April 2016 Centro DS2015US-12 Puerto Ricans in Ohio, the United States, and Puerto Rico, 2014 In 2014, Ohio had the tenth largest number of Puerto Ricans in the United States with 108,174 residents,
Puerto Ricans in Rhode Island, the United States, and Puerto Rico, 2013
 Issued September 2016 Centro DS2015US-07 Puerto Ricans in Rhode Island, the United States, and Puerto Rico, 2013 In 2013 an estimated 36,217 Puerto Ricans lived in Rhode Island and accounted for at least
PROFILE OF THE PUERTO RICAN POPULATION IN UNITED STATES AND PUERTO RICO: 2008
 PROFILE OF THE PUERTO RICAN POPULATION IN UNITED STATES AND PUERTO RICO: 2008 Sonia G. Collazo, Camille L. Ryan, Kurt J. Bauman U.S. Census Bureau Housing and Household Economic Statistics Division This
Puerto Ricans in Connecticut, the United States, and Puerto Rico, 2014
 Issued April 2016 Centro DS2016US-8 Puerto Ricans in Connecticut, the United States, and Puerto Rico, 2014 In 2014, Connecticut was the 6th state with most Puerto Ricans (301,182) in the United States.
Title VI Service Equity Analysis
 Pierce Transit Title VI Service Equity Analysis Pursuant to FTA Circular 4702.1B NE Tacoma Service May 2016 Pierce Transit Transit Development Dept. PIERCE TRANSIT TITLE VI SERVICE EQUITY ANALYSIS TABLE
Case 3:14-cv Document 1 Filed 02/19/14 Page 1 of 12 IN THE UNITED STATES DISTRICT COURT FOR THE DISTRICT OF PUERTO RICO
 Case 3:14-cv-01136 Document 1 Filed 02/19/14 Page 1 of 12 IN THE UNITED STATES DISTRICT COURT FOR THE DISTRICT OF PUERTO RICO MUNICIPALITY OF SAN SEBASTIAN Plaintiff CIVIL NO. 14-1136 CIVIL RIGHTS DECLARATORYJUDGMENT
part one: comparing puerto ricans
 part one: comparing puerto ricans snapshot: puerto ricans across major us metro areas This section uses data from the 2010 American Community Survey one-year estimates to examine the socioeconomic characteristics
SAMTRANS TITLE VI STANDARDS AND POLICIES
 SAMTRANS TITLE VI STANDARDS AND POLICIES Adopted March 13, 2013 Federal Title VI requirements of the Civil Rights Act of 1964 were recently updated by the Federal Transit Administration (FTA) and now require
CANOVANAS URBAN DEVELOPMENT CORP. P.O. BOX SAN JUAN, P.R
 CANOVANAS URBAN DEVELOPMENT CORP. P.O. BOX 9021990 SAN JUAN, P.R. 00902-1990 787-602-8955 proyectosnuevospr@gmail.com COMMERCIAL LOTS FOR SALE UP TO 60,000 S.F. AVAILABLE FOR CONSTRUCTION Karla Mas O Neill
SATISFIED CUSTOMERS AND PROJECTS COMPLETED
 SATISFIED CUSTOMERS AND PROJECTS COMPLETED Volleyball Equipment - 2010 Central American And Caribbean Games, Boquerón Sport Flooring Warm-Up Courts- Palacio de Recreación y Deportes at the Municipality
2013 IRVING HOTEL GUEST SURVEY Final Project Report
 2013 IRVING HOTEL GUEST SURVEY Final Project Report Research prepared for the Irving Convention & Visitors Bureau by Destination Analysts, Inc. Table of Contents SECTION 1 Introduction 2 SECTION 2 Executive
Evidence from the FRBNY Puerto Rico Small Business Survey REGIONAL PERSPECTIVES ON PUERTO RICO SMALL BUSINESS
 Evidence from the FRBNY Puerto Rico Small Business Survey REGIONAL PERSPECTIVES ON PUERTO RICO SMALL BUSINESS I Evidence from the FRBNY Puerto Rico Small Business Survey REGIONAL PERSPECTIVES ON PUERTO
Existing Services, Ridership, and Standards Report. June 2018
 Existing Services, Ridership, and Standards Report June 2018 Prepared for: Prepared by: Contents Overview of Existing Conditions... 1 Fixed Route Service... 1 Mobility Bus... 34 Market Analysis... 41 Identification/Description
Barbadians. imagine all the people. Barbadians in Boston
 Barbadians imagine all the people Barbadians in Boston imagine all the people is a series of publications produced by the Boston Redevelopment Authority for the Mayor s Office of Immigrant Advancement.
Puerto Ricans in Georgia, the United States, and Puerto Rico, 2014
 Issued September 2016 Centro DS2014GA-14 Puerto Ricans in Georgia, the United States, and Puerto Rico, 2014 In 2014, an estimated 89,462 Puerto Ricans lived in Georgia and accounted for 1.7 percent of
Juneau Household Waterfront Opinion Survey
 Juneau Household Waterfront Opinion Survey Prepared for: City and Borough of Juneau Prepared by: April 13, 2004 TABLE OF CONTENTS Executive Summary...1 Introduction and Methodology...6 Survey Results...7
Puerto Ricans in Massachusetts, the United States, and Puerto Rico, 2014
 Issued April 2016 Centro DS2016US-07 Puerto Ricans in Massachusetts, the United States, and Puerto Rico, 2014 In 2014, Massachusetts was the fifth state with most Puerto Ricans in the United States. In
TABLE OF CONTENTS PREFACE & CONTACTS DEMOGRAPHICS TRAVEL BEHAVIOR CHARACTERISTICS MODAL STATISTICS TOURISM TRANSPORTATION FINANCING
 TABLE OF CONTENTS PREFACE & CONTACTS DEMOGRAPHICS TRAVEL BEHAVIOR CHARACTERISTICS MODAL STATISTICS TOURISM TRANSPORTATION FINANCING TRANSPORTATION EDUCATION & RESEARCH DIRECTORY MISCELLANEOUS INDEX on
Irish Fair of Minnesota: 2017 Attendee Profile
 TOURISM CENTER Irish Fair of Minnesota: 2017 Attendee Profile Authored by Xinyi Qian, Ph.D. Irish Fair of Minnesota: 2017 Attendee Profile November 13, 2017 Authored by Xinyi (Lisa) Qian, Ph.D., University
CORNWALL VISITOR FREQUENCY SURVEY
 CORNWALL VISITOR FREQUENCY SURVEY Analysis and Report from PFA Research Ltd 2 nd December 2015 Authors: Robert Rush, Managing Director robert.rush@pfa-research.com Emma Lydon, Research & Marketing Consultant
2015 IRVING HOTEL GUEST SURVEY Final Project Report
 2015 IRVING HOTEL GUEST SURVEY Final Project Report Research prepared for the Irving Convention & Visitors Bureau by Destination Analysts, Inc. Table of Contents S E C T I O N 1 Introduction 2 S E C T
(No. 9) (Approved April 8, 2001) AN ACT
 (Approved April 8, 2001) AN ACT") (S. B. 148) (No. 9) (Approved April 8, 2001) AN ACT To establish the Puerto Rico National Parks System, establish its objectives, its administration, the powers and duties of the Executive Director of
(S. B. 148) (No. 9) (Approved April 8, 2001) AN ACT To establish the Puerto Rico National Parks System, establish its objectives, its administration, the powers and duties of the Executive Director of
St. Johns River Ferry Patron Survey May 16, 2012
 St. Johns River Ferry Patron Survey May 16, 2012 Committee Report Introduction Study Survey Survey Surveyor Summary Table of Contents Executive Summary... ES-1 Section 1 ONE... 1-1 Section 2 TWO Methodology...
Tram Passenger Survey
 Key findings Autumn 2015 Foreword Jeff Halliwell Now in its third year, our Tram Passenger Survey has covered passengers views of their journey in six network areas in Britain. For the second time this
Chapter 4. Ridecheck and Passenger Survey
 Chapter 4. Ridecheck and Passenger Survey YOLOBUS operates a mix of local, intercity, commute and rural routes. Because there are limited roadways that intercity and rural routes can operate on, stop by
2006 RENO-SPARKS VISITOR PROFILE STUDY
 2006 RENO-SPARKS VISITOR PROFILE STUDY PREPARED FOR RENO-SPARKS CONVENTION & VISITOR AUTHORITY Study Conducted and Reported by 475 Hill Street, Suite 2 Reno, Nevada 89501 (775) 323-7677 www.infosearchintl.com
DRAFT Service Implementation Plan
 2017 Service Implementation Plan October 2016 SECTION NAME 2017 Service Implementation Plan October 2016 2017 SERVICE IMPLEMENTATION PLAN TABLE OF CONTENTS Table of Contents... I List of Tables... III
RESULTS FROM WYOMING SNOWMOBILE SURVEY: EXECUTIVE SUMMARY
 RESULTS FROM 2000-2001 WYOMING SNOWMOBILE SURVEY: EXECUTIVE SUMMARY Prepared for the Wyoming Department of State Parks and Historic Sites, Wyoming State Trails Program. Prepared By: Chelsey McManus, Roger
A COMPARISON OF THE MILWAUKEE METROPOLITAN AREA TO ITS PEERS
 KRY/WJS/EDL #222377 (PDF: #223479) 1/30/15 PRELIMINARY DRAFT Memorandum Report A COMPARISON OF THE MILWAUKEE METROPOLITAN AREA TO ITS PEERS EXECUTIVE SUMMARY This memorandum report provides a statistical
Date: 11/6/15. Total Passengers
 Total San Diego Metropolitan Transit System POLICY 42 PERFORMANCE MONITORING REPORT Page 1 of 6 OBJECTIVE Develop a Customer-Focused and Competitive System The following measures of productivity and service
Title VI Service Equity Analysis
 Pierce Transit Title VI Service Equity Analysis Pursuant to FTA Circular 4702.1B September 2013 Service Change February 2013 Page intentionally left blank PIERCE TRANSIT TITLE VI SERVICE EQUITY ANALYSIS
All Door Boarding Title VI Service Fare Analysis. Appendix P.3
 All Door Boarding Title VI Service Fare Analysis Appendix P.3 Metro Board Report Los Angeles County Metropolitan Transportation Authority One Gateway Plaza 3rd Floor Board Room Los Angeles,
PUBLIC OPINION RESEARCH SURVEY RESULTS
 PUBLIC OPINION RESEARCH SURVEY RESULTS www.floridaopinionresearch.com All Materials and Intellectual Property 2015 Florida Opinion Research @FlaOpinResearch 1 Telephone interviews performed by specially-trained
Puerto Rico Public Housing Administration
 Annual Statement / Performance and Evaluation Report Capital Fund Program, Capital Fund Program Replacement Housing Factor and Capital Fund Financing Program HA Name: Grant Type and : FFY of Grant : Puerto
HOUSEHOLD TRAVEL SURVEY
 HOUSEHOLD TRAVEL SURVEY Household Travel Survey i TABLE OF CONTENTS Page 1.0 INTRODUCTION... 1 2.0 SUMMARY OF TRAVEL... 2 2.1 All-Day Travel Patterns... 2 2.1.1 Automobile Availability... 2 2.1.2 Trip
REVIEW OF SUN METRO LIFT SERVICES
 REVIEW OF SUN METRO LIFT SERVICES Prepared for Review by Linda Cherrington, Research Scientist Suzie Edrington, Associate Research Scientist Zachary Elgart, Associate Transportation Researcher Shuman Tan,
rtc transit Before and After Studies for RTC Transit Boulder highway UPWP TASK Before Conditions
 rtc transit Before and After Studies for RTC Transit UPWP TASK 3403-11-14 Before Conditions Report Boulder highway June 2011 Before and After Studies for RTC Transit BOULDER HIGHWAY BEFORE STUDY UPWP Task
Longitudinal Analysis Report. Embry-Riddle Aeronautical University - Worldwide Campus
 Longitudinal Analysis Report Embry-Riddle Aeronautical University - Worldwide Campus Time Span 1: 7/1/2013-6/30/2014 Total Tests = 0 Outbound = 0 Time Span 2: 7/1/2014-6/30/2015 Total Tests = 156 Outbound
Longitudinal Analysis Report. Embry-Riddle Aeronautical University - Worldwide Campus
 Longitudinal Analysis Report Embry-Riddle Aeronautical University - Worldwide Campus Time Span 1: 7/1/2013-6/30/2014 Total Tests = 0 Outbound = 0 Time Span 2: 7/1/2014-6/30/2015 Total Tests = 0 Outbound
Att. A, AI 46, 11/9/17
 Total s San Diego Metropolitan Transit System POLICY 42 PERFORMANCE MONITORING REPORT Page 1 of 6 Date: 11/8/17 OBJECTIVE Develop a Customer-Focused and Competitive System The following measures of productivity
Fixed-Route Operational and Financial Review
 Chapter II CHAPTER II Fixed-Route Operational and Financial Review Chapter II presents an overview of route operations and financial information for KeyLine Transit. This information will be used to develop
T H E VILLAGE OF P h i l m o n t, N Y
 T H E VILLAGE OF P h i l m o n t, N Y Summit Reservoir Area Plan November 17, 2014 Executive Steering Committee Meeting 2 Agenda 1:00 1. Welcome 2. Housekeeping & updates i. Committee contact list review
APPENDIX B COMMUTER BUS FAREBOX POLICY PEER REVIEW
 APPENDIX B COMMUTER BUS FAREBOX POLICY PEER REVIEW APPENDIX B COMMUTER BUS FAREBOX POLICY PEER REVIEW The following pages are excerpts from a DRAFT-version Fare Analysis report conducted by Nelson\Nygaard
Mount Pleasant (42, 43) and Connecticut Avenue (L1, L2) Lines Service Evaluation Study Open House Welcome! wmata.com/bus
 and Connecticut Avenue (L1, L2) Lines Service Evaluation Study Open House Welcome! wmata.com/bus") Mount Pleasant (42, 43) and Connecticut Avenue (L1, L2) Lines Service Evaluation Study Open House Welcome! Study Overview and Timeline Phase 1: Collect and Analyze Data Project Kickoff, September 2017
Mount Pleasant (42, 43) and Connecticut Avenue (L1, L2) Lines Service Evaluation Study Open House Welcome! Study Overview and Timeline Phase 1: Collect and Analyze Data Project Kickoff, September 2017
A COMPARISON OF THE MILWAUKEE METROPOLITAN AREA TO ITS PEERS
 KRY/WJS/EDL #222377 v4 (PDF: #223479v2) 4/1/15 APPENDIX D REVISED DRAFT Memorandum Report A COMPARISON OF THE MILWAUKEE METROPOLITAN AREA TO ITS PEERS EXECUTIVE SUMMARY This report provides a statistical
Santa Barbara County Association of Governments 2002 COMMUTE PROFILE
 Santa Barbara County Association of Governments 2002 COMMUTE PROFILE for Santa Barbara, San Luis Obispo and Ventura Counties FINAL REPORT Santa Barbara County Association of Governments - 2002 COMMUTE
Trail Use in the N.C. Museum of Art Park:
 Trail Use in the N.C. Museum of Art Park: New Connections, New Visitors Jacqueline MacDonald Gibson, PhD Daniel Rodriguez, PhD Taylor Dennerlein, MSEE, MCRP, EIT Jill Mead, MPH Evan Comen University of
New free City connector bus service
 The Adelaide City Council invites engagement from the community about New free City connector bus service 99C City Loop and Adelaide Connector free bus services to merge: Project Summary Adelaide City
Fixed-Route Customer Satisfaction Survey Report
 Fixed-Route Customer Satisfaction Survey Report 2013 This is the second annual report to distribute passenger demographics data to the public as well as transit services ratings assessed directly by C-Tran
Tourism Industry Council Tasmania Community Survey 2018 Research Report. May 2018
 Tourism Industry Council Tasmania Community Survey 2018 Research Report May 2018 This report has been prepared by Enterprise Marketing and Research Services 60 Main Road, Moonah TAS 7009 All enquiries
METROBUS SERVICE GUIDELINES
 METROBUS SERVICE GUIDELINES In the late 1990's when stabilization of bus service was accomplished between WMATA and the local jurisdictional bus systems, the need for service planning processes and procedures
Limited English Proficiency Plan
 Limited English Proficiency Plan City of Boulder City Boulder City Municipal Airport Title IV Program, 49 CFR 21 About The Airport Boulder City Municipal Airport (BVU) is the third busiest airport in the
Demographic Profile 2013 census
 Demographic Profile 2013 census This profile provides basic population and demographic information on the residents of the Hauraki District. Population and demographic information is important for targeting
Baggage Fees User Guide and Codebook. Angus Reid Institute
 Baggage Fees 2014 User Guide and Codebook Angus Reid Institute User Guide compiled by: Data Services, Academic Services Queen s University Library 2016 Table of Contents Introduction... 2 Metadata... 2
Analysis of Transit Fare Evasion in the Rose Quarter
 Analysis of Transit Fare Evasion in the Rose Quarter Shimon A. Israel James G. Strathman February 2002 Center for Urban Studies College of Urban and Public Affairs Portland State University Portland, OR
HOW TO IMPROVE HIGH-FREQUENCY BUS SERVICE RELIABILITY THROUGH SCHEDULING
 HOW TO IMPROVE HIGH-FREQUENCY BUS SERVICE RELIABILITY THROUGH SCHEDULING Ms. Grace Fattouche Abstract This paper outlines a scheduling process for improving high-frequency bus service reliability based
RECOMMENDED CITATION: Pew Research Center, July, 2015, Growing Public Support for U.S. Ties with Cuba - And an End to the Trade Embargo
 NUMBERS, FACTS AND TRENDS SHAPING THE WORLD FOR RELEASE JULY 21, 2015 FOR FURTHER INFORMATION ON THIS REPORT: Carroll Doherty, Director of Political Research Rachel Weisel, Communications Associate 202.419.4372
Luz Mairym López Rodríguez, PhD (787) x-87437
 x-87437") luz.lopez6@upr.edu (787) 764-0000 x-87437 EDUCATION PhD. Walden University. Minnesota. February 2010 Public Policy and Administration: Management and Leadership in Non Profit Organizations Dissertation:
luz.lopez6@upr.edu (787) 764-0000 x-87437 EDUCATION PhD. Walden University. Minnesota. February 2010 Public Policy and Administration: Management and Leadership in Non Profit Organizations Dissertation:
new social approach for prioritising transport corridors in the metropolitan area of Barcelona (Spain)
") The use of the city in space and time as a new social approach for prioritising transport corridors in the metropolitan area of Barcelona (Spain) Jorge Cerda Carlos Marmolejo Politechnic University of
The use of the city in space and time as a new social approach for prioritising transport corridors in the metropolitan area of Barcelona (Spain) Jorge Cerda Carlos Marmolejo Politechnic University of
By Prapimporn Rathakette, Research Assistant
 OCTOBER 2000 RESERVATIONS NORTHWEST SURVEY: METHODOLOGY AND RESULTS OREGON PARKS AND RECREATION DEPARTMENT OREGON SURVEY RESEARCH LABORATORY 5245 UNIVERSITY OF OREGON EUGENE, OR 97403-5245 TELEPHONE: 541-346-0824
CHAPTER 1 TRANSIT MARKET AREAS AND EXISTING SERVICE
 CHAPTER 1 TRANSIT MARKET AREAS AND EXISTING SERVICE Transit Market Areas While several factors influence the propensity to use transit, the primary predictors of transit productivity are the density of
2015 Independence Day Travel Overview U.S. Intercity Bus Industry
 2015 Independence Day Travel Overview U.S. Intercity Bus Industry Chaddick Institute for Metropolitan Development, DePaul University June 25, 2015 This Intercity Bus Briefing summarizes the Chaddick Institute
Thai Airline Passengers' Opinion and Awareness on Airline Safety Instruction Card
 1 Thai Airline Passengers' Opinion and Awareness on Airline Safety Instruction Card Chantarat Manvichien International College, Suan Sunandha Rajabhat University, Thailand Chantarat.ma@ssru.ac.th Abstract
Word Count: 3,565 Number of Tables: 4 Number of Figures: 6 Number of Photographs: 0. Word Limit: 7,500 Tables/Figures Word Count = 2,250
 Katherine F. Turnbull, Ken Buckeye, Nick Thompson 1 Corresponding Author Katherine F. Turnbull Executive Associate Director Texas Transportation Institute Texas A&M University System 3135 TAMU College
TRANSPORT AFFORDABILITY INDEX
 TRANSPORT AFFORDABILITY INDEX Report - March 2018 AAA 1 AAA 2 Table of contents Foreword 4 Section One Overview 6 Section Two Summary of Results 8 Section Three Detailed Results 14 Section Four State by
ARRIVAL CHARACTERISTICS OF PASSENGERS INTENDING TO USE PUBLIC TRANSPORT
 ARRIVAL CHARACTERISTICS OF PASSENGERS INTENDING TO USE PUBLIC TRANSPORT Tiffany Lester, Darren Walton Opus International Consultants, Central Laboratories, Lower Hutt, New Zealand ABSTRACT A public transport
ADC40 Summer Meeting July 25-27, 2016
 ADC40 Summer Meeting July 25-27, 2016 Introduction to Abu Dhabi International Airport Research Purpose Research Methodology Results Summary of Findings Study Area: Abu Dhabi city is the capital of the
Outdoor Adventures Department of Recreational Sports Spring 2017
 Outdoor Adventures Department of Recreational Sports Spring 2017 Background The Department of Recreational Sports maintains a more than 400,000 square foot facility visited by thousands of students, faculty,
FIXED-SITE AMUSEMENT RIDE INJURY SURVEY FOR NORTH AMERICA, 2016 UPDATE
 FIXED-SITE AMUSEMENT RIDE INJURY SURVEY FOR NORTH AMERICA, 2016 UPDATE Prepared for International Association of Amusement Parks and Attractions Alexandria, VA by National Safety Council Research and Statistical
CURRICULUM VITAE. Semifinalist candidate for General Comptroller of the United States of America.
 CURRICULUM VITAE Ileana M. Colón Carlo, Esq., CPA, CFE, CVA Hato Rey, Puerto Rico WORK EXPERIENCE February 2001 to present - Member [Blue Ribbon] Commission of Citizens to Evaluate Government Transactions
Community Rail Partnership Action Plan The Bishop Line Survey of Rail Users and Non-Users August 2011 Report of Findings
 Community Rail Partnership Action Plan The Bishop Line Survey of Rail Users and Non-Users August 2011 Report of Findings Analysis and report NWA Social Research 1 Contents Page No. A. Summary of Main Findings...
Simple practices to improve and optimize on site wastewater disposal systems (OSDS) in Special Communities of Río Grande de Añasco Watershed
 in Special Communities of Río Grande de Añasco Watershed") Simple practices to improve and optimize on site wastewater disposal systems (OSDS) in Special Communities of Río Grande de Añasco Watershed UNIVERSITY OF PUERTO RICO Mayagüez Campus Ana Navarro, Sea Grant
Simple practices to improve and optimize on site wastewater disposal systems (OSDS) in Special Communities of Río Grande de Añasco Watershed UNIVERSITY OF PUERTO RICO Mayagüez Campus Ana Navarro, Sea Grant
CENTRAL OREGON REGIONAL TRANSIT MASTER PLAN
 Central Oregon Regional Transit Master Plan Volume II: Surveys and Market Research CENTRAL OREGON REGIONAL TRANSIT MASTER PLAN Volume IV: Service Plan Appendices A-B July 213 Nelson\Nygaard Consulting
Proof of Concept Study for a National Database of Air Passenger Survey Data
 NATIONAL CENTER OF EXCELLENCE FOR AVIATION OPERATIONS RESEARCH University of California at Berkeley Development of a National Database of Air Passenger Survey Data Research Report Proof of Concept Study
1999 Reservations Northwest Users Survey Methodology and Results November 1999
 1999 Reservations Northwest Users Survey Methodology and Results November 1999 Oregon Survey Research Laboratory University of Oregon Eugene OR 97403-5245 541-346-0822 Fax: 541-346-5026 Internet: OSRL@OREGON.UOREGON.EDU
Appendix B Ultimate Airport Capacity and Delay Simulation Modeling Analysis
 Appendix B ULTIMATE AIRPORT CAPACITY & DELAY SIMULATION MODELING ANALYSIS B TABLE OF CONTENTS EXHIBITS TABLES B.1 Introduction... 1 B.2 Simulation Modeling Assumption and Methodology... 4 B.2.1 Runway
2009 North Carolina Visitor Profile
 2009 Visitor Profile A publication of the Division of Tourism, Film & Sports Development August 2010 Division of Tourism, Film and Sports Development 2009 Visitor Profile 2009 Visitor Profile The Division
East Dunbartonshire Area Profile
 East Dunbartonshire Area Profile May 2014 Contents Executive Summary.. page 3 Introduction.. page 6 Population page 7 Age Structure. page 9 Population Projections page 11 Life Expectancy page 12 Ethnicity.