2017 Minnesota State Parks Visitor Survey
|
|
|
- Michael Conley
- 5 years ago
- Views:
Transcription
1 2017 Minnesota State Parks Visitor Survey November 2017 Report Prepared by: St Paul, MN theresearchedge.com 1
2 ACKNOWLEDGMENTS A number of Minnesota Department of Natural Resources staff contributed to the development and completion of this research. From the Division of Parks and Trails: Erika Rivers, Phil Leversedge, Pat Arndt, Laura Preus, Rachel Hopper, Arielle Courtney, Jade Templin, Darin Newman, Brad Chatfield, and all staff involved in coordinating survey distribution. 2
3 Table of Contents EXECUTIVE SUMMARY... 4 Characteristics of Minnesota Residents visiting MN State Park... 4 Characteristics of the State Park Trip... 5 Satisfaction with the State Park Trip and Perceived Value of Fees... 6 Support and Opposition to Potential Changes, Use of Contact Information... 7 BACKGROUND... 9 METHODOLOGY CHARACTERISTICS OF MINNESOTANS VISITING STATE PARKS Age and Party Composition Race and ethnicity Origin region Educational attainment Household income Prior use of state parks Outdoor recreation involvement of state park visitors CHARACTERISTICS OF THE STATE PARK TRIP Information sources In-park activities Origin region of all visitors Travel distance from home Type of state park visitor Accommodations for visitors on overnight trips State park camper equipment State park campers and electrical sites Advance planning for park trip Attraction to park of attending a park program SATISFACTION WITH THE STATE PARK TRIP Overall trip satisfaction Satisfaction with specific items important to an enjoyable park visit Reasons for dissatisfaction with specific items Visitor recommended changes to better serve their needs PERCEIVED VALUE FOR STATE PARK FEES PAID CHANGES VISITORS SUPPORT/OPPOSE IN STATE PARK FACILITIES, SERVICES, AND PROGRAMS Acceptable Contact Information References
4 EXECUTIVE SUMMARY Characteristics of Minnesota Residents visiting MN State Park This section of the report focuses on Minnesota residents that visited Minnesota state parks and contrasts these visitors with the population of Minnesota as a whole. The age and party composition of Minnesotans visiting the state parks is shifting slightly younger in 2017 compared to 2012 (p.10-12). Adults between 19 and 40 years of age are a significantly lower percentage of the party composition in 2017 than in 2012 (23% vs. 27%). Children 12 years old or younger are a significantly higher percentage of the party composition in 2017 than in 2012 (24% vs. 19%). The age distribution of survey respondents mirrors the Minnesota population. In terms of party composition, the portion of Minnesota parties with children/teens is higher in 2017 than in 2012, and similar to 2007 (2007, 44%: 2012, 39%; 2017, 44%), reinforcing the idea that the shift towards older visitors seen in prior studies has slowed. Minnesota residents visiting state parks continue to be concentrated in the non-hispanic white population, with some gains in the representation of non-white and/or Hispanic Minnesota residents (p.12-14). In % of park visitors are non-white and/or Hispanic, compared to 3.1% in In comparison, the non-white and/or Hispanic population in Minnesota has grown by 20% between 2010 and The non-hispanic white population has shown little growth over the last 10 years and is expected to decline over the coming decades, according to the U.S. Census Bureau. These trends along with the current park visitation patterns will continue to exert pressure on efforts to maintain and expand visitation at state parks. Minnesota residents visiting state parks come from throughout the state. The distribution of Minnesota residents visiting state parks mirrors the distribution of the Minnesota population, based on the Explore Minnesota tourism regions. Out-of-state visitors are slowly growing as a percent of all visitors, comprising 19% of 2017 visitors compared to 16% in 2001 (p , 23). The educational attainment and household income of Minnesota residents visiting the state parks in this study is consistent with prior studies. These park visitors from Minnesota have more formal education and higher median household income than the general Minnesota population (p ). 4
5 Prior use of Minnesota state parks is changing, reflective of an increase in first time visitors. These changes are happening at varying rates, thus significant differences occur across different timeframes in the comparisons below (p ). While over half of state park visitors from Minnesota continue to be repeat visitors to the same park, the percentage is significantly lower than in 2012 (2017, 59%; 2012, 72%). The history of visitation among Minnesotans is shifting slightly. The percentage of visitors that have visited state parks for one year or less is significantly higher in 2017 than in 2007 (2017, 8%; 2007, 5%). The percentage of visitors that have visited state parks for one year, five years or 10 years or less has increased, and visitors with 20 years and 30 years or less experience has decreased compared to These shifts reflect both park visitors visiting different parks, rather than returning to the same park, as well as visitors who are visiting any state park for the first time. Characteristics of the State Park Trip Social and digital media are growing significantly as important sources of park information, along with places I stay and recreational opportunity maps and directories. Print-based sources such as Minnesota Explorer and the state highway map are declining as important sources of park information (p ). Information sources don t vary significantly between campers and day visitors. Older adults rely on printed information sources as well as more traditional media such as TV. Other information sources also vary across age groups. Digital and print media can be designed and targeted based on age. State park visitors are traveling further and the percent of day visitors on trips has increased compared to prior studies (p , 28-29). The planning interval for park visits is trending longer, compared to While one-third of park visitors decide to visit the day they arrive at a park, this is primarily day visitors. Planning intervals are trending longer, with 42% of campers planning 1-5 months in advance compared to 33% in Younger park visitors and visitors with income under $50,000 are significantly more likely than older visitors and higher income visitors to spontaneously visit state parks. 5
6 Park visitor participation in activities in 2017 is very similar to 2012 and Hiking remains the most common activity and the only activity mentioned by a majority of visitors (72%) (p , 29-30). Campers are significantly more likely than day visitors to engage in 10 out of the 19 activities listed in the survey. Campers are also significantly more likely to bring a dog or other pet to the park (29% vs. 16%). Attending a staff-led program attracts seven percent of visitors to state parks. Only 20% of the nights spent by visitors on overnight trips away from home are spent in the park they were visiting. Among the nights spent in the park, the majority continue to be spent in the campground rather than cabins or yurts (p ). While the number of park visitors continues to increase, day visitors are growing faster, so they make up a greater percentage of the visitors compared to The percent of all nights visitors are spending away from home that are spent in state parks has declined by 10 percentage points since 2012 (2017, 20%, 2012, 30%). Stronger demand for accommodations through visitors longer travel distances and more day visitors on trips is being met outside the state parks. (This assumes that day visitors at one park aren t using another state park for accommodations.) This stronger demand presents an opportunity to the state parks to capture a greater percentage of the nights visitors are spending on their trips, if there is additional capacity in state parks or more capacity can be built to host more overnight visitors. While the percentage of campers wanting an electrical site has remained steady since 2012, the portion of campers who wanted and got an electric site in 2017 has fallen significantly from 90% in 2012 to 83% in 2017 (p ). Further analysis is needed to understand the impact of this electric site shortfall on camper reservations. Satisfaction with the State Park Trip and Perceived Value of Fees The overall trip satisfaction top box rating (completely satisfied) is 54%, the top two box rating (completely satisfied and very satisfied) is 89% (p ). Day visitors are significantly more likely than campers to report being completely satisfied, while campers are more likely to report being somewhat satisfied. A majority of longer-term visitors continue to report their experience has gotten better over time. However, the perception of park-experience quality across all 6
7 long-term visitors is trending back towards the lower levels seen in 2007, after improvement in Addressing reasons for lower camper satisfaction rates will improve overall trip satisfaction. Satisfaction with the top 10 factors visitors consider most important (excluding park natural landscapes) to an enjoyable visit is 65% or lower. Trails, trail signage and campground issues are among the top 10 factors with the lowest satisfaction ratings. Further analysis is detailed in the report (p ). Annual vehicle entrance permits are significantly more likely to be rated a good value and daily vehicle entrance permits are significantly more likely to be rated a fair value (p ). The July 1 st cost increase in daily vehicle permit had no significant impact on the perceived value of the daily permit. Given the lower rating of daily permits compared to annual permits, further price increases may be best applied to the annual permit. Support and Opposition to Potential Changes, Use of Contact Information Visitors are most supportive of more hiking opportunities, wider campsites, and more learning opportunities. The changes most opposed by visitors include four of the six revenue-generating changes along with three items visitors have opposed in prior studies. More details are in the report (p ). Focus on improved building and ground maintenance, trails and signage is further supported by these responses and the dominance of hiking as a park activity. Given the support for learning opportunities, focus on the scheduling, types and quality of programming is warranted. One-third of visitors consider any use of DNR-collected contact information as unacceptable. Half of campers support use for updates on transactions or trips. Nearly half of park visitors (45%) support the use of contact information for DNR-related research or issues. Variations in support by age and income are detailed in the report (p ). Roll out the use of contact information first among campers for transactions and trip updates, progressing to DNR-related uses. Day visitors are less engaged, so opportunities to obtain their opt-in for DNR-related contacts could strengthen their involvement, build rapport and potentially stimulate more visits. 7
8 Use by other organizations should only follow greater acceptance of DNRrelated uses. 8
9 BACKGROUND The 2012 state park visitor study is the latest in a series that date back to This tracking study is rooted in an understanding of park visitors: who they are and what they desire from the parks. Studies such as this reflect the Minnesota State Parks and Trails Division belief that a successful park system depends on staying close to the visitor, understanding both their perception of the park experience and how that experience may be enhanced. They help to realize the vision of the Minnesota State Parks and Trails Division: Our vision is to create unforgettable park, trail, and water recreation experiences that inspire people to pass along the love of the outdoors to current and future generations. The 2017 study does not include an update to park visitor trip spending. This economic activity was last done in 2012 and is anticipated to be repeated in the next survey in this series scheduled for This document contains the results of the 2017 research. Topics include visitor demographic characteristics, trip characteristics, in-park experience, and preferences for potential park management changes. When possible, 2017 information is presented in the context of previous studies, so trends become evident. Please note that Tables 1-10 are based on Minnesota visitors only and tables are based on all visitors. The number of responses for each question are noted on the tables as 2017 n=#. This number varies depending upon the number of respondents who answered a question (sometimes respondents choose to skip questions), the sub-group of respondents being reported or the exclusion of don t know responses. Overall, the 2017 results confirm many of the patterns and trends found in the 2012 study, the most recent previous study (Reference 1). Statistically significant differences are noted throughout the report. 9
10 METHODOLOGY The 2017 park visitor study focused on visitor activities, trip characteristics, satisfaction with their experience, perceived value of park fees and opinions on potential changes to park facilities, services and programs. The study was conducted during the high use season (Memorial Day to Labor Day). Nearly all of the state parks across the parks system participated in the study. Parks were randomly assigned to a sampling schedule that included random assignment to a specific week within the collection period and then randomly assigned to a weekday (Tuesday) or weekend (Saturday) distribution. Print surveys were distributed by park staff to one person in a party. Park visitors were stopped as they exited the park and given the survey to complete and send back via US mail. Before leaving park visitors provided their name and address on reminder postcards, which were collected by park staff. These reminder postcards and a second survey were mailed to non-respondents. Overall, 1735 surveys were distributed to park staff and only 71 were not distributed by park staff due to various logistical and staffing issues. For the first time, the survey was also available online, providing park visitors a choice to complete the survey via the web or mailing the paper version. Of the 934 surveys completed, 12% were completed online, a worthwhile result for the first online version. The total return rate was 59%, which is much higher than is typically seen in self-administered mail surveys and sufficiently high to allay concerns about potential response bias. Figure 1 Survey responses are weighted by 2016 park visitation to make it representative of the park visitor population. Weighting is done using a combination of type of visitor (day 10
11 visitor, camper), day of the week (weekdays, weekend/holidays), and Explore Minnesota region of the park (see Figure 1). A slight difference in weighting for Region 1 was used to ensure the weighting was within weighting norms, without significantly impacting the results. Aside from the addition of the online version, the 2017 distribution followed the same basic research methodology of prior park visitor studies. 11
12 CHARACTERISTICS OF MINNESOTANS VISITING STATE PARKS Age and Party Composition State Park visitation from Minnesotans currently draws substantially from all age classes in the Minnesota population (Table 1). This year the age composition table is based on visitor-reported numbers of people in their party. In 2017 there is a statistically significant increase in children and significant decrease in the percentage of younger adults, years of age, compared to Table 1 Party Composition and Age Distribution of Minnesotans visiting MN State Parks Average Party Size Age Class Adults (41 and older) 69% ** 71% ** 47% 46% Adults (19 to 40) % * 23% * Teens (13 to 18) 7% 10% 8% 8% Children (12 or under) 24% 20% 19% * 24% * Median age Adult Visitors MN Population n=735 * Significant difference **Note: 2001 & 2007 versions only included one adult class The survey respondent population is seen in Table 2. The 2017 survey, like past surveys, didn t gather age information for each visitor, but did ask the survey respondents to provide their age. Table 2 uses that information to create age classes for respondents only, rather than using that information to extrapolate the ages of all visitors. Consideration should be given to adding a question that gathers information on all ages in a visiting party to future visitor surveys. The value of such information, such as 12
13 providing a comparison to the Minnesota population, needs to be weighed against the additional respondent burden of such a question in an already lengthy survey. Table 2 Age distribution of Minnesota respondents visiting MN State Parks (MN respondents only) All visitors Day visitors Campers MN population, 2016** Age class (percent) (percent) (percent) (percent) years old 11% 12% 10% 20% years old 29% 28% 35% 25% years old 42% 42% 44% 35% % 19% 11% 20% Total 100% 100% 100% 100% Median age Adult Visitors 51 MN Population n=746 ** Source: U.S. Census Bureau, Population Estimate, Party composition is another measure that can shed light on trends in the age structure of park visitation. In 2017, the portion of parties from Minnesota with children/teens is about the same or more than in previous years of 2001, 2007 and 2012 (Table 3). The 2017 percentage of adult only parties and parties with teens/children is more similar to 2007 than Since children/teen parties are a higher portion in 2017 than in 2012, it reinforces the idea that the pace of the age shift has slowed in the youngest age classes. 13
14 Table 3 Party composition of Minnesotans visiting MN State Parks Park visitors, 2001 Park visitors, 2007 Park visitors, 2012 Park visitors, 2017 Party composition (percent) (percent) (percent) (percent) Adult only parties: 1 adult, 0 teens/children 14% 11% 15% 12% 2 adult, 0 teens/children 33% 35% 38% 30% 3+ adult, 0 teens/children 11% 11% 9% 14% Subtotal percent 58% 56% 61% 56% Parties with teens/children: 1 adult, 1+ teens/children 6% 9% 5% 5% 2+ adult, 1+ teens/children 34% 34% 31% 33% 0 adult, 1+ teens/children 3% 1% 2% 6% Subtotal percent 42% 44% 39% 44% Total percent 100% 100% 100% 100% 2017 n=757 Race and ethnicity State Park visitation is concentrated in the non-hispanic white population, a pattern of participation that has been largely stable since 2001 (Table 4). While nearly 20% of the Minnesota population is currently non-white and/or Hispanic, only 5% of park visitors from Minnesota come from these populations. On a per-capita basis, the non-white and/or Hispanic populations (as a group) are under-represented in park visitation, with 26% of this Minnesota population visiting state parks. This is an improvement compared to 2012, when only 18% of the non-white and/or Hispanic population visited state parks. 14
15 While the growth of non-white and Hispanic park visitors rose from 3.1% in 2012 to 5.1% in 2017 (Table 4), the non-white and Hispanic MN population between 2010 and 2017 has risen by 20% (Table 5). The non-hispanic white population from which state parks draws most visitors has shown little growth over the last 10 years in Minnesota and nationwide (Table 5) and is expected to decline from 198 million in 2014 to 182 million in 2060 nationwide, according to recent population projections from the U.S. Census Bureau (Reference 5). These population trends, in conjunction with the visitation patterns by race and ethnicity, will continue to exert pressure on efforts to maintain and expand visitation at state parks. Table 4 Race and ethnicity distribution of Minnesota respondents visiting MN State Parks (MN respondents only) Park visitors, 2001* Park visitors, 2007 Park visitors, 2012 Park visitors, 2017 MN population, 2016** (percent) (percent) (percent) (percent) (percent) Race & Ethnicity White, Non-Hispanic/Latino 96.5% 97.2% 96.9% 94.9% 80.5% Non-white and/or Hispanic/Latino 3.5% 2.8% 3.1% 5.1% 19.5% Total 100% 100% 100% 100% 100.0% Race White 96.9% 97.7% 97.3% 95.3% 83.3% Non-white 3.1% 2.3% 2.7% 4.7% 16.7% Total 100% 100% 100% 100.0% 100.0% Ethnicity Non-Hispanic/Latino 99.5% 99.5% 99.6% 99.6% 94.8% Hispanic/Latino 0.5% 0.5% 0.4% 0.4% 5.2% Total 100% 100% 100% 100.0% 100% 2017 n=748 *Note: 2001 race calculations done without the "other" race class, which was not used in 2007 and 2012 **Source: American Community Survey, year estimate, tables B03002, B
16 Table 5 Changing racial and ethnicity composition of population in Minnesota and U.S., 2010 to 2016 (Source: U.S. Bureau of the Census) Population Population Numerical Percent Race & ethnicity change change Minnesota White, non-hispanic 4,411,174 4,444,184 33,010 1% Non-white and/or Hispanic 899,410 1,075, ,358 20% Total 5,310,584 5,519, ,368 4% U.S. White, non-hispanic 196,929, ,479, ,038 0% Non-white and/or Hispanic 112,420, ,648,065 13,227,788 12% Total 309,349, ,127,515 13,777,826 4% Source: 2010, 2016 American Community Survey, table B03002 Origin region State Park visitors from Minnesota come from throughout the state (Table 6). The 2017 Minnesotan s origin region is very similar to the Minnesota population, with over half coming from the metro area. In 2017 the regions were changed from what was used in prior studies to more closely match the Explore Minnesota Tourism regions. Based on the stability of the past origin statistics, it is anticipated that the origin region distribution seen among park visitors will remain stable going forward. 16
17 Educational attainment State Park visitors from Minnesota have far more formal education than the general Minnesota population, a consistent finding since 2001 (Table 7). Post-graduate degrees account for a quarter of the 2017 visitor population, compared to only 12% of the Minnesota population. 17
18 Table 7 Educational attainment of Minnesotans (age 25+) visiting MN State Parks Park visitors, 2001 Park visitors, 2007 Park visitors, 2012 Park visitors, 2017 MN population, 2016* Educational attainment group (percent) (percent) (percent) (percent) (percent) High school graduate or higher 99% 99% 98% 99% 93% Bachelor's degree or higher 57% 59% 60% 58% 35% Post-graduate degrees 20% 22% 24% 26% 12% 2017 n=731 *Source: U.S. Census Bureau, 2016 American Community Survey 1-Year Estimates Household income State Park visitors from Minnesota have a higher median household income than the general Minnesota population (Table 8). Visitors tend to be more middle income than the general population; while the lowest income groups are under-represented in park visitation. This is consistent with prior studies. Table 8 Household income of Minnesotans visiting MN State Parks Park visitors, 2017 MN households, 2016* Income Class (percent) (percent) Less than $20,000 5% 13% $20,000 to $29,999 6% 8% $30,000 to $39,999 6% 9% $40,000 to $49,999 7% 8% $50,000 to $59,999 7% 8% $60,000 to $74,999 13% 10% $75,000 to $99,999 25% 14% $100,000 to $149,999 19% 17% $150,000 or more 14% 13% Total 100% 100% Median Between $75,000 and $99,999 Between $60,000 and $74, n=712 *Source: U.S. Census Bureau, 2016 American Community Survey 1-Year Estimates, Table B
19 Prior use of state parks Over half of State Park visitors from Minnesota continue to be repeat visitors to the specific park at which they were surveyed (Table 9, top box). The 2017 portion of repeat visitors to the same park is 59%. This is lower than has been reported at any time since 2001 and statistically significantly lower than in 2012 (72%). Visitors have been coming to Minnesota state parks on average for 25 years, and the history of visitation is shifting slightly (Table 9, bottom box). The proportion of visitors who have been coming to parks one year or less, five years or less and 10 years or less has increased compared to 2007, and visitors who have been coming for 20 years or less and 30 years or less have decreased compared to 2007 visitors. The percent of visitors that have visited state parks for one year or less is significantly higher in 2017 than 2007 (8% vs. 5%). This is reflective of an increase in first time visitors. 19
20 Table 9 Prior Use of Minnesota State Parks by Minnesotans Have you ever visited this state park before? (responses of park visitors from Minnesota) Park visitors, 2001 Park visitors, 2007 Park visitors, 2012 Park visitors, 2017 Response (percent) (percent) (percent) (percent) Yes 74% 67% 72% * 59% * No 26% 32% 27% 39% Don't know 1% 1% 0% 2% Total 100% 100% 100% 100% * Significant difference 2017 n=753 For how many years have you been visiting Minnesota State Parks? (responses of park visitors from Minnesota) Response measure Park visitors, 2001 Park visitors, 2007 Park visitors, 2012 Park visitors, 2017 Median years N/A Mean years N/A Cumulative percent in year range Park visitors, 2001 Park visitors, 2007 Park visitors, 2012 Park visitors, 2017 One year or less N/A 5% * 5% 8% * Five years or less N/A 14% 18% 17% Ten years or less N/A 27% 28% 29% Twenty years or less N/A 49% 42% 47% Thirty years or less N/A 67% 62% 66% * Significant difference 2017 n=733 Outdoor recreation involvement of state park visitors As seen in previous studies, State Park visitors from Minnesota come from households that are significantly more involved than the general Minnesota population in a variety of outdoor recreation pursuits in Minnesota. State Park visitors are more likely than Minnesota households in general, to have fishing and hunting licenses as well as registrations of boats, ATVs, and snowmobiles (Table 10). 20
21 Table 10 Do you or a member of your household have this license or registration? (responses of park visitors from Minnesota) Percent of households with license or registration Type of license or registration Park visitor households* All Minnesota households* 2017 n= 752 Current MN fishing license 53% 38% 746 Current MN hunting license 31% 26% 750 A boat currently registered in MN 39% 27% 741 An ATV currently registered in MN 18% 10% 742 A snowmobile currently registered in MN 12% 5% *Sources: MN State Park Visitor Survey, 2017; and MN DNR, Licensing and Registration records for 2016 CHARACTERISTICS OF THE STATE PARK TRIP Information sources Compared with 2012, general websites and social media have grown significantly as important sources of park information, along with places people stay and recreational maps and directories. Other sources have declined or stayed about the same (Table 11). In 2017, the MN DNR website is the leading information source for visitors, eclipsing both word of mouth ( family and friends ) and general websites. Other leading information sources are the MN State Parks and Trails Guide, information at one or more MN State Parks, and the MN state highway map. Both the MN state highway map and the Minnesota Explorer newspapers have continued their decline in importance from their 2007 levels of 40% and 26%, respectively and are significantly lower than in Both DNR website use and use of general websites is much higher in 2017 than in When viewing this data, it is worth taking into consideration that the survey s list of sources doesn t identify a source as print or online (some exist in both print and the digital space), leaving it subject to differing respondent interpretations. In future surveys, a review of the list s length, potential removal of little-used sources and specifying a source as print or digital would be worthwhile 21
22 Table 11 When you obtain information about Minnesota State Parks, what are your most important information sources? (table values are the percent of visitors indicating a source as important) data data Compare 2017 to All visitors Day visitors Campers All visitors All visitors Category Information source (percent) (percent) (percent) (percent) ( ) Minnesota DNR Sources MN DNR website 65% 64% 76% 64% 1% Minnesota State Parks and Trails Guide 51% 51% 48% 49% 2% Information at one or more Minnesota State Parks 35% 36% 28% 33% 2% Minnesota State Park & Trail Program and Special 11% 11% 8% 9% 2% Events Catalog Minnesota State Parks and Trails Facebook 11% 11% 9% MN DNR telephone information center 4% 4% 4% 5% -1% MN DNR electronic information kiosk 3% 3% 1% 2% 1% PRIM recreation maps 2% 2% 3% 3% -1% Explore Minnesota Tourism sources Explore Minnesota Tourism website 28% 28% 25% 27% 1% Minnesota Explorer newspaper 10% 10% 7% 16% -6% * Highway information centers 9% 10% 6% 11% -2% Explore Minnesota Tourism phone information 4% 4% 3% 2% 2% center General Sources Websites 59% 59% 59% 40% 19% * Family and friends 58% 58% 57% 54% 4% Recreational opportunity maps and directories 25% 26% 19% 15% 10% * Minnesota's State Highway Map 23% 24% 20% 31% -8% * Social Media** 19% 20% 16% 4% 15% * Places I stay (e.g., resorts, campgrounds) 18% 18% 19% 10% 8% * Travel guides/agents 11% 11% 7% 8% 3% Newspapers or magazines 11% 12% 3% 10% 1% Chambers of commerce/convention and 9% 10% 5% 12% -3% visitors bureaus Other road maps 8% 8% 7% 11% -3% Community Events (e.g., Boating/camping/sports 7% 7% 6% 5% 2% shows, fairs) Outdoor equipment stores 5% 5% 5% 6% -1% Radio 4% 4% 3% 3% 1% TV 4% 4% 2% 6% -2% 2017 n=901 * Significant difference from 2012 **2012 Twitter, Facebook categories combined into social media. Campers and day visitors share the same basic ranking of information-source importance. Older adults rely on printed information sources such as the state road map and Minnesota Explorer newspaper, as well as TV, Explore Minnesota phone center, Chamber of Commerce/visitor bureaus more than younger visitors. Social media is considered an important source by 19-27% of visitors under age 65 and only 11% among visitors 65 years of age and older. Family and friends is indicated more frequently as an important information source by adults under 45 years of age than adults 65 years and older. The importance of outdoor equipment stores, radio, newspapers, travel guides, 22
23 community events and other information sources also vary across some age groups. More details can be seen in the cross tabulation tables. In-park activities Park activity participation in 2017 is largely the same as in 2012 and Hiking/walking is by far the leading activity (Table 12). Campers are significantly more likely to engage in hiking/walking, water activities, biking, visiting historic sites, bird watching and relaxing than day visitors. Participation in many activities varies by age. For example, visitors under 30 years of age are more likely to engage in jogging or running as well as self-guided nature walks than older visitors. Visitors 45 years of age or older are more likely to bird watch than those less than 45 years old. Swimming, picnicking, fishing, relaxing, canoeing and shopping activities also vary across some age groups. More details can be seen in the cross tabulation tables. One in six visitors brings their dog or other pet with them to the parks. Campers are significantly more likely than day visitors to be accompanied by a pet. 23
24 Table 12 Which of the following activities did you participate in while visiting this park on this trip? (table values are the percent of visitors indicating they participated in the activity) data All visitors Day visitors Campers Activity (percent) (percent) (percent) Hiking/walking 72% 70% 87% * Observing/photographing nature 42% 43% 39% Sightseeing 32% 32% 37% Taking a self-guided nature walk 26% 25% 31% Looking at kiosks or visitor center exhibits 25% 25% 31% Picnicking 25% 24% 30% Shopping in the park's nature store 24% 23% 30% Visiting historic sites 19% 18% 26% * Bird watching 17% 16% 23% * Swimming 16% 13% 35% * Did nothing/relaxed 16% 12% 35% * Camping 14% 0% 100% * Bicycling 12% 9% 29% * Fishing 12% 10% 21% * Canoeing/kayaking 7% 6% 18% * Taking a naturalist-led program 6% 6% 5% Motorboating 4% 4% 7% Jogging/running 3% 3% 4% Geocaching 2% 2% 5% * 2017 n=922 based on visitor designation as camper Did you bring your dog or other pet to the park on this visit? 2017 n= data Response All visitors Day visitors Campers (percent) (percent) (percent) Yes 17% 16% 29% * No 83% 84% 72% *next to % denotes statistically significant difference between camper/day user 24
25 Origin region of all visitors Most state park visitors are from Minnesota, with the metro region the origin of 45% of all 2017 visitors. Due to the realignment of the Minnesota origin regions mentioned previously, data from prior visitor studies is not displayed here. Non-Minnesotans are slowly growing as a percent of all visitors, with the 19% seen in 2017 being significantly higher statistically, than the 16% seen in (Note: This table includes all visitors, while the preceding origin table (Table 6) includes only Minnesota visitors.) 25
26 Travel distance from home State parks serve a large local market and a growing long-distance (tourist) market (Table 14). Nearly one-quarter of all visitors are within 25 miles of home, while 51% are over 100 miles from home. Campers are significantly more likely than day visitors to travel between 51 and 200 miles. The median travel distance of all visitors in 2017 is higher than in 2012 or Table 14 Travel distance from home for Minnesota State Park visitors visitors All visitors Day visitors Campers All visitors All visitors All visitors Miles from home (percent) (percent) (percent) (percent) (percent) (percent) 25 or less 23% 26% 3% 33% 27% 29% 26 to 50 9% 9% 9% 11% 12% 13% 51 to % 15% 23% 12% 15% 15% 101 to % 21% 38% 20% 21% 18% over % 29% 27% 23% 25% 25% Total percent 100% 100% 100% 100% 100% 100% Median miles n=914 26
27 Type of state park visitor Nearly nine of ten park visitors are day visitors, and most of the day visitors are coming to the park from home (Table 15). The 2017 portion of day visitors from home has fallen back to 2001 s level, reinforcing the rise in travel distance seen in Table 14. (Note: The portions of visitors who are campers and day visitors come from the visitation database; the portions of day visitors who are from home or on trips come from the visitor survey.) Table 15 Type of State Park Visitor Visitors, 2001 Visitors, 2007 Visitors, 2012 Visitors, 2017 Type of visitor (percent) (percent) (percent) (percent) Day visitor from home 49% 52% 55% 49% Day visitor on trip away from home 37% 35% 32% 37% Day visitor subtotal 86% 86% 87% 86% Camper 14% 14% 13% 14% Total percent 100% 100% 100% 100% 2017 n=934 Accommodations for visitors on overnight trips Most park visitors on overnight trips away from home spend their nights outside the park (80%), with resorts, other campgrounds and friends cabins as the primary accommodations (Table 16). For the 20% of nights spent in the park, the large majority are spent in the park campground, with only a small percentage staying in camper cabins or yurts. Park visitors are increasing and overnight use is increasing. However, the percent of all nights visitors are spending away from home that are spent in state parks has declined by 10 percentage points since the 2012 survey, when 30% of nights were in state parks. This indicates more demand for accommodations. 27
28 Table 16 Where are your nights spent on this overnight trip away from home? (for park visitors on overnight trips) Type of overnight accommodation Percent of all nights Campground in this state park 16% Indoor lodging in this state park 3% Subtotal: in this state park 20% Resort, motel or bed & breakfast inn 28% Other campground (public or private) 20% Friend's or relative's house or cabin 25% My cabin 5% Other accommodation 2% Subtotal: outside this state park 80% 2017 n=442 Total 100% State park camper equipment The equipment used by state park campers is mainly tents and vehicles, including popup trailers or motorhomes/5th wheel/hard-side trailers (Table 17). The 2017 portion of visitors who stayed in camper cabins maintains the increase seen in the 2012 survey. If camper cabins are excluded, the portion of campers using tents and vehicles is about 50/50, and has been relatively stable since The type of camping vehicle used in state parks continues to trend away from pop-up trailers, which are also being manufactured at a lower volume than in the past. 28
29 Table 17 What type of camping equipment did you use on this visit? Campers, 2001 Campers, 2007 Campers, 2012 Campers, 2017 Camping equipment (percent) (percent) (percent) (percent) Tent 49% 49% 44% 44% Pop-up trailer 18% 14% 13% 10% Motorhome, 5th wheel, or hard-sided trailer 29% 30% 34% 36% Stayed in camper cabin 2% 3% 7% 8% Other 2% 4% 3% 2% 2017 n=125 Total percent 100% 100% 100% 100% EXCLUDING CAMPER CABINS Campers, 2001 Campers, 2007 Campers, 2012 Campers, 2017 Camping equipment (percent) (percent) (percent) (percent) Tent 50% 50% 47% 48% Pop-up trailer 18% 14% 14% 11% Motorhome, 5th wheel, or hard-sided trailer 30% 31% 36% 39% Stayed in camper cabin (excluded) Other 2% 4% 3% 2% 2017 n=115 Total percent 100% 100% 100% 100% State park campers and electrical sites The percentage of campers wanting an electrical site has remained steady since A majority of state park campers (87%) either get an electric site if they want one, or do not get an electric site if they do not want one (Table 18). The portion of campers who didn t want and didn t get an electric site has remained the same. The portion of campers who wanted and got an electric site has fallen from 90% in 2012 to 83% in 2017, a significant difference in the fulfillment of electric site requests. 29
30 Table 18 State Park Campers and Electrical Sites Want an electrical site? Campers, 2017 (percent) Campers who wanted an electric campsite: 57% Got an electric site 47% Did not get an electric site 10% Percent that got what they wanted 83% (83% =47%/57%) Campers who did not want an electric site: 43% Got an electric site 3% Did not get an electric site 40% Percent that got what they wanted 93% (93%=40%/43%) 2017 n=125 Total 100% Advance planning for park trip One-third of all visitors is spontaneous and decides to visit the park on the day of the outing (Table 19). Campers not surprisingly plan further in advance than day visitors; 40% of campers plan at least 3 months in advance. The percentage of campers who use a 1 to 30 days planning interval has fallen from 41% in 2012 to 36% in 2017, while the percentage of campers using a 1 to 5 months planning interval has risen from 33% in 2012 to 42% in Though these changes are not statistically significant, they reflect a trend toward a longer planning interval among campers. This reflects both the reservation policy change to require all sites to be reserved and an increased demand for campsites, while the supply of sites has remained nearly the same. Park visitors younger than 30 are significantly more likely than visitors 30 to 64 years of age not to plan their visit and spontaneously go to a state park. While only 8% of all visitors plan days in advance, visitors between 30 and 44 years of age are the least likely to use this planning interval. In terms of income, park visitors with income under $50,000 are more likely than all other income categories to not plan and spontaneously go to a state park. While only 8% of all visitors plan days in advance, visitors with 30
31 income of $150,000 or more are likely than other income categories to plan days in advance. Table 19 How many days (or months) in advance did you plan this trip to this park? All visitors Day visitors Campers Campers Days/months in advance (percent) (percent) (percent) (percent) None: decided trip on 33% 38% 3% 5% day of park visit 1 to 7 days 27% 29% 14% 21% 8 to 14 days 7% 6% 12% 12% 15 to 30 days 8% 8% 10% 8% 1 to 2 months 11% 10% 21% 18% 3 to 5 months 8% 6% 21% 15% 6 to 12 months 4% 3% 16% 18% Over 12 months 1% 1% 3% 2% 2017 n=908 Total 100% 100% 100% 100% Attraction to park of attending a park program Attending a park program attracts less than one in ten visitors and this has remained steady compared to the 2012 survey. Adult only parties are significantly more likely than parties with teens or children to report attending a park program didn t attract them to the park. There are no significant differences based on camper/day visitor or age of respondent. 31
32 Table 20 Did attending a park program (e.g., a staff-led program) attract you to the park on this visit? Response (percent) Visitor group Yes No Don't know Total All visitors 7% 89% 4% 100% Type of visitor Day visitors 7% 89% 4% 100% Campers 3% 92% 5% 100% Party composition Adult only party 5% 92% * 3% 100% Teens/children in party 9% 86% * 5% 100% Age of respondent years 11% 85% 5% 100% years 5% 89% 6% 100% years 7% 91% 3% 100% 65 years or older 6% 90% 4% 100% 2017 n=909 * Significant difference SATISFACTION WITH THE STATE PARK TRIP Providing high-quality outdoor recreation experiences is a cornerstone of MN DNR efforts to retain and recruit recreation participants. High-quality experiences bring current participants back for more, and help recruit new participants when current participants share their satisfying experiences through word of mouth, a trusted form of communication. Overall trip satisfaction The chart below displays only 2017 overall satisfaction because the rating scale s language was changed this year to provide a better measure of satisfaction, thus a comparison to prior years would be inaccurate. In 2017 over half of park visitors report they are completely satisfied and nearly 90 percent of visitors (89%) report being completely satisfied or very satisfied (Figure 2). For the remaining 11%, trip satisfaction could be improved, since they report being somewhat satisfied or dissatisfied to varying degrees. Day visitors are significantly more likely than campers to report they are completely satisfied, while campers are more likely to be somewhat satisfied. 32
33 Figure 2 100% 2017 Satisfaction with Visit to a Minnesota State Park 80% Completely satisfied Very satisfied 60% 40% 54% 56% 35% 34% 44% 39% Somewhat satisfied Neither satisfied or dissatisfied Somewhat dissatisfied Very dissatisfied Completely dissatisfied 20% 15% 9% 8% 0% 1% 1% 0% 0% 1% 1% 0% 0% 1% 1% 0% 0% All visitors Day Visitors Campers 2017 n=912 A majority of longer-term visitors (62%) believe the park experience has gotten better over time (Table 21). Few think it has gotten worse. While not statistically significant, the perception of park-experience quality is trending to the lower levels seen in 2007, after some improvement in
34 Table 21 Over the years you have visited the parks, has the quality of your park experience declined or improved? (based on respondents who have been visiting Minnesota state parks for 10 or more years) Park visitors, 2007 Park visitors, 2012 Park visitors, 2017 Response (percent) (percent) (percent) Greatly improved 12% 19% 17% Improved 50% 48% 45% Stayed about the same 25% 24% 28% Declined 6% 3% 6% Greatly declined 0% 1% 0% Don't know 5% 5% 5% Total percent 100% 100% 100% 2017 n=637 Satisfaction with specific items important to an enjoyable park visit In the visitor survey, respondents are asked to rank the importance of 29 items that are potentially important to the respondent s enjoyment of the park. After the importance rating, the respondent is asked to rate their satisfaction with the item in the park. The combination of importance and satisfaction ratings is an effective approach to understanding the visitor s perspective on what is working well in the park, and what could be improved to make their park visit more enjoyable. While the online survey could have asked satisfaction ratings for only those items rated as very important, it was decided that the online survey should mirror the print survey so online respondents were asked to rate their satisfaction with all items, regardless of their importance rating of an item. Of highest importance for all visitors (at least 70% rate as very important) are: Natural landscape items (park beauty, natural setting, lakes/rivers in park) Staffing and maintenance items (cleanliness of grounds/facilities, well protected natural resources) Trails and trail signage under recreation facilities and information/interpretation. 34
35 The importance of trails is no doubt connected to the prevalence of hiking and walking as the primary activity that visitors engage in when experiencing the park. For campers, the quality of campgrounds and associated facilities are the most important. Although there is a large amount of communality of item-importance rankings across age of visitor, there are some notable differences. Visitors over the age of 65 are more likely than younger visitors to consider availability of park staff to answer questions and helpfulness of staff as very important, while they are less likely than year old visitors to consider trails in the park as very important. Visitors 45 years or older are more likely than younger visitors to consider general informational brochures/maps provided, visitor center exhibits, videos and displays, attentiveness of park staff, and someone to greet me when I arrive as very important. The importance of quality of facilities in the picnic grounds, and lack of disturbances by other visitors rises as visitor age rises. Visitors over 45 years of age are more likely than those years old to consider designated places to swim as not important (18-20% vs. 8%). Visitors 30 years old and older are more likely than visitors under 30 to consider wellmaintained, clean grounds and facilities as very important (84-88% vs. 74%). Visitors who are years of age are the least interested in availability of souvenirs to purchase (8% vs %). Visitors under 30 years old are more likely than older visitors to see learning from a staff-led program as not important (51% vs %). For the camping items, the importance ratings don t vary by age. Comparing the portion of visitors considering an item very important in 2012 and 2007 to 2017, three items have risen in importance over the period: availability of convenience items to purchase, place for pets, and quality of picnic ground facilities. One item has steadily fallen in importance over the period: someone to greet me on arrival. 35
36 Table 22 How important is this item to making your park visit enjoyable? & How satisfied or dissatisfied are you with this item in this park? (Importance scale: 1=not important, 2=slightly important, 3=moderately important, 4=very important) Percent of "very Satisfaction ratings for "very important" responses (percent) important" responses Very Very Total Item group Specific item All visitors Campers Satisfied Satisfied Neutral Dissatisfied Dissatisfied Percent 2017 n= Natural landscape 840 Beauty of the park 82% % 19% 2% 1% 1% 100% 820 A natural setting for the park 82% % 17% 2% 1% 1% 100% 818 Lakes and rivers in the park 70% % 22% 2% 2% 2% 100% Staffing and maintenance 830 Well-maintained, clean grounds and facilities 83% % 27% 4% 3% 1% 100% 794 Well protected natural resources 79% % 28% 4% 0% 1% 100% 774 Helpfulness of park staff 56% % 15% 3% 0% 1% 100% 765 Lack of disturbances by other park visitors 53% % 26% 10% 3% 1% 100% 757 Sense of safety provided by presence of park staff 48% % 20% 12% 3% 1% 100% 711 Availability of park staff to answer questions 42% % 18% 6% 3% 3% 100% 715 Attentiveness of park staff to my needs 34% % 12% 4% 1% 1% 100% 691 Someone to greet me when I arrive at the park 23% % 13% 3% 1% 3% 100% Recreation opportunities 793 Trails in the park 77% % 32% 3% 2% 0% 100% 611 Quality of facilities in the picnic grounds 56% % 29% 7% 4% 2% 100% 482 Designated places to swim 36% % 23% 8% 3% 7% 100% 420 Boating opportunities (e.g., canoe/kayaking, 36% % 24% 14% 3% 2% 100% motorboating) 420 Fishing opportunities 33% % 22% 12% 2% 1% 100% Information and interpretation 534 Trail signs for finding my way around the park 73% % 31% 9% 6% 1% 100% 760 General informational brochure/maps provided 56% % 32% 11% 3% 1% 100% 701 Learning about the park using a self-guided trail, 40% % 30% 10% 3% 2% 100% brochure, kiosk, or other self-guided means 617 Visitor center exhibits, videos, and displays 28% % 29% 5% 2% 0% 100% 388 Learning about the park from a staff-led program 20% % 21% 2% 4% 2% 100% Facilities and services 426 Place or accommodations for pets in the park 39% % 27% 13% 3% 0% 100% 421 Accommodations for large family or social groups 27% % 22% 7% 3% 0% 100% 539 Availability of convenience items to purchase 25% % 21% 6% 2% 5% 100% 534 Availability of souvenirs to purchase 19% % 20% 5% 4% 2% 100% Camping (camper responses only) 189 Quality of the campground % 52% 38% 8% 2% 0% 100% 185 Quality of facilities in campground % 48% 35% 10% 6% 2% 100% 175 Secluded campsites % 38% 36% 15% 7% 4% 100% 173 Campground near lake or river % 71% 19% 8% 1% 0% 100% 2017 n for importance question for each item is displayed in the far left column Bold indicates < or = 60% 'very satisfied' After ranking the importance of an item for an enjoyable visit, visitors indicated how satisfied they are with the item in the park. The right side of Table 22 displays the item s satisfaction ratings from visitors who ranked that item as very important. Satisfaction ratings from visitors who considered an item of lesser importance are not evaluated in terms of satisfaction, because they were not as salient to the visitor s enjoyment of the park. 36
37 Some items have high satisfaction ratings (among visitors rating it as very important ) and some are lower. None of the natural landscape items is of lower satisfaction. High satisfaction rated items are where the parks are performing well. The lower satisfaction items are potential candidates for performance improvement initiatives. (These items are in bold and boxed in Table 22.) These include any items with very satisfied ratings of 60% or below (i.e., some 40% or more of visitors who judge the item very important report they are less than very satisfied with it in the park). The items include: Staffing and maintenance: lack of disturbance by other park visitors Recreation opportunities: o Quality of facilities in the picnic grounds o Designated places to swim o Boating opportunities Information and interpretation: o Trail signs o General informational brochures/maps o Learning about the park through self-guided means Facilities and services: place or accommodations for pets in the park Camping: o Quality of campground o Quality of facilities in the campground o Secluded campsites As noted, the preceding lower satisfaction items are candidates for efforts to raise satisfaction. These items are identified on satisfaction ratings for visitors ranking the item as very important. For some applications this is appropriate. For instance, if you are concerned about the quality of learning opportunities in the parks for those visitors seeking such learning, then this satisfaction measure is appropriate. Another approach is to look at the mean satisfaction of all visitors and by party composition and respondent age. A mean satisfaction threshold of 4.1 is used to display items where improvements would do the most good for the most number of visitors. Table 23 shows these items ranked from lowest mean score to highest. When assessed this way (Table 23), eight items have low mean scores across all party composition and respondent age categories. These eight could receive additional attention under the rationale that improvements would impact the most visitors. Three items are water related: places to swim, fishing and boating opportunities. Two items are facility related: accommodations for large family or social groups and place or 37
38 accommodations for pets in the park. The remaining items are learning about the park from a staff-led program and availability of convenience items and souvenirs to purchase. Response of all visitors Party Composition Age of respondent Contains teens Specific item All visitors Adult only and/or children 29 or younger 30 to 44 years 45 to 64 years 65 years or older Learning about the park from a staff-led program Designated places to swim Fishing opportunities Place or accommodations for pets in the park Availability of convenience items to purchase Boating opportunities Availability of souvenirs to purchase Accommodations for large family or social groups Visitor center exhibits, videos, and displays Learning about the park from a self-guided trail Someone to greet me when I arrive at the park Sense of safety provided by presence of park staff Trail signs for finding my way around the park General informational brochure/maps provided Trails in the park Well-maintained, clean grounds and facilities Well protected natural resources Lack of disturbances by other park visitors Beauty of the park Quality of facilities in the picnic grounds 4.00 Lakes and rivers in the park Helpfulness of park staff Availability of park staff to answer questions A natural setting for the park Attentiveness of park staff to my needs Table 23 Items with mean satisfaction score of 4.1 or lower among all visitors (all visitors) Response of campers Party Composition Age of respondent Contains teens Specific item All visitors Adult only and/or children 29 or younger 30 to 44 years 45 to 64 years 65 years or older Secluded campsites Quality of facilities in campground Quality of the campground Campground near lake or river Reasons for dissatisfaction with specific items Visitors were asked to tell us why they were dissatisfied with specific items and what could make it better. Some respondents answered the first part of the question, while other respondents chose to answer the second part of the question. The open-ended responses to this question were coded and can be seen in Table 24 below. The most frequently mentioned items are in the staffing and maintenance group and include trail wayfinding and maps, ground maintenance, and staff/office availability and service. The other category includes comments on preserving nature, accessibility, fees, state funding and marketing. 38
39 Item group Specific item Percent of park visitors Staffing and maintenance Improve trail wayfinding and maps 20.9% Poor grounds and trail maintenance, need to improve 19.7% Positive experience (staff, park) 17.3% Staff/office hours, customer service 13.1% Unwanted noise, park rules 5.4% Facilities and services Provide improved, cleaner bathrooms/outhouses 9.4% Swimming beach/fishing/water recreation 7.5% Lack of cell service, utilities, safety concerns, provide more access 5.4% Pet policies and behaviors 5.1% Improve shower facilities 4.7% Availability of convenience items or souvenirs to purchase 4.5% More trails, recreation 4.0% Exhibits, programs, information 3.0% Camping Campsites too close together 5.8% Quality/quantity of cabins, campsites, shelters 4.3% Park management Reservation system, non-reservable campsites 2.5% Other/miscellaneous concerns Other 5.0% 2017 n=277 Table 24 For any of the items that you were NOT satisfied with, please tell us why you were not satisfied & what we could do to make it better. (Open-ended question) 39
40 The full list of comments is provided in a separate Excel file. Some typical comments reflective of the most frequent responses include the following: I THINK HIKING TRAIL SIGNAGE COULD BE IMPROVED. MANY OF THE "YOU ARE HERE" STICKERS WERE MISSING ON JUNCTION SIGNS. WE WERE CONFUSED ABOUT WHERE INSPIRATION POINT WAS. NOT MARKED WELL ENOUGH ON THE TRAIL. THE TRAIL SIGN BY THE VERY STEEP STAIRS LEFT US WONDERING IF WE WERE THERE. WE DIDN'T KNOW WHAT WAS AT BOTTOM OF STAIRS. ALSO COULD MARK THE PAPER MAP BETTER AS TO PUTTING "STAIRS" IN THE DIAGRAM. TRAILS IN THE PARK ARE NOT ALL MAINTAINED; THE FURTHER ONE IS FROM THE VISITOR CENTER THE LESS MAINTAINED; RATHER THAN UPKEEP AND REPAIR SOME TRAILS THEY WERE SIMPLY CLOSED PERMANENTLY DUE TO EROSION. OUCH! THIS USED TO BE MY FAVORITE PARK-BEAUTIFUL PICNIC AREA BUT NOW YOU DON'T MOW THE GRASS DECENT. ANOTHER HOUR YOU COULD HAVE IT ALL MOWED SO IT LOOKS INVITING AGAIN. A LITTLE WEED WHIPPING WOULDN'T HURT EITHER. ALL OTHER PARKS STILL MOW DECENT. MOWING WAS NOT DONE IN SITES WHEN PEOPLE LEFT. GRASS LONG & BUGGY. MOWING DONE BY BATHROOMS AREA & CAMP HOSTS. GRASS IN SOME SITES 12-14" LONG. SAW STAFF DRIVE MOWER DOWN ROAD WHEN HE COULD HAVE GONE ALONG GRASS BY ROAD & LAKE.. POOR MAINTENANCE. PEOPLE HAVE BROUGHT THEIR OWN WEED WACKERS TO TRIM THEIR AREA. REALLY SAD THAT MOWING IS NOT DONE. LOTS OF EXCUSES WHEN ASKED. LIMITED HOURS OF PARK OFFICE STAFF MADE THINGS DIFFICULT. MAPS FOR SELF-GUIDED TRAIL WERE NOT MADE AVAILABLE OUTSIDE. KEEP OFFICE HOURS AS DESCRIBED ON WEBSITE. QUIET HOURS WERE NOT OBSERVED NOR ENFORCED. OVERLY BY-THE-BOOK STAFF. I WAS THERE WITH MY 90-YEAR OLD PARENTS FOR A PICNIC. RAIN WAS THREATENING. STAFF WOULD NOT ALLOW US TO USE THE SHELTER AREA, EVEN IF IT WERE NOT RENTED AND UNOCCUPIED. INSISTED WE HAD TO RENT THE SHELTER IF WE WANTED TO PICNIC THERE! SOME STAFF ARE MORE WELCOMING THAN OTHERS. ONE GENTLEMAN THAT I TOLD ABOUT A BIG TREE THAT WAS DOWN (BLOCKING THE MEADOW TRAIL) DIDN'T EVEN ACKNOWLEDGE GETTING THE INFORMATION I SHOWED. I JUST WANTED STAFF TO KNOW. Visitor recommended changes to better serve their needs Visitors were asked what one thing in state parks they would change to better serve their needs. The open-ended responses to this question were coded and can be seen in Table 25 below. The three most frequently mentioned things were more access to cell service or other utilities, improved quality/quantity of cabins, campsites etc., and better grounds maintenance. 40
41 Item group Specific item Staffing and maintenance Positive experience (staff, park) 10.7% Improve grounds and trail maintenance 9.0% Conserve preserve nature 7.6% More staff/office hours, better customer service 7.4% Better/more trail wayfinding 6.6% Facilities and services More access to cell service, utilities, address safety concerns 11.6% More trails, water and other recreation 8.3% Improve/cleaner bathrooms 7.2% Exhibits/programs, info 5.6% Shower facilities 3.4% Convenience items/souvenirs 2.9% Accessibility 2.7% Camping Quality/quantity of cabins, campsites, shelters 9.6% Campsites close proximity, noise, park rules 6.2% Park management Fees, costs 7.6% Reservation system, non-reservable campsites 6.7% Pet policy, behaviors 6.1% State funding 3.7% Marketing, website 2.5% Other/miscellaneous Other 3.4% 2017 n=590 Table 25 If you could change one thing in the State Parks to better serve your needs, what would it be? (Open-ended question) The full list of comments is provided in a separate Excel file. Some typical comments reflective of the most frequent responses include the following: 41
42 IMPROVE CELL PHONE & WEB-BASED ACCESS WITHIN THE PARK PROVIDE ELECTRICAL HOOK UP AT ALL CAMP SITES PROVIDE MORE WATER HOOK UPS. FULL HOOK UP SITES WOULD BE AWESOME. I LIKE THE IDEA OF A COFFEE SHOP. MORE YURTS & CABINS AT THE PARKS WOULD BE WONDERFUL INCREASE AVAILABILITY OF MORE & SECLUDED CAMPING KEEP TENTING (NON-ELECTRIC) AREAS KEEPING GRASS TRAILS MOWED AND TRIMMING BRANCHES AND REMOVING FALLEN TREES FROM TRAILS SO THEY ARE CLEAR AND EASILY ACCESSIBLE. SPRAY FOR MOSQUITOS & DEER FLIES PAVE ALL THE ROADS! PERCEIVED VALUE FOR STATE PARK FEES PAID Visitors have been asked since 1996 about the value they receive for fees paid. The 2017 responses are consistent with prior year results. Annual permits are significantly more likely than daily vehicle permits to be rated as a good value (annual, 87%; daily, 70%) and daily vehicle permits are significantly more likely to be rated a fair value (Table 26). The perceived value of camping fees is similar to the daily vehicle permit (good value, 72%). Knowledge of perceived value for fees is an important consideration in user funding strategies. The higher the perceived value, the more willing visitors are to pay a higher fee. On July 1, 2017 there was a price increase for the daily vehicle permit, and based on this survey, the effect on the daily permit s perceived value is minimal. Looking at the pre- and post-increase perceived value of this permit, there is no significant difference in perceived value of the daily vehicle permit. Before the July 1 st increase 73% of daily permit visitors rated it a good value, compared to 70% after the July 1 st increase. 42
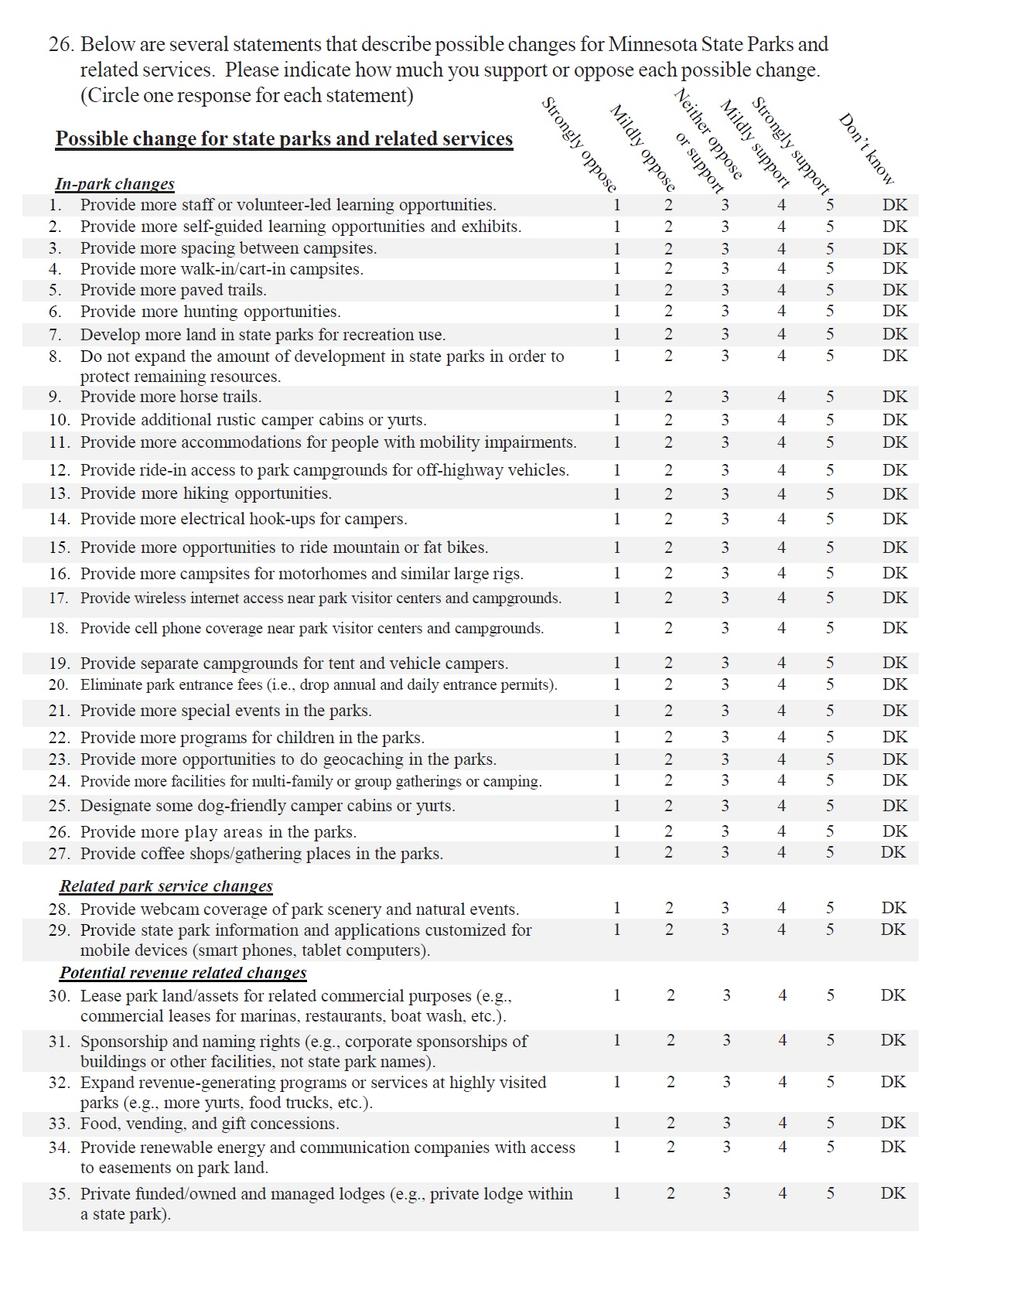
43 Table 26 For the money paid for an entrance permit (or camping), do you feel you are getting a good, fair, or poor value from Minnesota State Parks? Annual vehicle entrance permit 2017 n=592 Perceived value Good 82% 80% 86% 87% Fair 17% 18% 13% 12% Poor 1% 1% 1% 1% Don't know 1% 1% 0% 0% Total 100% 100% 100% 100% Daily vehicle entrance permit 2017 n=251 Perceived value Good 72% 74% 68% 70% Fair 25% 21% 26% 27% Poor 2% 4% 4% 1% Don't know 1% 1% 2% 2% Total 100% 100% 100% 100% Camping 2017 n=125 Perceived value Good 74% 65% 75% 72% Fair 23% 32% 23% 25% Poor 3% 2% 2% 2% Don't know 0% 1% 0% 0% Total 100% 100% 100% 100% CHANGES VISITORS SUPPORT/OPPOSE IN STATE PARK FACILITIES, SERVICES, AND PROGRAMS Strong support is given in 2017 to several possible changes, including expanded hiking opportunities, more learning opportunities (self-guided and staff-led), and more programs for children (Table 27). More hiking opportunities is the most supported item 43
44 (by far), which reiterates the high importance of trail-related concerns in the park. Also receiving strong support are more accommodations for people with mobility impairments, more spacing between campsites, separate tent and vehicle camping, more rustic camper cabins and walk-in campsites, cell phone coverage near park visitor centers and campgrounds, mobile-friendly apps and information, as well as not expanding the amount of park development to protect remaining resources. Possible changes that receive strong opposition are familiar from previous studies: elimination of park entrance fees, more hunting opportunities, and more OHV opportunities (Table 27). Among the potential revenue-related changes private lodges, sponsorship rights, land leasing for commercial purposes and renewable energy/communication company easements also receive strong opposition. Between the support and oppose extremes are possible changes to which visitors provide moderate support, are ambivalent about, and indicate the change may be controversial (sizable support and opposition to the possible change). Moderate support is indicated for expansions of the following: special events, geocaching opportunities, mountain biking opportunities, paved trails, wireless access, electrical hook-ups, dogfriendly cabins, play areas, land for recreation use, and facilities for large groups. Though receiving moderate support, paved trails, wireless internet access near park visitor centers and campgrounds, and more land for recreation use have both sizable support and opposition. Other changes that may be controversial (receive at least 20% support and opposition) include expansions of campsites for motorhomes and revenuegenerating services or programs as well as providing webcams of natural events/scenery, food/vending concessions, and coffee shops/gathering places. Visitors are largely ambivalent about more horse trails. There is broad agreement on the responses in Table 27 across type of visitor (day visitor, camper) except for items that are camper-focused, such as campsite spacing, electrical hook-ups, and sites for rigs, which drive more camper support. There are notable differences across many items based on age, which are connected to differences in activities they do. For example, young adults are more supportive of hiking, geocaching, more campsite spacing, walk-in campsites, separate tent and motorhome sites, and elimination of entrance fees. Older adults are more supportive of electrical hook-ups, volunteer-led learning opportunities, and more cabins. Younger adults are more supportive of customized mobile apps, while older adults are more supportive of wireless internet access. 44
45 Oppose/support response Average Strongly Mildly Neither oppose Mildly Strongly Don't "oppose/support" support support nor support oppose oppose know Total Possible change response** (percent) (percent) (percent) (percent) (percent) (percent) (percent) Changes visitors largely support (average greater than 3.5) Provide more hiking opportunities % 31% 19% 1% 0% 6% 100% Provide more spacing between campsites % 21% 23% 1% 1% 23% 100% Provide more self-guided learning opportunities and exhibits % 40% 22% 1% 1% 6% 100% Provide more staff or volunteer-led learning opportunities % 31% 30% 2% 1% 9% 100% Provide cell phone coverage near park visitor centers/campgrounds % 34% 16% 7% 7% 5% 100% Provide more programs for children in the parks % 35% 31% 3% 1% 11% 100% Provide more accommodations for people with mobility impairments % 29% 34% 2% 1% 12% 100% Provide separate campgrounds for tent and vehicle campers % 24% 34% 4% 2% 14% 100% Provide additional rustic camper cabins or yurts % 27% 32% 5% 1% 16% 100% Do not expand the amount of development in state parks in order % 20% 30% 9% 4% 9% 100% to protect remaining resources Provide state park information and applications customized for % 35% 29% 4% 6% 7% 100% mobile devices Provide more walk-in/cart-in campsites % 15% 38% 2% 1% 27% 100% Changes visitors moderately support (average greater than 3.2) Provide more special events in the parks % 30% 41% 5% 2% 10% 100% Provide wireless internet access near park visitor centers/campgrounds % 24% 23% 11% 10% 6% 100% Designate some dog-friendly camper cabins or yurts % 22% 34% 5% 8% 13% 100% Provide more paved trails % 23% 29% 12% 8% 6% 100% Provide more play areas in the parks % 27% 42% 8% 3% 9% 100% Provide more opportunities to do geocaching in the parks % 17% 51% 4% 2% 16% 100% Provide more electrical hook-ups for campers % 15% 35% 9% 6% 20% 100% Develop more land in the state parks for recreation use % 22% 25% 16% 9% 10% 100% Provide more facilities for multi-family or group gatherings or camping % 20% 50% 5% 3% 15% 100% Provide more opportunities to ride mountain or fat bikes % 20% 38% 9% 7% 13% 100% Changes visitors are ambivalent about (average between 2.7 and 3.2) Provide webcam coverage of park scenery and natural events % 27% 35% 10% 11% 10% 100% Food, vending and gift concessions % 30% 32% 11% 14% 4% 100% Expand revenue-generating programs or services at highly visited parks % 30% 26% 16% 16% 5% 100% Provide coffee shops/gathering places in the parks % 25% 28% 15% 17% 6% 100% Provide more horse trails % 6% 50% 12% 8% 19% 100% Provide more campsites for motorhomes and similar large rigs % 10% 32% 20% 14% 17% 100% Changes visitors largely oppose (average less than 2.7) Provide renewable energy and communication companies with % 16% 29% 15% 24% 11% 100% access to easements on park land Provide more hunting opportunities % 8% 28% 14% 26% 16% 100% Provide ride-in access to park campgrounds for off-highway vehicles % 10% 25% 20% 26% 14% 100% Eliminate park entrance fees % 9% 23% 21% 31% 7% 100% Private funded/owned and managed lodges % 11% 25% 18% 38% 7% 100% Sponsorship and naming rights % 11% 22% 16% 41% 7% 100% Lease park land/assets for related commercial purposes % 8% 17% 20% 46% 8% 100% ** Average value excludes "don't know" response 2017 n varies by item, ranging from Table 27 How much do you support or oppose each possible change being made for Minnesota State Parks? (oppose/support scale: 1=strongly oppose, 2=mildly oppose, 3=neither oppose nor support, 4=mildly support, 5=strongly support) Six items regarding revenue-related changes are an addition to this question in Park visitors are opposed (average less than 2.7) to four of the six items: leasing assets for commercial purposes, sponsorship and naming rights, privately managed lodges, and providing energy and communication companies access to easements. Park visitors are ambivalent about (average between 2.7 and 3.2) expanding revenue-generating programs or services in highly visited parks and food, vending and gift concessions. 45
46 From 2012 to 2017, the possible changes visitors support/oppose in the parks have been largely stable. Three of the possible changes have statistically significant differences in the average. Providing more staff or volunteer-led learning opportunities has risen in the strong support category, with a 2012 average of 3.58 to 3.92 in Developing park land for more recreation use has risen from being equally supported and opposed to moderately support, with a 2012 average of 3.17 to 3.31 in Provide more hiking opportunities remains at the top of the largely support category in 2017, with an increase in the average of 4.22 in 2017 compared to 4.17 in Certain of the possible changes are relevant to campers as a group, so their responses are examined separately (Table 28). Some of these possible changes are largely supported by all campers, others are mixed, and the remaining have levels of support/opposition that varies by the type of camper (tent or vehicle camper). All campers support four possible changes: more spacing between campsites, cell phone coverage, more walk-in campsites, additional rustic cabins and yurts. The first two were also supported by all campers in No changes are opposed by all campers. One possible change all campers are ambivalent about is designating some dog-friendly cabins or yurts. A possible change tent campers support and vehicle campers moderately support is separate campgrounds for tent and vehicle campers. In 2012 vehicle campers were ambivalent about this change. A possible change vehicle campers support and tent campers are ambivalent about is: more electrical hook-ups for campers. This possible change is most applicable to vehicle campers and one-third of tent campers neither support nor oppose it. A possible change vehicle campers support and tent campers oppose is: more campsites for motorhomes and similar large rigs. This possible change is most applicable to vehicle campers. 46
47 Table 28 How much do you support or oppose each possible change for Minnesota State Parks (Oppose/support scale: 1=strongly oppose, 2=mildly oppose, 3=neither oppose nor support, 4=mildly support, 5=strongly support) Oppose/support response Average Strongly Mildly Neither oppose Mildly Strongly Don't "oppose/support" support support nor support oppose oppose know Total Possible change response** (percent) (percent) (percent) (percent) (percent) (percent) (percent) 2017 n= Changes all campers support Provide more spacing between campsites 119 All campers % 25% 19% 2% 1% 2% 100% 50 Tent campers % 26% 15% 1% 0% 2% 100% 56 RV and Trailer campers % 24% 21% 2% 1% 1% 100% Provide cell phone coverage near park visitor centers and campgrounds 120 All campers % 29% 14% 8% 8% 1% 100% 50 Tent campers % 27% 20% 11% 10% 2% 100% 56 RV and Trailer campers % 28% 10% 5% 5% 0% 100% Provide more walk-in/cart-in campsites 108 All campers % 16% 49% 3% 2% 10% 100% 47 Tent campers % 19% 33% 1% 2% 8% 100% 49 RV and Trailer campers 4.0 5% 13% 64% 3% 3% 13% 100% Provide additional rustic camper cabins or yurts 109 All campers % 27% 39% 6% 3% 10% 100% 45 Tent campers % 36% 28% 6% 3% 10% 100% 50 RV and Trailer campers 4.0 9% 18% 53% 7% 3% 11% 100% Changes tent campers support and RV/trailer campers moderately support Provide separate campgrounds for tent and vehicle campers 113 All campers % 24% 36% 8% 5% 6% 100% 46 Tent campers % 30% 23% 3% 3% 8% 100% 53 RV and Trailer campers % 19% 51% 9% 6% 5% 100% RV/trailer campers support and tent campers are ambivalent Provide more electrical hook-ups for campers 112 All campers % 22% 28% 9% 6% 7% 100% 45 Tent campers 2.9 9% 13% 36% 18% 11% 12% 100% 55 RV and Trailer campers % 28% 20% 0% 1% 2% 100% Provide wireless internet access near park visitor centers and campgrounds 119 All campers % 25% 17% 10% 13% 2% 100% 50 Tent campers % 24% 25% 13% 13% 2% 100% 56 RV and Trailer campers % 24% 11% 7% 8% 1% 100% RV/trailer campers support and tent campers oppose Provide more campsites for motorhomes and similar large rigs 112 All campers % 15% 30% 19% 15% 7% 100% 45 Tent campers 2.3 2% 5% 33% 27% 23% 10% 100% 54 RV and Trailer campers % 25% 28% 11% 5% 3% 100% Changes all campers are ambivalent Designate some dog-friendly camper cabins or yurts 112 All campers % 19% 38% 7% 11% 8% 100% 45 Tent campers % 21% 34% 5% 13% 10% 100% 54 RV and Trailer campers % 14% 44% 8% 8% 5% 100% 2017 n for each item is displayed in the far left column. Average value excludes 'don't know responses. Acceptable Contact Information This year s survey included a new question regarding acceptability of additional uses of contact information visitors have provided to the DNR. One-third of visitors don t support the additional use of their contact information, with day visitors significantly more likely than campers to oppose any use (37% vs. 23%). Visitors who are 65 years or older and visitors under the age of 30 are significantly more likely than visitors who are 47
48 30-44 years old to oppose any use (65+, 41%; <30, 40% vs , 27%). Visitors with less than $50,000 in income are more likely than those with $50-$99,999 or visitors with $150,000 or more in income to oppose any use of their contact information (<$50K, 43% vs. $50-$99,999, 30%; $150K or more, 21%). Use of contact information for transaction updates is naturally favored more by campers than day users (52% vs. 25%). Younger visitors are significantly more likely than visitors 65 years of age or older to see transaction update use as acceptable (<29 years, 28%, 30-44, 40%, 45-64, 27% vs. 17%). The use of contact information to communicate about park issues is seen as acceptable by significantly more visitors who are and years old than visitors who are 65 years or older and visitors under the age of 30 (30-44, 51%, 45-64, 46% vs. 65+, 31%; <30, 33%). Visitors with less than $50,000 in income are significantly less likely than visitors with higher incomes to see use of contact information to communicate about park issues as acceptable (<$50K, 33% vs. 43% to 49% for other income categories). Table 29 If you provide contact information to the DNR, which, if any, of the following uses of this contact information would you consider acceptable? Age of respondent Proposed use of information All visitors 29 or younger 30 to 44 years 45 to 64 years 65 years or older Use my information for DNR research purposes 45% 38% 50% 45% 49% to better serve the public Send information about parks and trails issues 42% 33% 51% 46% 31% Send updates about my transaction(s) or trip 28% 28% 40% 27% 17% Allow other researchers to use my information 14% 16% 18% 12% 17% Allow other outdoor-oriented non-profit or government 14% 18% 14% 14% 14% organizations to use my information None of the above 35% 40% 27% 33% 41% 2017 n=878 48
49 References 1. Minnesota Department of Natural Resources Minnesota State Parks Research Summary Report. Prepared by Tim Kelly, Operations Services Division. 2. Minnesota and national population information comes from: U. S. Department of Commerce, Census Bureau. Specific Census tables are noted in each report table. 3. U. S. Department of Commerce, Census Bureau. Projections of the Size and Composition of the U.S. Population: 2014 to 2060 Population Estimates and Projections, March 2015, publication P
50
51 The Research Edge LLC 2017 Minnesota State Park Visitor Survey 51
52 The Research Edge LLC 2017 Minnesota State Park Visitor Survey 52
53
54
Results of 2012 Minnesota State Park Visitor Survey
 Results of 2012 Minnesota State Park Visitor Survey Minnesota State Parks Garden Island Zippel Bay Lake Bronson Hayes Lake Franz Jevne International Falls Old Mill Red River 2 Bemidji La Salle Lake Itasca
2007 Minnesota State Parks Research Summary Report
 2007 Minnesota State Parks Research Summary Report 2007 Minnesota State Parks Research Summary Report The Minnesota State Parks research projects were a cooperative effort of the, Division of Parks and
1987 SUMMER USE SURVEY OF MINNESOTA STATE PARK VISITORS
 This document is made available electronically by the Minnesota Legislative Reference Library as part of an ongoing digital archiving project. http://www.leg.state.mn.us/lrl/lrl.asp (Funding for document
Minnesota River Valley Area Survey Summary Report
 Minnesota River Valley Area Survey Summary Report Report prepared by: Minnesota Department of Natural Resources Office of Management and Budget Services May 2002 ACKNOWLEDGMENTS A number of organizations
2007 Minnesota State Parks Research Report
 This document is made available electronically by the Minnesota Legislative Reference Library as part of an ongoing digital archiving project. http://www.leg.state.mn.us/lrl/lrl.asp 2007 Minnesota State
2007 Minnesota State Parks Research Report
 2007 Minnesota State Parks Research Report Focus Group Study, Minnesota State Park Visitor Survey, and Household Survey of Minnesota Nature-based and State Park Recreation Minnesota Department of Natural
2015 British Columbia Parks. Visitor Survey. Juan De Fuca Park. China Beach
 2015 British Columbia Parks Visitor Survey Juan De Fuca Park China Beach 1 Contents Introduction 3 Methodology 3 Limitations 3 How this report is organized 3 Part 1 - Visitor Satisfaction 4 Part 2 - Visitor
1987 SUMMER USE SURVEY OF MINNESOTA STATE PARK VISITORS
 This document is made available electronically by the Minnesota Legislative Reference Library as part of an ongoing digital archiving project. http://www.leg.state.mn.us/lrl/lrl.asp (Funding for document
State Park Visitor Survey
 State Park Visitor Survey Methods, Findings and Conclusions State s Department of Recreation, Park and Tourism Management surveyed state park visitor and trip characteristics, and collected evaluations
Cedar Rapids Area Convention and Visitors Bureau Visitor Study
 Cedar Rapids Area Convention and Visitors Bureau Visitor Study 2003-2004 University of Northern Iowa Sustainable Tourism & The Environment Program www.uni.edu/step Project Directors: Sam Lankford, Ph.D.
1999 Reservations Northwest Users Survey Methodology and Results November 1999
 1999 Reservations Northwest Users Survey Methodology and Results November 1999 Oregon Survey Research Laboratory University of Oregon Eugene OR 97403-5245 541-346-0822 Fax: 541-346-5026 Internet: OSRL@OREGON.UOREGON.EDU
Recreationists on the Gifford Pinchot National Forest: A Survey of User Characteristics, Behaviors, and Attitudes
 Recreationists on the Gifford Pinchot National Forest: A Survey of User Characteristics, Behaviors, and Attitudes by Alan R. Graefe The Pennsylvania State University Robert C. Burns University of Florida
2006 RENO-SPARKS VISITOR PROFILE STUDY
 2006 RENO-SPARKS VISITOR PROFILE STUDY PREPARED FOR RENO-SPARKS CONVENTION & VISITOR AUTHORITY Study Conducted and Reported by 475 Hill Street, Suite 2 Reno, Nevada 89501 (775) 323-7677 www.infosearchintl.com
RESULTS FROM WYOMING SNOWMOBILE SURVEY: EXECUTIVE SUMMARY
 RESULTS FROM 2000-2001 WYOMING SNOWMOBILE SURVEY: EXECUTIVE SUMMARY Prepared for the Wyoming Department of State Parks and Historic Sites, Wyoming State Trails Program. Prepared By: Chelsey McManus, Roger
Economic And Social Values of Vermont State Parks 2002
 Economic And Social Values of Vermont State Parks 2002 Executive Summary Prepared for Vermont State Parks Department of Forest and Parks and Recreation Prepared by: Alphonse H. Gilbert Robert E. Manning
2013 Business & Legislative Session Visitor Satisfaction Survey Results
 2013 Business & Legislative Session Visitor Satisfaction Survey Results Completed by Juneau Economic Development Council in partnership with The Alaska Committee August 2013 JEDC research efforts are supported
By Prapimporn Rathakette, Research Assistant
 OCTOBER 2000 RESERVATIONS NORTHWEST SURVEY: METHODOLOGY AND RESULTS OREGON PARKS AND RECREATION DEPARTMENT OREGON SURVEY RESEARCH LABORATORY 5245 UNIVERSITY OF OREGON EUGENE, OR 97403-5245 TELEPHONE: 541-346-0824
2014 West Virginia Image & Advertising Accountability Research
 2014 West Virginia Image & Advertising Accountability Research November 2014 Table of Contents Introduction....... 3 Purpose... 4 Methodology.. 5 Executive Summary...... 7 Conclusions and Recommendations.....
Juneau Household Waterfront Opinion Survey
 Juneau Household Waterfront Opinion Survey Prepared for: City and Borough of Juneau Prepared by: April 13, 2004 TABLE OF CONTENTS Executive Summary...1 Introduction and Methodology...6 Survey Results...7
2013 IRVING HOTEL GUEST SURVEY Final Project Report
 2013 IRVING HOTEL GUEST SURVEY Final Project Report Research prepared for the Irving Convention & Visitors Bureau by Destination Analysts, Inc. Table of Contents SECTION 1 Introduction 2 SECTION 2 Executive
Irish Fair of Minnesota: 2017 Attendee Profile
 TOURISM CENTER Irish Fair of Minnesota: 2017 Attendee Profile Authored by Xinyi Qian, Ph.D. Irish Fair of Minnesota: 2017 Attendee Profile November 13, 2017 Authored by Xinyi (Lisa) Qian, Ph.D., University
The Economic Impact of Expenditures By Travelers On Minnesota s Northeast Region and The Profile of Travelers. June 2005 May 2006
 The Economic Impact of Expenditures By Travelers On Minnesota s Northeast Region and The Profile of Travelers Prepared for: Explore Minnesota Tourism State of Minnesota and Minnesota Arrowhead Association
2015 British Columbia Parks. Visitor Survey. Provincial Summary
 2015 British Columbia Parks Visitor Survey Provincial Summary 1 Contents Introduction 3 Methodology 4 Limitations 4 How this report is organized 4 Part 1 - Visitor Satisfaction 5 Part 2 - Visitor Prile
Planning Future Directions. For BC Parks: BC Residents' Views
 Planning Future Directions For BC Parks: BC Residents' Views Summary Report Ministry of Water, Land and Air Protection Province of British Columbia April, 2002 National Library of Canada Cataloguing in
2000 Roaring River State Park Visitor Survey
 Missouri Department of Natural Resources Division of State Parks 800-334-6946 2000 Roaring River State Park Visitor Survey Project Completion Report Submitted to Missouri Department of Natural Resources
AVSP 7 Summer Section 1: Executive Summary
 AVSP 7 Summer 2016 Section 1: Executive Summary Introduction AVSP Overview The Alaska Visitor Statistics Program (AVSP) is a statewide visitor study periodically commissioned by the Alaska Department of
Outdoor Recreation Study of the Foot Hills Forest Area, Summer & Fall 2004
 Outdoor Recreation Study of the Foot Hills Forest Area, Summer & Fall 2004 Outdoor Recreation Study of the Foot Hills Forest Area, Summer & Fall 2004 Foot Hills Forest Study Area 0 20406080100 Miles Moorhead
2009 Muskoka Airport Economic Impact Study
 2009 Muskoka Airport Economic Impact Study November 4, 2009 Prepared by The District of Muskoka Planning and Economic Development Department BACKGROUND The Muskoka Airport is situated at the north end
2010 Nova Scotia Visitor Exit Survey Regional Report
 2010 Nova Scotia Visitor Exit Survey Regional Report A Look at Visitors Who Included Cape Breton in their Trip to Nova Scotia Reproduction in whole or in part is not permitted without the express permission
Trail Use in the N.C. Museum of Art Park:
 Trail Use in the N.C. Museum of Art Park: New Connections, New Visitors Jacqueline MacDonald Gibson, PhD Daniel Rodriguez, PhD Taylor Dennerlein, MSEE, MCRP, EIT Jill Mead, MPH Evan Comen University of
Department of Agricultural and Resource Economics, Fort Collins, CO
 July 2007 EDR 07-16 Department of Agricultural and Resource Economics, Fort Collins, CO 80523-1172 http://dare.colostate.edu/pubs CO LORADO S AGRITOURISTS: WHO ARE THE ADVENTURERS, THE SEEKERS AND THE
Customer Satisfaction Tracking Annual Report British Columbia Ferry Services Inc.
 Customer Satisfaction Tracking Annual Report 0 British Columbia Ferry Services Inc. Presented to: British Columbia Ferry Services Inc. Victoria, British Columbia 0 05 West Second Avenue Vancouver BC V6H
2015 IRVING HOTEL GUEST SURVEY Final Project Report
 2015 IRVING HOTEL GUEST SURVEY Final Project Report Research prepared for the Irving Convention & Visitors Bureau by Destination Analysts, Inc. Table of Contents S E C T I O N 1 Introduction 2 S E C T
Federal Outdoor Recreation Trends Effects on Economic Opportunities
 United States Department of Agriculture Federal Outdoor Recreation Trends Effects on Economic Opportunities The Forest Service National Center for Natural Resources Economic Research is assisting the Federal
1999 Wakonda State Park Visitor Survey
 Missouri Department of Natural Resources Division of State Parks 800-334-6946 1999 Wakonda State Park Visitor Survey Project Completion Report Submitted to Missouri Department of Natural Resources Division
Florida State Park Visitors Park Visiting Party Size
 Party size is roughly the same across all regions. State Park Visitors Park Visiting Party Size Total Central Northeast Northwest Southeast Southwest (n=3972) (n=798) (n=792) (n=782) (n=796) (n=804) Avg.
NAPA VALLEY VISITOR INDUSTRY 2016 Economic Impact Report
 NAPA VALLEY VISITOR INDUSTRY 2016 Economic Impact Report Research prepared for Visit Napa Valley by Destination Analysts, Inc. Table of Contents S E C T I O N 1 Introduction 2 S E C T I O N 2 Executive
Community Rail Partnership Action Plan The Bishop Line Survey of Rail Users and Non-Users August 2011 Report of Findings
 Community Rail Partnership Action Plan The Bishop Line Survey of Rail Users and Non-Users August 2011 Report of Findings Analysis and report NWA Social Research 1 Contents Page No. A. Summary of Main Findings...
NAPA VALLEY VISITOR INDUSTRY 2014 Economic Impact Report
 NAPA VALLEY VISITOR INDUSTRY 2014 Economic Impact Report Research prepared for Visit Napa Valley by Destination Analysts, Inc. Table of Contents SECTION 1 Introduction 2 SECTION 2 Executive Summary 5 SECTION
Maryland State Parks Diversity and Inclusion Efforts: Staff Perspectives and Media Reporting
 Maryland State Parks Diversity and Inclusion Efforts: Staff Perspectives and Media Reporting Natalia Buta, Ph.D. Associate Professor, Frostburg State University University System of Maryland Objectives
CEREDIGION VISITOR SURVEY 2011 TOTAL SAMPLE. November 2011
 CEREDIGION VISITOR SURVEY 2011 TOTAL SAMPLE November 2011 TERMS OF CONTRACT Unless otherwise agreed, the findings of this study remain the copyright of Beaufort Research Ltd and may not be quoted, published
NAPA VALLEY VISITOR INDUSTRY 2012 Economic Impact Report
 Join Visit Napa Valley NAPA VALLEY VISITOR INDUSTRY 2012 Economic Impact Report Research prepared for Visit Napa Valley by Destination Analysts, Inc. Table of Contents SECTION 1 Introduction 2 SECTION
YARTS ON-BOARD SURVEY MEMORANDUM
 YARTS ON-BOARD SURVEY MEMORANDUM Prepared for the Yosemite Area Regional Transportation System Prepared by LSC Transportation Consultants, Inc. This page left intentionally blank. YARTS On-Board Survey
2009/10 NWT Park User Satisfaction Survey Report
 2009/10 NWT Park User Satisfaction Survey Report Industry, Tourism and Investment Government of the Northwest Territories Table of Contents Survey Methodology. 3 Survey Sample...3 Satisfaction with Services
U. S. Hispanic Travelers Report
 University of Massachusetts Amherst ScholarWorks@UMass Amherst Travel and Tourism Research Association: Advancing Tourism Research Globally 2013 Marketing Outlook Forum - Outlook for 2014 U. S. Hispanic
Vermont Tourism and Recreation Survey
 Final Report Vermont Tourism and Recreation Survey Prepared by: William Valliere, Lisa Chase, and Robert Manning Vermont Tourism Research Center Park Studies Laboratory University of Vermont For more information,
Maine Office of Tourism Visitor Tracking Research 2015 Calendar Year Annual Report Canadian Visitors
 Maine Office of Tourism Visitor Tracking Research 2015 Calendar Year Annual Report Prepared by May 2016 1 1 Table of Contents Research Objectives and Methodology 4 Canadian Overnight Visitors: Traveler
Chambers of Commerce and Lake Groups advertised this NCWRPC created online survey that was : Opened: August 22, 2012; and Closed: October 4, 2012.
 Vilas County Outdoor Recreation Survey Chambers of Commerce and Lake Groups advertised this NCWRPC created online survey that was : Opened: August 22, 202; and Closed: October 4, 202. Q What Vilas County
2004 SOUTH DAKOTA MOTEL AND CAMPGROUND OCCUPANCY REPORT and INTERNATIONAL VISITOR SURVEY
 2004 SOUTH DAKOTA MOTEL AND CAMPGROUND OCCUPANCY REPORT and INTERNATIONAL VISITOR SURVEY Prepared By: Center for Tourism Research Black Hills State University Spearfish, South Dakota Commissioned by: South
Outdoor Recreation In America 1998
 Outdoor Recreation In America 1998 Prepared For: The Recreation Roundtable 1225 New York Avenue, NW Washington, DC 20005 (202) 682-9530 June 1998 Table of Contents INTRODUCTION SUMMARY SECTION I: THE RECREATION
Evaluating Lodging Opportunities
 Evaluating Lodging Opportunities This section explores market opportunities for new lodging accommodations in the downtown area. It will help you understand travel and visitation trends, existing competition,
2010 Nova Scotia Visitor Exit Survey Regional Report
 2010 Nova Scotia Visitor Exit Survey Regional Report A Look at Visitors Who Included Yarmouth and Acadian Shores in their Trip to Nova Scotia Reproduction in whole or in part is not permitted without the
Customer Satisfaction Tracking Annual Report British Columbia Ferry Services Inc.
 Customer Satisfaction Tracking Annual Report 2006 British Columbia Ferry Services Inc. Presented to: British Columbia Ferry Services Inc. Victoria, British Columbia 02 1505 West Second Avenue Vancouver
Customer Satisfaction Tracking Annual Report British Columbia Ferry Services Inc.
 Customer Satisfaction Tracking Annual Report 2007 British Columbia Ferry Services Inc. Presented to: British Columbia Ferry Services Inc. Victoria, British Columbia 02 10 West Second Avenue Vancouver BC
Visitors Experiences and Preferences at Lost Lake in Clatsop State Forest, Oregon
 Visitors Experiences and Preferences at Lost Lake in Clatsop State Forest, Oregon Final Report Mark D. Needham, Ph.D. Assistant Professor Recreation Resource Management Program Department of Forest Resources
Byron Shire Visitor Profile and Satisfaction Report: Summary and Discussion of Results
 Byron Shire Visitor Profile and Satisfaction Report: Summary and Discussion of Results Introduction The Byron Shire Visitor Profile and Satisfaction (VPS) project was completed as part of the Destination
VISITOR SURVEY. Wyoming State Parks and Historic Sites ARTS. PARKS. HIS Y. Fort Bridger State Historic Site
 Fort Bridger State Historic Site Wyoming Territorial Prison State Historic Site Curt Gowdy State Park Wyoming State Parks and Historic Sites VISITOR SURVEY 2009 ARTS. PARKS. HIS Y. Wyoming State Parks
Tourism in Alberta. A Summary Of Visitor Numbers, Revenue & Characteristics Research Resolutions & Consulting Ltd.
 Tourism in Alberta A Summary Of Visitor Numbers, Revenue & Characteristics 2001 Alberta North Canadian Rockies Edmonton & Area Alberta Central Calgary & Area Policy & Economic Analysis Alberta South March
The Economic Contributions of Agritourism in New Jersey
 The Economic Contributions of Agritourism in New Jersey Bulletin E333 Cooperative Extension Brian J. Schilling, Extension Specialist in Agricultural Policy Kevin P. Sullivan, Institutional Research Analyst
2007 RENO-TAHOE VISITOR PROFILE STUDY
 2007 RENO-TAHOE VISITOR PROFILE STUDY PREPARED FOR RENO-SPARKS CONVENTION & VISITORS AUTHORITY Study Conducted and Reported by 475 Hill Street, Suite 2 Reno, Nevada 89501 (775) 323-7677 www.infosearchintl.com
Seattle Southside Digital Media Conversion Study. Prepared by
 Seattle Southside Digital Media Conversion Study Prepared by Project Overview PURPOSE The purpose of the Seattle Southside Visitor Services Digital Media Conversion Study was to measure the conversion
JUNEAU BUSINESS VISITOR SATISFACTION SURVEY RESULTS
 2018 JUNEAU BUSINESS VISITOR SATISFACTION SURVEY RESULTS Completed by the Juneau Economic Development Council in partnership with the Alaska Committee. JEDC research efforts are supported by core funding
IATA ECONOMICS BRIEFING AIRLINE BUSINESS CONFIDENCE INDEX OCTOBER 2010 SURVEY
 IATA ECONOMICS BRIEFING AIRLINE BUSINESS CONFIDENCE INDEX OCTOBER SURVEY KEY POINTS Results from IATA s quarterly survey conducted in October show business conditions continued to improve during the third
Agritourism in Missouri: A Profile of Farms by Visitor Numbers
 Agritourism in Missouri: A Profile of Farms by Visitor Numbers Presented to: Sarah Gehring Missouri Department of Agriculture Prepared by: Carla Barbieri, Ph.D. Christine Tew, MS candidate April 2010 University
Economic Impact of Tourism in Hillsborough County September 2016
 Economic Impact of Tourism in Hillsborough County - 2015 September 2016 Key findings for 2015 Almost 22 million people visited Hillsborough County in 2015. Visits to Hillsborough County increased 4.5%
Figure 1.1 St. John s Location. 2.0 Overview/Structure
 St. John s Region 1.0 Introduction Newfoundland and Labrador s most dominant service centre, St. John s (population = 100,645) is also the province s capital and largest community (Government of Newfoundland
Maine Office of Tourism Visitor Tracking Research 2012 Calendar Year Annual Report Regional Insights: Maine Lakes and Mountains
 Maine Office of Tourism Visitor Tracking Research 2012 Calendar Year Annual Report Regional Insights: Maine Lakes and Mountains Prepared by April 2013 1 Introduction and Methodology 2 The Maine Office
Prepared for: TOMM Committee Kangaroo Island CB Contact: Ben Nitschke, Account Manager Phone: (08)
") Prepared for: TOMM Committee Kangaroo Island CB Contact: Ben Nitschke, Account Manager Phone: (08) 8373 3822 Email: ben.nitschke@colmarbrunton.com Issue Date: 24 August, 2017 Project number: TOMM0003 www.colmarbrunton.com
Prepared for: TOMM Committee Kangaroo Island CB Contact: Ben Nitschke, Account Manager Phone: (08) 8373 3822 Email: ben.nitschke@colmarbrunton.com Issue Date: 24 August, 2017 Project number: TOMM0003 www.colmarbrunton.com
RECOMMENDED CITATION: Pew Research Center, January, 2015, Most Support Stronger U.S. Ties With Cuba
 NUMBERS, FACTS AND TRENDS SHAPING THE WORLD FOR RELEASE JANUARY 16, 2015 FOR FURTHER INFORMATION ON THIS REPORT: Carroll Doherty, Director of Political Research Jocelyn Kiley, Associate Director, Research
2013 OUTDOOR RECREATION PARTICIPATION PUBLIC SURVEY -SUMMARY REPORT-
 2013 OUTDOOR RECREATION PARTICIPATION PUBLIC SURVEY -SUMMARY REPORT- SEPTEMBER 16, 2013 Research, Policy and Planning Unit OVERVIEW This report provides a summary overview and analysis of the 2013 Participation
2014 NOVEMBER ECONOMIC IMPACTS AND VISITOR PROFILE. Prepared By:
 2014 NOVEMBER ECONOMIC IMPACTS AND VISITOR PROFILE Prepared By: Sisters Folk Festival Economic Impacts and Visitor Profile September 5-7, 2014 November 2014 Prepared for Sisters Folk Festival, Inc. Sisters,
Mood of the Nation New Zealanders' perceptions of international visitors. March 2018
 Mood of the Nation New Zealanders' perceptions of international visitors March 2018 Contents 1 Background and approach 3 2 Key insights 6 3 Detailed insights 10 4 Appendix: measures by region 31 2 1 Background
Devonport-Takapuna Local Board Profile
 Devonport-Takapuna Local Board Profile - Initial results from the Census February 2014 Social and Economic Research Team Research, Investigations and Monitoring Unit Auckland Council Map of Devonport-Takapuna
Maine Office of Tourism Visitor Tracking Research Winter 2017 Seasonal Topline. Prepared by
 Maine Office of Tourism Visitor Tracking Research Winter 2017 Seasonal Topline Prepared by June 2017 Research Objectives and Methodology 2 Research Objectives Three distinct online surveys are used to
The University of Georgia
 The University of Georgia Center for Agribusiness and Economic Development College of Agricultural and Environmental Sciences Georgia Agritourism Overview: Results from a 2005 Business Survey Center Report:
REPORT. VisitEngland Business Confidence Monitor Wave 5 Autumn
 REPORT VisitEngland Business Confidence Monitor 2011 5-7 Museum Place Cardiff, Wales CF10 3BD Tel: ++44 (0)29 2030 3100 Fax: ++44 (0)29 2023 6556 www.strategic-marketing.co.uk Page 2 of 31 Contents Page
San Francisco Municipal Transportation Agency (SFMTA) Travel Decision Survey 2012
 Travel Decision Survey 2012") Note: The weighting used in this report is not consistent with Travel Decision Surveys (TDS) 2013 and 2014, and findings from this report should not be compared with findings from TDS 2013 and TDS 2014.
Note: The weighting used in this report is not consistent with Travel Decision Surveys (TDS) 2013 and 2014, and findings from this report should not be compared with findings from TDS 2013 and TDS 2014.
Division of Governmental Studies and Services. Final Report. Washington State Outdoor Recreation Survey Report
 D 1 Appendix D: Survey Analysis Division of Governmental Studies and Services Final Report November 29, 2017 Washington State Outdoor Recreation Survey Report Report Authors: Christina Sanders, Acting
Civil Aviation Authority:
 Civil Aviation Authority: UK Aviation Consumer Survey August 2018 CONTENTS Background and method Headline measures Flying behaviour Recent experience Travel disruption Disability Key driver analysis Public
The methodology and sample surveys have been developed through a partnership of: DCNR and the Secretary's Greenways Program Advisory Committee
 Trail User Survey Workbook How to conduct a survey and win support for your trail Sample Surveys and Methods 2005 Rails-to-Trails Conservancy Northeast Regional Field Office 2133 Market St, #222 Camp Hill,
Customer Satisfaction Tracking Annual Report British Columbia Ferry Services Inc.
 Customer Satisfaction Tracking Annual Report British Columbia Ferry Services Inc. Presented to: British Columbia Ferry Services Inc. Victoria, British Columbia 0 0 West Second Avenue Vancouver BC VH Y
2015 General Trail User Survey February 2016
 2015 General Trail User Survey February 2016 Table of Contents Executive Summary 2 Project Background 2 Trail Town Program Background 2 Survey Background 2 Methods: 3 2015 General Trail User Survey 3 2015
Chapter 1: The Population of NHS Greater Glasgow and Clyde
 Population Estimate (thousands) Chapter 1: The Population of NHS Greater Glasgow and Clyde Population Trends and Projections National Records of Scotland estimated (NRS SAPE) 1 the 2013 NHS Greater Glasgow
Crater Lake National Park. Visitor Study Summer 2001
 National Park Service U.S. Department of the Interior The Visitor Services Project Crater Lake National Park Visitor Study Summer 2001 Margaret Littlejohn Visitor Services Project Report 129 April 2002
State of the Shared Vacation Ownership Industry. ARDA International Foundation (AIF)
") State of the Shared Vacation Ownership Industry ARDA International Foundation (AIF) This paper includes a high-level overview of the timeshare industry with a core focus on financial growth, owner demographics
State of the Shared Vacation Ownership Industry ARDA International Foundation (AIF) This paper includes a high-level overview of the timeshare industry with a core focus on financial growth, owner demographics
Outreach: Terrestrial Invasive Species And Recreational Pathways S U S A N B U R K S M N D N R I N V A S I V E S P P P R O G C O O R D
 Outreach: Terrestrial Invasive Species And Recreational Pathways S U S A N B U R K S M N D N R I N V A S I V E S P P P R O G C O O R D Education Project Funded by USFS State & Private Forestry Describe
Tourism in Alberta. A Summary Of Visitor Numbers, Revenue & Characteristics 2004
 Tourism in Alberta A Summary Of Visitor Numbers, Revenue & Characteristics 2004 Alberta North Based on the 2004 Canadian & International Travel Surveys (Statistics Canada) Canadian Rockies Edmonton & Area
CAMPER CHARACTERISTICS DIFFER AT PUBLIC AND COMMERCIAL CAMPGROUNDS IN NEW ENGLAND
 CAMPER CHARACTERISTICS DIFFER AT PUBLIC AND COMMERCIAL CAMPGROUNDS IN NEW ENGLAND Ahact. Early findings from a 5-year panel survey of New England campers' changing leisure habits are reported. A significant
Travel Decision Survey Summary Report. San Francisco Municipal Transportation Agency (SFMTA)
") Note: The weighting used in this report is not consistent with Travel Decision Surveys (TDS) 2013 and 2014, and findings from this report should not be compared with findings from TDS 2013 and TDS 2014.
Note: The weighting used in this report is not consistent with Travel Decision Surveys (TDS) 2013 and 2014, and findings from this report should not be compared with findings from TDS 2013 and TDS 2014.
Cooper-Hewitt, National Design Museum Visitors Summer 2008 Summary of Findings
 Introduction Cooper-Hewitt, National Design Museum Visitors Summer 2008 Summary of Findings Office of Policy & Analysis Smithsonian Institution July 2008 In June 2008, the Office of Policy and Analysis
Appendix 15.2: Pasha Dere Beach Usage Survey
 Appendix 15.2: Pasha Dere Beach Usage Survey URS-EIA-REP-22375 Table of Contents 15.2 Pasha Dere Beach Usage Survey... 1 15.2.1 Introduction... 1 15.2.2 Beach Surveys... 1 15.2.2.1 Survey Dates, Times
BUSINESS BAROMETER December 2018
 Credit: Chris Orange BUSINESS BAROMETER December Credit: Nigel Moore 1 Contents Summary of findings 3 Annual monthly performance: visitor attractions..4 Visit Herts Team update 5 National context.8 Visitor
Tourism Kelowna Visitor Intercept Survey Findings FINAL DRAFT REPORT
 Tourism Kelowna Visitor Intercept Survey Findings FINAL DRAFT REPORT January 17, 2017 1 Table of Contents Executive Summary... 3 Methodology.. 7 Visitor Intercept Survey Findings.. 9 Visitor Profile. 9
Measurement of the Economic Vitality of The Blue Ridge National Heritage Area
 Measurement of the Economic Vitality of The Blue Ridge National Heritage Area Section II Development and Implementation of an Industry-Wide Measuring Tool Designed to Assess Visitor Demographics, Psychographics,
STATE TRAIL USE. Minnesota Department of Natural Resources Trails and Waterways Division & Office of Management and Budget Services
 STATE TRAIL USE Summary of Summer Trail Use and User Surveys Conducted in 1996, 1997 and 1998 Minnesota Department of Natural Resources Trails and Waterways Division & Office of Management and Budget Services
Events Tasmania Research Program Hobart Baroque Festival
 Events Tasmania Research Program Hobart Baroque Festival Research Report 2014 Prepared by This report has been prepared by Enterprise Marketing and Research Services Pty. Ltd. 60 Main Road, Moonah, 7009
The Economic Benefits of Agritourism in Missouri Farms
 The Economic Benefits of Agritourism in Missouri Farms Presented to: Missouri Department of Agriculture Prepared by: Carla Barbieri, Ph.D. Christine Tew, M.S. September 2010 University of Missouri Department
LOCAL AREA TOURISM IMPACT MODEL. Wandsworth borough report
 LOCAL AREA TOURISM IMPACT MODEL Wandsworth borough report London Development Agency May 2008 CONTENTS 1. Introduction... 3 2. Tourism in London and the UK: recent trends... 4 3. The LATI model: a brief
2012 In-Market Research Report. Kootenay Rockies
 2012 In-Market Research Report Kootenay Rockies Executive Summary This report summarizes key highlights for the Kootenay Rockies (KR) region taken from the British Columbia In-Market study conducted in
MRO 2017 Stakeholder Survey
 MRO 2017 Stakeholder Survey Summary Results Conducted in October 2017 MIDWEST RELIABILITY ORGANIZATION 380 St. Peter Street, Ste.800 St. Paul, MN 55102 P: 651.855.1760 F: 651.855.1712 www.midwestreliability.org