PURPOSE AND NEED REPORT. I-93 Transit Investment Study
|
|
|
- Sylvia Lillian Hunt
- 5 years ago
- Views:
Transcription


1 PURPOSE AND NEED REPORT I-93 Transit Investment Study Submitted to: The New Hampshire Department of Transportation and Massachusetts Executive Office of Transportation Submitted by: HNTB Corporation May 2007
2 New Hampshire Department of Transportation Massachusetts Executive Office of Transportation I-93 Transit Investment Study Prepared by In association with Parsons Brinckerhoff Inc. Jacobs Edwards & Kelcey Fitzgerald & Halliday, Inc. May 2007
3 Table of Contents Table of Contents... i List of Figures... ii List of Tables... iii I. Purpose and Need... 1 A. Introduction... 1 B. Project Purpose... 1 C. Project Need... 1 D. Study Goals and Objectives... 5 E. Organization of Report... 7 II. Project History and Prior Studies... 8 A. I-93 Salem to Manchester, NH Corridor Improvements... 8 B. Lowell to Nashua Commuter Rail Extension Project C. Northern New England High Speed Rail Corridor D. I-93 Corridor Study, Andover and Methuen, MA E. I-93/Junction Interchange, Andover, Wilmington, and Tewksbury, MA F. Interstate Memorandum of Agreement for Current Study III. Existing Conditions A. Population and Employment B. Existing Transportation System IV. Consistency with Long Range Plans A. Transit-Oriented Development: Consistency with Smart Growth Principles. 63 B. Transportation Needs in MA and NH Long Range Transportation Plans C. Technical Advisory Committee/Stakeholder Committee i
4 List of Figures Figure 1-Study Area... 3 Figure 2-Existing Railroad System... 9 Figure 3-Prospective Rail Corridors Figure 4-Counties and Planning Agencies Figure 5-Study Area 1980 to 2030 Population Changes Figure 6-Population Density ( ) Figure 7-Population Change (1980 to 2000) Figure 8-Existing Population (Year 2000) Figure 9-Future Population (Year 2030) Figure 10-Population (Absolute) Change (2000 to 2030) Figure 11- Population (%) Change (2000 to 2030) Figure 12-Existing Employment (Year 2000) Figure 13-Study Area 2000 to 2030 Employment Figure 14-Future Employment (Year 2030) Figure 15-Employment (Absolute) Change (2000 to 2030) Figure 16-Employment (%) Change (2000 to 2030) Figure 17-Chart of Work Trip Destinations for New Hampshire Residents Figure 18-Traffic Growth 2000 to 2025 on I-93 in Massachusetts Figure 19-Traffic Growth 1997 to 2020 on I-93 in New Hampshire Figure 20-MBTA Daily Inbound Boardings on Haverhill and Lowell Lines (1997 to 2006) Figure 21-Haverhill Line Daily Inbound Boardings by Station (1997, 2001, 2006) Figure 22-Lowell Line Daily Inbound Boardings by Station (1997, 2001, 2006) Figure 23-Daily Southbound Boardings on the Amtrak Downeaster (2005 to 2007) Figure 24-Daily Amtrak Ridership between Boston and Haverhill Figure 25-Bus Service to Boston ii
5 List of Tables Table 1-I-93 Study Area Planning Districts and Communities Table 2-Population and Employment Characteristics (1980, 2000, 2030) Table 3-Existing Conditions-Highways Table 4-Characteristics of Travel between areas within Study Corridor Table 5-Average Daily Inbound Boardings on Haverhill Line by Station (I-93 TIS Study Area) (1997 to 2006) Table 6-Average Daily Inboard Boardings on the Lowell Line by Station (I-93 TIS Study Area) (1997 to 2006) Table 7-Park and Ride Facilities in New Hampshire (I-93 Corridor) Table 8-Park and Ride Facilities in Massachusetts Table 9-Annual Ridership (One-way Passenger Trips) on Bus Commuter Routes iii
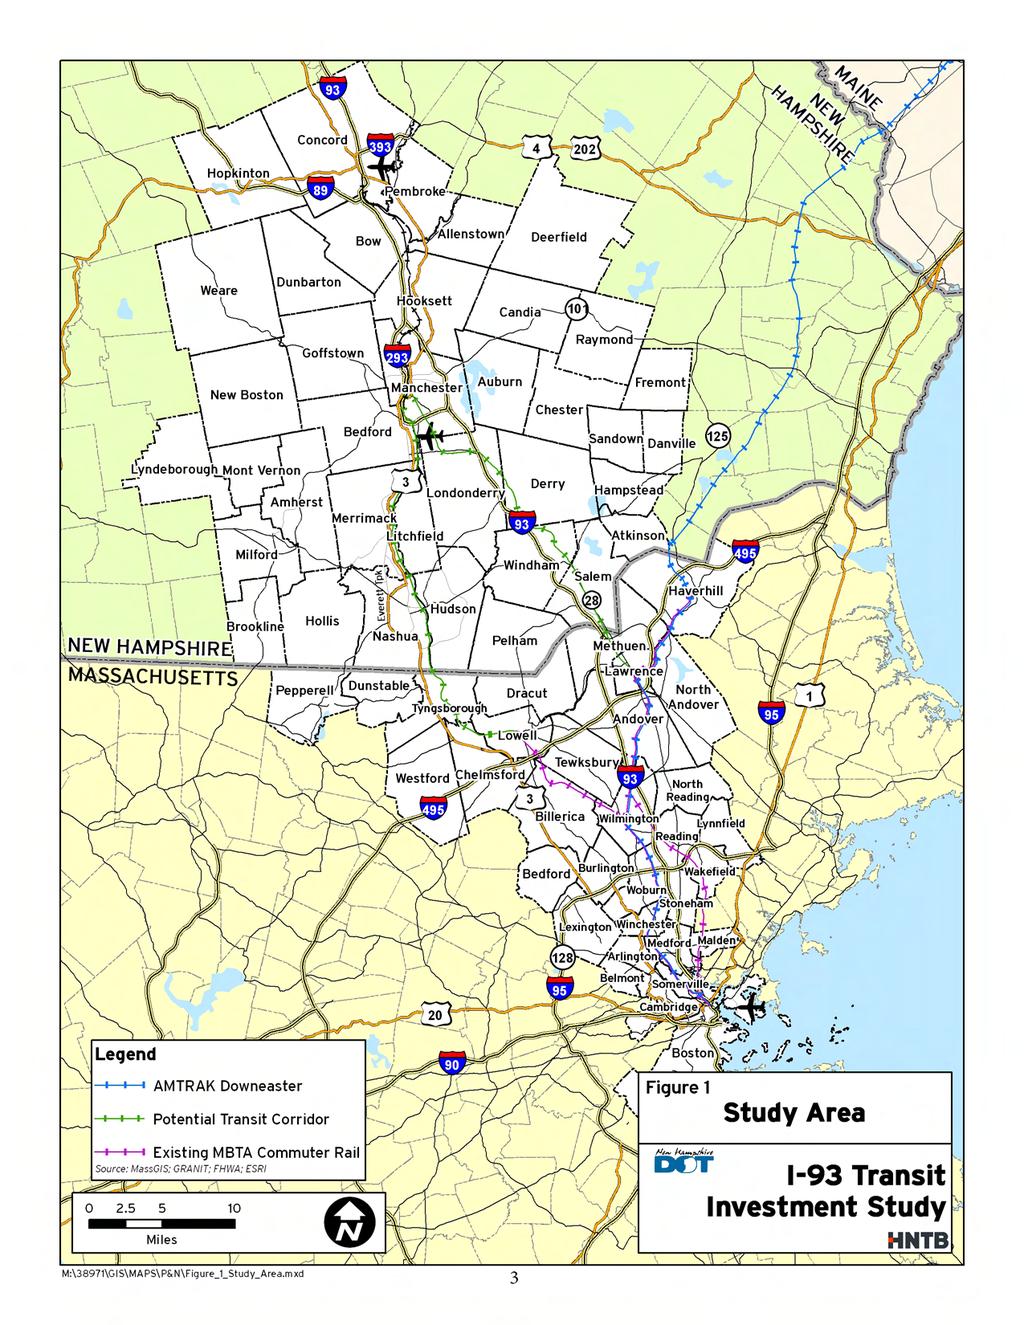
6 I. Purpose and Need A. Introduction The New Hampshire Department of Transportation (NHDOT), in consultation with the Federal Highway Administration (FHWA) and the Massachusetts Executive Office of Transportation (MA EOT), has undertaken this study of transit alternatives to address future travel demands and to identify potential and feasible transportation modal alternatives for travel between southern New Hampshire and the Greater Metropolitan Boston area, including outlying suburbs along I-93, I-495 and I-95 (Route 128). From this study, the project sponsors hope to determine future transit investments necessary to meet mobility needs within the study area and develop a strategic plan for funding and phased implementation of recommended options. B. Project Purpose The purpose of I-93 Transit Investment Study (TIS) is to identify solutions to increase mobility options for New Hampshire residents to access major employment centers within the project corridor by enhancing existing or establishing additional alternative transportation modes to the single occupant vehicle. This analysis of alternative transportation modes is being undertaken to provide travel choices for commuters and to manage congestion, improve air quality, and conserve natural resources. C. Project Need 1. Levels of roadway congestion are projected to increase along the corridor between New Hampshire and many area employment centers The need for travel choices is driven by rapidly expanding population growth in southern New Hampshire and eastern Massachusetts, areas which have experienced some of the highest growth rates of any area throughout the U.S. over the past 30 years. Travel patterns have dramatically shifted since the 1980s, as escalating housing costs in the Boston area have driven Boston workers to seek out more affordable housing outside of the Boston metropolitan area, resulting in outward migration of commercial and residential growth to the I- 95 (Route 128) and I-495 corridor communities. This has resulted in longer commuting patterns as the highest rates of population growth have spread to areas outside the urban core. At the same time, Greater Boston still dominates the economy in Massachusetts and is an important employment destination for southern New Hampshire residents. Growing employment markets in southern New Hampshire have also contributed to increased travel demands in the Merrimack 1
7 Valley regions of both states. Recreational trips to destinations (lakes and mountains) in northern New Hampshire and Vermont from Massachusetts are another major factor causing increases in north-south regional travel demands. This increased interstate travel has placed demands on the existing transportation infrastructure, resulting in proposals for highway widening, on the major north-south highways servicing the Merrimack Valley Region in southern New Hampshire and Massachusetts (Interstate 93 and U.S. Route 3/F.E. Everett Turnpike) (Figure 1). Beyond the planned capacity expansions on Interstate 93 (I-93) and recently constructed lane additions on U.S. Route 3/F.E. Everett Turnpike in New Hampshire and Massachusetts, there is very limited opportunity to address transportation needs through further expansion of the highway system. 2. Mobility Options are Limited Presently, there is no passenger rail service operating within the Merrimack Valley Region in New Hampshire. However, there are accessible regional and local bus services. Vermont Transit provides service between Manchester, NH and Boston (two southbound trips), with three additional trips from the Manchester-Boston Regional Airport. Peter Pan offers one daily roundtrip between Concord and Worcester with a stop in Manchester. Frequent weekday service is provided by Concord Trailways between Manchester and Boston with thirteen (13) southbound and sixteen (16) northbound trips. Bus service in the study area to Boston is also provided from Londonderry (Concord Trailways) via eight southbound and nine northbound trips. Nine (9) roundtrips are provided daily by Concord Trailways between the Nashua Parkand-Ride facility at Exit 8 and South Station and Logan Airport on the Boston Express. The privately operated bus services operating between New Hampshire and Boston offer only minor travel time savings since they operate in the general purpose travel lanes at the same speed as automobiles for most of the trip. Although 13% of all work trips made in NH are made to MA, the only destination district which receives a transit mode share above 3% is the inner core of Boston. This inner core area receives a transit mode share of 11% of New Hampshire residents commuting to Boston with the limited service, as noted above. This percentage indicates the importance of transit for the work link between the Boston CBD and New Hampshire. Traffic on the principal north-south arterial highways (I-93, U.S. Route 3, and F.E. Everett Highway) has dramatically increased, with growth rates of more than 50 percent since the 1980s. North of metropolitan Boston, traffic volumes recorded by MassHighway in 2005 were as high as 90,000 on U.S. Route 3, and I-93 traffic volumes ranged up to 170,000. Projections into the next 20 years indicate that this traffic will continue to grow as population expands in areas beyond the current commuting patterns. The combined impacts of longer work trip commuting and accompanying land development patterns has intensified public interest in the development of 2
8
9 alternative transportation choices as the continued growth of traffic volumes cannot continue due to physical constraints to the highway system. 3. Continued rate of growth of vehicular travel will negatively impact the study area s environment Without the infrastructure to support transit-oriented development in the study area, autooriented development will continue with its associated environmental and social impacts. The most notable impact of the existing development pattern is the increase in automobile use, continued and worsening congestion and the degradation of air quality that accompanies increased auto use. As elaborated in the June 2006 New Hampshire Long Range Transportation Plan, residents of both New Hampshire and Massachusetts are becoming more concerned with the increased consumption of land, the changes to community and downtown character and associated impacts to the natural environment, in addition to environmental impacts. A study conducted by the New Hampshire Office of State Planning, Managing Growth in New Hampshire: Changes and Challenges (December 2000) included a number of case studies in communities in New Hampshire to gain a better understanding of land development patterns in New Hampshire and to understand the regional impact of growth and development. The investigations highlighted a variety of issues among them that residential development accounts for the conversion of the largest amount of undeveloped land in the study area communities in the 18-year study period [between 1974 and 1992]. The increasing scale of subdivisions over time has increased the fragmentation of large blocks of forest land. 4. Economic Development is Constrained Roadway traffic congestion and limited mobility options pose impediments to economic development in many areas within the study area. It limits the development capacity and quality of life in developed areas and can restrain emerging areas from reaching their full potential. The Commonwealth of Massachusetts Long-Range Transportation Plan (2006) notes as an important trend: The combination of high cost of living and increasing congestion, commuting distances, and commute times is threatening Massachusetts ability to attract and retain workers The Commonwealth has experienced a net population loss in each of the last two years While there are many factors that contribute to this decline, access to good employment opportunities and reasonably priced housing are considered primary issues in this outward migration. Transportation planning and investment will have a dramatic impact on both of these. Because preserving our quality of life and economic competitiveness are mutually reinforcing goals, the planning and management of our state s infrastructure must support economic development that is sustainable. 4
10 5. Lack of implementation strategy for an integrated transportation and land use vision for the area The development of a coordinated implementation strategy for expanding transportation options is important for the future of New Hampshire businesses and residents to enhance access to jobs and reduce the growth of traffic congestion. The NHDOT within the I-93 Salem to Manchester Improvements Final Environmental Impact Statement (FEIS), April 2004, has committed to funding a five-year comprehensive Community Technical Assistance Program (CTAP) to support a region of 26 towns and cities that are in the area influenced by the planned reconstruction of Interstate 93. The CTAP Resource Book 2, Technical Assistance and Resource Identification, cites burgeoning employment growth in New Hampshire and states that: The benefit of these new jobs for New Hampshire, and specifically the I-93 corridor communities, depends in large part on the types of jobs that are created and the nature of the new development associated with the creation of these new jobs. Business development that is directed toward established city and town centers could strengthen these centers and enhance New Hampshire s traditional development patterns. Locating new businesses in existing developed areas could also curb sprawl, reduce travel demand and traffic congestion, and support development and expansion of public transportation. D. Study Goals and Objectives The I-93 TIS is the beginning of an effort to identify what should be done in the future to accommodate the travel demands of the future within the corridor between Manchester, NH and Boston, MA. This study will fit into a broader effort that will look not only at transportation but also at development, growth and environmental and community protection efforts. The specific goals of the I-93 TIS are to: Identify potential feasible opportunities, and establish funding priorities, for bi-state investments in transit (bus and rail), Develop a strategic plan for funding and phased implementation of recommended options, incorporating agency, community, and stakeholder inputs, Develop alternatives that will support Transit Oriented Development and be consistent with Smart Growth initiatives in both states. The associated objectives and potential evaluation measures are identified as follows: Accommodate Growth in Longer Distance (north-south) Travel Markets Increase Mobility Options 5
11 Increasing the mobility options in the study area should result in providing opportunities for residents of New Hampshire and Massachusetts while minimizing the impact to area roadways. This will serve to improve the efficiency and effectiveness of the region s transportation system. Measures that will be helpful in evaluating the value of potential mobility options include: o o o o o o o o Capital Cost Cost-Effectiveness Ridership User Benefits (Travel Time Savings) Mode Shift Land Use and Development Impacts Environmental Impacts Public Support Improve Economic Development Opportunities Support Regional Strategies Help Attain Regional Environmental Objectives Mobility improvements should contribute to the attainment and long-term maintenance of conformity with National Ambient Air Quality Standards. Mobility improvements should improve overall environmental conditions in the study area and minimize adverse affects. Factors to be considered in evaluating environmental impacts of alternatives include: o o o o o o o o Land Use and Zoning Vehicular Travel/Congestion Regional/Mesoscale Air Quality Noise/Vibration Historical/Archeological Resources Recreation/Parklands Water Resources and Wetlands Hazardous Materials 6
12 E. Organization of Report The following chapters describe the background and context for the I-93 TIS and address: Project History and Prior Studies, Existing Conditions (Population and Employment and Transportation systems), and Consistency with New Hampshire and Massachusetts Long Range Plans. 7
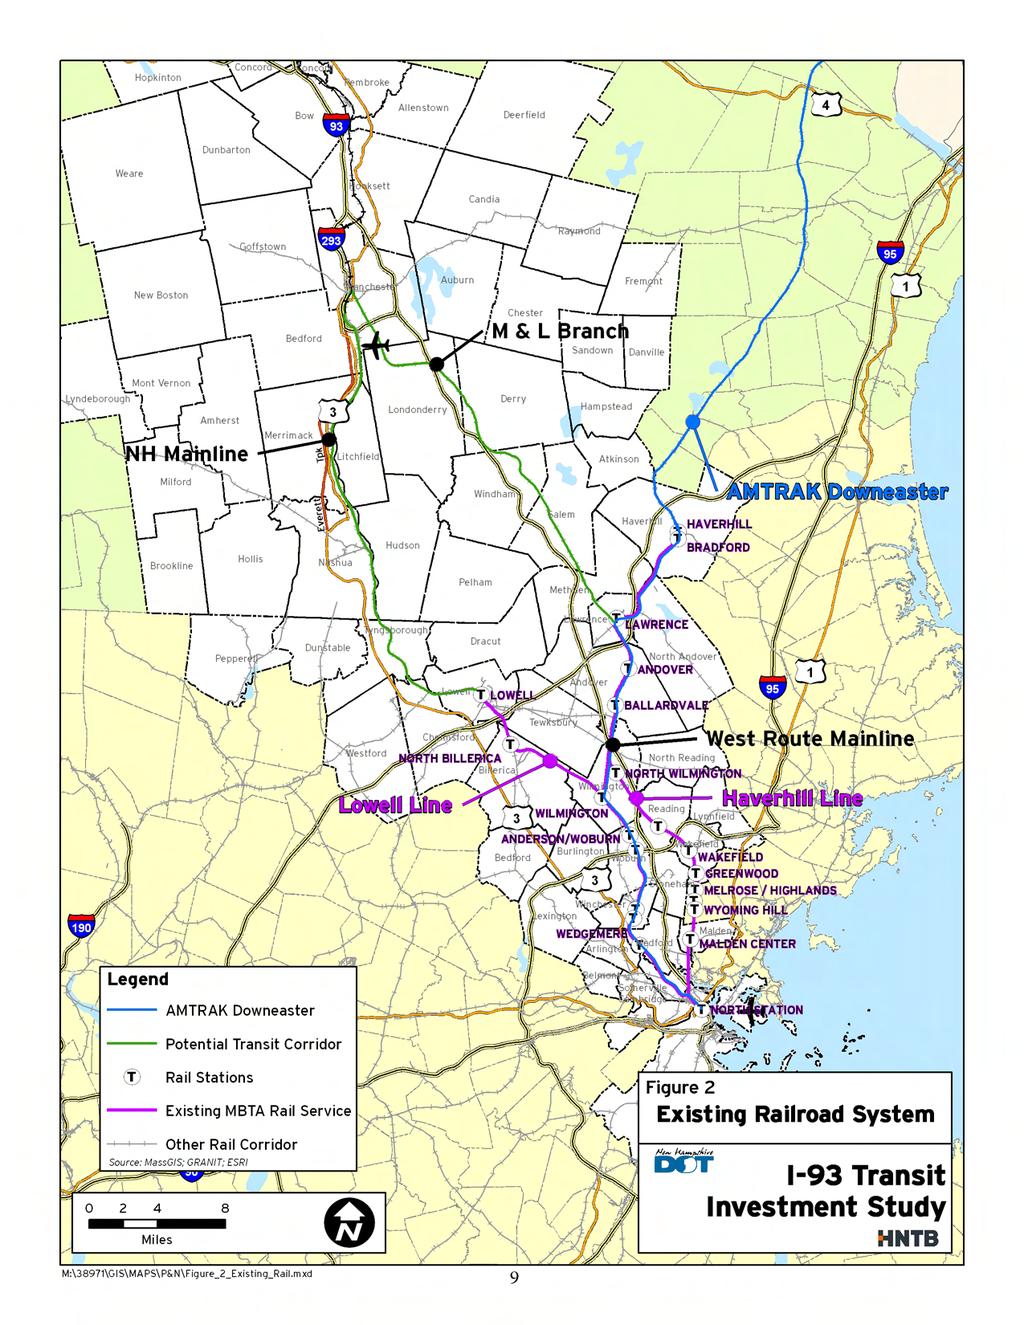
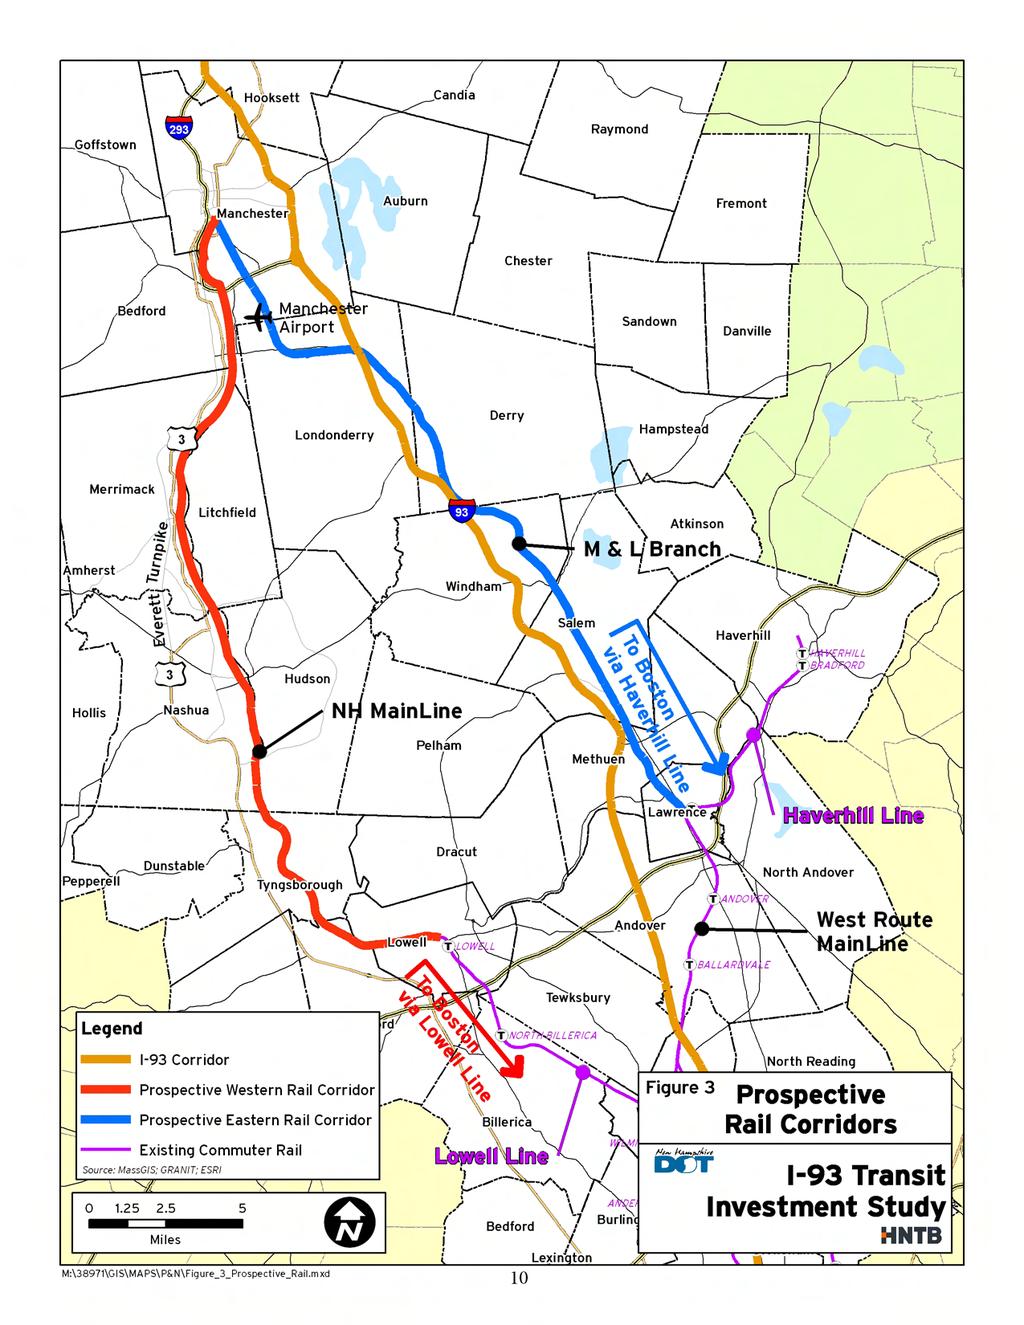
13 II. Project History and Prior Studies A. I-93 Salem to Manchester, NH Corridor Improvements The need for the current study was identified in addressing travel demands along the section of I-93 that extends north of the border with Massachusetts at Salem, New Hampshire to Manchester, New Hampshire. This roughly 20-mile section of I-93 is the focus of transportation improvements planned to be undertaken by the New Hampshire Department of Transportation. The proposed I-93 improvements include widening this section of the major north-south interstate highway to four travel lanes in each direction from its current configuration of two lanes in each direction. The need to address transit improvements became apparent during preparation of the Final Environmental Impact Statement (FEIS) for the I-93 Corridor Improvements. The April 2004 FEIS considered an array of alternatives that included Transportation Demand Management measures and modal alternatives, including a Passenger Rail Service alternative and a Bus Service alternative. During the FEIS preparation and review, a separate bi-state study of future transit investments, separate from the proposal for road-based improvements, was requested by the U.S. Environmental Protection Agency. The rail alternatives considered as part of the I-93 FEIS included four rail alternatives along three basic rail alignments. These rail alternatives were designed to provide commuter rail service to Boston from Manchester to provide some measure of traffic relief within the I-93 highway corridor during peak travel periods. Alternatives that were identified included alignments following two rail corridors that were once part of the former Boston and Maine (B&M) Railroad s system. These rail corridors extended from Manchester, New Hampshire to Lowell, Massachusetts (West Rail Corridor) and to Lawrence, Massachusetts (East Rail Corridor) (Figure 2). In addition to evaluating service along these existing rail corridors, options to introduce new services along the existing I-93 highway corridor were also considered (Figure 3). The major mode alternatives that were evaluated as part of the I-93 Improvements project included: West Rail Corridor from Manchester, New Hampshire via Nashua to Lowell, Massachusetts: Commuter rail service along the New Hampshire Main Line would include Phase 1 (service between Nashua and Lowell), which is currently in preliminary planning. Phase 2 was considered as a mode alternative for the I-93 corridor and would extend service from Nashua 19 miles north to Manchester. This line would operate as a 31-mile extension of the Massachusetts Bay Transportation Authority (MBTA) Lowell Line, which extends 25 miles from Boston to Lowell. This railroad alignment extends along the west side of the Merrimack River parallel to U.S. Route 3 and the F.E. Everett Turnpike 8
14
15
16 (which splits from U.S. Route 3 north of Nashua, New Hampshire) thence crossing the river just south of Manchester, and would primarily serve as an alternative for commuters within the F.E. Everett Turnpike and U.S. Route 3 corridors. East Rail Corridor from Manchester, NH to Lawrence, MA: Commuter rail service along 28 miles of the Manchester & Lawrence (M&L) Branch, with two variations near the Manchester-Boston Regional Airport, would connect to the MBTA Haverhill Line in Lawrence. The Haverhill Line in Massachusetts operates predominantly along 32.9 miles of the West Route Main Line (WRML) tracks extending from North Station in Boston to downtown Haverhill. The line continues north into New Hampshire and Maine and is the route used by Amtrak s Downeaster passenger service between Boston and Portland, Maine. The route is also used by Pan Am Railways (successor to B&M) for freight service. The Haverhill Line includes a section of single track (13.9 miles) between Lawrence and Reading. Another 3.9-mile single-track section extends between the Boston/Somerville Line and Melrose. A constraint to the use of the M&L branch line is that the right-of-way is not exclusively stateowned in New Hampshire. Other public owners of the right-of-way are the Manchester Airport Authority and the Town of Derry. Private interests own portions of the right-of-way in Derry and Londonderry. In Massachusetts, the MBTA owns the right-of-way. Another constraint is that the track structure is in poor condition or non-existent, and new structures (bridges) would be required. A segment of the right-of-way in Manchester has been paved as a walkway and bikeway. A four-mile segment is paved within the town of Windham and is a popular bikeway and walking path. The route is also part of the recommended alternative for the Salem to Concord regional bikeway plan. An advantage of the East Rail Corridor is that it closely parallels I-93, and therefore would provide an alternative mode of transportation for I-93 corridor commuters. I-93 Rail Corridor: Two options for a new light rail service operating within the I-93 highway right-of-way were considered: a Basic and Enhanced Rail Corridor. The Enhanced Rail Corridor would continue service north to the Manchester-Regional Boston Airport. Both rail corridors would involve a connection to the M&L Branch three miles to the south near Exit 5 in Londonderry and light rail service continuing south along I-93 to the Massachusetts state line. The Basic Rail Corridor would extend 23 miles between Londonderry and Lawrence. Over the state line, the Basic Rail Corridor Option would connect to the M&L Branch right-of-way continuing to Lawrence, Massachusetts (Haverhill Line). The Enhanced Rail Corridor would deviate from this alignment in Massachusetts and would continue within the I-95 right-of-way 20 miles south to the Anderson Regional Transportation Center (Lowell Line) in Woburn. The proposed I-93 improvements included accommodating space within the reconstructed highway corridor for potential future rail or other mass transit opportunities. This reserved area within the I-93 right-of-way could accommodate a potential light rail line, but could alternatively provide for high occupancy vehicle (HOV) usage or bus rapid transit. 11
17 Bus Service: An expansion of the private commuter bus service, operating from Manchester and Londonderry to Boston, was considered. Since bus service was operating only at Exit 4 in Londonderry, the I-93 improvements included expanding service to serve Exit 5 in Londonderry, Exit 3 in Windham, and Exit 2 in Salem. I-93 improvements included providing park and ride facilities at each interchange with bus terminal facilities to facilitate ride-sharing and bus transit usage. An enhanced ride-sharing program, with a commuter incentive program, was also considered. The mode alternatives in the I-93 Improvements FEIS were considered to provide additional commuting options in the Merrimack Valley region in New Hampshire and Massachusetts. Analysis of alternatives undertaken for the I-93 improvements demonstrated that a passenger rail service would not divert sufficient vehicle trips from I-93 to make a marked improvement in I-93 traffic operations. The mode alternatives studied were intended to provide transportation enhancements that would supplement the highway system, rather than supplant the need for highway improvements. This was formally recognized by the resource and environmental agencies in a Memorandum of Agreement (MOA) that was signed in September 2001 that established the reasonable range of alternatives to be considered in the FEIS. In this agreement, the U.S. Environmental Protection Agency, the U.S. Army Corps of Engineers, the U.S. Fish and Wildlife Service, the New Hampshire Department of Environmental Services, the New Hampshire Fish and Game Department, the New Hampshire Division of Historical Resources, the FTA, and the FHWA and NH DOT acknowledged that future initiatives to address transportation needs in the broader I-93 corridor (Greater Boston Metropolitan Area to Manchester, NH) would likely not involve further widening but rather some type of transit investment. The parties concurred that regional transit initiatives would be studied further in a separate study specific to transit conducted in partnership with the Commonwealth of Massachusetts. The bus transit options identified in the FEIS were to be implemented in conjunction with the highway improvements identified. The preliminary passenger rail options identified were to undergo further evaluation as part of the current I-93 TIS. Although the genesis of this transit investment study arose as part of the NHDOT I-93 Corridor Study, it was recognized that a larger study of regional mobility options not only within the New Hampshire I-93 corridor, but within the entire southern New Hampshire Merrimack Valley Region and extending into Massachusetts, was required. This separate TIS, being undertaken in partnership with Massachusetts, is assessing potential regional transit opportunities and seeking to identify cross-border priorities for future investments that will be required to meet the long-term mobility needs in the region. B. Lowell to Nashua Commuter Rail Extension Project Implementation of rail service along the West Rail Corridor is being actively pursued by the Nashua Regional Planning Commission (NRPC), in partnership with the State of New Hampshire, the Federal Transit Administration (FTA), City of Nashua, the MBTA, and the 12
18 railroad owners and operators, as part of the Nashua to Lowell Commuter Rail Extension Project. NRPC is considering a phased approach for this project. Phase 1 of the project involves extending commuter rail service to Nashua (Phase 1) from Lowell and would represent the first step in initiating regional passenger service between Massachusetts and southern New Hampshire. This passenger service was originally evaluated in the Major Investment Study for Nashua Passenger Rail Service (MIS). Phase 2 would consider extending service 19 miles north from Nashua to Manchester. NHDOT submitted the final version of the MIS to the FTA in the fall of The New Hampshire congressional delegation notified the NRPC in November 1999 that $1 million of a requested earmark of $16 million was available to initiate the environmental reviews and preliminary design. In March 2000, the state s Congestion Mitigation and Air Quality Advisory Committee approved a request for $12 million for purchasing coaches and locomotives for use on the project. The MIS study for this project was used as the basis for the West Rail Corridor alternative evaluated in the I-93 Improvements FEIS. In June 2006, Governor Lynch convened a group of stakeholders to discuss the issues surrounding the reintroduction of passenger rail in southern New Hampshire. The stakeholders included, but were not limited to, the Governor, Pan Am Railway, representatives from the Nashua and Southern New Hampshire Regional Planning Commissions, the cities of Nashua and Manchester, the Manchester-Boston Regional Airport, and the Greater Nashua Chamber of Commerce. As a result, a small task force created a Southern New Hampshire Passenger Rail Proposal. Pan Am Railways would be the operator for the rail proposal with a proposed $113.6 million in funding from committed Congestion Mitigation Air Quality Funds ($21.5 million), committed Federal New Starts Funds ($4.3 million), new federal earmark ($65.1 million), and a match of $22.7 million of local contributions to station development. Currently, the task force is working through the various issues and tasks necessary to implement the service. C. Northern New England High Speed Rail Corridor The Northern New England High Speed Rail Corridor has been designated by the U.S. Secretary of Transportation. This federal designation allows states through which the high speed rail corridor passes to receive earmarked funds for study, design, and construction and allows funding for highway/rail grade crossing safety improvements. The Northern New England High Speed Rail Corridor has two branches in New England. The eastern branch extends between a hub in Boston and Portland, Maine terminating in Auburn, Maine. The western branch connects Boston and Montreal, Quebec, extending through Concord, New Hampshire and Montepelier, Vermont. 13
19 The Boston to Montreal High-Speed Rail Planning and Feasibility Study, Phase I Final Report, prepared by the Vermont Department of Transportation, was completed in April The report concluded that projected fare revenue and ridership is sufficient to warrant further study and implementation of Phase II evaluations. The study indicated that implementation of high speed rail would require substantial rail infrastructure improvements that would be compatible with existing and future passenger and freight rail operations. The potential rail corridor identified for further study follows the West Rail Corridor that extends from Manchester through Nashua and Lowell to Boston. D. I-93 Corridor Study, Andover and Methuen, MA In addition to these prior studies performed by NHDOT, the Merrimack Valley Planning Commission has also evaluated improvements to a roughly 10-mile section of I-93 extending south from New Hampshire to Methuen and Andover. The study area focuses on the section of I-93 that consists of three travel lanes in each direction and continues as a six-lane highway to the New Hampshire border. The southern limit of the study occurs at the neckdown from four to three lanes in each direction. In the spring of 1999, Massachusetts Highway Department initiated use of the breakdown lanes for general travel in this highway segment during morning (6 a.m. to 10 a.m.) and evening (3 p.m. to 7 p.m.) peak periods, as an interim measure to relieve severe congestion that occurs along this divided highway. The I-93 Corridor Traffic Study, Andover and Methuen, Massachusetts considered a range of alternatives, including widening I-93 from three to four lanes in each direction. The study also included evaluation of interchange and intersection improvements, including a potential new interchange at Lowell Junction between Exits 41 and 42, as described in the following section. Experimental bus improvements were also to be implemented in and along the I-93 corridor as part of the project. The study recommended experimenting with adding service in various new areas to determine if a market exists. The study also recommended further evaluation of the potential for valet parking to increase parking capacity at rail stations. Other options involving shuttle services (commuter rail or bus) to the Anderson Regional Transportation Center, connecting to the Lowell Line, were determined to not be viable alternatives, since ample parking was available at the center. It was recommended that parking conditions at the Anderson Regional Transportation Center be monitored, and these alternatives reconsidered in the event that parking becomes constrained in the future. The study included the recommendation that improvements be made to the Haverhill Line (through double tracking) to accommodate increased commuter rail service. The study identified other potential passenger rail alternatives in Massachusetts (including commuter rail or light rail service operating along the M&L Branch, commuter rail through service between Manchester and Boston via the Haverhill Line, and light rail service along I-93) that would require coordination with New Hampshire for implementation. The study also calls for a cooperative study by New 14
20 Hampshire and Massachusetts to consider options for regional rail service between Boston and Manchester. E. I-93/Junction Interchange, Andover, Wilmington, and Tewksbury, MA The I-93 Corridor Traffic Study, Andover and Methuen, Massachusetts recommended further consideration of a potential new interchange on I-93 in the Lowell Junction area, between Route 125 in Wilmington (Exit 41) and Dascomb Road in Andover (Exit 42). This area includes landlocked parcels and is viewed as having substantial economic development potential, since it currently hosts a number of large area businesses and is a major employment center. These transportation improvements are consistent with plans for expansion by existing large area employers and other private development proposals, which are currently impeded by the lack of direct access to I-93 and recurring traffic congestion. Lack of direct access from I-93 to businesses in the Lowell Junction area contributes to congestion at adjoining interchanges, leading local residents to file suit to stop further development that would increase employment in the area. The I-93/Lowell Junction Interchange Justification Study is being undertaken as a separate project by the Merrimack Valley Planning Commission, in collaboration with the three communities of Andover, Tewksbury, and Wilmington. This interchange justification study was completed in 2006 and was submitted by the Massachusetts Executive Office of Transportation to the Federal Highway Administration for review and approval. In addition, officials from Andover, Wilmington and Tewksbury are now cooperating to identify a shared development strategy for the area. Plans for The Junction Project are outlined in The Junction/Route 93 Development Area: Our Opportunity for Smart Growth and Regional Economic Development in the Merrimack Valley and Northeast Massachusetts prepared by the Merrimack Valley Economic Development Council. The development envisioned for the area includes a new multi-modal transit center to be located adjacent to the Haverhill Line, with access to be provided by the new I-93 Interchange. F. Interstate Memorandum of Agreement for Current Study In March 2005, a Memorandum of Agreement (MOA) between the NHDOT and the MA EOT was executed. In the MOA, the agencies agreed to jointly undertake a Transit Investment Study of the Boston to Manchester leg of the I-93 corridor. The study was viewed by both states as an opportunity to jointly address Massachusetts and New Hampshire regional transportation issues. 15
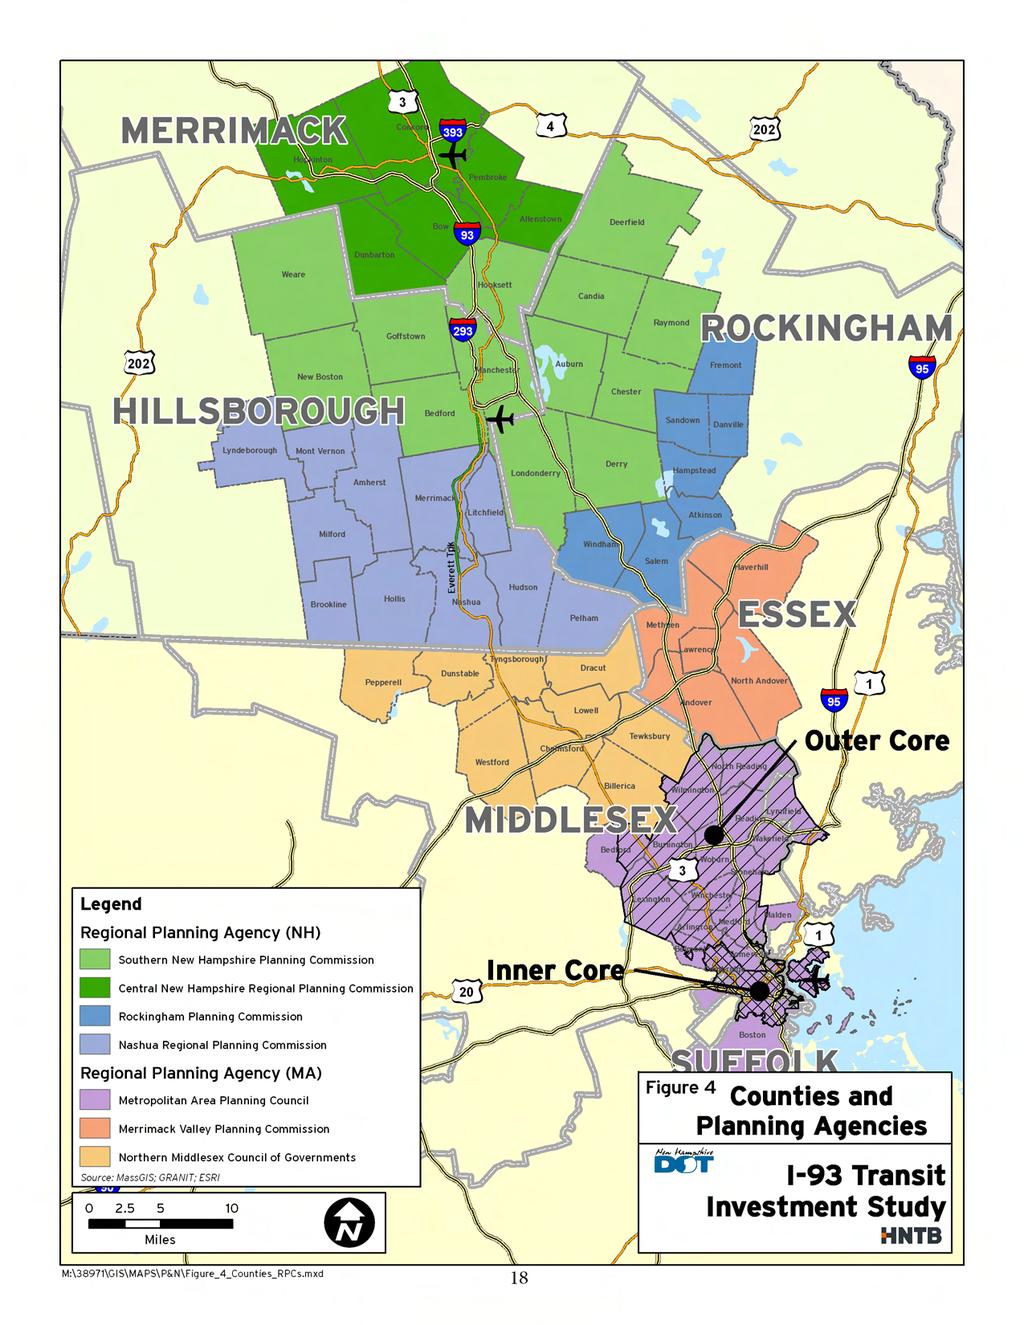
21 III. Existing Conditions A. Population and Employment The potential market area, and study area, for the I-93 TIS was defined to include 38 communities within Hillsborough (Manchester area), Rockingham, and Merrimack Counties in southern New Hampshire and 32 communities within Essex, Middlesex, and Suffolk Counties in Massachusetts. The study area includes regions that are covered by four regional planning commissions in New Hampshire and three regional planning commissions in Massachusetts (Figure 4 and Table 1). These include, on the north, the Central New Hampshire Regional Planning Commission Concord District in Table 1) and the Southern New Hampshire Planning Commission (Southern District in Table 1). In southern New Hampshire, the Nashua Regional Planning Commission (Nashua District) borders Massachusetts on the west and the Rockingham Planning Commission (Rockingham District) extends along the state border on the east. In northern Massachusetts, the Northern Middlesex Council of Governments (Northern Middlesex District), on the west, and the Merrimack Valley Planning Commission (Merrimack Valley District), on the east, cover the areas outside of the Metropolitan Area Planning Council (MAPC) region. The MAPC region covers the inner core and outer core areas of Boston (Figure 4 and Table 1). Table 1-I-93 Study Area Planning Districts and Communities New Hampshire Concord District Cities and Towns Allenstown Dunbarton Bow Hopkington Concord Pembroke Nashua District Cities and Towns Amherst Lyndeborough Brookline Merrimack Hollis Milford Hudson Mount Vernon Nashua Pelham Litchfield Rockingham District Cities and Towns Atkinson Salem Danville Sandown Fremont Windham Hampstead 16
22 Table 1-I-93 Study Area Planning Districts and Communities Southern District Cities and Towns Auburn Hooksett Bedford Londonderry Candia Manchester Chester New Boston Deerfield Raymond Derry Weare Goffstown Massachusetts Boston Inner Core Cities and Towns Boston Cambridge Boston Outer Core Cities and Towns Arlington North Reading Bedford Reading Belmont Somerville Burlington Stoneham Lexington Wakefield Lynnfield Wilmington Malden Winchester Medford Woburn Northern Middlesex District Cities and Towns Billerica Pepperell Chelmsford Tewksbury Dracut Tyngsborough Dunstable Westford Lowell Merrimack Valley District Cities and Towns Andover Methuen Haverhill North Andover Lawrence 1. Population Trends Population densities in the study area are highest within the Boston metropolitan area, as shown in Figure 6. Population changes from 1980, 2000, and 2030 for the study area communities in Massachusetts and New Hampshire are shown in Table 2 and Figures 5, 7, 8, 9, 10, and 11. Between 1980 and 2000, the study area communities in Massachusetts added roughly 120,000 residents, or about 6,000 per year (Figure 5). Over the same time period, New Hampshire study area communities added about 176,000 residents, or approximately 8,800 per year (Figure 5). 17
23
24 Table 2-Population and Employment Characteristics (1980, 2000, 2030) LOCATION POPULATION EMPLOYMENT CITY/TOWN STATE to 2030 Change Total % to 2030 Change Total % Andover MA 26,370 31,972 37,360 5,388 17% 34,501 39,385 4,884 14% Arlington MA 48,219 42,391 44,164 1,773 4% 8,545 8, % Bedford MA 13,067 12,597 13,864 1,267 10% 21,971 24,995 3,024 14% Belmont MA 26,100 24,194 25,750 1,556 6% 6,252 6, % Billerica MA 36,727 38,978 43,863 4,885 13% 25,750 30,585 4,835 19% Boston MA 562, , ,315 38,957 7% 559, ,971 50,550 9% Burlington MA 23,486 22,876 24,720 1,844 8% 38,178 43,900 5,722 15% Cambridge MA 95, , ,225 14,575 14% 110, ,143 9,437 9% Chelmsford MA 31,174 33,615 36,317 2,702 8% 22,000 25,761 3,761 17% Dracut MA 21,249 28,564 33,201 4,637 16% 4,705 5, % Dunstable MA 1,671 2,829 3, % % Haverhill MA 46,865 58,968 66,278 7,310 12% 19,223 19, % Lawrence MA 63,175 72,043 78,429 6,386 9% 23,304 19,791-3,513-15% Lexington MA 29,479 30,356 33,263 2,907 10% 21,210 23,712 2,502 12% Lowell MA 92, , ,703 9,534 9% 34,652 33,367-1,285-4% Lynnfield MA 11,267 11,542 12, % 4,786 6,162 1,376 29% Malden MA 53,386 56,300 61,934 5,634 10% 17,366 16, % Medford MA 58,076 55,809 57,675 1,866 3% 19,722 20,931 1,209 6% Methuen MA 36,701 43,790 48,752 4,962 11% 13,717 15,924 2,207 16% North Andover MA 20,129 26,477 31,213 4,736 18% 19,017 20,495 1,478 8% North Reading MA 11,455 13,837 13, % 7,019 7, % Pepperell MA 8,061 11,142 13,064 1,922 17% 1,492 1, % Reading MA 22,678 23,708 26,731 3,023 13% 7,252 8, % Somerville MA 77,372 77,494 79,870 2,376 3% 21,613 25,826 4,213 19% Stoneham MA 21,424 22,218 25,188 2,970 13% 7,722 8, % Tewksbury MA 24,635 28,851 32,125 3,274 11% 17,234 20,661 3,427 20% Tyngsborough MA 5,683 11,081 13,742 2,661 24% 4,056 4, % Wakefield MA 24,895 24,802 27,616 2,814 11% 14,968 15, % Westford MA 13,434 20,754 24,232 3,478 17% 11,052 12,723 1,671 15% Wilmington MA 17,471 21,363 25,367 4,004 19% 21,060 24,664 3,604 17% Winchester MA 20,701 20,808 21,822 1,014 5% 7,302 7, % Woburn MA 36,626 37,258 40,014 2,756 7% 40,591 48,070 7,479 18% Sources: 1980 and 2000 Census, New Hampshire Department of Transportation (2030 NH data), Central Transportation Planning Staff (CTPS) (2030 MA data). 19
25 Table 2-Population and Employment Characteristics (1980, 2000, 2030) LOCATION POPULATION EMPLOYMENT CITY/TOWN STATE to 2030 Change to 2030 Change Total % Total % Allenstown NH 4,398 4,539 6,133 1,594 35% 1,235 1, % Amherst NH 8,243 10,735 14,928 4,193 39% 4,304 5, % Atkinson NH 4,397 6,185 8,433 2,248 36% 745 1, % Auburn NH 2,883 4,688 6,481 1,793 38% 874 1, % Bedford NH 9,481 19,194 26,514 7,320 38% 11,516 17,974 6,458 56% Bow NH 4,015 6,564 11,337 4,773 73% 5,234 7,671 2,437 47% Brookline NH 1,766 4,318 6,675 2,357 55% % Candia NH 2,989 3,865 5,197 1,332 34% % Chester NH 2,006 4,225 5,982 1,757 42% % Concord NH 30,400 39,993 53,527 13,534 34% 43,694 64,032 20,338 47% Danville NH 1,318 4,077 5,741 1,664 41% % Deerfield NH 1,979 3,678 5,410 1,732 47% % Derry NH 18,875 32,885 42,114 9,229 28% 7,754 12,254 4,500 58% Dunbarton NH 1,174 2,438 3,681 1,243 51% % Fremont NH 1,333 3,606 5,182 1,576 44% % Goffstown NH 11,315 16,558 23,400 6,842 41% 3,722 5,817 2,095 56% Hampstead NH 3,785 8,035 11,445 3,410 42% 2,225 3,521 1,296 58% Hollis NH 4,679 7,082 10,378 3,296 47% 2,670 3, % Hooksett NH 7,303 12,268 19,571 7,303 60% 6,343 10,028 3,685 58% Hopkinton NH 3,861 4,988 7,004 2,016 40% 1,839 2, % Hudson NH 14,022 22,753 32,656 9,903 44% 11,532 15,433 3,901 34% Litchfield NH 4,150 7,600 12,811 5,211 69% 590 1, % Londonderry NH 13,598 23,004 32,593 9,589 42% 7,192 11,369 4,177 58% Lyndeborough NH 1,070 1,636 2, % % Manchester NH 90, , ,601 23,394 23% 63,626 99,342 35,716 56% Merrimack NH 15,406 25,037 36,051 11,014 44% 12,262 22,091 9,829 80% Milford NH 8,685 13,647 19,230 5,583 41% 6,776 8,208 1,432 21% Mont Vernon NH 1,444 2,145 2, % % Nashua NH 67,865 82,049 99,602 17,553 21% 53,692 69,856 16,164 30% New Boston NH 1,928 4,475 6,496 2,021 45% % Pelham NH 8,090 11,890 22,727 10,837 91% 1,985 2, % Pembroke NH 4,861 6,347 8,996 2,649 42% 2,043 2, % Raymond NH 5,453 9,625 13,120 3,495 36% 2,853 4,508 1,655 58% Salem NH 24,124 27,275 35,567 8,292 30% 20,864 32,984 12,120 58% Sandown NH 2,057 5,233 7,466 2,233 43% % Weare NH 3,232 7,776 11,845 4,069 52% 1,309 1, % Windham NH 5,664 11,409 15,970 4,561 40% 2,129 3,365 1,236 58% Sources: 1980 and 2000 Census, New Hampshire Department of Transportation (2030 NH data), Central Transportation Planning Staff (CTPS) (2030 MA data). 20
26 Study Area 1980 to 2030 Population Changes Population Levels Millions MA NH MA NH MA NH 1980 Population 2000 Population 2030 Population Study Area Population Characteristics Figure 5-Study Area 1980 to 2030 Population Changes Sources: 1980 and 2000 Census, New Hampshire Department of Transportation (2030 NH data), Central Transportation Planning Staff (CTPS) (2030 MA data). Between 1980 and 2030, population increased by roughly 18% in Massachusetts and by approximately 92% in New Hampshire. The largest historic population increases occurred in the Boston Central Business District, in other more urbanized areas, or in outlying areas with large areas of undeveloped lands. In Massachusetts, the greatest population increases between 1980 and 2000 occurred in Boston (29,364), Haverhill (12,103), Lawrence (8,868), Dracut (7,315), Methuen (7,089), and Westford (7,320). In New Hampshire, the highest population increases between 1980 and 2000 occurred in Nashua (18,740), Manchester (16,070), Derry, (15,146), and Concord (10,287). Most of these communities with the highest population gains are located along the I-93 or U.S. Route 3 and/or F.E. Everett Turnpike corridors. Massachusetts study area communities are expected to add roughly 153,000 new residents between 2000 and 2030, or about 5,000 new residents per year (Figures 5, 10, and 11). New Hampshire study area communities are expected to add approximately 200,000 new residents over the same time period, or roughly 6,700 new residents per year. By 2030, total population is expected to increase by roughly 9% in Massachusetts and by approximately 36% in New Hampshire. 21
27
28
29
30
31
32
33 The largest population increases from 2000 to 2030 in Massachusetts are expected to occur in Boston (38,957), Cambridge (14,575), Lowell (9.534), Lawrence (6,386), and Andover (5,388). In New Hampshire, the largest population increases are expected to occur in Manchester (23,394), Nashua (17,553), Concord (13,534), Merrimack (11,014), and Londonderry (9,589). As with historic population gains, the highest population gains are expected to occur in the Boston Central Business District or communities along the I-93 and U.S. Route 3 corridors. According to Vital Signs 2006: Economic and Social Indicators for New Hampshire, (January 2006), prepared by the New Hampshire Economic and Labor Market Information Bureau, the majority of people relocating into New Hampshire come from Massachusetts. From 2000 to 2003, Rockingham County accommodated 7,300 new residents, Merrimack County accommodated 5,300 new residents, and Hillsborough County accommodated 2,400 new residents from Massachusetts. According to a study done by Mass Inc., in December 2003 only about 28 percent of new residents kept their jobs in Massachusetts. The majority found new jobs in New Hampshire and relocated due to the high cost of living. 2. Employment Trends Year 2000 employment levels were highest in urbanized areas of Boston and outlying Massachusetts communities (Figure 12). In Massachusetts, eastern Massachusetts dominates the state s economy and employment. In New Hampshire, concentrated areas of employment occur in urban centers of Nashua, Manchester, and Concord, which, combined, provided over 170,000 jobs in Employment growth figures within New Hampshire were cited in the growth management planning booklet, CTAP Resource Book 2, Technical Assistance and Resource Identification, developed by NHDOT for I-93 communities. Over the past ten years, New Hampshire has, on average, added about 10,000 jobs per year. The Commonwealth of Massachusetts Long-Range Transportation Plan (2006) cites job growth over the last decade that has increased by roughly 34,000 jobs per year. The Long Range Plan cites forecasted employment that is expected to grow by 13,000 jobs per year, or 9.5 percent, from The plan notes that the state has lost 4.3 percent of its jobs between 2000 and 2004 as reported by the Massachusetts Department of Labor and Workforce Development (from 3,245,653 to 3,106,680), but that, with an improving economy, job growth is expected to resume, but at a reduced rate from previous decades. The plan states that growth in the resident labor force after 2010 will be minimal, and notes that an increase in the net number of out-of-state commuters will be expected to provide some of the labor force growth. The Massachusetts Long-Range Transportation Plan states that employment sites are expected to remain concentrated in areas surrounding metropolitan Boston, with new employment centers extending along the major transportation corridors leading into New Hampshire and Rhode Island. 28
34
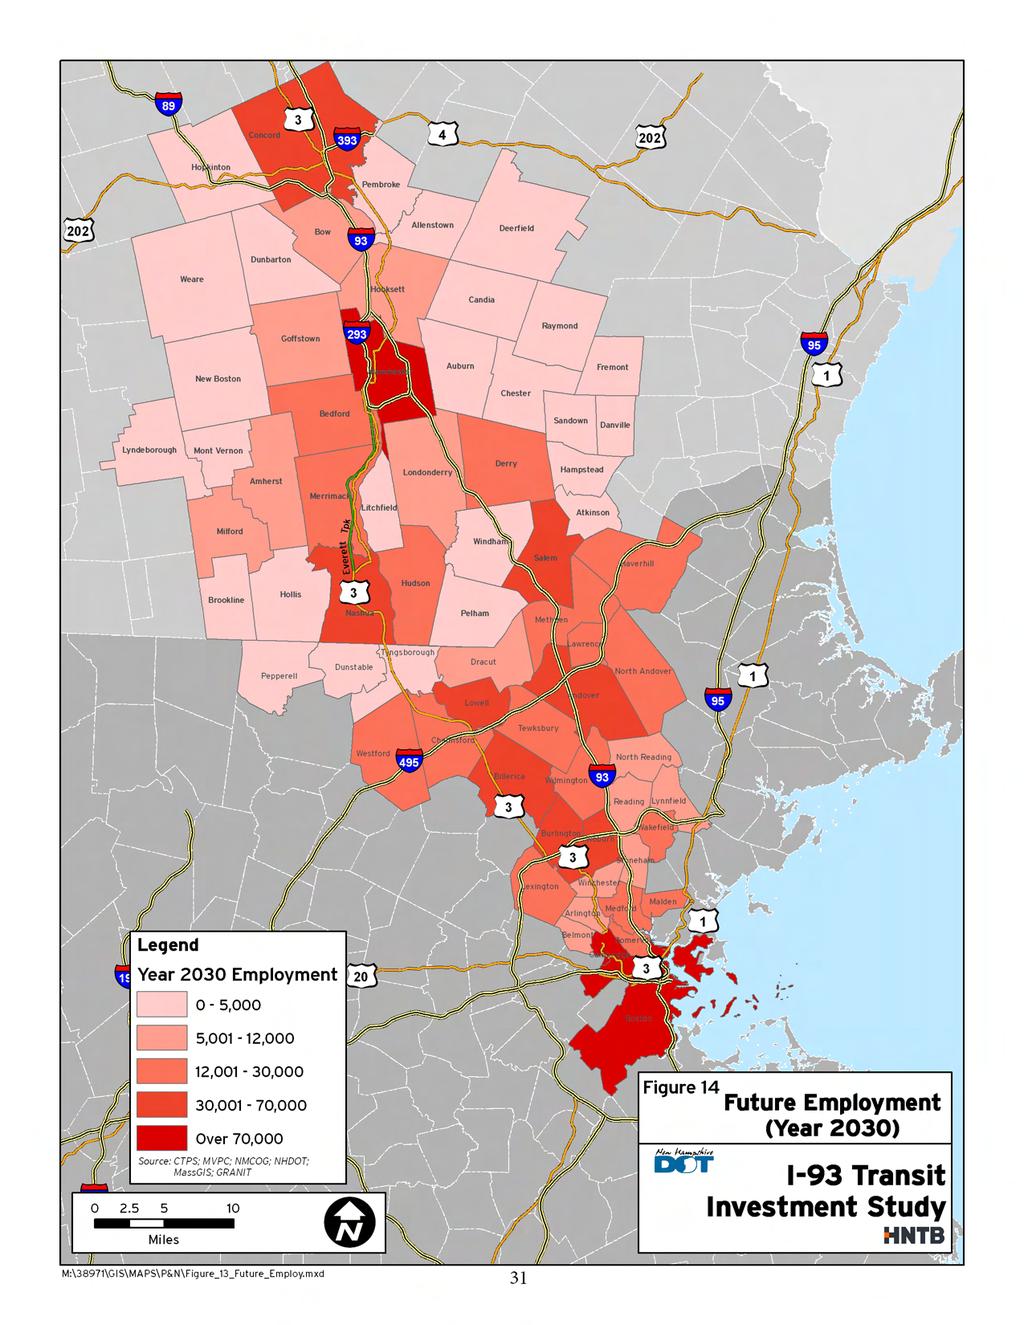
35 Massachusetts study area communities are expected to add roughly 111,000 jobs by 2030, or approximately 3,700 jobs a year (Figures 13, 14, 15, and 16). This compares to approximately 135,000 new jobs created in New Hampshire study area communities over the same time period, or roughly 4,500 jobs a year. These represent employment increases of about 10% in Massachusetts study area communities and 48% in New Hampshire study area communities. Study Area 2000 to 2030 Employment Changes Employment Levels Millions MA NH MA NH 2000 Employment 2030 Employment Study Area Characteristics Figure 13-Study Area 2000 to 2030 Employment The highest employment increases in Massachusetts are expected to occur in Boston (50,550), Cambridge (9,437), Woburn (7,479), Burlington (5,722), Andover (4,884), and Billerica (4,835). In New Hampshire, the highest employment increases are expected to occur in Manchester (35,716), Concord (20,338), Nashua (16,164), and Salem (12,120). Again, those communities with the highest projected employment increases are the Boston Central Business District or are communities predominantly located along the I-93 or U.S. Route 3/F.E. Everett Turnpike corridors. According to the New Hampshire Economic and Labor Information Bureau, Rockingham County is projected to be one of the fastest-growing counties in terms of new jobs over the next decade. Employment growth in Hillsborough County is projected to be the fourth highest of all ten counties in New Hampshire. Employment growth in Merrimack County is expected to be close to that for the state as a whole. 30
36
37
38
39 Journey to work statistics indicate that commute trips are getting longer as workers move further away from job centers. Another factor is that jobs are no longer clustered in core urban areas, but continue to be dispersed throughout the region, as shown in Figure 17. Table 1 shows the communities within each of the regional planning areas shown in the figure. Destinations of New Hampshire Residents Number of Trips 120, ,000 80,000 60,000 40,000 20, ,899 9,790 12,994 12,365 74,022 15,394 95,910 26,999 34,979 INNER CORE OUTER CORE NMCOG MVPC NRPC RPC SNHPC CNHRPC OTHER Massachusetts Destination New Hampshire Figure 17-Chart of Work Trip Destinations for New Hampshire Residents B. Existing Transportation System 1. Existing Highway Network Principal north-south highways in the study area are I-93 and U.S. Route 3 and the F. E. Everett Turnpike. I-93 was constructed in the early 1960s, when it was expected to carry 20,000 vehicles per day within its design life of 20 years. In 1997, traffic volumes in Salem, north of the Massachusetts border, were exceeding 100,000 vehicles per day. Since I-93 was constructed, traffic volumes have increased by 600 percent in Salem, New Hampshire at the border with Massachusetts. Between 1970 and 1990, traffic on U.S. Route 3 increased by 300 percent at the state border. By the late 1990s, U.S. Route 3 was experiencing severe congestion along its entire length. Traffic congestion and serious safety concerns on these highways have led to the demand for highway capacity improvements. Widening of I-93 has been, or is under study, in both New Hampshire and Massachusetts. In 1999, construction started on widening U.S. Route 3 in 34
40 Massachusetts from two to three lanes in each direction over a distance of roughly 21 miles between I-95 (Route 128) and the New Hampshire state line. Route 3/F.E. Everett Turnpike in New Hampshire has also been reconstructed in recent years. Table 3 displays existing traffic volumes on I-93, U.S. Route 3/F.E. Everett Highway, and major circumferential highways in Massachusetts (I-495 and I-95 (Route 128)) that also provide access to New Hampshire and points to the north. A more detailed description of these highways and other north-south highways (Route 1 and Route 28) is provided below. a. I-93 Average daily traffic has grown steadily in the I-93 corridor. Historic trends revealed a 5 percent annual growth rate in the average daily traffic for I-93 for the segment north of the metropolitan Boston area. The heaviest traffic volumes along I-93 occur in southbound traffic in the morning peak period and northbound in the evening peak period. Figures 18 and 19 display traffic growth over time on the Massachusetts and New Hampshire segments of I-93. Peak hour traffic volumes reflect the commuter orientation of the corridor. In New Hampshire, approximately 60 percent of the traffic flow is southbound in the morning peak hour, and northbound in the evening peak hour. Analysis of the monthly variations in average daily traffic along the I-93 corridor indicates that the summer season has the highest traffic volume on a daily basis; August is the peak month with an average daily traffic volume of 77,500 vehicles per day. In Massachusetts, during the morning and evening commuter periods, traffic speeds are reduced because of traffic congestion on I-93 and heavy exiting and entering volumes at some interchanges. In the southbound direction in the morning peak period, recurrent congestion occurs at Exit 45 (River Road in Andover), Exit 44 (I-495 in Andover) and Exit 42 (Dascomb Road in Tewksbury). Congestion is even heavier at these locations in the northbound evening commute. Table 3-Existing Conditions-Highways Average Daily Traffic Vehicles Per Day (VPD) Highway I-93 New Hampshire Manchester (between exits 8 and 5A) 71, ,000 Londonderry (between exits 5A and 5) 72,000-77,000 Windham (between exits 4 and 5) 73,000 Salem (between exits 3 and 1) 84,000-87,000 35
41 Table 3-Existing Conditions-Highways Average Daily Traffic Vehicles Per Day (VPD) I-93 Massachusetts Methuen (between state line and exit 46) 101, ,900 Andover (between exits 45 and 41) 140, ,400 Wilmington (between exits 41 and 40) 154,900 Woburn (No. of I-95) (between exits 38 and 37) 163,200 Stoneham (between exits 36 and 33) 172, ,700 Medford (between exits 34 and 30) 166, ,900 Somerville (between exits 30 and 29) 130,300 Sources: Mass Highway (2004) and NH DOT (2003) I-95 - Massachusetts East of I-93 Lynnfield, Wakefield (between exits 43 and 39) 131,00-135,000 West of I-93 Woburn, Burlington, Lexington (between exits 37 and 30) 154, ,200 Source: MassHighway (2005) Route 3/F.E. Everett Turnpike New Hampshire Bedford, Merrimack, Nashua (between Bedford Toll to state line) 47, ,000 Massachusetts Tyngsborough, Chelmsford, Billerica (between exits 37 and 28) 60,000-86,500 Source: MassHighway (2004) and NHDOT (2003) I Massachusetts North of I-93 Haverhill, Methuen, Lawrence, Andover (between exits 50 and 40) 84, ,500 West of I-93 Lowell, Chelmsford (between exits 37 and 33) 104, ,600 Source: MassHighway (2004) 36
42 Traffic Growth 2000 to 2025 Average Daily Traffic 200, , ,000 50, North of Exit 48 Exits 47 to 48 Exits 46 to 47 Exits 45 to 46 Exits 44 to 45 Exits 43 to 44 Exits 42 to 43 Exits 41 to 42 I-93 Massachusetts Segments Source: I-93 Corridor Traffic Study, Andover and Methuen, Massachusetts Figure 18-Traffic Growth 2000 to 2025 on I-93 in Massachusetts Traffic Growth 1997 to ,000 Average Daily Traffic 150, ,000 50, North of Exit 5 Between Exits 4 and 5 Between Exits 3 and 4 Between Exits 2 and 3 Between Exits 1 and 2 South of Exit 1 I-93 New Hampshire Segments Source: I-93 Salem to Manchester Improvements FEIS Figure 19-Traffic Growth 1997 to 2020 on I-93 in New Hampshire 37
43 Traffic volumes are much heavier at the southern end of the study area with approximately 160,000 vehicles per day (80,000 vpd in each direction) recorded in 2000 traveling between Exit 42 (Dascomb Road in Tewksbury) and Exit 41 (Route 125 in Wilmington) (see Figure 18). Between Exit 48 (Route 213 in Methuen) and the New Hampshire state line, the 2000 traffic volume was lower, with approximately 120,000 vehicles per day (60,000 vpd in each direction). According to MassHighway, heavy truck and other heavy vehicle traffic makes up approximately 6 percent of the overall traffic on I-93, with passenger vehicles and small trucks comprising the remaining volume. According to the Regional Transportation Plan and Transportation Improvement Program for the Southern New Hampshire Planning Commission (July 2004), trucks are critical for short and long distance hauling in New Hampshire. Due to its location at a junction of an interstate system (I-93 and I-293), Manchester is considered to be the hub of New Hampshire s motor freight industry. Truck freight carriers in southern New Hampshire are located in Manchester, Londonderry and Hooksett. Operating Speeds As part of the I-93 Improvements Salem to Manchester FEIS, a travel time and delay study was conducted along I-93 from the I-293 split in Manchester to the Massachusetts state line in April During the morning peak period in the southbound direction, the prevailing speeds are typically as follows: Segment Prevailing Speed I-293 to Exit mph Exit 5 to Exit Exit 4 to Exit Exit 3 to Exit Exit 2 to Exit Exit 1 to the MA state line During the morning peak period in the southbound direction, travel between I-293 and Exit 5 in New Hampshire is generally under free-flow conditions, with prevailing speeds of mph. Congestion builds between Exit 3 and Exit 5, slowing travel speeds to mph. More substantial congestion is experienced between Exit 3 and Exit 2, with travel speeds of mph. The most substantial congestion is experienced approaching the Massachusetts border between Exit 2 and Exit 1, with travel speeds reduced to mph. The wider cross-section between Exit 1 and the Massachusetts state line allows speeds to increase to mph. During the evening peak period in the northbound direction, travel speeds are typically as follows: 38
44 Segment Prevailing Speed State Line to Exit 1 (Route 28, Salem) mph Exit 1 to Exit 2 (Route 97, Salem Exit 2 to Exit 3 (Route 111, Windham) Exit 3 to Exit 4 (Route 102, Londonderry) Exit 4 to Exit 5 (Route 28, Londonderry) Exit 5, Exits 6/7 (Route 101/93, Manchester) to I During the evening peak period in the northbound direction, substantial delays are experienced south of Exit 1, north of the Massachusetts state line, with travel speeds recorded at 15 to 35 mph. Between Exit 1 and Exit 2, substantial congestion continues to be experienced with only modest increases in travel speeds ranging from 20 mph to 40 mph. Somewhat improved travel speeds of 35 to 60 mph were recorded between Exit 2 and Exit 3. Travel speeds begin to increase north of Exit 3 and, north of Exit 4, can generally be described as free-flow conditions. Traffic speeds in Massachusetts would be considerably slower, were it not for interim use of the breakdown lanes (shoulders) for general purpose travel during peak travel periods along approximately 10 miles of I-93. Level of Service Travel speed is a typical measure of highway performance. Traffic operations are defined according to traffic levels of service. The Highway Capacity Manual (HCM) defines level of service (LOS) on arterial roadways and freeways in terms of average speeds. For limited access highways such as I-93, LOS A, B, and C describe free-flow or greater than free-flow speeds. LOS D describes conditions in which speeds are beginning to decrease but are still considered acceptable, and LOS E describes travel conditions at capacity. LOS F describes severely congested traffic flow. For 1997 peak hour traffic flow, the analysis of operating conditions shows poor level of service on the New Hampshire segment from Exit 1 (Route 28 in Salem) to Exit 3 (Route 111 in Windham). This congestion associated with inadequate main line capacity between Exits 1 and 3 also extends to interchange traffic operations. During the morning peak hour, severe congestion occurs at the: Exit 1 southbound off- and on-ramps (LOS F), Exit 2 (Route 97, Salem) southbound off- and on-ramps (LOS F), Exit 3 southbound on-ramp (LOS F), and Exit 3 southbound off-ramp (LOS E). During the evening peak hour, interchange capacity is exceeded (LOS F) at the: Exit 1 northbound on-ramp, Exit 2 northbound on- and off-ramps, and 39
45 Exit 3 northbound off-ramp. During the morning peak hour, the existing configuration in Massachusetts of three travel lanes in each direction is insufficient to accommodate the existing traffic volumes. The segment of I-93 between Exit 45 (River Road in Andover) and Exit 42 (Dascomb Road in Tewksbury) would operate at an unacceptable level of service (LOS E or F) if the shoulder was not being used as a travel lane as an interim congestion relief measure. Shoulder lane use during peak periods is allowed on the highway segment that extends north of Route 125 in Wilmington, where the roadway narrows from eight lanes to six lanes, to Exit 47 (Pelham Street in Methuen). It is important to note that shoulders are considered to be a buffer or reserved area between the main thoroughfare and the edge of the road. Shoulders are usually only used by motorists in the event of an emergency or by emergency vehicles in order to bypass traffic. In this section of I-93, cars are permitted to use shoulders as normal use lanes in the morning and evening peak hours. However, there are safety issues with using shoulders for travel lanes such as inadequate merging characteristics and high speeds. Safety Crash data for I-93 was obtained from the NHDOT, based on the information provided by the New Hampshire Department of Safety (NHDOS), for the period from January 1995 to December Over this seven-year period, a total of 2,427 crashes were reported for the portion of I-93 from Exit 1 to Exit 5 in New Hampshire. Of the total number of crashes, 29 percent involved personal injury, while 70 percent were limited to property damage. The highest number of crashes was recorded between Exit 3 and Exit 4, with 675 crashes or 28 percent. Crash data for the 10-mile section of I-93 in Massachusetts were reviewed for the most recent three-year period available in the I-93 Corridor Study ( ), Andover and Methuen, Massachusetts. According to the crash data collected by MHD, there were 1,587 accidents along I-93 during the three-year study period. Of that total, 970 crashes, or 61percent, occurred at interchanges. b. I-293 I-293 provides an east-west connection between I-93 and the F.E. Everett Turnpike in Manchester. This 11-mile route also provides a south and west bypass of Manchester. According to traffic data compiled by the SNHPC, traffic volumes on I-293 were among the highest in the region. I-293 and U.S. 3/NH28 in Manchester are currently operating at, or over, capacity during peak hour periods Regional Transportation Plan and Transportation Improvement Program prepared by the Southern New Hampshire Planning Commission. 40
46 c. U.S. Route 3/F.E. Everett Turnpike U.S. Route 3 is the other major north-south principal arterial that extends from southern New Hampshire through the metropolitan Boston area. Located west of I-93, Route 3 provides access to Burlington, Billerica, Chelmsford, and Tyngsborough in Massachusetts, and Nashua, Merrimack and Manchester in New Hampshire. Park and ride facilities are located off Route 3 in Nashua and north of Nashua. Route 3 and the F.E. Everett Turnpike run concurrently up to Exit 7 in Nashua where the two roads diverge and generally run parallel to each other. F.E. Turnpike continues as a toll road and Route 3 as a U.S. Route. Route 3 continues to Maine whereas the F.E. Turnpike ends at the confluence of Routes 101 and I-293 in Manchester Predominant traffic flows mirror commuting patterns on I-93, with heavier southbound flows in the morning peak period and heavier northbound traffic in the evening peak period. Data collected prior to the Massachusetts Route 3 project indicated that southbound traffic experienced severe congestion (LOS E and F) during the a.m. peak period, and northbound traffic was congested during the p.m. peak period. As shown in Table 3, the number of vehicles per day ranges from 47,000 at the Bedford Toll in New Hampshire to 101,000 in Nashua between Exits 4 and 5. d. Route 28 Roughly paralleling I-93 to the east in the study area, Route 28 is a north-south connector linking Pembroke, Suncook with Manchester and Salem in New Hampshire. In Massachusetts, Route 28 continues running parallel to and on the east side of I-93, traveling through the town centers of Methuen, Lawrence, Andover, North Reading, Reading, and Stoneham. Route 28 crosses major highways in the study area including I-95 (Route 128) in Reading and I-495 in Andover. The primary function of Route 28 is to carry through traffic and provide access to abutting properties and collector streets. South of Stoneham, Route 28 traverses through Medford and Somerville prior to crossing the Charles River into Boston. e. Route I-495 As a limited access circumferential interstate highway, I-495 carries traffic in an arc approximately 30 miles outside of Boston from Salisbury, Massachusetts at its northern terminus to Wareham, Massachusetts at its southern terminus. Along its route, I-495 intersects eight major radial expressways including I-93, Route 3, Route 2, I-290, and I-90 (Massachusetts Turnpike), Route 24, and I-95. I-495 experiences acceptable conditions both northbound and southbound during the a.m. and 41
47 p.m. peak periods with travel speeds of 50 mph or above. 2 In the study area, the average daily traffic on I-495 ranges from more than 84,000 in Haverhill to more than 121,000 in Lowell. f. I-95 Inside the I-495 arc, I-95 (Route 128) forms a partial inner beltway around the metropolitan Boston area. On the east, where it splits from Route 128, I-95 transitions to a north south interstate freeway providing access from Peabody, Massachusetts to points in New Hampshire and Maine. In the study area, I-95 connects with five radial roadways: I-90 (Massachusetts Turnpike) in Weston, Route 2 in Lexington, Route 3 in Burlington, I-93 in Reading and Route 1 in Lynnfield. The I-93/I-95 interchange has been listed as one of the highest crash locations on the Top 25 Crash Locations in the Boston Metropolitan Planning Organization Region ( ). During the morning and evening peak periods, I-95 experiences heavy congestion and mobility problems, which increase with proximity to downtown Boston. In the study area, average daily traffic ranges from 132,100 vehicles per day in Lynnfield to 174,200 vehicles in Woburn, as shown on Table 3. Historic trends in volume to capacity ratios for Boston area roadways indicate the increasing daily traffic volume and congestion on I g. Route 1 In the study area, Route 1 is an arterial roadway providing north-south access on the east side of the study corridor. In 1999 and 2000, the Central Transportation Planning Staff (CTPS) conducted a speed and travel time study on limited access highways in the Boston metropolitan region. The analysis for the I-93 northbound off-ramp to I-93/Route 1 merge showed that for the southbound a.m. peak period, the average speed was 7 mph with a LOS F. For the northbound p.m. peak period, the I-93 to Route 1 Interchange also experienced a LOS F with an average speed of 32 mph. 2. Travel Patterns For a balanced analysis, the I-93 Transit Investment Study is sectioned into eight (8) Districts. The Districts are named after the Regional Planning Commission they are situated in, but do not encompass the entire area. As indicated in Table 1, four (4) Districts are in New Hampshire and 2 Northern Middlesex Council of Governments/Northern Middlesex Metropolitan MPO, Congestion Management Systems Report, April A Framework for Thinking: A Plan for Action, Massachusetts Executive Office of Transportation, Draft Report - May
48 four (4) are in Massachusetts. A total of sixty-nine (69) cities and towns comprise the entire study area (see Table 1). Travel patterns in the study area show that most work- based travel is local, as one would expect. The largest trip generation districts in New Hampshire are the Nashua region and the Southern Districts (Figure 4). These two regions are also the destination of the largest percentage of trips. Of note in the trip and transit distribution shown in Table 4, is that although the percentage of trips from NH districts to the Boston Inner Core is only 2% of all trips, it also has the highest percentage of transit mode share at 11%. This indicates that importance of transit in accommodating these longer work trips that are being made between New Hampshire and the Boston Inner Core. 3. Proposed Railroad Corridors Along the West Rail Corridor, the Boston and Maine Corporation, a wholly owned subsidiary of the Guilford Railroad System (Pan Am Railways) owns the New Hampshire portion of the rightof-way (New Hampshire Main Line) and the MBTA (Lowell Line) owns the right-of-way in Massachusetts. The railroad right-of-way for the East Rail Corridor along the M&L Branch is largely owned by the State of New Hampshire, with a few exceptions, and the MBTA owns the right-of-way (Haverhill Line/B&M West Route Main Line) within Massachusetts. The I-93 Salem to Manchester Improvements FEIS indicated that portions of the right-of-way in Derry are owned by the town and that private interests own portions of the right-of-way in Derry and Londonderry. The Manchester Airport Authority acquired 5.8 miles for the Manchester-Boston Regional Airport, but sold portions to the state, retaining 2.2 miles from Harvey Road to Goffs Falls Road. An I-93 Transit Corridor would be situated largely within the highway right-of-way owned by the State of New Hampshire. In New Hampshire, the I-93 highway right-of-way varies from about 150 to 500 feet in width. The median width is typically 70 feet or more, although in some areas it narrows to 30 feet. A potential rail corridor could be accommodated largely within the median in New Hampshire, crossing to the outer edge of the highway approaching the state line. In Massachusetts, the median width is narrower, and this potential rail corridor could either continue within the highway right-of-way (to the west or east of the highway corridor) to the Anderson Transportation Center on the Lowell Line or would involve connections to the M&L Branch. 43
49 Table 4-Characteristics of Travel between areas within Study Corridor TOTAL TRIPS INNER OUTER Grand To: CORE CORE NMCOG MVPC NRPC RPC SNHPC CNHRPC OTHER Total From: NRPC 2,382 4,269 8,992 2,391 55,828 1,660 11, ,942 97,827 RPC 1,412 2,234 1,697 6,150 1,510 8,389 3, ,849 33,579 SNHPC 2,842 3,182 2,166 3,758 15,433 5,155 75,090 5,125 12, ,200 CNHRP C , ,113 20,866 3,733 32,714 Grand Total 6,893 9,787 12,992 12,365 74,017 15, ,888 27,007 34, ,320 SHARES OF TRIPS INNER OUTER Grand To: CORE CORE NMCOG MVPC NRPC RPC SNHPC CNHRPC OTHER Total From: NRPC 2% 4% 9% 2% 57% 2% 12% 1% 10% 100% RPC 4% 7% 5% 18% 4% 25% 9% 1% 26% 100% SNHPC 2% 3% 2% 3% 12% 4% 60% 4% 10% 100% CNHRPC 1% 0% 0% 0% 4% 1% 19% 64% 11% 100% Grand Total 2% 3% 4% 4% 26% 5% 33% 9% 12% 100% TRANSIT TRIPS INNER OUTER Grand To: CORE CORE NMCOG MVPC NRPC RPC SNHPC CNHRPC OTHER Total From: NRPC RPC SNHPC ,039 CNHRPC Grand Total ,951 TRANSIT SHARE OF TOTAL TRIPS To: INNER CORE OUTER CORE NMCOG MVPC NRPC RPC SNHPC CNHRPC OTHER Grand Total From: NRPC 10% 0% 0% 0% 0% 0% 0% 0% 1% 100% RPC 6% 0% 0% 0% 0% 0% 0% 0% 0% 100% SNHPC 14% 1% 0% 0% 0% 0% 1% 1% 1% 100% CNHRPC 23% 0% 0% 0% 0% 3% 0% 0% 1% 100% Grand Total 11% 0% 0% 0% 0% 0% 1% 0% 1% 100% Source: U.S. Census, Journey to Work,
50 4. Existing Rail Passenger Services a. MBTA Commuter Rail In Massachusetts, commuter rail services currently include MBTA service from Boston that operates along the Haverhill Line, and service along the Lowell Line, on the west. Regional commuter rail services in Massachusetts operated by the MBTA do not extend to the state line and terminate at least 2 to 5 miles south of the New Hampshire border. Since 1997, average daily inbound boardings on the Haverhill and Lowell Lines have steadily increased (Figure 20). The highest increases in boardings between 1997 and 2006 were generally recorded at the northern, outer stations: Haverhill, Andover, and Lawrence on the Haverhill Line and Lowell and North Billerica on the Lowell Line. 8,000 MBTA Commuter Rail Lines Average Daily Inbound Boardings 7,000 6,000 5,000 Haverhill Line 4,000 3,000 Lowell Line 2,000 1, Figure 20-MBTA Daily Inbound Boardings on Haverhill and Lowell Lines (1997 to 2006) Source: Ridership and Service Statistics, MBTA 45
51 According to the Major Investment Study for Passenger Rail Service, ninety percent (90%) of riders in New Hampshire live in the Nashua Regional Planning Commission area. Approximately six percent (6%) of the New Hampshire total originate from Manchester or the remainder of the Southern New Hampshire Regional Planning Commission area. Access to the Lowell line from the Manchester area is relatively poor; an estimated two percent (2%) of Manchester area commuters take the train from Lowell to Boston. Evaluation of ridership along the Lowell Line at stations sites in Lowell and North Billerica performed for the Major Investment Study indicated that the increase in ridership over a 10-year period among New Hampshire residents (185 additional riders) was nearly as high as that for Massachusetts residents (208 riders). The ridership among New Hampshire residents increased by 80% between 1988 and 1998, compared to a 15% growth rate among Massachusetts residents. The increase in the number of Nashua residents was even higher over this time period and increased by 133%. Of the work trips reported in these ridership surveys, 89% were commuters into Boston. Over 96% of the New Hampshire residents stated that they would prefer to board in New Hampshire. Additionally, a study conducted by the University of New Hampshire in February 2007, found overwhelming demand for passenger rail service into southern New Hampshire. The study concluded that nearly nine out of ten New Hampshire adults (87%) favor extending rail service into New Hampshire. Haverhill Line Service on the Haverhill Line operates primarily over the West Route Main Line (WRML) tracks between North Station and downtown Haverhill. This route, which is approximately 33 miles in length, and includes 14 stations. These stations are located at: North Station, Malden Center, Wyoming Hill (Melrose), Melrose/Cedar Park, Melrose Highlands, Greenwood (Wakefield), Wakefield, Reading, North Wilmington, Ballardvale (Andover), Andover, Lawrence, Bradford (Haverhill), and Haverhill. The MBTA operates 46 trains (23 inbound and 23 outbound) on the Haverhill Line service on a typical weekday. Eighteen of the 46 trains operate only to/from Reading Station, two trains originate/terminate in Andover, and the remaining 24 of the 46 trains originate/terminate in Haverhill. Of the 46 trains, four are express trains, which operate along the New Hampshire Main Line and the Wildcat Branch, before connecting with the WRML serving the stations north of North Wilmington Station. The express trains do not stop at Reading, Wakefield, Greenwood, Melrose Highlands, Melrose/Cedar Park, Wyoming Hill and Malden Center stations. Connections to other MBTA rail services can be made at North Station and Malden Center Station. Connections to both the MBTA Orange Line and the MBTA Green Line can be made at North Station. A connection to the MBTA s Orange Line can be made at Malden Center. During 46
52 the morning peak period a portion of passengers alight the commuter rail to board the Orange Line en route to their final destinations. Although a number of passengers do make the same transfer in reverse in the afternoon, the numbers are not as great. Inbound ridership along the Haverhill Line increased approximately 16% during the period between 1997 and 2006 (Table 5). The line carries approximately 4,700 inbound passengers each weekday. As seen in Figure 21, the changes in ridership vary from station to station, the growth in the some of the study area stations has been over 100% such as in Lawrence, while ridership in Reading has been relatively stagnant. Table 5-Average Daily Inbound Boardings on Haverhill Line by Station (I-93 TIS Study Area) (1997 to 2006) Station Haverhill Bradford Lawrence Andover Ballardvale North Wilmington Reading Wakefield MBTA Haverhill Line Average Daily Inbound Boardings By Station (I-93 TIS Study Area) 1200 Inbound Boardings Haverhill Bradford Lawrence Andover Ballardvale North Wilmington Reading Wakefield Station Figure 21-Haverhill Line Daily Inbound Boardings by Station (1997, 2001, 2006) Source: MBTA Ridership and Service Statistics, Note: Ridership statistics represent an average of passenger count data taken on 4/6/06, 7/27/06, 9/14/06, and 12/7/06. 47
53 Lowell Line Service on the Lowell Line operates primarily over the New Hampshire Main Line (NHML) tracks between North Station and downtown Lowell. This route, which is approximately 25 miles in length, includes 9 stations. These stations are: North Station, West Medford, Wedgemere (Winchester), Winchester Center, Mishawum (Woburn), Anderson RTC (Woburn), Wilmington, North Billerica, and Lowell. The MBTA operates 58 trains (30 inbound and 28 outbound) on the Lowell Line service on a typical weekday. Ten of the 58 trains operate only to/from Anderson RTC, four trains originate/terminate in Haverhill and use the Wildcat Branch to connect to the Lowell Line, north of Wilmington Station. The remaining 44 of the trains originate/terminate in Lowell, three of which run express, skipping Winchester Center, Wedgemere and West Medford Stations. There are limited connections to other transit services along the line. The only connection to other MBTA rail services are those that can be made at North Station. This includes connections to both the MBTA Orange Line and the MBTA Green Line. A connection to the Amtrak Downeaster service or Massport Logan Express Bus service can be made at Anderson RTC. There are Lowell RTA or MBTA services available at five of the nine stations. The MBTA s Orange Line can be boarded at Malden Center. During the morning peak period a significant portion of passengers alight the commuter rail to board the Orange Line en route to their final destination. Although a number of passengers do make the same transfer in reverse in the afternoon, the numbers are not as great. Ridership along the Lowell Line increased approximately 35% during the period between 1997 and 2007 (Table 6). The line carries approximately 5,900 inbound passengers each weekday. As seen in Figure 22, the changes in ridership varies from station to station. The growth in some of the study area stations has been substantive, such as at Wilmington Station following the reconstruction of the station and parking. Other stations, such as those in Woburn (Anderson RTC and Mishawum) have also seen substantial growth. Table 6-Average Daily Inboard Boardings on the Lowell Line by Station (I-93 TIS Study Area) (1997 to 2006) Station Lowell North Billerica Wilmington Anderson/Mishawum Winchester Wedgemere West Medford
54 MBTA Lowell Line Average Daily Inbound Boardings By Station (I-93 TIS Study Area) Inbound Boardings Lowell North Billerica Wilmington Anderson/Mishawum Winchester Wedgemere West Medford Station Figure 22-Lowell Line Daily Inbound Boardings by Station (1997, 2001, 2006) Source: MBTA Ridership and Service Statistics, Note: Ridership statistics represent an average of passenger count data taken on 4/6/06, 7/27/06, 9/14/06, and 12/7/06. b. Amtrak In New Hampshire, active passenger rail service is limited to the Amtrak Downeaster and Vermonter services. Downeaster service travels to the northeast of the New Hampshire communities in the study area. New Hampshire stations include Dover, Durham and Exeter. The Vermonter travels primarily along the Connecticut River on the western side of the state. The Vermonter has one station stop in New Hampshire located in Claremont. The Downeaster offers four round-trips every day, operating roughly along the coast from Boston to Portland, Maine. Each train has 234 available seats. It adds extra cars leased from Amtrak during peak demand. Amtrak s Downeaster uses the MBTA's Lowell Line from North Station to Wilmington Station, the Wildcat Branch to Wilmington Junction, and the Haverhill/Reading 49
55 Line to Haverhill Station. From the New Hampshire state line to Portland, it uses Pan Am Railways trackage. One-way fares on the Downeaster to and from New Hampshire stations are as follows: Dover Durham Exeter Portland $11 $13 $15 Old Orchard Beach Saco Wells Dover Durham 5-5 Exeter Haverhill Woburn/Anderson Boston The Downeaster has been steadily improving its services, as noted in customer surveys and statistics such as on-time performance. Its ridership has been increasing as well. Boardings from New Hampshire stations represent approximately 22 percent of all boardings along the line. Downeaster services are coordinated with the C&J Trailways motor coach service. C&J Trailways accepts FlexPass tickets purchased from the Downeaster for travel on C&J Trailways schedules between Boston, South Station and Dover and Durham, NH. The Downeaster and C&J Trailways depart from the Dover Transportation Center. In Boston, C&J Trailways serves South Station; the Downeaster serves North Station. Average daily ridership (boardings and alightings), combining weekdays, weekends and holidays in 2006 roughly ranged between 970 in the winter months and 1,150 in the summer months. In 2006, ridership on the Downeaster increased by approximately 16 percent from the previous year. Figure 23 depicts moderate increases between February 2005 and February 2007 for the estimated daily ridership of southbound boardings. Ridership is expected to continue to grow in 2007 when a fifth round trip is added to the Downeaster train schedule. Although the number of riders is not high, there is growth in ridership between Boston and Haverhill between March 2005 and February As shown in Figure 24, ridership has steadily increased since November
56 Amtrak Downeaster Daily Ridership Estimated Southbound Boardings Daily Ridership Feb '05 Mar '05 Apr '05 May '05 Jun '05 Jul '05 Aug '05 Sept '05 Oct ' 05 Nov '05 Dec '05 Jan '06 Feb '06 Mar '06 Apr '06 May '06 Jun '06 Jul '06 Aug '06 Sept '06 Oct ' 06 Nov '06 Dec '06 Jan '07 Feb '07 Month Figure 23-Daily Southbound Boardings on the Amtrak Downeaster (2005 to 2007) Source: Northern New England Passenger Rail Authority 51
57 Amtrak Downeaster Estimated Daily Ridership between Boston and Haverhill Daily Ridership March '05 April '05 May '05 Jun '05 Jul '05 Aug '05 Sept '05 Oct '05 Nov '05 Dec '05 Jan '06 Feb '06 March '06 April '06 May '06 Jun '06 Jul '06 Aug '06 Sept '06 Oct '06 Nov '06 Dec '06 Jan '07 Feb '07 Month Figure 24-Daily Amtrak Ridership between Boston and Haverhill Source: Northern New England Passenger Rail Authority c. Park and Ride Lots Park and ride facilities offer commuters a place to park their vehicles in order to take advantage of other forms of transportation. As a result, traffic and vehicular emissions are reduced. In the I-93 TIS Study Area, there are approximately 8,100 parking spaces in park and ride lots. An estimated 6,300 and 1,800 spaces are in Massachusetts and New Hampshire, respectively. Tables 7 and 8 depict the breakdown of park and ride lots in each state. The majority of park and ride parking spaces in the study area in New Hampshire are located in Nashua, Londonderry and Concord, comprising approximately 1,400 spaces. According to the Nashua Metropolitan Area Long-Range Transportation Plan , there are two new park and ride lots planned for the Nashua Region: a 250-space parking garage intermodal facility in Merrimack and a 1,000-space intermodal facility in south Nashua. The New Hampshire Regional Planning Commission is currently working with NHDOT to develop strategies for obtaining a higher utilization of park and ride lots throughout the state. Strategies include, but are not limited to, improved rail shuttle and bus access. 52
58 Table 7-Park and Ride Facilities in New Hampshire (I-93 Corridor) Town Location Number of Spaces Nashua NH 111, FE Everett Turnpike, Exit 5W 108 Nashua NH 101A, FE Everett Turnpike, Exit 7E 50 Nashua FE Everett Turnpike, Exit Salem Route 97 at I-93, Exit 2 (park-ride/bus facility to be completed October 2008) 472* Windham NH 111 at I-93, Exit Londonderry NH 102 at I-93, Exit 4 (bus facility to be constructed)* 471 Londonderry Route 28 at I-93, Exit 5 (park-ride facility/bus terminal to be constructed) 443* Hampstead Junction of NH 111 & Hooksett NH 3A, I-93, Exit Bow NH 3A at Junction of I-89 and I Concord NH 13, Exit Concord I-93, Exit Total Number of Spaces 1,778 TOTAL FINAL BUILDOUT Source: NHDOT *: Facilities/spaces to be constructed as part of I-93 Improvements project In Massachusetts, more than one-third of park and ride parking in the study area is located at Lawrence Station on the Haverhill Line or at Anderson Regional Transportation Center Station on the Lowell Line (Table 8). According to a survey conducted by the Central Transportation Planning Staff in the fall of 2005 and spring of 2006, the majority of parking lots are filled at or close to capacity by 9:00 a.m. The cost of parking is low with daily parking ranging from $2.00 to $3.50. Some lots require permits or do not charge a parking fee. 53
59 Table 8-Park and Ride Facilities in Massachusetts Station Name/ City/Town Lot Ownership Parking Spaces Occupied Parking Spaces 1 % Parking Space Usage Time of Last Observation (a.m.) Time of Last a.m. Peak Period Inbound Haverhill Line Haverhill MBTA :25 8:43 $2.00 Bradford/ Haverhill Total 373 MBTA :45 $2.00 On-street :45 None Lawrence MBTA :54 $3.00 Andover Total 202 8:59 MBTA :59 $2.00 On-street :59 None Ballardvale/ MBTA :15 9:03 $2.00 Andover North Wilmington Town :53 9:09 None Reading Total 417 9:17 MBTA :55 $2.00 Town :36 $2.00 Resident :02 Permit Res. on-street 9:23 Permit Wakefield Total 130 Town :44 $2.00 On-street :00 None Lowell Line Lowell LRTA :25 8:25 $3.50 North Billerica Total 534 8:33 LRTA :58 $2.00 On-street :58 $2.00 Wilmington MBTA :33 8:41 $2.00 Anderson RTC/ Woburn MBTA/Mass Highway/ Massport 2 1, :45 8:45 $2.00 Parking Fee Winchester Town :53 8:53 $2.00 Wedgemere/ Total 151 Winchester Town :55 None On-street :55 $0.00 West Medford Total 77 8:59 Res. on-street :59 Permit Private :59 None Express Bus Woburn 3 MBTA :00 9:00 None Towns Andover MassHighway None (1-93 exit 42, Dascomb Road) Methuen MassHighway (I-93 exit 47, None 54
60 Table 8-Park and Ride Facilities in Massachusetts Station Name/ City/Town Lot Ownership Parking Spaces Occupied Parking Spaces 1 % Parking Space Usage Time of Last Observation (a.m.) Time of Last a.m. Peak Period Inbound Pelham Street) Tyngsboro MassHighway (Route 3 exit 35, Route 113 or Kendall Road) None Total Number of Parking Spaces 6,314 1 Parking spaces occupied at the time of the last a.m. peak period train. 2 Facility is operated by Massport. The ARTC has a total of 2,400 spaces. 1,510 spaces are for people who either carpool or use the commuter rail. The remaining 890 spaces are used for Logan Express. 3 For bus #354. Lot is on Montvale Avenue. 4 There are conceptual plans to expand this parking facility by adding approximately 85 spaces. 5 New lot opened in Fall Source: CTPS Fall 2005/Winter Parking Fee 5. Freight Service The portion of the Haverhill Line extending from Lowell Junction through Lawrence and Andover, Massachusetts also accommodates heavy freight use. The Pan Am Railway, a wholly owned subsidiary of the Guilford Rail System, operates freight service along the line as part of its network that provides freight service to Northern New England. The segment between Lowell Junction (in Wilmington, MA) and Haverhill carries approximately five million gross ton-miles of freight each year and is key segment of the second busiest freight line in New England. The principal industrial use of the line is related to the manufacture of paper and forest products produced in Maine. Paper is delivered in boxcars from paper plants in Maine. Clays and chemicals used to process the paper travel to Maine from the south in tank cars. The construction industry also makes extensive use of the line. Stone, sand and gravel from quarries in New Hampshire are regularly shipped on the line to Boston. Guilford s Lawrence Yard at Andover Street in Lawrence is the busiest freight yard in Essex County and the busiest yard on the Guilford network between Portland, Maine and Ayer, Massachusetts. At this time, all rail freight traffic to warehouses and customers on former B&M lines in the greater Boston area are served from Lawrence yard. To the north, along the Manchester & Lawrence Branch (East Rail Corridor) there is limited freight service. In 2000, Guilford filed for abandonment of the M&L Branch tracks from Milepost (MP) 4.65 to MP 7.6 in Salem, NH. In 2001, Guilford filed for abandonment of the M&L Branch 55
61 from MP 1.4 in Lawrence to MP 4.4 in Salem, NH. Pan Am now operates freight service only along less than 1 mile of the M&L Branch within Lawrence. The M&L Branch in New Hampshire is inactive. Freight service currently operates north of the Lowell Line on the West Rail Corridor. The former B&M New Hampshire Main Line currently operates as the Pan Am s Freight Main Line and Northern Main Line. The route into New Hampshire accommodates two to three coal trains per week (to the Bow power plant), and general freight for customers located in the Nashua, Manchester and Concord regions. 6. Bus Services Regional bus services within the I-93 TIS Study Area are primarily provided by private bus carriers, with some subsidies provided by NHDOT. The bus routes in the study area that provide service to Boston are shown in Figure 25, and bus ridership estimates provided by the private bus operators and NHDOT are shown in Table 9. Bus services provided within the study area are discussed further below. Table 9-Annual Ridership (One-way Passenger Trips) on Bus Commuter Routes Concord Stickney Avenue 131,000 Manchester 118,000 Londonderry Exit 4 126,000 Dover downtown 50,000 Portsmouth Exit 3 350,000 New London 11,000 Hanover/Lebanon 85,000 Nashua Exit 8 (2007) 20,000 (projected) Nashua Exit 6 (2007) 105,000 (projected) Londonderry Exit 5 (2008) 257,000 (estimate) Salem Exit 2 (2008) 110,000 (estimate) Dover Exit 9 (2008) 100,000 (estimate) TOTAL 1,463,000 Source: NHDOT 56
62 a. I-93 Corridor Bus Services As part of the I-93 Improvements project in New Hampshire, the NHDOT has identified a need to expand bus service on this corridor to meet the growing demand, address traffic congestion, and help reduce auto emissions in southern New Hampshire and Massachusetts. According to NHDOT, to provide this expanded service, new park and-ride lots with bus terminals will be constructed at Exit 2 in Salem and Exit 5 in Londonderry. NHDOT will also construct a bus maintenance and storage facility near Exit 5. The NHDOT will improve the existing commuter bus service at Exit 4 in Londonderry through construction of a bus terminal and purchase of two commuter coaches. The NHDOT will purchase 14 commuter coaches and contract with a private bus operating company to conduct the expanded bus service. The expanded service will be supported with Congestion Management Air Quality (CMAQ) funds for the first three years of operation. The NHDOT will also provide funds for marketing to build public awareness of the commuter bus service, and incentives to encourage people to use transit. It is projected that the commuter bus services based at Exit 5 and Exit 2 will each offer 23 round trips per weekday, with half-hourly service during peak hours and hourly off-peak service. Limited service will be offered on weekends as well. Off-peak trips may be combined between the two sites depending on ridership, which could slightly reduce the total number of trips offered. Estimated total ridership for the new service is approximately 462,000 passenger trips per year. An essential feature of the of I-93 project includes the purchase of 16 commuter bus coaches to enhance existing commuter bus service to be operated along the corridor by private operators out of the park and ride lots at Exits 5, 4 and 2. b. Other Bus Services Manchester The Manchester Transit Authority provides local bus service on thirteen (13) routes throughout the city. Some services extend just into the neighboring communities of Bedford, Goffstown, Londonderry, and Hooksett. Intercity bus service is provided from the Manchester Transit Center on Canal Street by Vermont Transit, Concord Trailways and Peter Pan Bus Lines. Vermont Transit provides service between Hanover, NH and Boston, serving both the Manchester-Boston Regional Airport and the Manchester Transit Center. The buses travel via U.S. Route 3 and the Everett Turnpike to access Nashua and Lowell before continuing on to Boston. The two southbound trips arrive in Boston at 4:40 p.m. and 10:55 p.m. An additional three trips operate between the Manchester-Boston Regional Airport and Boston. The northbound service departs Boston at 8:00 a.m., 1:15 p.m., and 11:45 p.m. One way fares are $14.75 and the roundtrip fare is $
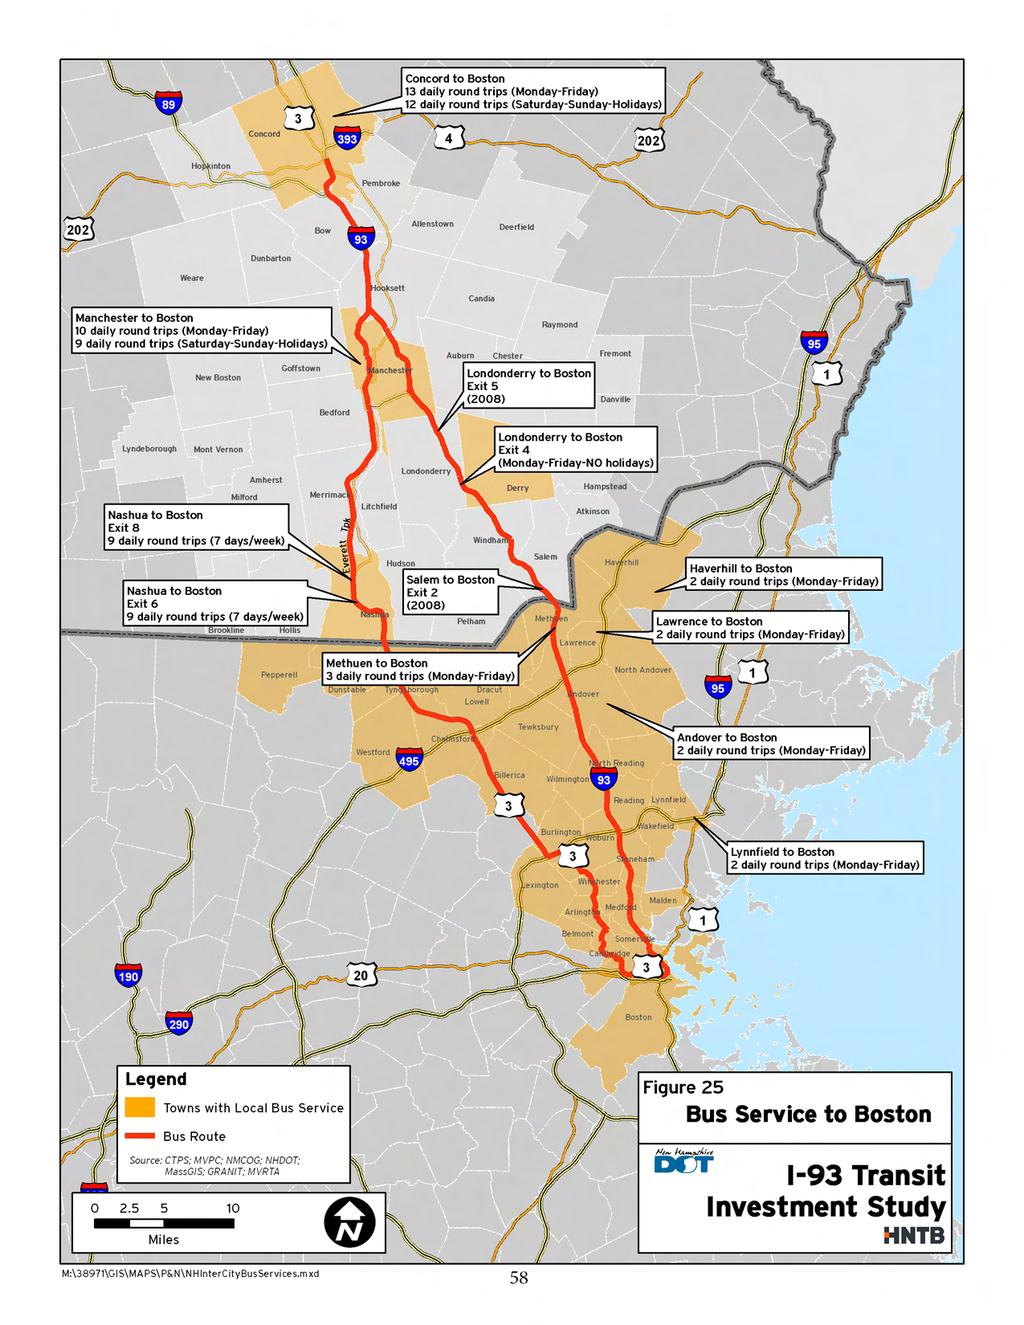
63
Airport Planning Area
 PLANNING AREA POLICIES l AIRPORT Airport Planning Area LOCATION AND CONTEXT The Airport Planning Area ( Airport area ) is a key part of Boise s economy and transportation network; it features a multi-purpose
50 Largest U.S. Metropolitan Areas
 America s Racially : Opportunities and Challenges 50 Largest U.S. Metropolitan Areas Community types in the 50 largest metropolitan areas White 39,333,003 26% 14,533,326 16,983,337 9% 10% White 47,406,687
Public Informational Meeting
 Public Informational Meeting April 17, 2007 Bow-Concord I-93 I Transportation Planning Study Bow-Concord Interstate 93 Transportation Planning Study Context Sensitive Solutions Planning Steps Screen Alternatives
Interstate 90 and Mercer Island Mobility Study APRIL Commissioned by. Prepared by
 Interstate 90 and Mercer Island Mobility Study APRIL 2017 Commissioned by Prepared by Interstate 90 and Mercer Island Mobility Study Commissioned by: Sound Transit Prepared by: April 2017 Contents Section
6 HIGH-OCCUPANCY-VEHICLE (HOV) LANES AND TRAVEL DEMAND MANAGEMENT (TDM) PROGRAMS
 LANES AND TRAVEL DEMAND MANAGEMENT (TDM) PROGRAMS") 6 HIGH-OCCUPANCY-VEHICLE (HOV) LANES AND TRAVEL DEMAND MANAGEMENT (TDM) PROGRAMS Travel demand management (TDM) programs enable roadways, which have a fixed capacity, to accommodate more travelers without
6 HIGH-OCCUPANCY-VEHICLE (HOV) LANES AND TRAVEL DEMAND MANAGEMENT (TDM) PROGRAMS Travel demand management (TDM) programs enable roadways, which have a fixed capacity, to accommodate more travelers without
FNORTHWEST ARKANSAS WESTERN BELTWAY FEASIBILITY STUDY
 FNORTHWEST ARKANSAS WESTERN BELTWAY FEASIBILITY STUDY EXECUTIVE SUMMARY The 2030 Northwest Arkansas Regional Transportation Plan developed by the Northwest Arkansas Regional Planning Commission (NWARPC)
WELLINGTON $422 MILLION $614 MILLION $83 MILLION 22% SPEND $1.9 BILLION
 WELLINGTON WELLINGTON $1.9 BILLION FORECAST TOTAL WELLINGTON INVESTMENT The Wellington region s transport challenges are dominated by the region s concentration of population in the metropolitan cities,
Nashua Regional Planning Commission
 Nashua Regional Planning Commission Congestion Management Program Corridor Overview NH 111 is a major east-west arterial roadway that passes through 3 municipalities in the Nashua region. It enters the
Kilometres. Blacktown. Penrith. Parramatta. Liverpool Bankstown. Campbelltown
 0 5 10 15 20 Kilometres Penrith Blacktown Parramatta Liverpool Bankstown Campbelltown accessibility outcomes Legend Outcomes targeted in Western Sydney are: public transport that is accessible throughout
8 CROSS-BOUNDARY AGREEMENT WITH BRAMPTON TRANSIT
 8 CROSS-BOUNDARY AGREEMENT WITH BRAMPTON TRANSIT The Transportation Services Committee recommends the adoption of the recommendations contained in the following report dated May 27, 2010, from the Commissioner
SECTION 106 ACTIVITIES ANNUAL REPORT
 SECTION 106 ACTIVITIES ANNUAL REPORT FOR THE YEAR ENDING DECEMBER 31, 2011 Metropolitan Washington Airports Authority 1593 Spring Hill Road, Suite 300 Vienna, Virginia 22182 JANUARY 2012 Introduction The
Lake Erie Commerce Center Traffic Analysis
 LOCATION: East of NYS Route 5 at Bayview Road Town of Hamburg Erie County, New York PREPARED BY: Wendel Companies 140 John James Audubon Parkway Suite 200 Amherst, New York 14228 January 2012 i ii Table
Section 106 Update Memo #1 Attachment D. Traffic Diversion & APE Expansion Methodology & Maps
 Section 106 Update Memo #1 Attachment D Traffic Diversion & APE Expansion Methodology & Maps I-65/I-70 North Split Interchange Reconstruction Project (Des. Nos. 1592385 & 1600808) Traffic Diversion and
Greater Portland Transit District
 Greater Portland Transit District TO: FROM: Freeport Town Council Greg Jordan - Metro General Manager DATE: September 10, 2014 SUBJECT: Metro Request to Pursue Grant Funding for Trial Express Bus Service
Aviation, Rail, & Trucking 6-1
 6-1 This chapter describes the services, facilities, and condition of air, rail, and trucking as components of the transportation system. These three intermodal areas have an impact on the factors to be
1.2 Corridor History and Current Characteristics
 SECTION 1 Description and Background of Study Area 1.1 Introduction This preliminary engineering report was prepared for the Alaska Department of Transportation and Public Facilities (ADOT&PF). It is part
DEMOGRAPHICS AND EXISTING SERVICE
 EXECUTIVE SUMMARY The Central Corridor light-rail transit (LRT) project will open in 2014 and operate between downtown Minneapolis and downtown St. Paul, serving the University of Minnesota and University
EAST WEST RAIL EASTERN SECTION. prospectus for growth
 EAST WEST RAIL EASTERN SECTION prospectus for growth September 2018 executive summary The East West Rail Consortium, a partnership of local authorities, rail operators and Network Rail, continues to promote
HOV LANE PERFORMANCE MONITORING: 2000 REPORT EXECUTIVE SUMMARY
 Final Report Research Project Agreement No. T1803, Task 4 HOV Monitoring V HOV LANE PERFORMANCE MONITORING: 2000 REPORT EXECUTIVE SUMMARY by Jennifer Nee TRAC Research Engineer John Ishimaru TRAC Senior
Georgetown-Lewes Rail/Trail Study. Rail/Trail Study: Cool Spring to Cape Henlopen State Park New Road Extension (House Resolution No.
 Georgetown-Lewes Rail/Trail Study Rail/Trail Study: Cool Spring to Cape Henlopen State Park New Road Extension (House Resolution No. 47) August 22, 2011 Presentation Outline Background Benefits Statewide
Parkland County Municipal Development Plan Amendment Acheson Industrial Area Structure Plan
 Parkland County Municipal Development Plan Amendment Acheson Industrial Area Structure Plan New Plan Acheson Industrial Area Structure Plan Amendment Parkland County Municipal Development Plan Board Reference
2015 Independence Day Travel Overview U.S. Intercity Bus Industry
 2015 Independence Day Travel Overview U.S. Intercity Bus Industry Chaddick Institute for Metropolitan Development, DePaul University June 25, 2015 This Intercity Bus Briefing summarizes the Chaddick Institute
PURPOSE AND NEED (CONCURRENCE POINT 1) NEW CANADA ROAD PROJECT FROM STATE ROUTE 1 (U.S. HIGHWAY 70) TO U.S. INTERSTATE 40
 NEW CANADA ROAD PROJECT FROM STATE ROUTE 1 (U.S. HIGHWAY 70) TO U.S. INTERSTATE 40") PURPOSE AND NEED (CONCURRENCE POINT 1) NEW CANADA ROAD PROJECT FROM STATE ROUTE 1 (U.S. HIGHWAY 70) TO U.S. INTERSTATE 40 Project Description The primary purpose of this project is to improve the major
PURPOSE AND NEED (CONCURRENCE POINT 1) NEW CANADA ROAD PROJECT FROM STATE ROUTE 1 (U.S. HIGHWAY 70) TO U.S. INTERSTATE 40 Project Description The primary purpose of this project is to improve the major
SECTION 106 ACTIVITIES ANNUAL REPORT
 SECTION 106 ACTIVITIES ANNUAL REPORT FOR THE YEAR ENDING DECEMBER 31, 2014 Metropolitan Washington Airports Authority 198 Van Buren Street, Suite 300 Herndon, Virginia 20170 JANUARY 2015 Introduction The
Assessment of Travel Trends
 I - 2 0 E A S T T R A N S I T I N I T I A T I V E Assessment of Travel Trends Prepared for: Metropolitan Atlanta Rapid Transit Authority Prepared by: AECOM/JJG Joint Venture Atlanta, GA October 2011 General
Arlington County Board Meeting Project Briefing. October 20, 2015
 Arlington County Board Meeting Project Briefing October 20, 2015 Project Map 2 Project Context Only Interstate in the Country limited to HOV only traffic during rush hours Stoplight at the end of I-66
Public Transport for Perth in 2031
 South West Group Submission Public Transport for Perth in 2031 October 2011 South West Group Vision and Mission Local Governments in South Metropolitan Perth, through cooperation with industry, community
PUBLIC TRANSIT IN KENOSHA, RACINE, AND MILWAUKEE COUNTIES
 PUBLIC TRANSIT IN KENOSHA, RACINE, AND MILWAUKEE COUNTIES #118404v1 Regional Transit Authority June 19, 2006 1 Presentation Overview Existing Public Transit Transit System Peer Comparison Recent Transit
DIRECTOR, ENVIRONMENT, FLEET, & SOLID WASTE UPDATE: REGIONAL RIDESHARE PROGRAM RECOMMENDATION
 Agenda Item # Page # 1 TO: FROM: SUBJECT: CHAIR AND MEMBERS CIVIC WORKS COMMITTEE MEETING ON APRIL 20, 2015 JAY STANFORD DIRECTOR, ENVIRONMENT, FLEET, & SOLID WASTE UPDATE: REGIONAL RIDESHARE PROGRAM RECOMMENDATION
Boston Logan International airport (BOS) transfers
 transfers") Boston Logan International airport (BOS) transfers The following are a list of the towns that are within the allowable radius of 50 miles to/from Boston Logan International airport. Pricing for additional
Boston Logan International airport (BOS) transfers The following are a list of the towns that are within the allowable radius of 50 miles to/from Boston Logan International airport. Pricing for additional
The implementation of this Master Plan will be undertaken in logical stages to meet passenger and workforce demands.
 The implementation of this Master Plan will be undertaken in logical stages to meet passenger and workforce demands. Connecting People Building Opportunities 198 Brisbane Airport Corporation CHAPTER 10
BOSTON REGION METROPOLITAN PLANNING ORGANIZATION
 PLANNING ORGANIZATIO BOSTON REGION MPO NMETROPOLITAN BOSTON REGION METROPOLITAN PLANNING ORGANIZATION Stephanie Pollack, MassDOT Secretary and CEO and MPO Chair Karl H. Quackenbush, Executive Director,
Appendix 4.1 J. May 17, 2010 Memorandum from CTPS to the Inter Agency Coordinating Group
 Appendix 4.1 J May 17, 2010 Memorandum from CTPS to the Inter Agency Coordinating Group CTPS CENTRAL TRANSPORTATION PLANNING STAFF Staff to the Boston Region Metropolitan Planning Organization MEMORANDUM
Westover Metropolitan Airport Master Plan Update
 Westover Metropolitan Airport Master Plan Update June 2008 INTRODUCTION Westover Metropolitan Airport (CEF) comprises the civilian portion of a joint-use facility located in Chicopee, Massachusetts. The
Stage 2 ION: Light Rail Transit (LRT) from Kitchener to Cambridge
 from Kitchener to Cambridge") Stage 2 ION: Light Rail Transit (LRT) from Kitchener to Cambridge Public Consultation Centre (PCC) No. 3 Please Sign-in Cambridge City Hall November 21, 2017 2:00 to 8:00pm Preston Memorial Auditorium
Stage 2 ION: Light Rail Transit (LRT) from Kitchener to Cambridge Public Consultation Centre (PCC) No. 3 Please Sign-in Cambridge City Hall November 21, 2017 2:00 to 8:00pm Preston Memorial Auditorium
CHRISTCHURCH MOTORWAYS. Project Summary Statement February 2010
 CHRISTCHURCH MOTORWAYS Project Summary Statement February 2010 Table of Contents 1. Purpose of Document 2. Strategic Context 3. Benefits 4. Project Scope and Economics 5. Implementation Plan 1 ROADS OF
CHAPTER FIVE PROSPECTS FOR FUTURE ECONOMIC DEVELOPMENT
 CHAPTER FIVE PROSPECTS FOR FUTURE ECONOMIC DEVELOPMENT 5.1 GENERAL The recommended type and location of future land uses in Alpine should, in part, consider potential opportunities for future economic
Other Principle Arterials Minor Arterial Major Collector Minor Collector Local
 CHAPTER 10 TRANSPORTATION Introduction The system of public roads in East Pikeland Township is decidedly rural in character. Since the 1984, the road network has remained much the same, with the addition
MONTEREY REGIONAL AIRPORT MASTER PLAN TOPICAL QUESTIONS FROM THE PLANNING ADVISORY COMMITTEE AND TOPICAL RESPONSES
 MONTEREY REGIONAL AIRPORT MASTER PLAN TOPICAL QUESTIONS FROM THE PLANNING ADVISORY COMMITTEE AND TOPICAL RESPONSES Recurring topics emerged in some of the comments and questions raised by members of the
Memorandum of Understanding with ACT Government
 MEDIA RELEASE 8 April 2015 Memorandum of Understanding with ACT Government The ACT Government and Canberra Airport today entered into a new Memorandum of Understanding (MoU) on key areas of common interest
RACINE COUNTY PUBLIC TRANSIT PLAN:
 RACINE COUNTY PUBLIC TRANSIT PLAN: 2013-2017 Recommended Transit Service Improvement Plan NEWSLETTER 3 SEPTEMBER 2013 This newsletter describes the final recommended public transit plan for the City of
3 The growth of Western Sydney
 3 The growth of Western Sydney About this chapter This chapter provides an overview of Western Sydney s growing population and economy, and the benefit of the proposed Western Sydney Airport. Population
June 2007 Annual Update. 18 Communities - Naugatuck Valley Corridor Comprehensive Economic Development Strategy (CEDS)
") June 2007 Annual Update 18 Communities - Naugatuck Valley Corridor Comprehensive Economic Development Strategy (CEDS) Presented to U.S. Department of Commerce, Economic Development Administration Presented
June 2007 Annual Update 18 Communities - Naugatuck Valley Corridor Comprehensive Economic Development Strategy (CEDS) Presented to U.S. Department of Commerce, Economic Development Administration Presented
A. CONCLUSIONS OF THE FGEIS
 Chapter 11: Traffic and Parking A. CONCLUSIONS OF THE FGEIS The FGEIS found that the Approved Plan will generate a substantial volume of vehicular and pedestrian activity, including an estimated 1,300
Chapter 1: Introduction Draft
 Chapter 1: Draft TABLE OF CONTENTS 1... 4 1.6.1 Stakeholder Engagement Plan... 10 Chapter 1 Page 2 TABLE OF EXHIBITS Exhibit 1.1-1 ABIA Annual Growth Since 1993... 5 Exhibit 1.4-1: ABIA Location Map...
Memorandum. Fund Allocation Fund Programming Policy/Legislation Plan/Study Capital Project Oversight/Delivery Budget/Finance Contract/Agreement Other:
 Memorandum Date: March 23, 2018 To: Transportation Authority Board From: Eric Cordoba Deputy Director Capital Projects Subject: 4/10/18 Board Meeting: San Francisco Freeway Corridor Management Study Update
Economic Revitalization Zone Application Town of Salem Keewaydin Drive Extension April 2011
 Economic Revitalization Zone Application Town of Salem Keewaydin Drive Extension April 2011 11-25 Keewaydin New Hampshire Division of Economic Development Economic Revitalization Zone Tax Credits (Res
DRAFT Service Implementation Plan
 2017 Service Implementation Plan October 2016 SECTION NAME 2017 Service Implementation Plan October 2016 2017 SERVICE IMPLEMENTATION PLAN TABLE OF CONTENTS Table of Contents... I List of Tables... III
Sudbury to Hudson Transmission Reliability Project
 An independent assessment of routing options Sudbury to Hudson Transmission Reliability Project and use of a rail-banked corridor for this purpose Prepared by: NorthEast Logistics Systems, LLC August 29,
4. Proposed Transit Improvements
 4. Proposed Transit Improvements The following proposed transit improvements have been assembled based on input received from the community meetings and from review and coordination with the TAC as well
Memorandum. Roger Millar, Secretary of Transportation. Date: April 5, Interstate 90 Operations and Mercer Island Mobility
 Memorandum To: From: The Honorable Dow Constantine, King County Executive; The Honorable Ed Murray, City of Seattle Mayor; The Honorable Bruce Bassett, City of Mercer Island Mayor; The Honorable John Stokes,
The Government s Aviation Strategy Transport for the North (TfN) response
 response") The Government s Aviation Strategy Transport for the North (TfN) response Transport for the North Background Good transport links are a crucial part of a strong economy supporting labour markets and delivering
The Government s Aviation Strategy Transport for the North (TfN) response Transport for the North Background Good transport links are a crucial part of a strong economy supporting labour markets and delivering
TOWN PLANNING SUBMISSION TO THE GREATER SYDNEY COMMISSION LANDS AT ARTARMON
 TOWN PLANNING SUBMISSION TO THE GREATER SYDNEY COMMISSION LANDS AT ARTARMON March 2017 TABLE OF CONTENTS 1.0 INTRODUCTION 3 2.0 THE SUBJECT SITE 4 3.0 STRATEGIC PLANNING CONTEXT 6 4.0 SUMMARY AND CONCLUSIONS
PSP 75 Lancefield Road. Northern Jacksons Creek Crossing Supplementary Information
 PSP 75 Lancefield Road Northern Jacksons Creek Crossing Supplementary Information September 2017 The northern crossing of Jacksons Creek proposed within the Lancefield Road PSP is a key part of the ultimate
Peer Performance Measurement February 2019 Prepared by the Division of Planning & Market Development
 2017 Regional Peer Review Peer Performance Measurement February 2019 Prepared by the Division of Planning & Market Development CONTENTS EXECUTIVE SUMMARY... 3 SNAPSHOT... 5 PEER SELECTION... 6 NOTES/METHODOLOGY...
Bloor Street West Rezoning Application for a Temporary Use By-law Final Report
 STAFF REPORT ACTION REQUIRED 3741 3751 Bloor Street West Rezoning Application for a Temporary Use By-law Final Report Date: June 12, 2007 To: From: Wards: Reference Number: Etobicoke York Community Council
SUMMER VILLAGE OF SILVER SANDS. Municipal Development Plan
 SUMMER VILLAGE OF SILVER SANDS Municipal Development Plan Bylaw 253-2014 Adopted August 22, 2014 Summer Village of Silver Sands Municipal Development Plan Bylaw No. 253-2014 Page 2 1 INTRODUCTION 1.1 SETTING
SRTA Year End Fixed Route Ridership Analysis: FY 2018
 SRTA Year End Fixed Route Ridership Analysis: FY 2018 2018 Contents Introduction... 1 A. Key Terms Used in this Report... 1 Key Findings... 2 A. Ridership... 2 B. Fare Payment... 4 Performance Analysis
Basic Project Information
 FY 2015-16 PROJECT DESCRIPTION FORM (2C) Submitting Agency: Loudoun County Basic Project Information Project Title: Loudoun County Parkway (VA Route 607) U.S. 50 to Creighton Rd. (2C) Project Type (check
East Lancashire Highways and Transport Masterplan East Lancashire Rail Connectivity Study Conditional Output Statement (Appendix 'A' refers)
") Report to the Cabinet Member for Highways and Transport Report submitted by: Director of Corporate Commissioning Date: 1 June 2015 Part I Electoral Divisions affected: All East Lancashire Highways and
Report to the Cabinet Member for Highways and Transport Report submitted by: Director of Corporate Commissioning Date: 1 June 2015 Part I Electoral Divisions affected: All East Lancashire Highways and
N4 Carrick-on-Shannon to Dromod Road Project. 2.1 Introduction
 Chapter 2 Need for the Scheme 2.1 Introduction The National Primary Route N4, Dublin to Sligo is a strategic corridor from Dublin to the northwest and border counties (See RCSR 101 in Volume 2). The National
Establishes a fare structure for Tacoma Link light rail, to be implemented in September 2014.
 RESOLUTION NO. R2013-24 Establish a Fare Structure and Fare Level for Tacoma Link MEETING: DATE: TYPE OF ACTION: STAFF CONTACT: PHONE: Board 09/26/2013 Final Action Ric Ilgenfritz, Executive Director,
Research Report Agreement T4118, Task 24 HOV Action Plan HOV ACTION PLAN
 Research Report Agreement T4118, Task 24 HOV Action Plan HOV ACTION PLAN by John M. Ishimaru Senior Research Engineer Duane Wright Systems Analyst Programmer Mark E. Hallenbeck Director Jaime Kang Research
Chapter 1: Introduction
 Chapter 1: TABLE OF CONTENTS 1... 4 1.1 Master Plan Study Content... 4 1.2 Purpose and Scope of Master Plan Study... 4 1.3 Airport History and Role... 6 1.4 Airport Location and Service Area... 6 1.5 ABIA
SAMTRANS TITLE VI STANDARDS AND POLICIES
 SAMTRANS TITLE VI STANDARDS AND POLICIES Adopted March 13, 2013 Federal Title VI requirements of the Civil Rights Act of 1964 were recently updated by the Federal Transit Administration (FTA) and now require
McLean Citizens Association Transportation Committee Project Briefing
 McLean Citizens Association Transportation Committee Project Briefing November 10, 2015 Project Map 2 Project Context Only Interstate in the Country limited to HOV only traffic during rush hours Stoplight
2016 Regional Transportation Alternatives Program (TAP) Grant Application
 Grant Application") 2016 Regional Transportation Alternatives Program (TAP) Grant Application PROJECT TITLE: Yelm-Tenino Trail Extension Feasibility Study TRPC use only GENERAL PROJECT INFORMATION Agency or Organization City
2016 Regional Transportation Alternatives Program (TAP) Grant Application PROJECT TITLE: Yelm-Tenino Trail Extension Feasibility Study TRPC use only GENERAL PROJECT INFORMATION Agency or Organization City
2004 Congestion Management System Report
 Chapter 3: Roadways 3.3.2.5 Analysis: Bottlenecks and Congested Segments on ed-access Highways Much like arterial roadways, where bottlenecks and delays are usually found at signalized intersections (and
DANVERS (BOSTON), MASSACHUSETTS
, MASSACHUSETTS") DANVERS (BOSTON), MASSACHUSETTS BOSTON S NORTH SHORE NATURAL BEAUTY HISTORIC SIGNIFICANCE Danvers, in Essex County Massachusetts, is located on the beautiful Danvers River. Danvers is 17 miles north of
DANVERS (BOSTON), MASSACHUSETTS BOSTON S NORTH SHORE NATURAL BEAUTY HISTORIC SIGNIFICANCE Danvers, in Essex County Massachusetts, is located on the beautiful Danvers River. Danvers is 17 miles north of
Strategic Transport Forum 21 st September 2018
 Strategic Transport Forum 21 st September 2018 Agenda Item 4: Heathrow Airport Expansion: Surface Access Strategy Update Recommendation: It is recommended that the Forum consider the update provided by
Interim Growth Management Policies City of Brampton Council
 Interim Growth Management Policies City of Brampton Council October 24, 2007 Agenda City of Brampton 2006 Official Plan Brampton s Growth Management Initiatives Provincial Growth Plan Brampton s Growth
5 Rail demand in Western Sydney
 5 Rail demand in Western Sydney About this chapter To better understand where new or enhanced rail services are needed, this chapter presents an overview of the existing and future demand on the rail network
3. COLTA / HUGA CONNECTIONS - PRELIMINARY
 9 3. COLTA / HUGA CONNECTIONS - PRELIMINARY 3.1 COLTA The Chain of Lakes Trail Association (COLTA) trail, formerly identified as the Chester Spur Line, was completed and opened for use in June 2011. The
The Berkshire Flyer. Connecting Pittsfield and NYC through Seamless Transit
 The Berkshire Flyer Connecting Pittsfield and NYC through Seamless Transit Rail Service between Pittsfield & New York City 1. Feasibility Study (2017-2018) 2. Berkshire Flyer 2.0 (Now) 3. Pilot Project
12, 14 and 16 York Street - Amendments to Section 16 Agreement and Road Closure Authorization
 REPORT FOR ACTION 12, 14 and 16 York Street - Amendments to Section 16 Agreement and Road Closure Authorization Date: April 27, 2018 To: Toronto and East York Community Council From: Senior Strategic Director,
Westbrook Station. Transit Oriented Development Opportunity
 DEVELOPM Westbrook Station Transit Oriented Development Opportunity OPPOR Table of Contents Prime Real Estate Development Opportunity page 1 Calgary City of Opportunity page 3 What is Transit Oriented
5.1 Traffic and Transportation
 5.1 When it opens in 2009, the Bellevue Nickel Improvement Project will increase the number of vehicles able to travel through the study area, improve travel speeds, and improve safety by reducing the
FTE Enrollment Maps for Spring 2014
 Enrollment Maps for Office of Institutional Research and Planning February 13, 2014 Maps Over all scale for Change Maps by Town Enrolled at NECC 30 to 40 by Town Enrolled at the Haverhill Campus 20 to
Overview of Boston Logan Operations and Noise from Overflights. Presentation to Massport Board March 19, 2015
 Overview of Boston Logan Operations and Noise from Overflights Presentation to Massport Board March 19, 2015 Contents How the Airport Operates Massport s Noise Abatement Program for Logan Recent Trends
Report to: Greater Cambridge Partnership Joint Assembly 18 January A10 Foxton level crossing bypass and travel hub
 Report to: Greater Cambridge Partnership Joint Assembly 18 January 2018 Lead officer: Chris Tunstall GCP Director of Transport A10 Foxton level crossing bypass and travel hub 1. Purpose 1.1 The list of
Treasure Island Supplemental Information Report Addendum
 1 1 1 1 0 1 0 1 0 1 Treasure Island Supplemental Information Report Addendum Introduction Purpose The purpose of this Supplemental Information Report (SIR) Addendum is to determine if the current land
SOUTH INTERCHANGE AREA
 Santaquin City General Plan 1 Location and Characteristics The South Interchange Area of Santaquin is located west of Interstate 15 and south of 500 South (Figure 1). It includes properties already annexed
PO Box 257 PO Box 257 PARRAMATTA NSW 2124 PARRAMATTA NSW 2124
 31 March 2017 Sean O Toole Sheridan Dudley District Commissioner - West District Commissioner - South West Greater Sydney Commission Greater Sydney Commission PO Box 257 PO Box 257 PARRAMATTA NSW 2124
JOSLIN FIELD, MAGIC VALLEY REGIONAL AIRPORT DECEMBER 2012
 1. Introduction The Federal Aviation Administration (FAA) recommends that airport master plans be updated every 5 years or as necessary to keep them current. The Master Plan for Joslin Field, Magic Valley
US Route 3 Corridor Study: Phase I. Town of Boscawen & City of Franklin, New Hampshire
 US Route 3 Corridor Study: Phase I Town of Boscawen & City of Franklin, New Hampshire January 27, 2004 US Route 3 Corridor Study: Phase I, NH City of Franklin Franklin Plantation For the Town of Boscawen
Gold Coast. Rapid Transit. Chapter twelve Social impact. Chapter content
 Gold Coast Rapid Transit Chapter twelve Social impact Chapter content Social impact assessment process...235 Existing community profile...237 Consultation...238 Social impacts and mitigation strategies...239
Like many transit service providers, the Port Authority of Allegheny County (Port Authority) uses a set of service level guidelines to determine
 uses a set of service level guidelines to determine") Transit service consists of two fundamental elements: frequency (how often service operates) and service span (how long service runs during the day). Combined, these two factors measure how much service
Transit service consists of two fundamental elements: frequency (how often service operates) and service span (how long service runs during the day). Combined, these two factors measure how much service
https://gsc-public-1.s3-ap-southeast-2.amazonaws.com/s3fs-public/draft-eastern-city-district-plan.pdf
 GSC Sydney East Rev Draft -references Port Botany - 30 https://gsc-public-1.s3-ap-southeast-2.amazonaws.com/s3fs-public/draft-eastern-city-district-plan.pdf Pages 6. The District s freight routes, particularly
A number of goals were identified during the initial work on this Big Lake Transportation Plan.
 C. Transportation General Background Information Big Lake s transportation system includes all the roads, paths and facilities that allow the movement of private vehicles, trains and planes, as well as
4. Safety Concerns Potential Short and Medium-Term Improvements
 NH Route 104 Access Management Study Page 19 4. Safety Concerns Potential Short and Medium-Term Improvements Potential safety improvement strategies are listed by priority based on field observations by
Draft Greater Sydney Region Plan
 Powered by TCPDF (www.tcpdf.org) Draft Greater Sydney Region Plan Submission_id: 31119 Date of Lodgment: 12 Dec 2017 Origin of Submission: Online Organisation name: Serapark Pty Ltd Organisation type:
Main Line System Recommendations
 (Existing) Main Line System Recommendations This system recommendation focuses mobility investment in a central main line corridor proximate to I-290. A bus rapid transit (BRT) line at each end of the
PORTLAND NORTH INTER-CITY EXPRESS SERVICE Freeport-Yarmouth-Cumberland-Falmouth-Portland Concept Report June 2014
 Greater Portland Transit District PORTLAND NORTH INTER-CITY EXPRESS SERVICE Freeport-Yarmouth-Cumberland-Falmouth-Portland Concept Report June 2014 In February 2014, Metro s Board of Directors approved
4.0 Context for the Crossing Project
 4.0 Context for the Crossing Project This section provides background information about key features of the North Douglas Crossing project area, and opportunities and constraints. This information is important
I-95/395 HOV/Bus/HOT Lanes Project Overview
 I-95/395 HOV/Bus/HOT Lanes Project Overview 2 I-95/395 HOV/Bus/HOT Lanes Meetings Agenda 7 p.m. to 9 p.m. Open House Information Stations and Q&A With Project Staff 7:30 p.m. and 8:30 p.m. Project Overview
Agenda Item 5: Rail East Midlands Rail Franchise Consultation
 Strategic Transport Forum 15 th September 2017 Agenda Item 5: Rail East Midlands Rail Franchise Consultation Recommendation: It is recommended that the Forum agree (subject to any amendments agreed by
A VISION FOR I-95. January 12, Delaware Department of Transportation
 A VISION FOR I-95 January 12, 2011 Delaware Department of Transportation The East Coast s Main Street Along with SR 1, the most significant highway in Delaware 29 miles to I ".', 2 Sponsoring / Cooperating
FORECASTING FUTURE ACTIVITY
 EXECUTIVE SUMMARY The Eagle County Regional Airport (EGE) is known as a gateway into the heart of the Colorado Rocky Mountains, providing access to some of the nation s top ski resort towns (Vail, Beaver
Transportation Improvement District (TID) Exercise New Castle County Unified Development Code
 Exercise New Castle County Unified Development Code") Transportation Improvement District (TID) Exercise New Castle County Unified Development Code Churchmans Crossing TID How should New Castle County deploy Transportation Improvement Districts (TIDs)? Site
Transportation Improvement District (TID) Exercise New Castle County Unified Development Code Churchmans Crossing TID How should New Castle County deploy Transportation Improvement Districts (TIDs)? Site
Public Information Meetings. October 5, 6, 7, and 15, 2015
 Public Information Meetings October 5, 6, 7, and 15, 2015 Project Map 2 Project Context Only Interstate in the Country limited to HOV only traffic during rush hours Stoplight at the end of I-66 eastbound