The number of international student enrolments are provisional until the full year international student enrolment numbers are available.
|
|
|
- Rosalind Mills
- 5 years ago
- Views:
Transcription
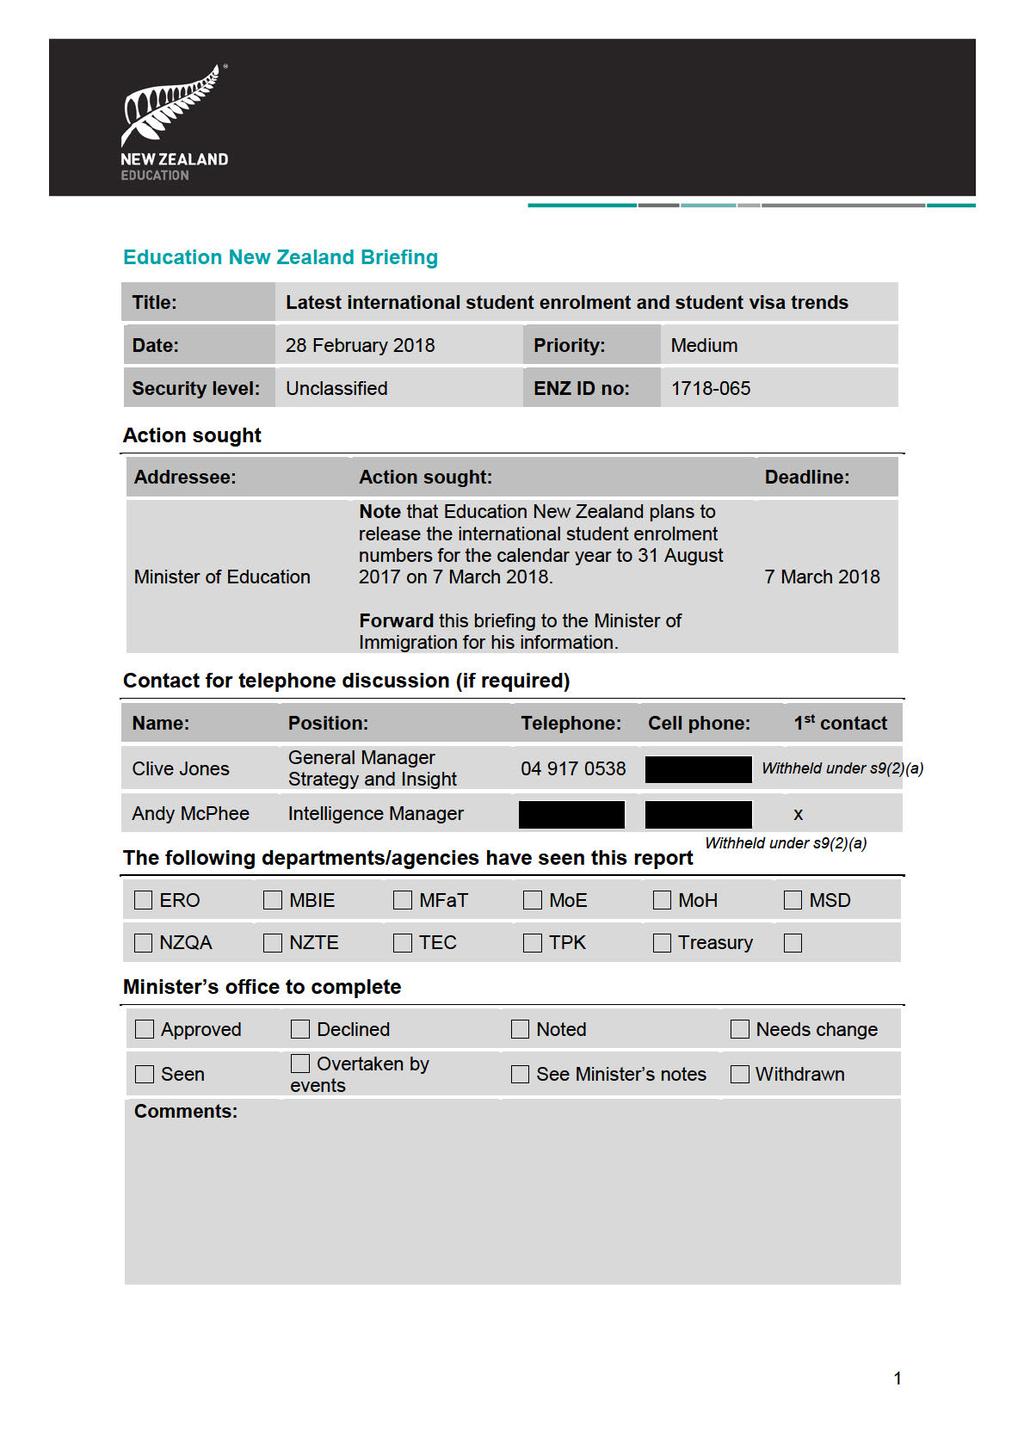
1
2
3 Purpose 1. This paper: explains the differences between student visa numbers and international student enrolment numbers, highlights certain issues with the data collected, and discusses why student visa numbers are used as a lead indicator for international student enrolment numbers summarises the provisional international student enrolment numbers for the calendar year to 31 August and the January 2018 student visa numbers. Background 2. International student enrolment numbers, and the sectors in which they study, are often used to assess the state of the international education industry. International student enrolment numbers are also important for industry planning, and for government policy makers. As the lead government agency for international education, Education New Zealand (ENZ) reports student visa and international student enrolment numbers to industry and government. 3. ENZ defines an international student as a non-resident who has expressly entered New Zealand with the intention of studying here or has enrolled with a New Zealander provider offshore. Included in this definition are international PhD students, exchange students, NZ Aid students, foreign research postgraduate students and full fee-paying international students. Those not counted as international students include Australian citizens and residents, work visa holders, dependents or partners of migrants working in New Zealand and dependents of foreign diplomats or military personnel. International student enrolment numbers 4. International student enrolment numbers are provided to ENZ by the Ministry of Education (MoE). The numbers are obtained from two sources: the single data return (SDR), completed each trimester by all institutions that receive government student funding 2 a manual system to capture the balance of international students from unfunded English language schools (ELS) and private training establishment (PTE) providers. 5. Sometimes providers submit their data late to the MoE, and the MoE needs to extract and cleanse the submitted data from a number of systems. Combined, these factors can delay the international student enrolment numbers being provided to ENZ. 1 The number of international student enrolments are provisional until the full year international student enrolment numbers are available. 2 These institutions include schools, intermediates, secondary schools, institutes of technology and polytechnics, universities, some English language schools and some private training establishments. 3
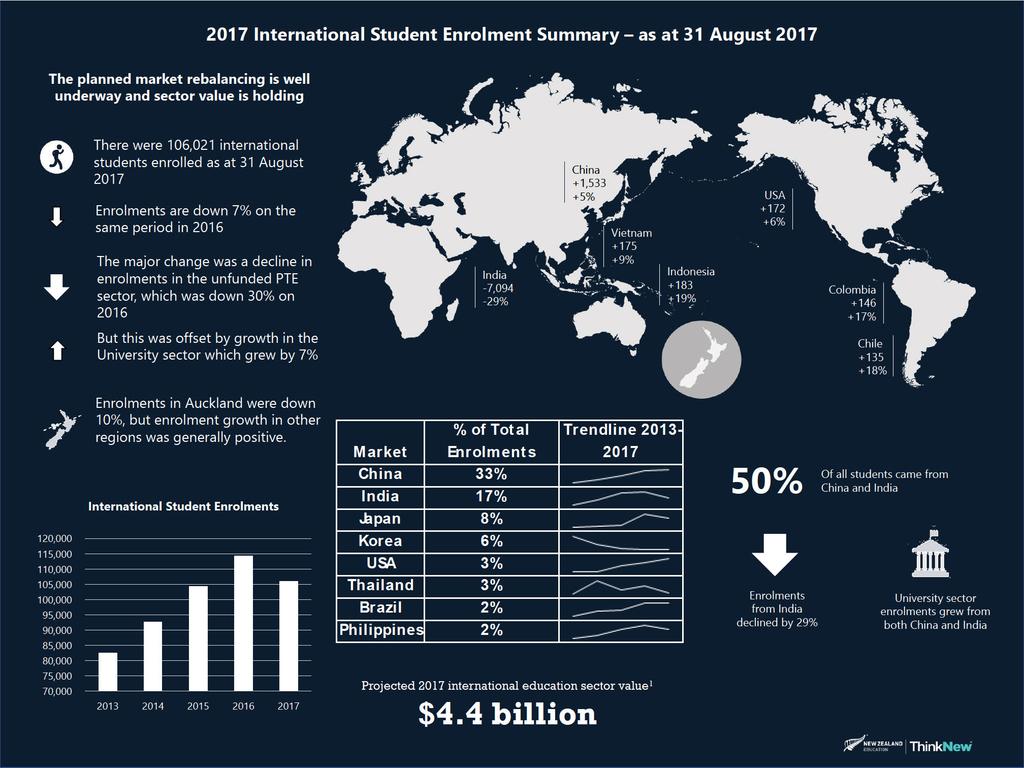
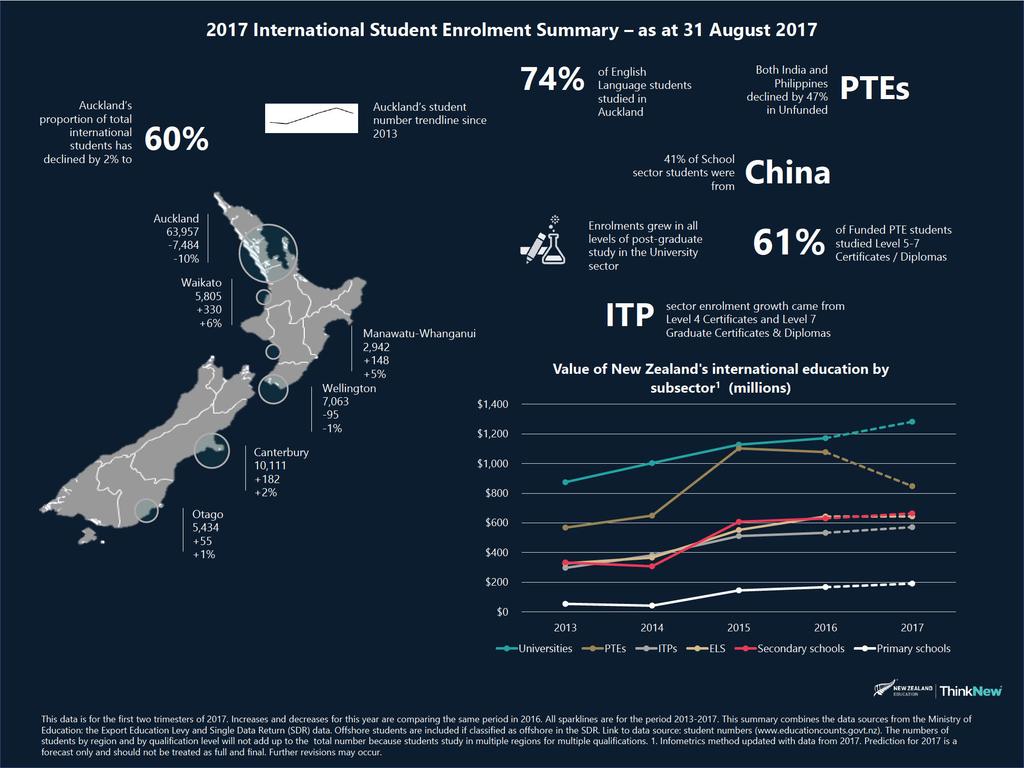
4 Provisional international student enrolment numbers 6. A summary of the provisional international student enrolments for the calendar year to 31 August 2017 is attached. This information has not yet been released by ENZ and will be made available on 7 March There were 106,021 international students enrolled with New Zealand providers in the calendar year to 31 August 2017, a 7% decrease compared to the same period in ENZ estimates that international education will contribute $4.4 billion to the New Zealand economy, slightly down from $4.5 billion in The overall decrease in international student enrolments was driven by a 30% decrease in the unfunded PTE sector, partially offset by a 7% increase in the university sector. In January to August 2017 there were more international university students enrolled than in the full 2016 year. 9. The decrease in the unfunded PTE sector also drove the 10% decrease in international students studying in Auckland, while growth in the university sector supported the increased international student enrolments in Canterbury, Manawatu-Whanganui and the Waikato. 10. Due to the lag in the availability of the international student enrolment numbers, ENZ uses the student visa numbers as a lead indicator. Student visa numbers 11. Non-New Zealand residents wishing to study here generally require a visa to enter New Zealand. However, people from visa waiver countries who enter New Zealand on a visitor visa are able to study on courses of three months duration or less without requiring a student visa 4. This predominantly affects the ELS sector and means international student enrolment numbers are greater than the number of student visas issued. 12. International students transitioning from unfunded to funded education providers can be double counted in international student enrolment numbers due to the reduced information collection requirements for unfunded providers. This is because students at unfunded PTEs and ELS do not receive the National Student Number which normally prevents double counting when students change providers. 13. An idiosyncrasy of the system is that total student visas are calculated by adding the total of first time student visas and returning student visas together. The second and any subsequent student visas issued to a person are counted as returning student visas, regardless of when those visas are issued. As a result, total student visa numbers can be artificially inflated, as shown below. 3 ENZ is currently undertaking a full economic value analysis of the industry for 2017 which includes surveying international students to find out how much they spend while studying in New Zealand. 4 There are approximately 60 visa waiver countries whose citizens can be granted visitors visas on arrival for stays of three months or less. Some visa waiver countries are major student markets such as Korea and Japan. 4
5 Ralph is an international student arriving from a non-visa waiver country and intends to study at a New Zealand university. To improve his English, he first enrols with an ELS for a short course and his first time student visa is issued. After completing the course, Ralph enters university. The visa gets reissued to reflect the change in provider. Now Ralph has had a first time student visa plus a returning student visa. The total student visa numbers have now been inflated by one. Paying for his tuition a semester at a time or changing providers will result in additional returning student visas being issued and inflate total student visa numbers, while the physical student count remains as one. 14. Due to this issue, ENZ focuses on first time student visas to indicate the number of new international students being attracted to New Zealand and valid student visas as a lead indicator for international student enrolment numbers. 15. Valid student visas are the number of people holding a student visa at the beginning of each month. Comparing valid student visas month on month, or month to month (for different years), can provide a more accurate measure of international student enrolment numbers than total student visas. ENZ still uses total student visas for some analysis as the valid student visa data does not contain some of the information contained in the total valid student visa data, such as whether the students are exchange students, vocational trainees, or dependants of migrants. 16. The graph below shows the difference between international student enrolment, total student visa 5 and valid student visa numbers. It identifies the artificial inflation in visa numbers between total student visas and valid student visas, along with the disparity between international student enrolment numbers and visas. The disparity is due to international students studying in New Zealand on non-student visas, such as visitor or work visas. 140, , ,000 80,000 60,000 40,000 20,000 Relationship between total student visa (TSV), valid student visa (VSV) and international student numbers TSV VSV Student enrolments 5 The uncharacteristic dipping in total student visas between 2015 and 2017 is likely to be due to the decrease in Indian students who had previously paid for their study on a trimester basis. 5
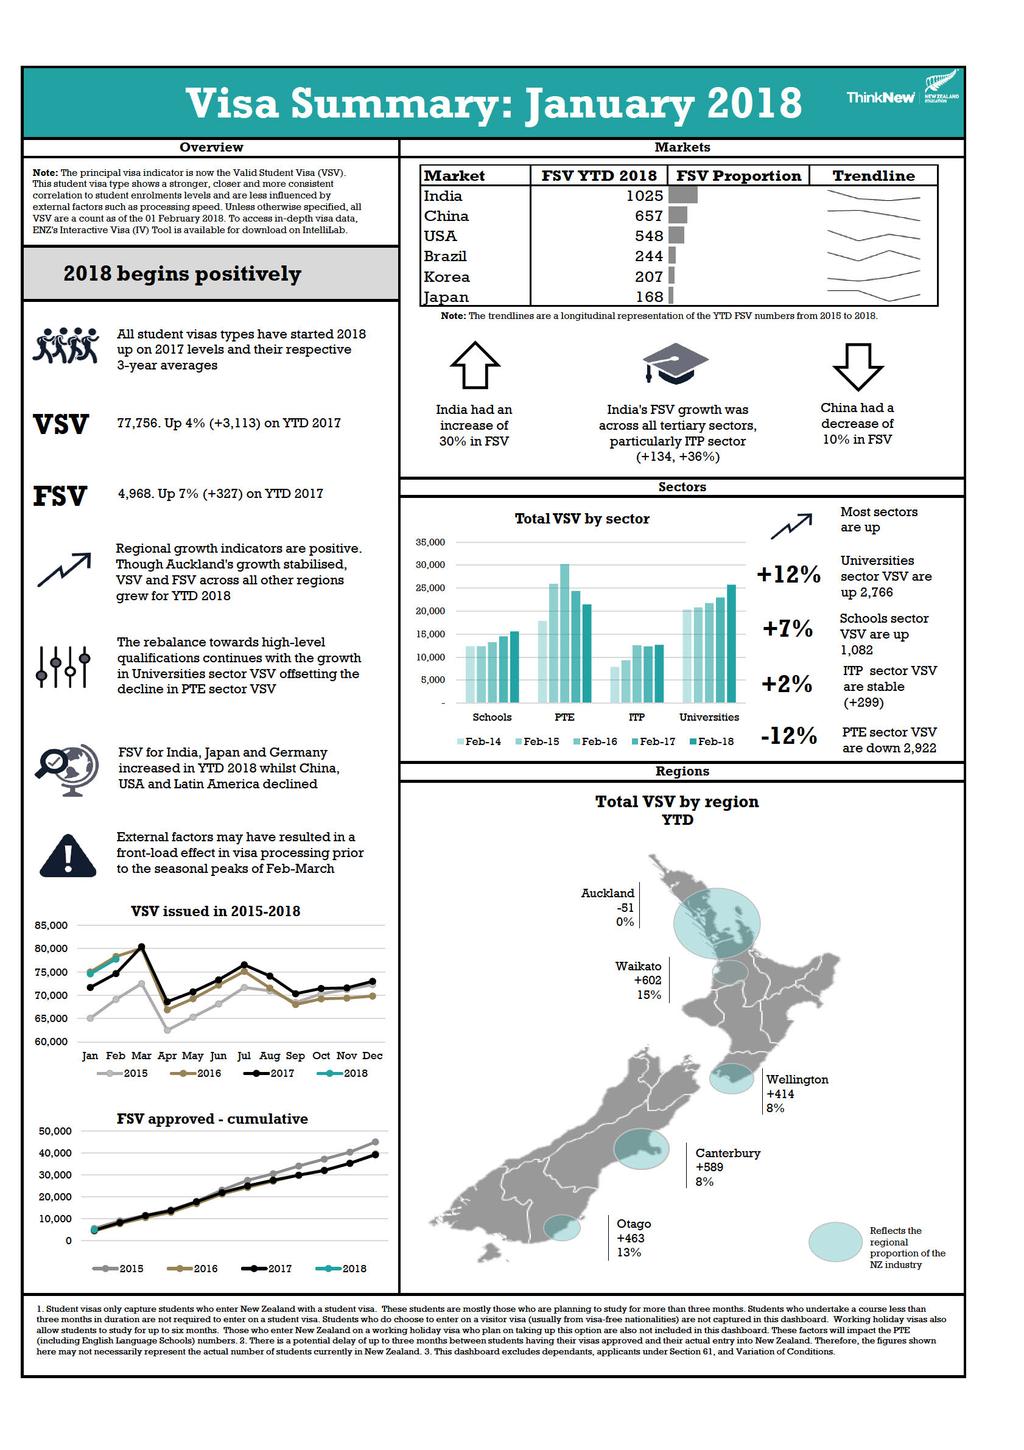
6 January 2018 student visa numbers 17. The attached January 2018 student visa numbers are the most recent student visa numbers available and were published by ENZ on 22 February The number of first time student visas approved in January 2018 was 7% higher than in January As the peak processing time for student visas is February to March, this increase may be due to the front-load effect when more international students apply for visas early, enabling Immigration New Zealand to process the visas ahead of the normal peak processing months. 19. The increase in first time student visa numbers was driven by India, Japan and Germany and was partly offset by decreases from China, the United States and Latin America. Notably, January 2018 saw a continuation of the trend in first time Chinese student visa numbers being below the first time student visa numbers from the same month in the previous year this trend started in May At 1 February 2018 there were 77,756 valid student visas, a 4% increase compared to 1 February The PTE sector, down 12%, was the only sector to see a decrease in valid student visas. The university sector had the largest increase in valid student visas with the rebalancing towards high-level qualifications continuing. Next steps 21. On 7 March 2018, ENZ will release the international student enrolment numbers for the calendar year to 31 August ENZ expects to receive the 2017 full year international student enrolment data from the MoE in the next few weeks. This will be one major input into ENZ s biennial economic valuation analysis of international education, which is currently underway. 6
7
8
9
English Australia. National ELICOS Market Report 2017: Executive Summary
 English Australia National ELICOS Market Report 2017: Executive Summary June 2018 A report prepared for English Australia by StudentMarketing, Ltd. June 2018 English Australia contact: Brett Blacker StudentMarkerketing
Queensland s International Education Tourism Paper
 July 2018 Queensland s International Education Tourism Paper 2025 Executive Summary International education is a high value market to Queensland s tourism and events industry due to international students
AUCKLAND DESTINATION OVERVIEW
 AUCKLAND DESTINATION OVERVIEW September 218 An in-depth overview of Auckland s visitor economy from the latest arrival, accommodation, spend, cruise and event data through to past five- commentary. Prepared
AUCKLAND DESTINATION OVERVIEW
 AUCKLAND DESTINATION OVERVIEW JULY 218 An in-depth overview of Auckland s visitor economy from the latest arrival, accommodation, spend and cruise data through to past five-year commentary. Prepared August
AUCKLAND DESTINATION OVERVIEW
 AUCKLAND DESTINATION OVERVIEW October 218 An in-depth overview of Auckland s visitor economy from the latest arrival, accommodation, spend, cruise and event data through to past five- commentary. Prepared
The Global market for ELT
 Leading Trend Indicators an ELICOS sector perspective Sue Blundell English Australia AIEC October 2006 The Global market for ELT Precise size unknown, however estimated value of US$9.2 billion in 2005
Regional delivery in the ITP sector
 Regional delivery in the ITP sector This document provides an overview of the institutes of technology and polytechnics (ITP) sector delivery by region, and highlights key changes since 212. Number of
Wakatipu Area Strategy Plan
 Wakatipu Area Strategy Plan September 2009 Executive Summary The Ministry of Education has developed an area strategy plan in response to population growth in the Wakatipu area. The Ministry predicts that
AUCKLAND DESTINATION OVERVIEW
 AUCKLAND DESTINATION OVERVIEW AUGUST 218 An in-depth overview of Auckland s visitor economy from the latest arrival, accommodation, spend and cruise data through to past five- commentary. Prepared September
AUCKLAND DESTINATION OVERVIEW
 AUCKLAND DESTINATION OVERVIEW JUNE 218 An in-depth overview of Auckland s visitor economy from the latest arrival, accommodation, spend and cruise data through to past five-year commentary. Prepared July
Briefing to the Incoming Minister. Education New Zealand November 2017
 Briefing to the Incoming Minister Education New Zealand November 2017 Contents Executive summary... 3 International education... 4 Education New Zealand... 10 How would you like to engage with ENZ?...
I T N E T R E N R A N T A I T ON O AL A L A R A R R I R VA V L A S L S A N A D N D D E D PA
 INTERNATIONAL ARRIVALS AND DEPARTURES July 2015 Government of Tonga SD18M-36 Statistical Bulletin Month of Change from Change from July 2015 Number previous month previous year All Arrivals 8,252-28.0
CONGESTION MONITORING THE NEW ZEALAND EXPERIENCE. By Mike Curran, Manager Strategic Policy, Transit New Zealand
 CONGESTION MONITORING THE NEW ZEALAND EXPERIENCE 26 th Australasian Transport Research Forum Wellington New Zealand 1-3 October 2003 By, Manager Strategic Policy, Transit New Zealand Abstract New Zealand
NEW ZEALAND REGIONAL TOURISM FORECASTS
 NEW ZEALAND REGIONAL TOURISM FORECASTS 21-216 QUEENSTOWN RTO AUGUST 21 www.tourismresearch.govt.nz Tourism Strategy Group Ministry of Economic Development Contents Introduction 1 1. Summary for Queenstown
RE: PROPOSED STRATEGIC ALLIANCE AGREEMENT BETWEEN AIR NEW ZEALAND AND SINGAPORE AIRLINES
 28 February 2014 Richard Cross Senior Adviser Ministry of Transport Dear Richard RE: PROPOSED STRATEGIC ALLIANCE AGREEMENT BETWEEN AIR NEW ZEALAND AND SINGAPORE AIRLINES Christchurch International Airport
Measuring travel services and tourism in New Zealand. October 2013
 Measuring travel services and tourism in New Zealand October 2013 Outline Travel in the New Zealand economy Different measures for travel and tourism How are travel and tourism statistics compiled? Publications
A rising ELICOS tide lifts all international education ships. So how do we navigate for future success?
 A rising ELICOS tide lifts all international education ships. So how do we navigate for future success? Brett Blacker English Australia AIEC 2015 1 The rising tide. Global context Data and trends Policy
International Tourism Snapshot
 Australia on a high International visitors to Australia Australia welcomed 7.8m international visitors in the year ending June International visitor expenditure in Australia 2017, more than any previous
International Tourism Snapshot
 International visitors to Australia Total holiday 4,447,000 5.0% 18.9-0.7% NZ 490,000-1.4% 7.5-9.4% Asia 2,292,000 8.6% 15.5-5.3% North America 496,000 4.6% 15.2-7.1% Europe 554,000 0.2% 38.5 8.3% UK 400,000
Land area 1.73 million km 2 Queensland population (as at 31 December 2017) Brisbane population* (preliminary estimate as at 30 June 2017)
 Brisbane population* (preliminary estimate as at 30 June 2017)") Queensland - 11 Queensland OVERVIEW Queensland is nearly five times the size of Japan, seven times the size of Great Britain, and two and a half times the size of Texas. Queensland is Australia s second
Queensland - 11 Queensland OVERVIEW Queensland is nearly five times the size of Japan, seven times the size of Great Britain, and two and a half times the size of Texas. Queensland is Australia s second
NEW ZEALAND REGIONAL TOURISM FORECASTS
 NEW ZEALAND REGIONAL TOURISM FORECASTS 21-216 NELSON RTO AUGUST 21 www.tourismresearch.govt.nz Tourism Strategy Group Ministry of Economic Development Contents Introduction 1 1. Summary for Nelson RTO
NEW ZEALAND REGIONAL TOURISM FORECASTS
 NEW ZEALAND REGIONAL TOURISM FORECASTS 21-216 LAKE TAUPO RTO AUGUST 21 www.tourismresearch.govt.nz Tourism Strategy Group Ministry of Economic Development Contents Introduction 1 1. Summary for Lake Taupo
NEW ZEALAND REGIONAL TOURISM FORECASTS
 NEW ZEALAND REGIONAL TOURISM FORECASTS 21-216 ROTORUA RTO AUGUST 21 www.tourismresearch.govt.nz Tourism Strategy Group Ministry of Economic Development Contents Introduction 1 1. Summary for Rotorua RTO
AFTA s 2017 Foreign Policy White Paper Submission
 AFTA s 2017 Foreign Policy White Paper Submission Page 1 of 10 About AFTA Ltd (AFTA) was founded in 1957 to: establish professional standards for travel agents; stimulate and promote travel; bring together
Passenger traffic growth rate slowed to 3.6% in August; air freight volumes increased by 4.8%
 Passenger traffic growth rate slowed to 3.6% in August; air freight volumes increased by 4.8% Montréal, 24 October Global airport passenger traffic lost momentum from a growth rate of 5.4% in July to 3.6%
Tourism Export Council New Zealand &
 Tourism Export Council New Zealand & Tourism Distribution Channels February 2015 Tourism Export Council who are we, what do we do? Founded 1971 Private sector 50 Inbound tour operator members (ITOs) 200
STATISTICAL BULLETIN ON MONTHLY MIGRATION STATISTICS DECEMBER 2016 SERIES NO. SDT: 39-M 55. Government of Tonga
 SERIES NO. SDT: 39-M 55 Government of Tonga STATISTICAL BULLETIN ON MONTHLY MIGRATION STATISTICS DECEMBER 2016 Statistics Department P.O. Box 149, Nuku alofa, Kingdom of Tonga Website: www.spc.int/prism/tonga/
Accommodation Survey: November 2009
 Embargoed until 10:45am 19 January 2010 Accommodation Survey: November 2009 Highlights Compared with November 2008: International guest nights were up 2 percent, while domestic guest nights were down 1
Youth/Backpacker Visitation to the Northern Territory. Year ending June 2017
 Youth/Backpacker Visitation to the Northern Territory Year ending June 2017 2 The following is a summary of information relevant to the Northern Territory tourism industry using visitation results from
International Visitation to the Northern Territory. Year ending September 2017
 International Visitation to the Northern Territory Year ending September 2017 The following is a summary of information relevant to the Northern Territory (NT) tourism industry including visitation results
September 20, Submitted via
 Department of Homeland Security U.S. Citizenship and Immigration Services Office of Policy and Strategy Chief, Regulatory Coordination Division 20 Massachusetts Avenue, NW Washington, DC 20529-2020 Submitted
From: OECD Tourism Trends and Policies Access the complete publication at:
 From: OECD Tourism Trends and Policies 2014 Access the complete publication at: http://dx.doi.org/10.1787/tour-2014-en New Zealand Please cite this chapter as: OECD (2014), New Zealand, in OECD Tourism
CRUISE TOURISM S CONTRIBUTION TO THE NEW ZEALAND ECONOMY 2017
 CRUISE TOURISM S CONTRIBUTION TO THE NEW ZEALAND ECONOMY 2017 21 August 2017 CRUISE TOURISM S CONTRIBUTION TO THE NEW ZEALAND ECONOMY 2017 Prepared for New Zealand Cruise Association Document reference:
Quick quarterly statistics
 Issue 21 tember 218 Quick quarterly statistics page 1 Economic activity quarterly page 2 Employment quarterly page 3 Household welfare quarterly page 4 Tourism activity annual page 5 Spotlight Cruise ship
Tourism Performance Report Q1 2018
 Tourism Performance Report Q1 2018 Introduction Qatar welcomed 535,302 visitors* in the first quarter of 2018, representing a 38% decline compared to the same quarter in 2017. This decline comes as a result
Visa Inbound Spend Report
 Visa Inbound Spend Report Visa Insights 2017 Visa Public Disclaimer Case studies, statistics, research and recommendations are provided "AS IS" and intended for informational purposes only and should not
AIR PASSENGER MARKET ANALYSIS
 Monthly RPK (Billions) Monthly FTK (Billions) Index of business confidence % change over year AIR PASSENGER MARKET ANALYSIS APRIL 2013 KEY POINTS Global revenue passenger kilometers were up 3.2% in April
STATISTICAL BULLETIN ON INTERNATIONAL ARRIVALS, DEPARTURES AND MIGRATION 2011 SERIES NO. SDT: Government of Tonga
 SERIES NO. SDT: 38-13 Government of Tonga STATISTICAL BULLETIN ON INTERNATIONAL ARRIVALS, DEPARTURES AND MIGRATION 2011 Statistics Department, P.O. Box 149, Nuku alofa, Kingdom of Tonga Website: www.spc.int/prism/tonga/
Transport Indicators Report June 2018
 Transport Indicators Report June 2018 Board Meeting 21 August 2018 Recommendation That the Board: i. Receives this report. Executive summary 1. The attached Monthly and Quarterly Indicator Reports provide
Exchange Rates and Tourism Relationships in New Zealand. Report to Ministry of Tourism
 Exchange Rates and Tourism Relationships in New Zealand Report to Ministry of Tourism July 2007 Preface NZIER is a specialist consulting firm that uses applied economic research and analysis to provide
VISITOR EXPECTATIONS SECTION
 30 VISITOR EXPECTATIONS SECTION NEW ZEALAND S REPUTATION AS A PREMIUM DESTINATION MEANS INTERNATIONAL VISITORS MAY ARRIVE WITH HIGH EXPECTATIONS. THESE EXPECTATIONS APPEAR TO HAVE BEEN MET OR EXCEEDED
Report on Target Market Trends
 Report on Target Market Trends Strengthening Tour Operator Associations in Bhutan and Costa Rica, a Bilateral Project Implemented by Association of Bhutanese Tour Operators and Ecole Experience under the
Statistical Bulletin: No: 13/2016
 Solomon Islands Government Statistical Bulletin: No: 13/2016 VISITOR STATISTICS (Second Quarter 2016) Solomon Islands National Statistics Office Ministry of Finance Honiara TABLE OF CONTENTS Introduction...
Victoria s International Tourism Performance
 Victoria s International Tourism Performance Results from International Visitor Survey (IVS) for the year ending December 2018 Data Source: Tourism Research Australia, released March 2019 To note: This
2013 International Visitation to North Carolina
 2013 International Visitation to North Carolina Visit North Carolina A Unit of the Economic Development Partnership of North Carolina Report developed in conjunction with Executive Summary Applying conservative
Expenditure Share of Visitors Visitor Expenditure expenditure nights per visitor
 Table 23 Modelled domestic overnight visitor expenditure (a) in the top 20 regions ranked by expenditure, including airfares and long distance transport costs Year ended 31 March 2010 (a) (b) Expenditure
Sources of Information
 Sources of Information Bureau of Immigration: Embarkment and Disembarkment information is collected from 24 Airports, 17 Seaports and 31 Land Checkposts. International Passenger Surveys: Provide Information
Summary of Public Submissions Received on
 Summary of Public Submissions Received on NPRM 15-01 Omnibus 2014 Prepared by DENISE RATIETA and PAUL ELTON 17 August 2015 Table of Contents General... 1 Summary of Submissions... 1 Definition of controlled
Commerce Committee. 2015/16 Estimates Examination. Vote Business, Science and Innovation. Tourism Portfolio
 Commerce Committee 2015/16 Estimates Examination Vote Business, Science and Innovation Tourism Portfolio Ministry of Business, Innovation and Employment Responses Supplementary Questions 124-131 June 2015
Domestic tourism in 2017
 Domestic tourism in 2017 1 2017 was a good year for domestic holidays in England Holiday trip volume equalled the record previously set in 2009 Holiday trip expenditure equalled the record previously set
Analysing the performance of New Zealand universities in the 2010 Academic Ranking of World Universities. Tertiary education occasional paper 2010/07
 Analysing the performance of New Zealand universities in the 2010 Academic Ranking of World Universities Tertiary education occasional paper 2010/07 The Tertiary Education Occasional Papers provide short
IATA ECONOMIC BRIEFING FEBRUARY 2007
 IATA ECONOMIC BRIEFING FEBRUARY 27 NEW AIRCRAFT ORDERS KEY POINTS New aircraft orders remained very high in 26. The total of 1,834 new orders for Boeing and Airbus commercial planes was down slightly from
New Zealand vehicle travel Data issues and trends. Prepared by Haobo Wang and Stuart Badger Transport Knowledge Hub seminar, November 2017
 New Zealand vehicle travel Data issues and trends Prepared by Haobo Wang and Stuart Badger Transport Knowledge Hub seminar, November 2017 Contents Background Data issues with VKT estimation Our proposed
Tourism Snapshot Year-in-review. Facts & Figures 6th edition.
 Tourism Snapshot 2011 Year-in-review www.canada.travel/corporate Facts & Figures 6th edition Tourism in the Canadian Economy Tourism Demand (2011) $ billions 11/10 % Total demand 78.8 7.5 Domestic 63.7
JUNE 2017 AUCKLAND ECONOMIC INSIGHTS SERIES ENGAGING GLOBALLY AUCKLAND S TRADING LINKAGES. aucklandnz.com/business nzier.org.nz
 AUCKLAND ECONOMIC INSIGHTS SERIES ENGAGING GLOBALLY AUCKLAND S TRADING LINKAGES aucklandnz.com/business nzier.org.nz JUNE 2017 4 AUCKLAND ECONOMIC INSIGHTS SERIES 1 2 3 4 Advanced Industries Auckland s
Tourism Performance Summary Q
 Tourism Performance Summary Q3 2017 www.visitqatar.qa Introduction In the first three quarters of 2017, Qatar welcomed 1.81 million visitors 1. This compares to 2.19 million visitors in the same period
2015 VISITOR ARRIVALS SUMMARY
 2015 VISITOR ARRIVALS SUMMARY 1. Arrivals Summary: Despite some challenges, Papua New Guinea received over 198,685 international visitors in 2015, an increase of 4% or additional 7,000 arrivals compared
AIR PASSENGER MARKET ANALYSIS
 AIR PASSENGER MARKET ANALYSIS OCTOBER 2014 KEY POINTS Air travel volumes were up 5.7% in October year-on-year, slightly stronger than the September rise of 5.2%, and a continuation of the positive growth
MAp today released its monthly report on traffic performance at its airports for September Key Traffic Results. Traffic Performance
 ASX Release 20 October 2010 MAp TRAFFIC PERFORMANCE SEPTEMBER 2010 MAp today released its monthly report on traffic performance at its airports for September 2010. Key Traffic Results Airport Sydney Traffic
International Tourism Snapshot
 International visitors to Australia International visits continue to grow Australia hosted a record number of international visitors in the year ending International visitor expenditure in Australia September
June TEQ Marketing Strategy 2025 Executive Summary
 June 2018 TEQ Marketing Strategy 2025 Executive Summary Vision and The Opportunity Tourism and Events Queensland s (TEQ) Marketing Strategy 2025 provides a platform to realise the TEQ vision of inspiring
Example report: numbers are for illustration purposes only
 www.iata.org/pax-forecast Example report: numbers are for illustration purposes only Country Report - United States Page Table of Contents 1 Market Overview 2 Top Country Pairs 3 Annual Market Regional
Tourism Snapshot. A focus on the markets in which the CTC and its partners are active. January 2013 Volume 9, Issue 1.
 Tourism Snapshot Nathan Phillips Square Skating Rink at City Hall Francisco Pardo A focus on the markets in which the CTC and its partners are active www.canada.travel/corporate January 2013 Volume 9,
August YTD : All sectors. Enrolments by country
 South American Market Update Tony Crooks Director International, University of Melbourne South American headlines ¾ August YTD enrolments over 3 years 24-27 up 17% ¾ Commencements up 191% same period ¾
O P T I O N A L P R A C T I C A L T R A I N I N G
 O P T I O N A L P R A C T I C A L T R A I N I N G DEFINING OPTIONAL PRACTICAL TRAINING (OPT) F-1 visa holders are eligible to participate in an aggregate total of 12 months of employment known as Optional
INTERNATIONAL TRAVEL AND TOURISM
 INTERNATIONAL TRAVEL AND TOURISM YEAR 2014 1. INTRODUCTION This issue of the Economic and Social Indicators presents data on International Travel and Tourism for the year 2014. A brief on the compilation
Aviation Trends Quarter
 Aviation Trends Quarter 4 214 Contents Introduction... 2 1. Historical overview of traffic see note 5 on p.15... 3 a. Terminal passengers... 4 b. Commercial flights... 5 c. Cargo tonnage... 6 2. Terminal
VISITOR ECONOMY STRATEGY
 ECONOMY STRATEGY WESTERN 6 6% GDP 3.5M NIGHTS 3.5m The Western Bay of Plenty subregion incorporates the Western Bay of Plenty District and Tauranga City. The Western Bay of Plenty District covers 212,000
Chart 2. International Student Nights in NSW
 International Student Visitors to NSW Year Ended March 2017 INTRODUCTION The International Education segment in Australia and NSW has had a resurgence and is growing. According to the Department of Education
Uncertainty in the demand for Australian tourism
 Uncertainty in the demand for Australian tourism ABSTR This paper conducts a visual examination of the data for both international tourist arrivals and for domestic tourism demand. The outcome of the examination
78 MILLION 150, domains in 28 languages LARGEST TRAVEL SIT E IN THE WORLD MIL LION.
 1 # LARGEST TRAVEL SIT E IN THE WORLD 225 MIL LION reviews & opinions 340 unique visitors a month businesses listed * MILLION 4.9 MILLION 78 MILLION members 150,000+ destinations 139 user contributions
29% the increase in visitors from the Philippines YE August
 The Philippines a growing Visitor Market Making Sense of the Numbers By the numbers. 22,784 international visitor arrivals from the Philippines YE August 2017. 29% the increase in visitors from the Philippines
Air transport demand shows continued resilience despite geopolitical pressure as passenger and freight traffic grow
 Air transport demand shows continued resilience despite geopolitical pressure as passenger and freight traffic grow Montreal, 7 August 2018 Airports Council International (ACI) World reported global passenger
2013 Research Agenda: Australian Universities International Directors Forum
 2013 Research Agenda: Australian Universities International Directors Forum Alan Olsen www.spre.com.au 9 October 2013 AUIDF Benchmarking Australian Universities International Directors Forum: 38 members
Regional summary - Wellington
 Regional summary Wellington Regional summary - Wellington This is a summary of data relevant to transportation in this region, viewed from a Land Transport NZ perspective. It s purpose is to inform the
DEFENCE - MAXIMISING OPPORTUNITIES
 DEFENCE - MAXIMISING OPPORTUNITIES A STRONG PLAN FOR REAL CHANGE 1 We re ready. Over the last four years, we ve been working hard developing our vision for the future of South Australia. Not just policies,
Presentation to Hong Kong-Canada Business Association Vancouver 31 October Yuen Pau Woo President & CEO Asia Pacific Foundation of Canada
 Presentation to Hong Kong-Canada Business Association Vancouver 31 October 2012 Yuen Pau Woo President & CEO Asia Pacific Foundation of Canada 1 The Asia Pacific Foundation of Canada (APFC) is an independent,
SERIES NO. SDT: Government of Tonga
 SERIES NO. SDT: 38-116 Government of Tonga Statistics Department P.O. Box 149, Nuku alofa, Kingdom of Tonga Website: www.spc.int/prism/tonga/ E-mail: dept@stats.gov.to April 2018 Price: Table of Contents
2013 Travel Survey. for the States of Guernsey Commerce & Employment Department RESEARCH REPORT ON Q1 2013
 213 Travel Survey for the States of Guernsey Commerce & Employment Department RESEARCH REPORT ON Q1 213 May 21st 213 Table of Contents Page No. Summary of Results 1 Survey Results 2 Breakdown of departing
III. TRADE IN COMMERCIAL SERVICES BY CATEGORY
 .. TRADE IN COMMERCIAL SERVICES BY CATEGORY Transportation services China records impressive growth Exports of world transportation services reached $750 billion in 2007, an increase of 19 per cent, following
Ontario Tourism Facts & Figures
 Winter 2006 Vol. 5, No. 4 Ontario Tourism Facts & Figures In This Issue Economic Outlook Canada and Ontario Tourism Statistics International Travel Account International Border Crossings Accommodations
Aviation Trends. Quarter Contents
 Aviation Trends Quarter 3 2014 Contents Introduction... 2 1. Historical overview of traffic... 3 a. Terminal passengers... 4 b. Commercial flights... 5 c. Cargo tonnage... 6 2. Terminal passengers at UK
Air passenger travel projection models. Haobo Wang, Ministry of Transport
 Air passenger travel projection models Haobo Wang, Ministry of Transport Contents Background Origin and destination based air passenger projections Leg-based air passenger projections Summary and implications
Tourism Snapshot. A focus on the markets that the CTC and its partners are active in. July 2011 Volume 7, Issue 7.
 Tourism Snapshot Echo Valley Ranch and Spa, British Columbia A focus on the markets that the CTC and its partners are active in www.canada.travel/corporate July 2011 Volume 7, Issue 7 Key highlights In
AIR PASSENGER MARKET ANALYSIS JANUARY 2015 KEY POINTS
 AIR PASSENGER MARKET ANALYSIS JANUARY 2015 KEY POINTS Global air travel was up 4.6% in January compared to a year ago, a slower start to the year when compared to the strong 5.8% expansion in 2014 overall.
Foreign Overnights in Finland 2016
 Foreign Overnights in Finland 2016 June 14, 2017 First name Last name 2 Positive outlook for Finland growing flows of visitors from several markets FOREIGN OVERNIGHTS 2016 5.8 million +4.7% growth 2016
Education and Tourism - Twins or distant cousins, what is the relationship? Dr Perry Hobson. Director THE-ICE AIEC, Melbourne October 11th, 2007
 Education and Tourism - Twins or distant cousins, what is the relationship? Dr Perry Hobson Director THE-ICE AIEC, Melbourne October 11th, 2007 When is a tourist an education tourist? If they enrol in
Palmerston North Retailing
 Palmerston North Retailing Introduction and General Experience My name is Peter Crawford and I am the Economic Policy Advisor for Palmerston North City Council. My qualifications include a BA (geography
Devonport-Takapuna Local Board Profile
 Devonport-Takapuna Local Board Profile - Initial results from the Census February 2014 Social and Economic Research Team Research, Investigations and Monitoring Unit Auckland Council Map of Devonport-Takapuna
Aviation Trends. Quarter Contents
 Aviation Trends Quarter 1 2013 Contents Introduction 2 1 Historical overview of traffic 3 a Terminal passengers b Commercial flights c Cargo tonnage 2 Terminal passengers at UK airports 7 3 Passenger flights
Tourism Snapshot A Monthly Monitor of the Performance of Canada s Tourism Industry
 Tourism Snapshot A Monthly Monitor of the Performance of Canada s Tourism Industry February 2017 Volume 13, Issue 2 www.destinationcanada.com Tourism Snapshot February 2017 1 KEY HIGHLIGHTS Canada welcomed
Tourism Snapshot A Monthly Monitor of the Performance of Canada s Tourism Industry
 Tourism Snapshot A Monthly Monitor of the Performance of Canada s Tourism Industry January 2017 Volume 13, Issue 1 Edmonton Tourism www.destinationcanada.com Tourism Snapshot January 2017 1 KEY HIGHLIGHTS
New Zealand Transport Outlook. Origin and Destination-Based International Air Passenger Model. November 2017
 New Zealand Transport Outlook Origin and Destination-Based International Air Passenger Model November 2017 Short name International Air Travel Forecasting Model Purpose of the model The Transport Outlook
Tourism Snapshot A focus on the markets in which the CTC and its partners are active
 Tourism Snapshot A focus on the markets in which the CTC and its partners are active www.canada.travel/corporate May Volume 1, Issue 5 Key highlights Total arrivals from CTC s international markets improved
TOURISM NEW ZEALAND OUR VISITORS UNDERSTANDING HISTORIC VIEW TOTAL ARRIVALS YE JUNE 2016
 TOURISM JAPAN 94K NEW ZEALAND UNDERSTANDING OUR VISITORS GERMANY 91K CHINA 397K 1 UK 214K 7% USA 258K 8% Our market infographics are drawn from two different sources. HISTORIC VIEW: Past Visitor Research
Tourism Snapshot A Monthly Monitor of the Performance of Canada s Tourism Industry
 Tourism Snapshot A Monthly Monitor of the Performance of Canada s Tourism Industry December 2015 Volume 11, Issue 12 www.destinationcanada.com Tourism Snapshot December 2015 1 2 Tourism Snapshot December
License Requirements and Leased Aircraft
 2017/TPTWG44/AEG/003d Agenda Item: 5.2 License Requirements and Leased Aircraft Purpose: Consideration Submitted by: AEG Chair Aviation Experts Group Meeting Taipei, Chinese Taipei 26-27 April 2017 International
AFTA Travel Trends. January 2019
 AFTA Travel Trends January 2019 AFTA Travel Trends Report 2019 Inbound and Outbound overview Introduction This snapshot provides an overview of the balance of trade between Inbound and Outbound Travel
FIXED-SITE AMUSEMENT RIDE INJURY SURVEY, 2013 UPDATE. Prepared for International Association of Amusement Parks and Attractions Alexandria, VA
 FIXED-SITE AMUSEMENT RIDE INJURY SURVEY, 2013 UPDATE Prepared for International Association of Amusement Parks and Attractions Alexandria, VA by National Safety Council Research and Statistical Services
New Zealand s 2011 Rugby World Cup: A Tourism Perspective
 New Zealand s 2011 Rugby World Cup: A Tourism Perspective Executive Summary... 3 Figure 1: Regional spread of international RWC visitors... 4 Figure 2: Seasonally adjusted monthly visitor numbers to New