FLORIDA TRANSPORTATION ALMANAC ON CD-ROM 1996, Center for Urban Transportation Research University of South Florida, Tampa July 1996
|
|
|
- Mildred Powers
- 6 years ago
- Views:
Transcription
1
2 FLORIDA TRANSPORTATION ALMANAC ON CD-ROM 1996, Center for Urban Transportation Research University of South Florida, Tampa July 1996
3 Florida Transportation Atlas The Atlas portion of this data product contains the following: 1. An atlas viewing program that allows users to view the map features included on the Compact Disc. 2. Public domain maps of Florida features, including: State and county boundaries Highways Railroads Airports Populated places 3. Public domain map coverage s for features in several popular formats: Atlas/BNA export Caliper Geographic File Comma Delimited ASCII DBF DXF ESRI Ungenerate MapInfo Interchange File The map files are available for users who have their own mapping software. A map viewer has been provided for users who do not have access to such software. To install the viewer: 1. Start up your computer, start up WINDOWS, and insert the CD. 2. From the Program Manager menu, select File, Run, and Browse. 3. Select the CD's drive letter and the file "install.exe" 4. Select "OK" two times and respond to install when prompted. For questions or comments please see the preface for address and phone information.
4 Table Of Contents Preface I ll lll lv V VI VII Demographics Travel Behavior Characteristics Personal Travel Journey to Work Travel MODAL STATISTICS Highways Toll Facilities Aviation Public Transportation Rail Seaports Transportation Demand Management Freight Intelligent Transportation Systems TOURISM TRANSPORTATION AND FINANCING TRANSPORTATION EDUCATION AND RESEARCH DIRECTORY APPENDIX A Transportation Related Acronyms Metric Conversion Chart INDEX
5 PREFACE The Center for Urban Transportation Research (CUTR) at the University of South Florida (USF) is pleased to introduce the 1995 Florida Transportation Almanac on CD-ROM. This is an updated version of the 1995 Florida Transportation Almanacthat was produced in soft cover in July This biennial publication provides an array of transportation-related statistics and information. The CD-ROM version is accompanied by the first Florida Transportation Atlas. The Almanac contains data from existing data sources throughout Florida and the United States. A range of transportation topics is covered, including demographic and travel behavior characteristics, modal statistics, tourism information, transportation finance information, transportation education and research information, and directories of transportation organizations throughout the state of Florida. Significant efforts were made to provide the most current information available; however, a uniform time span is impossible, given the wide range of topics that are included in the Almanac. The Almanac is comprised of eight major sections, as follows: Section 1, DEMOGRAPHICS, presents demographic information for the U.S., Florida, and the 67 counties in the state. All data are taken from the 1990 Census and previous. Section 2, TRAVEL BEHAVIOR CHARACTERISTICS, summarizes travel behavior characteristics and trends in Florida and the U.S. Summary statistics for all personal travel in the U.S. and Florida, as well as the aggregated metropolitan regions in Florida. In addition, characteristics of the journey to work are provided for the U.S., as well as for Florida and its counties. Section 3, MODAL STATISTICS, presents modal statistics for highways, aviation, public transportation, rail, seaports, transportation demand management activities, freight, and intelligent transportation systems (ITS). Section 4, TOURISM, focuses on tourism statistics for the state. Section 5, TRANSPORTATION FINANCING, presents summary data on transportation finance in Florida, including Florida s transportation tax and fee sources and transportation costs associated with the construction and operation of various modes, including highways, bridges, airports, public transportation, and bicycle and pedestrian facilities. Section, 6, TRANSPORTATION EDUCATION AND RESEARCH, presents an overview of the transportation education programs available at the state s universities and colleges and a summary of the activities of the state s transportation research organizations. Section 7, DIRECTORY, includes a listing of contact information for various transportationrelated organizations in Florida, including planning agencies, operating agencies, commissions, councils, and committees, among others. Section 8, MISCELLANEOUS, contains a list of frequently-used transportation acronyms and abbreviations, as well as a metric conversion chart. This publication was prepared to assist transportation planners, managers, decision makers, and
6 the general public by providing a compilation of transportation statistics and other transportationrelated information. The editors wish to acknowledge the assistance of all the individuals at the numerous agencies and organizations who provided information for and review of this publication. The Editors
7 Florida Transportation Almanac on CD-ROM Florida Transportation Atlas on CD-ROM 1996 Developed and produced by the Center for Urban Transportation Research College of Engineering, University of South Florida 4202 E. Fowler Avenue, ENB 118 Tampa, FL (813) , fax (813) Gary L. Brosch, Director World Wide Web: CUTR Project Team: Michael Baltes James L. Hatchitt Patricia Henderson Richard T. Stasiak
8 SECTION I: DEMOGRAPHICS F1.1 POPULATION GROWTH RATES, FLORIDA AND UNITED STATES ( ) F1.2 WORKER GROWTH RATES, FLORIDA AND UNITED STATES ( ) F1.3 HOUSEHOLD GROWTH RATES, FLORIDA AND UNITED STATES ( ) F1.4 HOUSEHOLD VEHICLE GROWTH RATES, FLORIDA AND UNITED STATES ( ) F1.5 LICENSED DRIVER GROWTH RATES, FLORIDA AND UNITED STATES ( ) F1.6 AVERAGE HOUSEHOLD SIZE FLORIDA AND UNITED STATES ( ) F1.7 WORKERS PER HOUSEHOLD, FLORIDA AND UNITED STATES ( ) F1.8 VEHICLES PER HOUSEHOLD, FLORIDA AND UNITED STATES ( ) F1.9 LICENSED DRIVERS PER HOUSEHOLD, FLORIDA AND UNITED STATES ( ) F1.10 LABOR FORCE PARTICIPATION RATES, FLORIDA AND UNITED STATES ( ) F1.11 GROWTH RATES IN VEHICLES PER CAPITA, FLORIDA AND UNITED STATES ( ) F1.12 PERCENT LICENSED DRIVERS, FLORIDA AND UNITED STATES ( ) F1.13 COMPARISON OF GROWTH RATES IN POPULATION CHARACTERISTICS, FLORIDA ( ) F1.14 ETHNIC ORIGIN, FLORIDA AND UNITED STATES ( ) F1.15 HISPANIC ORIGIN, FLORIDA AND UNITED STATES ( ) F1.16 INFLATION-ADJUSTED MEDIAN HOUSEHOLD INCOME, FLORIDA AND UNITED STATES ( ) F1.17 POVERTY LEVEL STATUS, FLORIDA AND UNITED STATES ( ) F1.18 AGE DISTRIBUTION, FLORIDA AND UNITE D STATES ( ) F1.19 EDUCATION LEVEL, FLORIDA AND UNITED STATES ( ) 1.1 FLORIDA POPULATION CHARACTERISTICS 1.2 UNITED STATES POPULATION CHARACTERISTICS 1.3 DEMOGRAPHIC TRENDS, FLORIDA ( ) 1.4 DEMOGRAPHIC TRENDS, UNITED STATES ( ) 1.5 DISTRIBUTION OF DEMOGRAPHIC CHARACTERISTICS, FLORIDA AND U.S. ( ) DEMOGRAHIC CHARACTERISTICS FOR FLORIDA COUNTIES (1990)
9 Figure 1-1 POPULATION GROWTH RATES, FLORIDA AND UNITED STATES ( ) 200% Figure 1-2 WORKER GROWTH RATES, FLORIDA AND UNITED STATES ( ) 300% 160% Florida United States 161% Florida United States 232% 120% 200% 80% 40% 0% 37% 44% 33% 39% 13% 11% 10% % 0% 78% 61% 42% 45% 19% 26% 19% Figure 1-3 HOUSEHOLD GROWTH RATES, FLORIDA AND UNITED STATES ( ) 300% 200% Florida United States 231% Figure 1-4 HOUSEHOLD BEHICLE GROWTH RATES, FLORIDA AND UNITED STATES ( ) 450% 375% 300% Florida United States 382% 225% 181% 100% 0% 64% 73% 47% 37% 20% 26% 14% % 75% 0% 95% 74% 64% 44% 43% 19%
10 Figure 1-5 LICENSED DRIVER GROWTH RATES, FLORIDA AND UNITED STATES ( ) 300% Figure 1-6 AVERAGE HOUSEHOLD SIZE, FLORIDA AND UNITED STATES ( ) 5.00 Florida United States 252% 4.00 Florida United States 200% % 102% 95% % 28% 32% 23% 15% % Figure 1-7 WORKERS PER HOUSEHOLD, FLORIDA AND UNITED STATES ( ) 2.00 Figure 1-8 VEHICLES PER HOUSEHOLD, FLORIDA AND UNITED STATES ( ) Florida 1.21 United States Florida United States
11 Figure 1-9 LICENSED DRIVER PER HOUSEHOLD, FLORIDA AND UNITED STATES ( ) 3.00 Figure 1-10 LABOR FORCE PARTICIPATION RATES, FLORIDA AND UNITED STATES ( ) 100% Florida United States 80% Florida United States % 55% 57% 53% 58% 56% 62% 60% 65% % 20% % Figure 1-11 GROWTH RATES IN VEHICLES PER CAPITA, FLORIDA AND UNITED STATES ( ) 120% 90% Florida United States 84% 103% Figure 1-12 PERCENT LICENSED DRIVERS, FLORIDA AND UNITED STATES ( ) 100% 75% 73% 70% 74% 77% 95% 84% 87% 86% 60% 47% 50% Florida United States 30% 27% 27% 36% 25% 7% 8% 0% %
12 Figure 1-13 COMPARISON OF GROWTH RATES IN POPULATION CHARACTERISTICS, FLORIDA ( ) Population Households 37% 44% 33% 47% 64% 37% 161% 231% Workers 42% 61% 45% 232% Household Vehicles 43% 74% 95% 382% Licensed Drivers 23% 42% 102% 252% 0% 75% 150% 225% 300% 375% 450%
13 100% 80% 60% 40% 82% Figure 1-14 ETHNIC ORIGIN, FLORIDA AND UNITED STATES ( ) Florida 84% 84% 83% 20% 18% 15% 14% 14% 0% <1% 0% <1% 0% <1% 0% <1% 0% White African-American Other 100% 80% 89% 88% United States 83% 80% 60% 40% 20% 0% 10% 11% 12% 12% 5% 1% 1% %
14 ETHNIC Figure ORIGIN, 1-14 FLORIDA Florida AND UNITED STATES ( ) 82% 84% 84% 83% 40% 60% 80% 100% 20% 0% 18% % <1%<1%<1%<1% 15% 0% 14% 0% 14% 0% 89% 40% 60% 80% 100% White African-American Other 8% United States 83% 80% 20% 10% 1% 12%5% 12%8% 0% % 1% 100% Figure 1-15 HISPANIC ORIGIN, FLORIDA AND UNITED STATES ( ) 80% 91% Florida 88% 91% United States 88% 60% 40% 20% 0% Not Hispanic 12% 9% Hispanic 12% 9% Figure 1-16 INFLATION-ADJUSTED MEDIAN HOUSEHOLD INOME, FLORIDA AND UNITED STATES ( ) 1960 $15,953 $16,186 Florida United States Figure 1-17 POVERTY LEVEL STATUS, FLORIDA AND UNITED STATES ( ) 100% 80% 84% 87% 87% 88% 87% 87% $18,474 $21,871 $17,809 $20,438 60% 40% Income > poverty level - FL Income > poverty level - U.S. Income < poverty level - FL Income < poverty level - U.S. $21, $22,996 $0 $10,000 $20,000 $30,000 20% 0% 16% 13% 13% 12% 13% 13%
15 Figure 1-18 AGE DISTRIBUTION, FLORIDA AND UNITED STATES ( ) 35% Florida 35% United States 28% 28% 21% 21% 14% 14% 7% 7% 0% <16 16 to to to to to % <16 16 to to to to to
16 Figure 1-19 EDUCATION LEVEL, FLORIDA AND UNITED STATES ( ) 50% Florida 50% United States 40% 40% 30% 30% 20% 20% 10% 10% 0% Less than 9th grade 9th grade to 12th grade high school graduate Some college Bachelor's degree Graduate or prof degree 0% Less than 9th grade 9th grade to 12th grade high school graduate Some college Bachelor's degree Graduate or prof degree
17 Population Characteristics Table 1-1 FLORIDA POPULATION CHARACTERISTICS FLORIDA Calendar Year Percent Change Population 4,951,560 6,789,443 9,746,324 12,937, % 43.55% 32.75% % Households 1,550,044 2,284,786 3,744,254 5,134, % 63.88% 37.14% % Number of Workers 1,745,044 2,473,256 3,984,836 5,794, % 61.12% 45.41% % Household Private Vehicles 1,678,599 2,914,293 5,678,172 8,091, % 94.84% 42.50% % Licensed Drivers 2,553,000 3,614,000 7,290,000 8,992, % % 23.35% % Persons per Household % % -3.20% % Workers per Household % -1.68% 6.03% 0.24% Vehicles per Household % 18.89% 3.91% 45.51% Licensed Drivers per Household % 23.09% % 6.32% Labor Force Participation Rate 55% 53% 56% 60% n/a n/a n/a n/a Vehicles per Capita % 35.73% 7.35% 84.48% Percent Licensed Drivers 73% 74% 95% 87% n/a n/a n/a n/a Source: Center for Urban Transportation Research,Demographics and Commuting Trends in Florida(February 1994), p. 4.
18 Population Characteristics Table 1-2 UNITED STATES POPULATION CHARACTERISTICS FLORIDA Calendar Year Percent Change Population 179,323, ,211, ,545, ,709, % 11.48% 9.78% 38.69% Households 53,021,061 63,449,747 80,389,673 91,947, % 26.70% 14.38% 73.42% Number of Workers 64,655,805 76,852,389 96,617, ,070, % 25.72% 19.10% 77.97% Household Private Vehicles 54,766,718 79,002, ,747, ,832, % 64.23% 18.56% % Licensed Drivers 84,498, ,295, ,284, ,912, % 32.31% 15.09% 95.17% Persons per Household % % -4.02% % Workers per Household % -0.77% 4.13% 2.63% Vehicles per Household % 29.63% 3.66% 61.97% Licensed Drivers per Household % 4.43% 0.63% 12.54% Labor Force Participation Rate 57% 58% 62% 65% n/a n/a n/a n/a Vehicles per Capita % 47.32% 8.00% % Percent Licensed Drivers 70% 77% 84% 86% n/a n/a n/a n/a Source: Center for Urban Transportation Research,Demographics and Commuting Trends in Florida(February 1994), p. 4.
19 Demographic Characteristics Gender Table 1-3 DEMOGRAPHIC TRENDS, FLORIDA ( ) Calendar Year FLORIDA Percent Change Male 2,436,783 3,275,571 4,675,626 6,261, % 42.74% 33.92% % Female 2,514,777 3,513,872 5,070,698 6,676, % 44.31% 31.66% % Ethnic Origin White 4,063,881 5,719,343 8,184,513 10,749, % 43.10% 31.34% % African American 880,186 1,041,651 1,342,688 1,759, % 28.90% 31.05% 99.90% Other 7,493 28, , , % % 95.83% 5, Hispanic Origin Not Hispanic n/a n/a 8,888,166 11,363,783 n/a n/a 27.85% n/a Hispanic n/a n/a 858,158 1,574,143 n/a n/a 83.43% n/a Age < 16 years 1,466,814 1,874,098 2,034,189 2,561, % 8.54% 25.91% 74.61% 16 to 19 years 337, , , , % 44.49% -0.58% 92.64% 20 to 29 years 594, ,613 1,551,275 1,922, % 72.44% 23.94% % 30 to 39 years 666, ,077 1,225,803 2,021, % 71.66% 64.92% % 40 to 59 years 1,111,403 1,500,779 2,028,907 2,733, % 35.19% 34.75% % 60 to 64 years 221, , , , % 57.32% 20.26% % 65+ years 553, ,366 1,687,573 2,369, % 70.57% 40.40% % Education Level Less than 9th grade 1,066,616 1,104,113 1,101, , % -0.24% % % 9th grade to 12th grade 567, , ,519 1,428, % 26.09% 45.52% % High school graduate 713,661 1,219,216 2,189,572 2,679, % 79.59% 22.37% % Some college 275, ,864 1,047,471 2,312, % % % % Bachelor's degree 144, , ,452 1,062, % % 99.20% % Graduate or prof degree 76, , , , % % 41.61% % Disability Status With work disability n/a n/a n/a 1,345,289 n/a n/a n/a n/a No work disability n/a n/a n/a 8,756,870 n/a n/a n/a n/a Median Household Income Nominal income $4,722 $7,168 $14,675 $27, % % 87.28% % Inflation-adjusted $15,953 $18,474 $17,809 $21, % -3.60% 18.07% 31.81% Poverty Status in 1989 Income above poverty level n/a 5,701,218 8,459,268 11,037,300 n/a 48.38% 30.48% n/a Income below poverty level n/a 1,088,225 1,287,056 1,604,186 n/a 18.27% 24.64% n/a Source: Center for Urban Transportation Research, Demographic and Commuting Trends in Florida (February 1994).
20 Demographic Characteristics Gender Table 1-4 DEMOGRAPHIC TRENDS, UNITED STATES ( ) Calendar Year UNITED STATES Percent Change Male 88,331,494 98,912, ,053, ,239, % 11.26% 10.16% 37.26% Female 90,991, ,299, ,492, ,470, % 11.69% 9.42% 40.09% Ethnic Origin White 158,831, ,748, ,371, ,686, % 5.98% 6.01% 25.72% African American 18,871,831 22,580,289 26,495,025 29,986, % 17.34% 13.18% 58.89% Other 1,619,612 2,882,662 11,679,158 19,037, % % 63.01% 1,075.45% Hispanic Origin Not Hispanic n/a n/a 211,937, ,355,814 n/a n/a 6.80% n/a Hispanic n/a n/a 14,608,673 22,354,059 n/a n/a 53.02% n/a Age < 16 years 58,542,789 61,929,086 55,350,237 56,889, % % 2.78% -2.82% 16 to 19 years 10,462,627 15,041,314 17,108,226 14,432, % 13.74% % 37.94% 20 to 29 years 21,669,885 29,848,014 40,839,623 40,333, % 36.83% -1.24% 86.13% 30 to 39 years 24,430,295 22,537,287 31,526,222 41,826, % 39.88% 32.67% 71.21% 40 to 59 years 40,515,547 45,173,939 46,084,449 53,370, % 2.02% 15.81% 31.73% 60 to 64 years 7,142,452 8,616,784 10,087,621 10,616, % 17.07% 5.24% 48.63% 65+ years 16,559,580 20,065,502 25,549,427 31,241, % 27.33% 22.28% 88.66% Education Level Less than 9th grade 39,499,342 31,087,390 24,257,683 16,502, % % % % 9th grade to 12th grade 19,115,915 21,285,922 20,277,514 22,841, % -4.74% 12.64% 19.49% High school graduate 24,455,488 34,158,051 45,947,035 47,642, % 34.51% 3.69% 94.81% Some college 8,742,070 11,650,730 20,794,975 39,571, % 78.49% 90.29% % Bachelor's degree 4,613,367 6,657,604 11,420,499 20,832, % 71.54% 82.41% % Graduate or prof degree 3,011,906 5,059,662 10,137,981 11,477, % % 13.21% % Disability Status With work disability n/a n/a n/a 22,537,613 n/a n/a n/a n/a No work disability n/a n/a n/a 164,349,820 n/a n/a n/a n/a Median Household Income Nominal income $4,791 $8,486 $16,841 $30, % 98.46% 78.47% % Inflation-adjusted $16,186 $21,871 $20,438 $22, % -6.55% 12.52% 42.08% Poverty Status in 1989 Income above poverty level n/a 176,003, ,153, ,234,995 n/a 13.15% 5.56% n/a Income below poverty level n/a 27,208,583 27,392,580 31,742,855 n/a 0.68% 15.88% n/a Source: Center for Urban Transportation Research,Demographic and Commuting Trends in Florida (February 1994).
21 Table 1-5 DISTRIBUTION OF DEMOGRAPHIC CHARACTERISTICS, FLORIDA AND U.S. ( ) Demographic Characteristics Florida United States Gender Male 49.2% 48.2% 48.0% 48.4% 49.3% 48.7% 48.6% 48.7% Female 50.8% 51.8% 52.0% 51.6% 50.7% 51.3% 51.4% 51.3% Ethnic Origin White 82.1% 84.2% 84.0% 83.1% 88.6% 87.5% 83.1% 80.3% African-American 17.8% 15.3% 13.8% 13.6% 10.5% 11.1% 11.7% 12.1% Other 0.2% 0.4% 2.2% 3.3% 0.9% 1.4% 5.2% 7.7% Hispanic Origin Not Hispanic n/a n/a 91.2% 87.8% n/a n/a 93.6% 91.0% Hispanic n/a n/a 8.8% 12.2% n/a n/a 6.4% 9.0% Age < 16 years 29.6% 27.6% 20.9% 19.8% 32.6% 30.5% 24.4% 22.9% 16 to 19 years 6.8% 6.7% 6.7% 5.0% 5.8% 7.4% 7.6% 5.8% 20 to 29 years 12.0% 13.3% 15.9% 14.9% 12.1% 14.7% 18.0% 16.2% 30 to 39 years 13.5% 10.5% 12.6% 15.6% 13.6% 11.1% 13.9% 16.8% 40 to 59 years 22.4% 22.1% 20.8% 21.1% 22.6% 22.2% 20.3% 21.5% 60 to 64 years 4.5% 5.3% 5.8% 5.2% 4.0% 4.2% 4.5% 4.3% 65+ years 11.2% 14.6% 17.3% 18.3% 9.2% 9.9% 11.3% 12.6% Education Level Less than 9th grade 37.5% 27.8% 17.6% 9.5% 39.7% 28.3% 18.3% 10.4% 9th grade to 12th grade 20.0% 19.6% 15.7% 16.1% 19.2% 19.4% 15.3% 14.4% High school graduate 25.1% 30.7% 35.0% 30.1% 24.6% 31.1% 34.6% 30.0% Some college 9.7% 11.6% 16.8% 26.0% 8.8% 10.6% 15.7% 24.9% Bachelor's degree 5.1% 6.3% 8.5% 12.0% 4.6% 6.1% 8.6% 13.1% Graduate or prof degree 2.7% 4.0% 6.3% 6.3% 3.0% 4.6% 7.6% 7.2% Disability Status With work disability n/a n/a n/a 13.3% n/a n/a n/a 12.1% No work disability n/a n/a n/a 86.7% n/a n/a n/a 87.9% Poverty Status in 1989 Income above poverty level n/a 84.0% 86.8% 87.3% n/a 86.6% 87.9% 86.9% Income below poverty level n/a 16.0% 13.2% 12.7% n/a 13.4% 12.1% 13.1% Source: Center for Urban Transportation Research,Demographic and Commuting Trends in Florida (February 1994).
22 Demographic Characteristics Table 1-6 DEMOGRAPHIC CHARACTERISTICS FOR FLORIDA COUNTIES (1990) Alachua Baker Bay Bradford Brevard Broward Calhoun Charlotte Gender Male 89,128 9,655 62,562 12, , ,177 5,704 53,512 Female 92,468 8,831 64,432 10, , ,311 5,307 57,463 Ethnic Origin White 140,787 15, ,570 17, ,391 1,025,583 9, ,401 African-American 34,427 2,768 13,713 4,555 31, ,447 1,658 4,243 Other 6, , ,170 36, ,331 Hispanic Origin Not Hispanic 174,817 18, ,738 22, ,717 1,147,049 10, ,211 Hispanic 6, , , , ,764 Age < 16 years 35,616 5,015 28,836 4,795 78, ,131 2,570 15, to 19 years 15,422 1,189 7,121 1,191 18,827 53, , to 29 years 45,576 2,976 20,220 3,637 59, ,771 1,646 10, to 39 years 29,725 3,277 21,040 4,154 64, ,444 1,727 11, to 59 years 32,548 3,918 28,421 5,007 88, ,387 2,345 21, to 64 years 5, ,097 1,007 22,723 58, , years 16,910 1,476 15,259 2,724 66, ,740 1,596 37,489 Education Level Less than 9th grade 6,429 1,620 7,820 2,251 15,060 69,372 1,394 6,317 9th grade to 12th grade 14,734 2,920 16,380 3,918 42, ,073 2,183 16,910 High school graduate 27,380 4,960 29,234 6,332 94, ,975 2,514 35,911 Some college 35,004 2,130 21,462 2,690 75, ,005 1,116 17,582 Bachelor's degree 22, , , , ,422 Graduate or prof degree 17, , ,864 57, ,576 Disability Status With work disability 14,841 1,847 15,096 2,723 41, ,800 1,605 16,009 No work disability 127,716 9,716 76,562 11, , ,809 5,775 76,892 Median Household Income Nominal Income $22,084 $25,816 $24,684 $24,625 $30,534 $30,571 $18,615 $25,746 Inflation-Adjusted $16,897 $19,752 $18,886 $18,841 $23,362 $23,390 $14,243 $19,699 Poverty Status in 1989 Income above poverty level 130,523 13, ,088 16, ,472 1,113,102 8,106 99,889 Income below poverty level 40,073 2,638 17,910 3,023 35, ,311 1,873 8,154 Source: Center for Urban Transportation Research,Florida Demographics and Journey to Work (May 1993).
23 Demographic Characteristics Table 1-7 DEMOGRAPHIC CHARACTERISTICS FOR FLORIDA COUNTIES (1990) Citrus Clay Collier Columbia Dade Desoto Dixie Duval Gender Male 44,711 52,272 75,386 20, ,411 12,316 5, ,737 Female 48,804 53,714 76,713 21,673 1,008,683 11,549 5, ,234 Ethnic Origin White 90,411 97, ,073 34,423 1,413,015 19,141 9, ,604 African-American 2,206 5,513 6,986 7, ,993 3, ,902 Other 898 2,782 6, , ,465 Hispanic Origin Not Hispanic 91, , ,365 41, ,687 21,583 10, ,638 Hispanic 1,702 2,764 20, ,407 2, ,333 Age < 16 years 14,589 27,080 27,258 10, ,425 4,954 2, , to 19 years 3,409 6,584 6,255 2, ,265 1, , to 29 years 8,257 15,692 19,750 5, ,538 3,365 1, , to 39 years 10,320 18,405 21,531 6, ,127 3,377 1, , to 59 years 19,374 25,644 32,153 9, ,117 4,908 2, , to 64 years 8,283 3,597 10,569 2,072 90,816 1, , years 29,283 8,984 34,583 5, ,806 4,623 1,560 71,794 Education Level Less than 9th grade 7,363 3,997 10,457 3, ,403 3,355 1,285 32,115 9th grade to 12th grade 16,966 11,014 16,930 6, ,562 5,143 2,145 84,338 High school graduate 28,267 24,375 37,107 10, ,454 5,513 2, ,517 Some college 13,053 17,820 24,919 5, ,164 2,319 1, ,322 Bachelor's degree 5,038 8,278 16,949 1, , ,879 Graduate or prof degree 2,589 3,919 8,232 1,228 98, ,866 Disability Status With work disability 15,011 8,549 13,667 5, ,391 3,520 2,045 62,861 No work disability 62,751 64, ,392 25,499 1,339,463 13,352 5, ,133 Median Household Income Nominal Income $21,285 $34,860 $34,001 $21,961 $26,909 $20,962 $15,380 $28,513 Inflation-Adjusted $16,285 $26,672 $26,015 $16,803 $20,588 $16,038 $11,767 $21,816 Poverty Status in 1989 Income above poverty level 80,433 97, ,172 33,055 1,561,381 17,600 7, ,566 Income below poverty level 11,550 7,406 15,762 8, ,261 4,197 2,743 83,815 Source: Center for Urban Transportation Research,Florida Demographics and Journey to Work (May 1993).
24 Demographic Characteristics Table 1-8 DEMOGRAPHIC CHARACTERISTICS FOR FLORIDA COUNTIES (1990) Escambia Flagler Franklin Gadsen Gilchrist Glades Gulf Hamilton Gender Male 127,599 13,756 4,378 19,535 5,108 3,848 5,779 5,727 Female 135,199 14,945 4,589 21,570 4,559 3,743 5,725 5,203 Ethnic Origin White 201,235 25,831 7,776 16,686 8,761 5,987 9,253 6,448 African-American 52,618 2,366 1,112 23, ,162 4,256 Other 8, Hispanic Origin Not Hispanic 257,785 27,441 8,902 40,141 9,517 6,986 11,418 10,635 Hispanic 5,013 1, Age < 16 years 59,334 4,895 1,906 10,777 2,107 1,637 2,468 2, to 19 years 16,796 1, , to 29 years 44,629 2,699 1,060 5,876 1, ,606 1, to 39 years 41,620 3,603 1,175 6,530 1, ,652 1, to 59 years 57,328 6,247 2,195 8,330 2,152 1,729 2,675 2, to 64 years 11,796 2, , years 31,295 7,345 1,614 5,185 1,332 1,490 1,760 1,245 Education Level Less than 9th grade 13,637 1,479 1,126 4,878 1, ,036 1,279 9th grade to 12th grade 31,367 3,644 1,700 6,729 1,768 1,541 1,970 1,967 High school graduate 57,033 7,730 2,152 8,985 2,382 1,987 3,229 2,915 Some college 46,936 5, ,240 1, , Bachelor's degree 22,589 2, , Graduate or prof degree 9,952 1, Disability Status With work disability 29,305 3,536 1,313 5,174 1,317 1,187 1,642 1,327 No work disability 160,538 20,088 5,612 23,309 5,367 4,677 6,978 5,701 Median Household Income Nominal Income $25,158 $28,628 $17,247 $19,985 $20,632 $20,687 $21,866 $18,709 Inflation-Adjusted $19,249 $21,904 $13,196 $15,291 $15,786 $15,828 $16,730 $14,314 Poverty Status in 1989 Income above poverty level 209,669 25,878 6,428 28,246 7,191 6,424 9,162 7,067 Income below poverty level 43,010 2,658 2,332 10,962 1,527 1,047 1,895 2,725 Source: Center for Urban Transportation Research,Florida Demographics and Journey to Work (May 1993).
25 Demographic Characteristics Table 1-9 DEMOGRAPHIC CHARACTERISTICS FOR FLORIDA COUNTIES (1990) Hardee Hendry Hernando Highlands Hillsborough Holmes Indian River Gender Male 9,885 13,058 48,483 32, ,217 8,008 43,578 Female 9,614 12,715 52,632 35, ,837 7,770 46,630 Ethnic Origin White 16,382 18,592 96,108 59, ,352 14,740 81,418 African-American 1,034 4,311 3,895 6, , ,660 Other 2,083 2,870 1,112 1,849 33, ,130 Hispanic Origin Not Hispanic 14,937 20,016 98,153 64, ,146 15,602 87,504 Hispanic 4,562 5,757 2,962 3, , ,704 Age < 16 years 5,079 7,204 16,475 11, ,922 3,417 15, to 19 years 1,228 1,702 4,116 2,675 45, , to 29 years 2,691 3,860 9,080 6, ,549 2,196 9, to 39 years 2,635 3,779 11,079 7, ,072 2,289 11, to 59 years 3,887 5,342 20,323 12, ,172 3,666 17, to 64 years 1,017 1,061 8,994 5,718 35, , years 2,962 2,825 31,048 22, ,133 2,474 24,592 Education Level Less than 9th grade 3,563 3,859 6,729 5,820 51,926 2,193 5,064 9th grade to 12th grade 2,758 4,071 17,693 12, ,195 2,793 12,868 High school graduate 4,393 5,531 30,708 19, ,094 4,021 22,320 Some college 1,560 2,004 15,265 9, ,328 1,482 15,243 Bachelor's degree 697 1,079 4,958 3,666 80, ,071 Graduate or prof degree ,583 2,085 36, ,988 Disability Status With work disability 2,618 2,633 15,888 10,425 80,545 2,573 10,608 No work disability 11,546 15,602 67,783 45, ,333 8,909 62,897 Median Household Income Nominal Income $22,065 $24,904 $22,741 $21,146 $28,477 $17,241 $28,961 Inflation-Adjusted $16,882 $19,054 $17,399 $16,179 $21,788 $13,191 $22,158 Poverty Status in 1989 Income above poverty level 14,846 20,429 88,939 57, ,753 11,185 80,818 Income below poverty level 4,394 4,769 10,970 10, ,772 3,658 7,748 Source: Center for Urban Transportation Research,Florida Demographics and Journey to Work (May 1993).
26 Demographic Characteristics Table 1-10 DEMOGRAPHIC C HARACTERISTICS FOR FLORIDA COUNTIES (1990) Jackson Jefferson Lafayette Lake Lee Leon Levy Liberty Gender Male 20,982 5,401 3,214 72, ,917 92,601 12,397 3,172 Female 20,393 5,895 2,364 79, ,196 99,892 13,526 2,397 Ethnic Origin White 30,085 6,334 4, , , ,712 22,346 4,508 African-American 10,845 4, ,191 22,184 46,527 3, Other ,294 6,729 4, Hispanic Origin Not Hispanic 40,401 11,166 5, , , ,778 25,433 5,461 Hispanic ,305 15,094 4, Age < 16 years 8,832 2,905 1,201 26,958 58,882 38,715 5,577 1, to 19 years 3, ,557 13,634 15,867 1, to 29 years 6,051 1,384 1,027 15,967 40,990 45,840 2, to 39 years 6,288 1, ,710 45,905 32,868 3,500 1, to 59 years 9,052 2,449 1,214 30,984 69,209 37,518 5,857 1, to 64 years 1, ,142 23,490 5,881 1, years 6,170 1, ,786 83,003 15,804 4, Education Level Less than 9th grade 5,445 1, ,105 18,317 6,254 2, th grade to 12th grade 6,549 1,547 1,039 24,819 45,733 13,534 4,633 1,188 High school graduate 9,531 2,607 1,503 43,113 91,592 29,549 6,989 1,397 Some college 5,044 1, ,878 57,323 37,295 2, Bachelor's degree 1, ,607 27,281 27,653 1, Graduate or prof degree 1, ,897 14,097 17, Disability Status With work disability 6,606 1, ,077 39,331 12,462 4, No work disability 22,746 6,638 3, , , ,197 15,432 2,696 Median Household Income Nominal Income $19,471 $21,782 $20,744 $23,395 $28,448 $27,323 $18,807 $22,253 Inflation-Adjusted $14,897 $16,666 $15,871 $17,900 $21,766 $20,905 $14,389 $17,026 Poverty Status in 1989 Income above poverty level 29,281 8,584 3, , , ,990 20,093 3,782 Income below poverty level 8,533 2,495 1,140 16,517 30,267 30,838 5, Source: Center for Urban Transportation Research,Florida Demographics and Journey to Work (May 1993).
27 Demographic Characteristics Table 1-11 DEMOGRAPHIC CHARACTERISTICS FOR FLORIDA COUNTIES (1990) Madison Manatee Marion Martin Monroe Nassau Okaloosa Okeechobee Gender Male 8, ,147 93,813 49,522 40,976 21,735 72,763 15,142 Female 8, , ,020 51,378 37,048 22,206 71,013 14,485 Ethnic Origin White 9, , ,094 92,119 71,840 39, ,191 24,984 African-American 6,915 16,400 24,844 6,043 4,203 4,522 13,007 1,898 Other 109 4,979 2,895 2,738 1, ,578 2,745 Hispanic Origin Not Hispanic 16, , ,973 96,172 68,444 43, ,349 26,134 Hispanic 231 9,424 5,860 4,728 9, ,427 3,493 Age < 16 years 4,028 36,471 38,495 15,782 12,270 10,550 33,453 7, to 19 years 1,073 8,441 9,161 3,852 2,689 2,657 7,796 1, to 29 years 2,586 25,226 23,460 11,495 11,175 6,197 26,693 4, to 39 years 2,484 28,287 26,404 13,841 14,536 7,427 24,610 4, to 59 years 3,334 40,171 40,846 21,083 19,994 10,652 32,043 6, to 64 years ,703 13,278 7,157 4,904 1,994 5,862 1, years 2,341 59,408 43,189 27,690 12,456 4,464 13,319 4,807 Education Level Less than 9th grade 1,989 13,624 14,128 5,403 4,661 3,150 5,484 3,354 9th grade to 12th grade 3,334 29,276 32,735 12,362 8,634 6,280 12,225 5,696 High school graduate 3,481 59,316 52,747 26,488 19,203 12,324 31,971 6,909 Some college 1,514 33,735 27,503 18,044 15,149 5,088 29,329 2,997 Bachelor's degree ,336 10,378 10,951 8,086 2,571 12,845 1,129 Graduate or prof degree 306 8,369 5,866 4,955 4,152 1,075 6, Disability Status With work disability 2,120 26,136 27,775 11,030 7,728 4,958 12,520 3,835 No work disability 9, , ,060 71,575 54,592 27,792 82,200 18,156 Median Household Income Nominal Income $18,153 $25,951 $22,452 $31,760 $29,351 $30,233 $27,941 $21,427 Inflation-Adjusted $13,889 $19,855 $17,178 $24,300 $22,457 $23,132 $21,378 $16,394 Poverty Status in 1989 Income above poverty level 11, , ,821 89,908 67,927 38, ,052 22,875 Income below poverty level 3,920 21,241 27,794 8,154 8,202 5,062 14,183 5,998 Source: Center for Urban Transportation Research,Florida Demographics and Journey to Work (May 1993).
28 Demographic Characteristics Table 1-12 DEMOGRAPHIC CHARACTERISTICS FOR FLORIDA COUNTIES (1990) Orange Osceola Palm Beach Pasco Pinellas Polk Putnam St. Johns Gender Male 336,061 52, , , , ,590 31,739 40,665 Female 341,430 55, , , , ,792 33,331 43,164 Ethnic Origin White 539,061 96, , , , ,952 52,019 75,547 African-American 103,092 5, ,705 5,457 65,868 54,385 11,940 7,328 Other 35,338 5,595 23,582 5,016 15,417 9,045 1, Hispanic Origin Not Hispanic 612,545 94, , , , ,782 63,382 81,927 Hispanic 64,946 12,866 66,613 9,309 20,069 16,600 1,688 1,902 Age < 16 years 145,065 24, ,680 44, ,685 87,028 14,702 16, to 19 years 41,059 5,891 34,558 10,904 34,618 21,883 3,495 4, to 29 years 132,759 16, ,038 29, ,756 55,530 7,768 11, to 39 years 122,346 17, ,367 32, ,087 57,917 8,892 13, to 59 years 137,326 23, ,039 52, ,973 85,006 14,275 19, to 64 years 26,902 4,912 47,596 19,985 49,872 22,775 4,205 4, years 72,034 14, ,240 90, ,668 75,243 11,733 13,791 Education Level Less than 9th grade 31,606 6,471 49,716 23,217 43,348 33,615 5,908 4,230 9th grade to 12th grade 76,974 15, ,667 54, ,533 65,900 11,626 9,598 High school graduate 154,106 29, ,850 82, , ,755 17,086 18,729 Some college 116,091 15, ,338 39, ,675 53,881 7,658 14,276 Bachelor's degree 71,189 5,872 96,501 13,296 82,716 24,544 2,376 9,272 Graduate or prof degree 27,034 2,403 48,298 6,442 38,588 11,527 1,327 4,812 Disability Status With work disability 54,494 10,411 82,284 43, ,431 47,703 10,288 8,714 No work disability 457,861 71, , , , ,101 39,063 57,027 Median Household Income Nominal Income $30,252 $27,260 $32,524 $21,480 $26,296 $25,216 $20,155 $29,926 Inflation-Adjusted $23,146 $20,857 $24,884 $16,435 $20,119 $19,293 $15,421 $22,897 Poverty Status in 1989 Income above poverty level 580,891 95, , , , ,327 51,083 73,185 Income below poverty level 73,630 9,914 78,909 31,986 78,994 51,201 12,770 8,441 Source: Center for Urban Transportation Research,Florida Demographics and Journey to Work (May 1993).
29 Demographic Characteristics Table 1-13 DEMOGRAPHIC CHARACTERISTICS FOR FLORIDA COUNTIES (1990) St. Lucie Santa Rosa Sarasota Seminole Sumter Suwannee Taylor Gender Male 73,443 40, , ,587 15,857 12,939 8,301 Female 76,728 40, , ,942 15,720 13,841 8,810 Ethnic Origin White 122,159 76, , ,621 26,088 22,524 13,791 African-American 24,666 3,275 12,073 24,314 5,102 3,949 3,083 Other 3,346 1,948 2,867 9, Hispanic Origin Not Hispanic 144,219 80, , ,923 30,815 26,363 16,937 Hispanic 5,952 1,223 5,882 18, Age < 16 years 31,170 19,836 38,765 64,678 6,244 6,199 4, to 19 years 6,782 4,515 9,964 16,120 1,663 1,656 1, to 29 years 19,161 12,730 28,037 45,229 3,925 3,173 2, to 39 years 22,443 14,058 34,870 52,450 3,909 3,650 2, to 59 years 29,400 19,241 56,371 68,359 6,628 6,109 3, to 64 years 9,681 3,469 20,361 10,993 2,142 1, years 31,534 7,759 89,408 29,700 7,066 4,522 2,273 Education Level Less than 9th grade 9,982 4,085 12,772 9,605 3,166 2,797 1,727 9th grade to 12th grade 23,492 8,802 32,665 25,876 5,924 4,283 2,885 High school graduate 38,736 17,218 74,742 57,291 9,177 7,382 4,608 Some college 22,031 14,436 50,446 52,920 3,627 2,976 1,438 Bachelor's degree 9,632 7,407 31,201 36,953 1,146 1, Graduate or prof degree 4,410 2,929 17,270 14, Disability Status With work disability 17,205 8,719 33,839 21,488 4,956 4,429 2,159 No work disability 99,875 49, , ,866 18,764 15,644 10,644 Median Household Income Nominal Income $27,710 $27,584 $29,919 $35,637 $19,584 $19,775 $21,380 Inflation-Adjusted $21,201 $21,105 $22,891 $27,266 $14,984 $15,130 $16,358 Poverty Status in 1989 Income above poverty level 128,680 68, , ,667 23,933 21,029 13,499 Income below poverty level 19,273 11,375 18,935 20,513 5,919 5,158 3,536 Source: Center for Urban Transportation Research,Florida Demographics and Journey to Work (May 1993).
30 Demographic Characteristics Table 1-14 DEMOGRAPHIC CHARACTERISTICS FOR FLORIDA COUNTIES (1990) Union Volusia Wakulla Walton Washington Florida Gender Male 6, ,481 6,948 13,637 8,194 6,261,719 Female 3, ,231 7,254 14,123 8,725 6,676,207 Ethnic Origin White 7, ,530 12,226 25,300 14,029 10,749,285 African-American 2,379 33,455 1,837 1,885 2,459 1,759,534 Other 176 8, ,107 Hispanic Origin Not Hispanic 9, ,872 14,119 27,516 16,739 11,363,783 Hispanic , ,574,143 Age < 16 years 2,325 65,064 3,546 5,843 3,732 2,561, to 19 years , , , to 29 years 1,894 51,824 1,732 3,354 2,122 1,922, to 39 years 2,241 53,202 2,356 4,082 2,211 2,021, to 59 years 2,138 75,181 3,401 6,676 3,923 2,733, to 64 years , , , years ,365 1,649 4,585 2,986 2,369,431 Education Level Less than 9th grade ,460 1,081 2,803 2, ,820 9th grade to 12th grade 1,647 51,501 1,816 4,341 2,933 1,706,839 High school graduate 2,770 95,482 4,018 6,720 4,706 3,045,682 Some college 1,408 67,634 1,871 3,839 1,627 2,054,574 Bachelor's degree , , ,133,053 Graduate or prof degree , ,453 Disability Status With work disability ,869 1,666 4,608 2,857 1,345,289 No work disability 4, ,244 8,810 17,229 9,841 8,756,870 Median Household Income Nominal Income $22,831 $24,818 $25,019 $21,297 $18,266 $27,483 Inflation-Adjusted $17,468 $18,989 $19,142 $16,295 $13,976 $21,028 Poverty Status in 1989 Income above poverty level 6, ,226 12,080 22,348 12,793 11,037,300 Income below poverty level 1,219 43,568 1,913 5,163 3,582 1,604,186 Source: Center for Urban Transportation Research,Florida Demographics and Journey to Work (May 1993).
31 SECTION II: TRAVEL BEHAVIOR CHARACTERISTICS Personal Travel Journey-to-Work Travel
32 2. Personal Travel 2.1 NPTS HOUSEHOLD AND TRAVEL CHARACTERISTICS (1990) 2.2 AVERAGE HOUSEHOLD CHARACTERISTICS (1990) 2.3 TRENDS IN HOUSEHOLD AND TRAVEL CHARACTERISTICS (U.S.) 2.4 AVERAGE ANNUAL HOUSEHOLD TRAVEL BY HOUSEHOLD SIZE AND VEHICLES AVAILABLE (199 0) 2.5 AVERAGE DAILY VEHICLE TRIPS, VEHICLE MILES, AND TRIP LENGTH BY AGE AND GENDER (1990) 2.6 AVERAGE DAILY PERSON TRIPS, PERSON MILES, AND TRIP LENGTH BY AGE AND GENDER (1990) 2.7 DISTRIBUTION OF TOTAL TRAVEL BY INCOME CATEGORY (1990) 2.8 SUMMARY OF ANNUAL HOUSEHOLD VEHICLE TRIP DATA BY PURPOSE (1990) 2.9 AVERAGE PERSON TRIP LENGTH BY PURPOSE AND MODE (1990) 2.10 AVERAGE PERSON TRIP TRAVEL TIME BY PURPOSE AND MODE (1990)
33 Table 2-1 NPTS HOUSEHOLD AND TRAVEL CHARACTERISTICS (1990) United States Florida (MSA) Florida (Total) Household Vehicles (000) 165,220 6,831 7,659 Household Vehicle Trips (000,000) 158,927 7,140 7,970 Household VMT (000,000) 1,409,576 53,604 61,760 Person Trips (000,000) 249,562 10,617 11,796 Person Miles of Travel (000,000) 2,315,273 87,452 87,818 Source: 1990 Nationwide Personal Transportation Survey. Table 2-2 AVERAGE HOUSEHOLD CHARACTERISTICS (1990) United States Florida (MSA) Florida (Total) Persons (5+ years) per Household Licensed Drivers per Household Workers per Household Vehicles per Household Daily Vehicle Trips per Household Daily VMT per Household Average Vehicle Trip Length 8.87 miles 7.51 miles 7.75 Source: 1990 Nationwide Personal Transportation Survey. Table 2-3 TRENDS IN HOUSEHOLD AND TRAVEL CHARACTERISTICS (UNITED STATES) % Chg, Household Vehicles (000) 72, , , , % Household Veh. Trips (000,000) 87, , , ,927 82% Household VMT (000,000) 775, ,623 1,002,139 1,409,576 82% Person Trips (000,000) 145, , , ,562 72% Person Miles of Travel (000,000) 1,404,137 1,879,215 1,946,662 2,315,273 65% NOTES: (1) The 1969 survey includes only automobiles, station wagons, and vanbuses/minibuses as household vehicles. (2) The 1969 survey does not include walk and bicycle trips. Source: Joel R. Rey, "Analysis and Assessment of the 1990 Nationwide Personal Transportation Study in Relation to Travel Characteristics in the United States and Florida" (August 1992), and FHWA "Summary of Travel Trends: 1990 Nationwide Personal Transportation Survey" (March 1992).
34 Table 2-4 AVERAGE ANNUAL HOUSEHOLD TRAVEL BY HOUSEHOLD SIZE AND VEHICLES AVAILABLE (1990) 0 vehs 1 veh 2 veh 3 vehs 4+ vehs Total 1 person U.S. (Total) 28 trips 1,097 1,292 1,464 1, miles 8,182 12,732 21,321 16,756 7,164 FL (MSA) 35 trips ,957 n/a miles 5,561 3,116 6,936 n/a 4,180 FL (Total) 35 trips 1, ,957 n/a miles 6,723 4,704 6,939 n/a 5,093 2 persons U.S. (Total) 74 1,154 1,811 1,972 2,076 1, ,993 16,903 20,535 26,189 14,247 FL (MSA) n/a 1,006 1,723 2,438 1,864 1,480 n/a 6,337 13,812 28,489 11,143 11,958 FL (Total) n/a 1,141 1,869 2,583 2,035 1,617 n/a 6,964 15,866 29,146 13,548 13,351 3 persons U.S. (Total) 109 1,445 2,195 2,654 2,679 2, ,759 20,016 28,000 28,032 19,434 FL (MSA) 345 1,644 2,231 2,301 3,415 2,097 2,816 9,236 14,400 18,263 27,238 14,324 FL (Total) 345 1,669 2,609 2,531 3,615 2,330 2,803 9,370 15,580 21,114 31,631 15, persons U.S. (Total) 189 1,543 2,411 2,833 3,452 2, ,667 20,075 25,322 34,099 20,839 FL (MSA) 1,303 1,954 2,382 2,052 2,409 2,213 5,576 13,623 20,065 17,493 25,791 18,548 FL (Total) 1,303 2,105 2,479 2,163 3,793 2,463 5,561 14,539 20,408 19,216 55,805 22,513 Total U.S. (Total) 63 1,206 2,039 2,501 2,971 1, ,723 18,232 24,702 30,855 15,100 FL (MSA) 132 1,141 1,913 2,249 2,634 1, ,947 14,725 20,367 24,473 11,418 FL (Total) 132 1,307 2,082 2,405 3,533 1, ,806 16,205 22,057 43,829 13,155 Source: 1990 Nationwide Personal Transportation Survey.
35 Age Category Table 2-5 AVERAGE DAILY VEHICLE TRIPS, VEHICLE MILES, AND TRIP LENGTH BY AGE AND GENDER (1990) Male United States (Total) Female Total Male Florida (MSA) Female Total Male Florida (Total) Female < trips (1) miles (2) miles (3) Total Total (1) Average vehicle trips per day Source: 1990 Nationwide Personal Transportation Survey. (2) Average vehicle miles per day (3) Average vehicle trip length
36 Table 2-6 AVERAGE DAILY PERSON TRIPS, PERSON MILES, AND TRIP LENGTH BY AGE AND GENDER (1990) United States (Total) Florida (MSA) Florida (Total) Age Category Male Female Total Male Female Total Male Female Total < trips (1) miles (2) miles (3) Total (1) Average person trips per day Source: 1990 Nationwide Personal Transportation Survey. (2) Average person miles per day (3) Average person trip length
37 Table 2-7 DISTRIBUTION OF TOTAL TRAVEL BY INCOME CATEGORY (1990) United States (Total) (%) Florida (MSA) (%) Florida (Total) (%) Income Category Veh Trps Veh Mls % of HHs Veh Trps Veh Mls % of HHs Veh Trps Veh Mls % of HHs Less than $5,000 2% 1% 4% 2% 2% 3% 2% 2% 3% $5-$9,999 5% 4% 10% 5% 4% 12% 5% 4% 12% $10-$14,999 6% 5% 9% 11% 6% 11% 10% 6% 11% $15-$19,999 8% 7% 10% 11% 11% 10% 11% 11% 11% $20-$24,999 8% 7% 8% 8% 6% 9% 8% 6% 9% $25-$29,999 10% 10% 10% 10% 8% 12% 11% 10% 12% $30-$39,999 19% 19% 17% 16% 17% 16% 16% 16% 16% $40-$49,999 13% 14% 10% 12% 16% 9% 11% 16% 9% $50-$59,999 11% 12% 9% 11% 11% 7% 10% 11% 7% $60,000 or more 19% 21% 13% 15% 19% 11% 15% 19% 11% Source: 1990 Nationwide Personal Transportation Survey.
38 Table 2-8 SUMMARY OF ANNUAL HOUSEHOLD VEHICLE TRIP DATA BY PURPOSE (1990) Trip Purpose United States (Total) Florida (MSA) Florida (Total) Veh Trps VMT Trip Lgth Veh Trps VMT Trip Lgth Veh Trps VMT Trip Lgth To/From Work 448 4, , , Shopping 345 1, , , Family/Personal 411 3, , , Social/Recreation 349 4, , , All Purposes 1,703 15, ,521 11, ,698 13, Source: 1990 Nationwide Personal Transportation Survey.
39 Table 2-9 AVERAGE PERSON TRIP LENGTH BY PURPOSE AND MODE (1990) Earn Living Family/Personal Civic/Educational Social/Recreational Other Auto/Van U.S. (Total) miles FL (MSA) 9.19 miles FL (Total) 9.52 miles Truck U.S. (Total) FL (MSA) FL (Total) Public Transit U.S. (Total) FL (MSA) n/a FL (Total) n/a School Bus U.S. (Total) FL (MSA) n/a 5.00 FL (Total) n/a 4.93 Airplane U.S. (Total) n/a n/a FL (MSA) 1, n/a n/a n/a FL (Total) 1, n/a n/a n/a Bicycle U.S. (Total) FL (MSA) n/a FL (Total) Walk U.S. (Total) FL (MSA) FL (Total) Other U.S. (Total) FL (MSA) n/a FL (Total) n/a Source: 1990 Nationwide Personal Transportation Survey.
40 Table 2-10 AVERAGE PERSON TRIP TRAVEL TIME BY PURPOSE AND MODE (1990) Earn Living Family/Personal Civic/Educational Social/Recreational Other Auto/Van U.S. (Total) mins FL (MSA) mins FL (Total) mins Truck U.S. (Total) FL (MSA) FL (Total) Public Transit U.S. (Total) FL (MSA) n/a FL (Total) n/a School Bus U.S. (Total) FL (MSA) n/a FL (Total) n/a Airplane U.S. (Total) FL (MSA) n/a n/a n/a FL (Total) n/a n/a n/a Bicycle U.S. (Total) FL (MSA) n/a FL (Total) Walk U.S. (Total) FL (MSA) FL (Total) Other U.S. (Total) FL (MSA) n/a n/a FL (Total) n/a n/a Source: 1990 Nationwide Personal Transportation Survey.
41 2. Journey-to-Work Travel F2.1 GROWTH RATES IN NUMBER OF WORKERS BY JOURNEY-TO-WORK MODE, FLORIDA AND UNITED STATES ( ) F2.2 DISTRIBUTION OF JOURNEY-TO-WORK MODE, FLORIDA AND UNITED STATES ( ) F2.3 TRAVEL TIME TO WORK, FLORIDA AND UNIT ED STATES ( ) F2.4 DEPARTURE TIME TO WORK, FLORIDA AND UNITED STATES (1990) F2.5 PRIVATE VEHICLE OCCUPANCY, FLORIDA AND UNITED STATES ( ) 2.11 JOURNEY TO WORK TRENDS, U.S. ( ) 2.13 JOURNEY TO WORK TRENDS, FLORIDA ( ) 2.15 JOURNEY TO WORK CHARACTERISTICS FOR FLORIDA COUNTIES (1990)
42 Figure 2-1 GROWTH RATES IN NUMBER OF WORKERS BY JOURNEY-TO-WORK MODE, FLORIDA AND UNITED STATES ( ) Florida Private auto or carpool 49% 69% 70% Walk -8% -1% 24% Public transportation 6% 0% 9% Work at home -33% -2% 125% Other means -5% 5% 23% -50% -25% 0% 25% 50% 75% 100% 125% 150% United States Private auto or carpool 23% 44% 36% Walk -11% -5% -17% Public transportation -13% -9% -2% Work at home -42% -19% 56% Other means -18% -5% 20% -75% -50% -25% 0% 25% 50% 75%
43 Figure 2-2 DISTRIBUTION OF JOURNEY-TO-WORK MODE, FLORIDA AND UNITED STATES ( ) Florida Private auto or carpool 75% 85% 89% 91% Walk Public transportation Work at home 8% 5% 4% 3% 6% 4% 3% 2% 5% 2% 1% 2% Other means 6% 4% 3% 2% 0% 25% 50% 75% 100% United States Private auto or carpool 67% 78% 84% 87% Walk Public transportation Work at home 10% 7% 6% 4% 13% 9% 6% 5% 9% 3% 2% 3% Other means 3% 3% 2% 1% 0% 25% 50% 75% 100%
44 Figure 2-3 TRAVEL TIME TO WORK, FLORIDA AND UNITED STATES ( ) Florida United States Figure 2-4 DEPARTURE TIME TO WORK, FLORIDA AND UNITED STATES (1990) 12:00 to 4:59 a.m. 2% 2% 5:00 to 5:59 a.m. 5% 6% 6:00 to 6:59 a.m. 19% 20% 7:00 to 7:59 a.m. 31% 32% 8:00 to 8:59 a.m. 16% 18% 9:00 to 9:59 a.m. 5% 6% 10:00 to 10:59 a.m. 11:00 to 11:59 a.m. 12:00 to 3:59 p.m. 4:00 to 11:59 p.m. Worked at home 2% 2% 1% 1% 2% 3% 6% 7% 6% 7% Florida United States 0% 7% 14% 21% 28% 35%
45 100% Figure 2-5 PRIVATE VEHICLE OCCUPANCY, FLORIDA AND UNITED STATES ( ) Florida 75% 69% 77% 50% 25% 0% 15% 11% 11% 9% 3% 2% 2% 1% Drive alone 2-person 3-person 4-person+ Other means % United States 75% 64% 73% 50% 25% 14% 10% 16% 14% 0% 4% 2% 3% 1% Drive alone 2-person 3-person 4-person+ Other means
46 Journey to Work Characteristics Table 2-11 JOURNEY TO WORK TRENDS, U.S. ( ) Year Percent Change Percent Distribution of Trends Place of Work Worked in home county 52,812,017 57,464,606 n/a 87,587, n/a n/a % 74.8% n/a 76.1% Worked outside home county 8,985,588 13,688,172 n/a 27,482, n/a n/a % 17.8% n/a 23.9% Place of work not reported 2,858,200 5,699,611 n/a n/a n/a n/a n/a 4.4% 7.4% n/a 0.0% Mode to Work Private auto or carpool 41,368,062 59,722,550 81,258,496 99,592, % 77.7% 84.1% 86.5% Drive alone n/a n/a 62,193,449 84,215,298 n/a n/a n/a n/a n/a 64.4% 73.2% Carpool n/a n/a 19,065,047 15,377,634 n/a n/a n/a n/a n/a 19.7% 13.4% Walk 6,416,343 5,689,819 5,413,248 4,488, % 7.4% 5.6% 3.9% Public transportation 7,806,932 6,810,458 6,175,061 6,069, % 8.9% 6.4% 5.3% Work at home 4,662,750 2,685,144 2,179,863 3,406, % 3.5% 2.3% 3.0% Other means 1,619,842 1,944,418 1,590,628 1,512, % 2.5% 1.6% 1.3% Travel Time to Work Less than 10 minutes n/a n/a 16,871,572 18,257,921 n/a n/a 8.22 n/a n/a n/a 17.5% 15.9% 10 to 19 minutes n/a n/a 31,846,602 36,980,181 n/a n/a n/a n/a n/a 32.9% 32.1% 20 to 29 minutes n/a n/a 18,849,260 22,436,930 n/a n/a n/a n/a n/a 19.5% 19.5% 30 to 44 minutes n/a n/a 15,996,009 20,053,109 n/a n/a n/a n/a n/a 16.5% 17.4% 45 or more minutes n/a n/a 10,923,652 13,936,108 n/a n/a n/a n/a n/a 11.3% 12.1% Worked at home n/a n/a 2,179,863 3,406,025 n/a n/a n/a n/a n/a 2.3% 3.0% Source: Center for Urban Transportation Research,Demographic and Commuting Trends in Florida (February 1994).
47 Journey to Work Characteristics Table 2-12 JOURNEY TO WORK TRENDS, U.S. ( ) Year Percent Change Percent Distribution of Trends Departure Time to Work 12:00 to 4:59 a.m. n/a n/a n/a 2,747,488 n/a n/a n/a n/a n/a n/a n/a 2.4% 5:00 to 5:59 a.m. n/a n/a n/a 7,145,946 n/a n/a n/a n/a n/a n/a n/a 6.2% 6:00 to 6:59 a.m. n/a n/a n/a 22,820,464 n/a n/a n/a n/a n/a n/a n/a 19.8% 7:00 to 7:59 a.m. n/a n/a n/a 35,346,620 n/a n/a n/a n/a n/a n/a n/a 30.7% 8:00 to 8:59 a.m. n/a n/a n/a 18,867,326 n/a n/a n/a n/a n/a n/a n/a 16.4% 9:00 to 9:59 a.m. n/a n/a n/a 5,792,355 n/a n/a n/a n/a n/a n/a n/a 5.0% 10:00 to 10:59 a.m. n/a n/a n/a 2,249,960 n/a n/a n/a n/a n/a n/a n/a 2.0% 11:00 to 11:59 a.m. n/a n/a n/a 1,167,633 n/a n/a n/a n/a n/a n/a n/a 1.0% 12:00 to 3:59 p.m. n/a n/a n/a 7,965,160 n/a n/a n/a n/a n/a n/a n/a 6.9% 4:00 to 11:59 p.m. n/a n/a n/a 7,561,297 n/a n/a n/a n/a n/a n/a n/a 6.6% Worked at home n/a n/a n/a 3,406,025 n/a n/a n/a n/a n/a n/a n/a 3.0% Private Vehicle Occupancy Drive alone n/a n/a 62,193,449 84,215,298 n/a n/a n/a n/a n/a 64.4% 73.2% 2 person carpool n/a n/a 13,303,701 12,078,175 n/a n/a n/a n/a n/a 13.8% 10.5% 3 person carpool n/a n/a 3,360,781 2,001,378 n/a n/a n/a n/a n/a 3.5% 1.7% 4 person+ carpool n/a n/a 2,400,565 1,298,081 n/a n/a n/a n/a n/a 2.5% 1.1% Other means n/a n/a 15,358,800 15,477,342 n/a n/a 0.77 n/a n/a n/a 15.9% 13.5% Source: Center for Urban Transportation Research,Demographic and Commuting Trends in Florida (February 1994).
48 Journey to Work Characteristics Table 2-13 JOURNEY TO WORK TRENDS, FLORIDA ( ) Year Percent Change Percent Distribution of Trends Place of Work Worked in home county 1,558,111 2,053,793 3,157,989 4,956, % 83.0% 88.8% 85.5% Worked outside home county 91, , , , % 8.0% 10.1% 14.5% Place of work not reported 95, ,112 41,564 n/a n/a n/a 5.4% 8.9% 1.2% 0.0% Mode to Work Private auto or carpool 1,240,665 2,099,436 3,557,675 5,286, % 84.9% 89.4% 91.2% Drive alone n/a n/a 2,751,259 4,468,021 n/a n/a n/a n/a n/a 69.2% 77.1% Carpool n/a n/a 806, ,546 n/a n/a 1.50 n/a n/a n/a 20.3% 14.1% Walk 128, , , , % 4.8% 3.7% 2.5% Public transportation 101, , , , % 4.3% 2.7% 2.0% Work at home 88,738 59,676 58, , % 2.4% 1.5% 2.3% Other means 93,001 88, , , % 3.6% 2.7% 2.0% Travel Time to Work Less than 10 minutes n/a n/a 611, ,607 n/a n/a n/a n/a n/a 15.3% 13.3% 10 to 19 minutes n/a n/a 1,380,673 1,908,310 n/a n/a n/a n/a n/a 34.6% 32.9% 20 to 29 minutes n/a n/a 866,785 1,236,778 n/a n/a n/a n/a n/a 21.8% 21.3% 30 to 44 minutes n/a n/a 722,745 1,172,060 n/a n/a n/a n/a n/a 18.1% 20.2% 45 or more minutes n/a n/a 345, ,613 n/a n/a n/a n/a n/a 8.7% 10.0% Worked at home n/a n/a 58, ,084 n/a n/a n/a n/a n/a 1.5% 2.3% Source: Center for Urban Transportation Research,Demographic and Commuting Trends in Florida (February 1994).
49 Journey to Work Characteristics Table 2-14 JOURNEY TO WORK TRENDS, FLORIDA ( ) Year Percent Change Percent Distribution of Trends Departure Time to Work 12:00 to 4:59 a.m. n/a n/a n/a 126,901 n/a n/a n/a n/a n/a n/a n/a 2.2% 5:00 to 5:59 a.m. n/a n/a n/a 283,702 n/a n/a n/a n/a n/a n/a n/a 4.9% 6:00 to 6:59 a.m. n/a n/a n/a 1,120,718 n/a n/a n/a n/a n/a n/a n/a 19.3% 7:00 to 7:59 a.m. n/a n/a n/a 1,843,369 n/a n/a n/a n/a n/a n/a n/a 31.8% 8:00 to 8:59 a.m. n/a n/a n/a 1,066,549 n/a n/a n/a n/a n/a n/a n/a 18.4% 9:00 to 9:59 a.m. n/a n/a n/a 341,737 n/a n/a n/a n/a n/a n/a n/a 5.9% 10:00 to 10:59 a.m. n/a n/a n/a 123,249 n/a n/a n/a n/a n/a n/a n/a 2.1% 11:00 to 11:59 a.m. n/a n/a n/a 60,948 n/a n/a n/a n/a n/a n/a n/a 1.1% 12:00 to 3:59 p.m. n/a n/a n/a 343,816 n/a n/a n/a n/a n/a n/a n/a 5.9% 4:00 to 11:59 p.m. n/a n/a n/a 351,379 n/a n/a n/a n/a n/a n/a n/a 6.1% Worked at home n/a n/a n/a 132,084 n/a n/a n/a n/a n/a n/a n/a 2.3% Private Vehicle Occupancy Drive alone n/a n/a 2,751,259 4,468,021 n/a n/a n/a n/a n/a 69.2% 77.1% 2 person carpool n/a n/a 579, ,172 n/a n/a n/a n/a n/a 14.6% 11.4% 3 person carpool n/a n/a 132,525 99,518 n/a n/a n/a n/a n/a 3.3% 1.7% 4 person+ carpool n/a n/a 94,066 58,856 n/a n/a n/a n/a n/a 2.4% 1.0% Other means n/a n/a 420, ,885 n/a n/a n/a n/a n/a 10.6% 8.8% Source: Center for Urban Transportation Research,Demographic and Commuting Trends in Florida (February 1994).
50 Journey to Work Characteristics Table 2-15 JOURNEY TO WORK CHARACTERISTICS FOR FLORIDA COUNTIES (1990) Alachua Baker Bay Bradford Brevard Broward Calhoun Charlotte Place of Work Worked in home county 78,839 3,995 55,055 4, , ,595 2,293 29,913 Worked outside home county 4,528 3,085 1,487 3,386 8, ,810 1,433 7,153 Worked outside home state , ,604 4, Mode to Work Private auto or carpool 72,213 6,769 54,208 7, , ,043 3,519 35,501 Drive alone 60,693 5,315 46,755 6, , ,713 2,607 30,238 Carpool 11,520 1,454 7,453 1,502 23,798 75, ,263 Walk 3, , ,564 10, Public Transportation 1, , Work at home 2, ,775 11, Other means 4, , ,856 10, Travel Time to Work Less than 10 minutes 13,040 1,158 10,713 1,508 26,629 66, , to 19 minutes 34,325 1,929 24,174 2,798 63, ,161 1,096 15, to 29 minutes 17, ,880 1,183 42, , , to 39 minutes 10,553 1,150 6, , , , or more minutes 5,870 1,885 3,330 1,539 18,923 84, ,739 Worked at home 2, ,775 11, Departure Time to Work 12:00 to 4:59 a.m. 1, , ,131 9, :00 to 5:59 a.m. 2, , ,570 23, ,642 6:00 to 6:59 a.m. 11,037 1,997 14,215 1,654 42,343 96,693 1,168 6,671 7:00 to 7:59 a.m. 29,725 1,852 17,686 3,106 59, , ,128 8:00 to 8:59 a.m. 15, , , , ,259 9:00 to 9:59 a.m. 5, , ,821 42, ,290 10:00 to 10:59 a.m. 2, , ,664 14, :00 to 11:59 a.m. 1, ,723 6, :00 to 3:59 p.m. 6, , ,492 32, ,387 4:00 to 11:59 p.m. 6, , ,411 34, ,147 Worked at home 2, ,775 11, Private Vehicle Occupancy Drive alone 60,693 5,315 46,755 6, , ,713 2,607 30,238 2 person carpool 9,743 1,039 5,712 1,156 19,528 63, ,428 3 person carpool 1, , ,975 8, person+ carpool ,295 3, Other means 11, , ,700 44, ,041 Source: Center for Urban Transportation Research,Florida Demographics and Journey to Work (May 1993).
51 Journey to Work Characteristics Table 2-16 JOURNEY TO WORK CHARACTERISTICS FOR FLORIDA COUNTIES (1990) Citrus Clay Collier Columbia Dade Desoto Dixie Duval Place of Work Worked in home county 24,400 20,090 63,539 12, ,722 6,763 2, ,868 Worked outside home county 4,776 30,737 2,800 4,234 38,637 1, ,542 Worked outside home state 247 1, , ,742 Mode to Work Private auto or carpool 27,139 48,626 60,573 15, ,997 7,741 2, ,712 Drive alone 23,476 40,893 49,738 13, ,669 5,924 2, ,810 Carpool 3,663 7,733 10,835 2, ,328 1, ,902 Walk , , ,983 Public Transportation , , ,969 Work at home 975 1,080 2, , ,976 Other means 585 1,010 1, , ,512 Travel Time to Work Less than 10 minutes 4,974 5,383 11,300 2,784 74,814 1, , to 19 minutes 11,141 11,244 25,937 6, ,699 3, , to 29 minutes 5,226 8,729 14,017 2, ,996 1, , to 39 minutes 3,909 10,807 8,268 2, ,311 1, , or more minutes 3,198 14,623 5,443 2, , ,602 Worked at home 975 1,080 2, , ,976 Departure Time to Work 12:00 to 4:59 a.m ,621 1, , ,728 5:00 to 5:59 a.m. 1,862 4,011 2,624 1,243 38, ,210 6:00 to 6:59 a.m. 5,291 13,979 12,752 3, ,077 2, ,468 7:00 to 7:59 a.m. 9,007 14,239 20,650 6, ,901 2, ,837 8:00 to 8:59 a.m. 5,574 6,211 14,300 1, ,475 1, ,030 9:00 to 9:59 a.m. 1,618 2,686 4, , ,795 10:00 to 10:59 a.m , , ,224 11:00 to 11:59 a.m , ,937 12:00 to 3:59 p.m. 1,537 3,150 3, , ,854 4:00 to 11:59 p.m. 1,730 3,695 3,155 1,008 49, ,093 Worked at home 975 1,080 2, , ,976 Private Vehicle Occupancy Drive alone 23,476 40,893 49,738 13, ,669 5,924 2, ,810 2 person carpool 3,223 6,322 8,144 1, ,955 1, ,860 3 person carpool , , ,390 4 person+ carpool , , ,652 Other means 2,284 3,240 6,622 1, , ,440 Source: Center for Urban Transportation Research,Florida Demographics and Journey to Work (May 1993).
52 Journey to Work Characteristics Table 2-17 JOURNEY TO WORK CHARACTERISTICS FOR FLORIDA COUNTIES (1990) Escambia Flagler Franklin Gadsen Gilchrist Glades Gulf Hamilton Place of Work Worked in home county 106,739 7,379 2,776 9,230 1,270 1,268 3,567 2,684 Worked outside home county 5,537 2, ,231 2,203 1, Worked outside home state 4, Mode to Work Private auto or carpool 105,385 9,578 2,871 14,948 3,241 2,454 4,146 3,452 Drive alone 90,715 7,876 2,258 10,454 2,523 1,874 3,449 2,734 Carpool 14,670 1, , Walk 5, Public Transportation 1, Work at home 3, Other means 2, Travel Time to Work Less than 10 minutes 18,196 1,869 1,264 2, , to 19 minutes 43,839 3, , ,377 1, to 29 minutes 27,510 1, , to 39 minutes 15,953 1, , or more minutes 8,404 1, ,483 1, Worked at home 3, Departure Time to Work 12:00 to 4:59 a.m. 2, :00 to 5:59 a.m. 9, :00 to 6:59 a.m. 30,977 1, , ,035 1,032 7:00 to 7:59 a.m. 34,148 3,229 1,153 6,823 1, ,602 1,281 8:00 to 8:59 a.m. 13,015 2, , :00 to 9:59 a.m. 5, :00 to 10:59 a.m. 1, :00 to 11:59 a.m. 1, :00 to 3:59 p.m. 8, :00 to 11:59 p.m. 7, Worked at home 3, Private Vehicle Occupancy Drive alone 90,715 7,876 2,258 10,454 2,523 1,874 3,449 2,734 2 person carpool 11,856 1, , person carpool 2, person+ carpool Other means 11, , Source: Center for Urban Transportation Research,Florida Demographics and Journey to Work (May 1993).
53 Journey to Work Characteristics Table 2-18 JOURNEY TO WORK CHARACTERISTICS FOR FLORIDA COUNTIES (1990) Hardee Hendry Hernando Highlands Hillsborough Holmes Indian River Place of Work Worked in home county 5,499 7,361 21,761 20, ,741 2,993 30,126 Worked outside home county 2,077 3,118 8,698 1,776 34,208 1,606 4,081 Worked outside home state ,001 1, Mode to Work Private auto or carpool 6,891 9,797 29,202 20, ,348 5,573 32,147 Drive alone 5,120 7,190 24,571 16, ,743 4,443 27,653 Carpool 1,771 2,607 4,631 3,457 55,605 1,130 4,494 Walk , Public Transportation , Work at home , Other means , Travel Time to Work Less than 10 minutes 1,791 2,969 4,138 4,705 51,598 1,029 6, to 19 minutes 2,471 2,793 11,302 9, ,240 1,703 15, to 29 minutes ,770 3,607 92, , to 39 minutes 995 1,807 4,092 1,809 77,041 1,140 3, or more minutes 1,179 1,838 4,906 1,239 52,365 1,030 2,079 Worked at home , Departure Time to Work 12:00 to 4:59 a.m , , :00 to 5:59 a.m ,028 1,051 20, ,219 6:00 to 6:59 a.m. 1,830 3,426 6,249 4,447 82,999 2,060 5,621 7:00 to 7:59 a.m. 2,802 3,221 8,898 7, ,201 1,359 12,314 8:00 to 8:59 a.m. 1,030 1,396 5,501 3,743 65, ,733 9:00 to 9:59 a.m , , ,972 10:00 to 10:59 a.m , :00 to 11:59 a.m , :00 to 3:59 p.m ,679 1,190 23, ,638 4:00 to 11:59 p.m ,859 1,066 26, ,531 Worked at home , Private Vehicle Occupancy Drive alone 5,120 7,190 24,571 16, ,743 4,443 27,653 2 person carpool 1,263 1,265 3,861 2,594 45, ,441 3 person carpool , person+ carpool , Other means ,704 1,771 32, ,370 Source: Center for Urban Transportation Research,Florida Demographics and Journey to Work (May 1993).
54 Journey to Work Characteristics Table 2-19 JOURNEY TO WORK CHARACTERISTICS FOR FLORIDA COUNTIES (1990) Jackson Jefferson Lafayette Lake Lee Leon Levy Liberty Place of Work Worked in home county 12,548 2,376 1,400 42, ,226 96,178 5, Worked outside home county 2,689 2, ,872 11,487 3,758 4, Worked outside home state ,253 1, Mode to Work Private auto or carpool 14,671 4,385 1,848 52, ,595 92,452 8,698 1,848 Drive alone 12,061 2,954 1,437 43, ,850 77,716 6,995 1,322 Carpool 2,610 1, ,553 21,745 14,736 1, Walk ,662 2,857 3, Public Transportation ,319 2, Work at home ,399 3,177 1, Other means ,173 3,018 1, Travel Time to Work Less than 10 minutes 3, ,934 21,578 14,456 1, to 19 minutes 5,463 1, ,065 45,691 41,481 2, to 29 minutes 2, ,129 31,059 23,927 1, to 39 minutes 2,454 1, ,921 24,460 13,795 1, or more minutes 1,600 1, ,486 16,001 5,741 1, Worked at home ,399 3,177 1, Departure Time to Work 12:00 to 4:59 a.m ,627 3,115 1, :00 to 5:59 a.m. 1, ,846 7,342 1, :00 to 6:59 a.m. 4, ,073 29,168 10,752 2, :00 to 7:59 a.m. 5,516 2, ,354 43,710 42,423 2, :00 to 8:59 a.m. 1, ,255 25,928 21,164 1, :00 to 9:59 a.m ,582 9,148 6, :00 to 10:59 a.m ,154 2,898 2, :00 to 11:59 a.m ,484 1, :00 to 3:59 p.m. 1, ,160 7,862 5, :00 to 11:59 p.m. 1, ,950 8,134 6, Worked at home ,399 3,177 1, Private Vehicle Occupancy Drive alone 12,061 2,954 1,437 43, ,850 77,716 6,995 1,322 2 person carpool 1,961 1, ,930 17,674 11,579 1, person carpool ,070 2,441 1, person+ carpool ,630 1, Other means 1, ,415 10,371 8, Source: Center for Urban Transportation Research,Florida Demographics and Journey to Work (May 1993).
55 Journey to Work Characteristics Table 2-20 JOURNEY TO WORK CHARACTERISTICS FOR FLORIDA COUNTIES (1990) Madison Manatee Marion Martin Monroe Nassau Okaloosa Okeechobee Place of Work Worked in home county 4,455 64,906 65,583 29,373 38,189 11,064 66,461 9,222 Worked outside home county ,411 7,438 10,623 2,132 7,224 2,826 2,591 Worked outside home state ,552 1, Mode to Work Private auto or carpool 5,411 79,612 68,824 37,777 31,711 18,719 65,850 10,851 Drive alone 4,035 67,900 57,531 32,540 25,404 15,367 56,567 7,802 Carpool 1,376 11,712 11,293 5,237 6,307 3,352 9,283 3,049 Walk 169 1,663 1, , , Public Transportation Work at home 306 2,214 1,825 1,161 1, , Other means 65 1,870 1, , , Travel Time to Work Less than 10 minutes 1,017 13,705 10,804 6,813 13,862 3,239 13,868 2, to 19 minutes 2,262 32,916 26,053 15,368 15,723 4,921 28,098 4, to 29 minutes 1,046 17,997 15,410 6,888 4,332 2,972 14,129 1, to 39 minutes ,542 11,714 6,119 2,704 3,853 8,002 1, or more minutes 625 7,569 7,716 4,261 2,703 4,530 5,379 2,166 Worked at home 306 2,214 1,825 1,161 1, , Departure Time to Work 12:00 to 4:59 a.m ,862 2, , :00 to 5:59 a.m ,746 4,423 2,178 1,488 1,352 4,261 1,512 6:00 to 6:59 a.m. 1,336 16,601 15,726 7,573 5,774 4,750 22,024 3,024 7:00 to 7:59 a.m. 2,226 28,711 23,642 13,152 12,737 6,294 19,566 3,753 8:00 to 8:59 a.m ,133 11,483 8,088 8,351 2,749 7,280 1,310 9:00 to 9:59 a.m ,638 3,344 2,465 3, , :00 to 10:59 a.m. 34 1,807 1, , , :00 to 11:59 a.m :00 to 3:59 p.m ,337 4,604 1,857 2,423 1,165 4, :00 to 11:59 p.m ,137 4,095 2,258 2,904 1,066 5, Worked at home 306 2,214 1,825 1,161 1, , Private Vehicle Occupancy Drive alone 4,035 67,900 57,531 32,540 25,404 15,367 56,567 7,802 2 person carpool 1,016 9,439 9,328 4,131 5,244 2,715 7,382 1,763 3 person carpool 141 1,339 1, , person+ carpool Other means 575 6,331 4,698 2,833 9,196 1,121 4, Source: Center for Urban Transportation Research,Florida Demographics and Journey to Work (May 1993).
56 Journey to Work Characteristics Table 2-21 JOURNEY TO WORK CHARACTERISTICS FOR FLORIDA COUNTIES (1990) Orange Osceola Palm Beach Pasco Pinellas Polk Putnam St. Johns Place of Work Worked in home county 317,493 29, ,100 58, , ,699 16,415 25,272 Worked outside home county 36,115 21,546 33,284 36,323 40,720 17,655 6,083 13,242 Worked outside home state 2, , , Mode to Work Private auto or carpool 319,961 48, ,409 90, , ,995 21,103 35,844 Drive alone 272,100 39, ,796 76, , ,883 17,363 30,284 Carpool 47,861 8,684 48,613 14,180 47,004 24,112 3,740 5,560 Walk 15,755 1,043 7,580 1,882 9,231 3, ,052 Public Transportation 7, , ,637 1, Work at home 6, ,170 1,877 9,281 3, ,140 Other means 6,461 1,125 6,983 1,770 8,244 2, Travel Time to Work Less than 10 minutes 40,313 6,257 50,325 14,388 54,149 27,038 3,823 6, to 19 minutes 108,698 15, ,415 29, ,529 61,504 7,860 13, to 29 minutes 85,833 11,367 84,769 16,079 79,975 32,225 3,598 7, to 39 minutes 70,942 10,309 62,130 15,050 55,775 24,797 2,740 5, or more minutes 44,062 7,534 39,451 18,780 42,197 19,257 4,087 5,589 Worked at home 6, ,170 1,877 9,281 3, ,140 Departure Time to Work 12:00 to 4:59 a.m. 10,258 1,358 6,555 2,704 7,078 5, :00 to 5:59 a.m. 20,673 3,903 14,026 6,478 14,582 10,741 1,688 1,822 6:00 to 6:59 a.m. 72,092 10,741 62,314 21,007 66,051 36,841 5,524 7,026 7:00 to 7:59 a.m. 110,096 15, ,756 26, ,217 55,003 6,744 12,779 8:00 to 8:59 a.m. 60,782 6,959 85,591 16,338 74,627 24,599 2,913 7,232 9:00 to 9:59 a.m. 17,251 1,937 26,958 5,368 22,588 6,873 1,020 2,517 10:00 to 10:59 a.m. 7, ,490 2,013 8,770 2, :00 to 11:59 a.m. 3, , ,434 1, :00 to 3:59 p.m. 22,552 4,252 19,469 6,743 24,171 10,529 1,572 2,367 4:00 to 11:59 p.m. 24,821 4,403 20,122 5,726 24,107 11,170 1,308 2,213 Worked at home 6, ,170 1,877 9,281 3, ,140 Private Vehicle Occupancy Drive alone 272,100 39, ,796 76, , ,883 17,363 30,284 2 person carpool 39,584 7,257 38,895 11,900 40,111 19,166 2,632 4,593 3 person carpool 5, ,601 1,473 4,704 3, person+ carpool 3, , ,189 1, Other means 36,310 3,029 29,851 5,704 32,393 11,302 1,664 3,180 Source: Center for Urban Transportation Research,Florida Demographics and Journey to Work (May 1993).
57 Journey to Work Characteristics Table 2-22 JOURNEY TO WORK CHARACTERISTICS FOR FLORIDA COUNTIES (1990) St. Lucie Santa Rosa Sarasota Seminole Sumter Suwannee Taylor Place of Work Worked in home county 42,394 18, ,958 71,469 6,529 7,351 6,191 Worked outside home county 17,155 17,048 10,246 77,005 4,276 2, Worked outside home state 454 1,493 1,137 1, Mode to Work Private auto or carpool 56,153 34, , ,039 10,071 9,253 6,173 Drive alone 47,260 30,161 89, ,584 8,341 7,481 5,259 Carpool 8,893 4,792 13,249 17,455 1,730 1, Walk ,320 2, Public Transportation Work at home 1, ,717 3, Other means 1, ,696 1, Travel Time to Work Less than 10 minutes 7,787 5,606 18,550 15,854 2,058 1,929 1, to 19 minutes 20,424 10,463 46,058 42,055 3,107 3,355 2, to 29 minutes 13,129 7,860 23,081 32,679 1,598 1, to 39 minutes 10,207 6,760 12,991 29,994 1,922 1, or more minutes 7,220 5,541 7,944 25,546 1,877 1, Worked at home 1, ,717 3, Departure Time to Work 12:00 to 4:59 a.m. 1,325 1,082 1,977 3, :00 to 5:59 a.m. 3,394 3,399 3,832 7, :00 to 6:59 a.m. 12,283 10,401 16,772 29,040 2,194 1,645 1,047 7:00 to 7:59 a.m. 19,314 11,138 35,185 48,197 3,552 3,748 2,983 8:00 to 8:59 a.m. 10,483 4,055 25,801 29,707 1,489 1,461 1,029 9:00 to 9:59 a.m. 3,460 1,379 7,965 9, :00 to 10:59 a.m. 1, ,761 2, :00 to 11:59 a.m ,399 1, :00 to 3:59 p.m. 3,194 2,085 6,312 7, :00 to 11:59 p.m. 3,598 2,061 6,620 8, Worked at home 1, ,717 3, Private Vehicle Occupancy Drive alone 47,260 30,161 89, ,584 8,341 7,481 5,259 2 person carpool 6,543 3,757 11,375 14,776 1,382 1, person carpool 1, ,453 1, person+ carpool 1, Other means 3,850 1,977 9,442 8, , Source: Center for Urban Transportation Research,Florida Demographics and Journey to Work (May 1993).
58 Journey to Work Characteristics Table 2-23 JOURNEY TO WORK CHARACTERISTICS FOR FLORIDA COUNTIES (1990) Union Volusia Wakulla Walton Washington Florida Place of Work Worked in home county 1, ,569 2,646 7,069 3,913 4,956,240 Worked outside home county 1,363 23,230 4,232 3,581 2, ,449 Worked outside home state 8 1, ,763 Mode to Work Private auto or carpool 3, ,505 6,715 10,445 5,810 5,286,567 Drive alone 2, ,755 4,773 8,158 4,523 4,468,021 Carpool ,750 1,942 2,287 1, ,546 Walk 59 4, ,269 Public Transportation 5 1, ,352 Work at home 46 3, ,084 Other means 73 4, ,180 Travel Time to Work Less than 10 minutes , ,923 1, , to 19 minutes 1,009 56,364 1,306 3,455 1,887 1,908, to 29 minutes ,757 1,234 1, ,236, to 39 minutes ,697 1,882 1, ,011, or more minutes ,409 1,760 2,453 1, ,722 Worked at home 46 3, ,084 Departure Time to Work 12:00 to 4:59 a.m , ,901 5:00 to 5:59 a.m , , ,702 6:00 to 6:59 a.m ,451 1,855 3,121 1,833 1,120,718 7:00 to 7:59 a.m. 1,367 48,096 2,572 3,181 1,690 1, :00 to 8:59 a.m , , ,066,549 9:00 to 9:59 a.m. 82 8, ,737 10:00 to 10:59 a.m. 18 3, ,249 11:00 to 11:59 a.m. 25 1, ,948 12:00 to 3:59 p.m , ,816 4:00 to 11:59 p.m , ,379 Worked at home 46 3, ,084 Private Vehicle Occupancy Drive alone 2, ,755 4,773 8,158 4,523 4,468,021 2 person carpool ,506 1,572 1, ,172 3 person carpool 106 2, ,518 4 person+ carpool 58 1, ,856 Other means , ,885 Source: Center for Urban Transportation Research,Florida Demographics and Journey to Work (May 1993).
59 SECTION lll: MODAL STATISTICS Highways Toll Facilities Aviation Public Transportation Rail Seaports Transportation Demand Management Freight Intelligent Transportation Systems
60 3 2 FDOT DISTRICT OFFICES 7 5 District 1 District 2 District 3 District 4 District 5 District 6 District 7 District 8 Ft. Myers Lake City Chipley Ft. Lauderdale Winter Park Miami Tampa Florida's Turnpike (not shown) 1 6 4
61 Pensacola MPO Fort Walton Beach MPO Panama City MPO Tallahassee - Leon MPO Jacksonville MPO Gainesville MPO Ocala- Marion Co. MPO Volusia Co. MPO Pasco Co. MPO Hillsborough Co. MPO Pinellas Co. MPO Sarasota- Manatee Co. MPO Orlando Urban Area MPO Brevard Co. MPO Polk Co. MPO St. Lucie MPO FLORIDA'S METROPOLITAN PLANNING ORGANIZATIONS Lee Co. MPO Naples -Collier Co. MPO Palm Beach Co. MPO Broward Co. MPO Miami MPO
62 North Central Florida RPC West Florida RPC Northeast Florida RPC Apalachee RPC Withlacoochee RPC East Central RPC Tampa Bay RPC Central Florida RPC FLORIDA'S REGIONAL PLANNING COUNCILS Southwest Florida RPC Treasure Coast RPC South Florida RPC
63 3. Highways 3.1 STATE HIGHWAY SYSTEM SUMMARY, DISTRICT STATE HIGHWAY SYSTEM SUMMARY, DISTRICT STATE HIGHWAY SYSTEM SUMMARY, DISTRICT STATE HIGHWAY SYSTEM SUMMARY, DISTRICT STATE HIGHWAY SYSTEM SUMMARY, DISTRICT STATE HIGHWAY SYSTEM SUMMARY, DISTRICT STATE HIGHWAY SYSTEM SUMMARY, DISTRICT FEDERAL FUNCTIONAL CLASSIFICATION CENTERLINE MILES FOR FLORIDA COUNTIES AND DISTRICTS (1994) FEDERAL FUNCTIONAL CLASSIFICATION LANE MILES FOR FLORIDA COUNTIES AND DISTRICTS (1994) FEDERAL FUNCTIONAL CLASSIFICATION DAILY VMT, THOUSANDS, FLORIDA COUNTIES AND DISTRICTS (1994) FLORIDA SYSTEM SUMMARY CENTERLINE MILES ( ) FLORIDA SYSTEM SUMMARY CENTERLINE MILES ( ) FLORIDA SYSTEM SUMMARY DAILY VEHICULAR MILES TRAVELED, THOUSANDS ( ) 3.25 MOTOR FUELS: CONSUMPTION MOTOR-FUEL USE (1993) 3.28 MOTOR VEHICLE REGISTRATION: BY TYPE OF VEHICLE IN FLORIDA ( ) STATE MOTOR-VEHICLE REGISTRATIONS (1993) BRIDGE JURISDICTIONS ROAD PAVEMENT CONDITION BY PERCENT OF LANE MILES, STATE AND LOCAL ROADS CONGESTED PEAK HOUR TRAVEL BY PERCENT OF LANE MILES, STATE AND LOCAL ROADS BRIDGE DEFICIENCIES 3.35 STATEWIDE MINIMUM LEVEL OF SERVICE STANDARDS FOR THE FLORIDA STATE HIGHWAY SYSTEM
64 Table 3-1 STATE HIGHWAY SYSTEM SUMMARY, DISTRICT 1 Centerline Miles 1,854.7 Lane Miles 5,438.1 Fixed Bridges 858 Movable Bridges 16 Adopt-A-Highway Miles 346 Land Area 12,000 sq. miles No. of Counties 12 Population Daily Miles Travelled on State Highways 1.6 million 21 million miles Transit Authorities 4 Transit Vehicles 105 Airports 149 Major Rail Lines 2 Deepwater Ports 1 Source: Florida Department of Transportation,1994 Communications Handbook. Table 3-2 STATE HIGHWAY SYSTEM SUMMARY, DISTRICT 2 Centerline Miles 2,531.9 Lane Miles 7,334.6 Fixed Bridges 1,084 Movable Bridges 12 Adopt-A-Highway Miles 838 Land Area 12,000 sq. miles No. of Counties 18 Population Daily Miles Travelled on State Highways 1.4 million 31 million miles Transit Authorities 2 Transit Vehicles N/A Airports 128 Major Rail Lines 3 Deepwater Ports 2 Source: Florida Department of Transportation,1994 Communications Handbook.
65 Table 3-3 STATE HIGHWAY SYSTEM SUMMARY, DISTRICT 3 Centerline Miles 2,367.5 Lane Miles 6,242.9 Fixed Bridges 783 Movable Bridges 1 Adopt-A-Highway Miles 746 Land Area 11,500 sq. miles No. of Counties 16 Population Daily Miles Travelled on State Highways 1 million 18 million miles Transit Authorities 2 Transit Vehicles N/A Airports 80 Major Rail Lines 4 Deepwater Ports 3 Source: Florida Department of Transportation,1994 Communications Handbook. Table 3-4 STATE HIGHWAY SYSTEM SUMMARY, DISTRICT 4 Centerline Miles 1,388 Lane Miles 5,554 Fixed Bridges 662 Movable Bridges 39 Adopt-A-Highway Miles 372 Land Area 5,000 sq. miles No. of Counties 5 Population Daily Miles Travelled on State Highways 2.4 million 33 million miles Transit Authorities 2 Transit Vehicles 283 Airports 81 Major Rail Lines 2 Deepwater Ports 3 Source: Florida Department of Transportation,1994 Communications Handbook.
66 Table 3-5 STATE HIGHWAY SYSTEM SUMMARY, DISTRICT 5 Centerline Miles 2,125 Lane Miles 6,896 Fixed Bridges 605 Movable Bridges 10 Adopt-A-Highway Miles 642 Land Area 9,000 sq. miles No. of Counties 10 Population Daily Miles Travelled on State Highways 2.3 million 40 million miles Transit Authorities 5 Transit Vehicles 232 Airports 142 Major Rail Lines 5 Deepwater Ports 1 Source: Florida Department of Transportation,1994 Communications Handbook. Table 3-6 STATE HIGHWAY SYSTEM SUMMARY, DISTRICT 6 Centerline Miles 679 Lane Miles 2,671 Fixed Bridges 515 Movable Bridges 14 Adopt-A-Highway Miles 216 Land Area No. of Counties 2 Population Daily Miles Travelled on State Highways N/A 1.9 million 23 million miles Transit Authorities 2 Transit Vehicles 650 Airports 58 Major Rail Lines 2 Deepwater Ports 1 Source: Florida Department of Transportation,1994 Communications Handbook.
67 Table 3-7 STATE HIGHWAY SYSTEM SUMMARY, DISTRICT 7 Centerline Miles 929 Lane Miles 3,356 Fixed Bridges 556 Movable Bridges 13 Adopt-A-Highway Miles 151 Land Area No. of Counties 4 Population Daily Miles Travelled on State Highways N/A 2.0 million 25 million miles Transit Authorities 3 Transit Vehicles N/A Airports 42 Major Rail Lines 1 Deepwater Ports 2 Source: Florida Department of Transportation,1994 Communications Handbook.
68 Table 3-8 FEDERAL FUNCTIONAL CLASSIFICATION CENTERLINE MILES FOR FLORIDA COUNTIES AND DISTRICTS (1994) County Rural Urban Total Principal Arterial Minor Arterial Major Collector Minor Collector Principal Arterial Minor Arterial Total Collector Principal Arterial Minor Arterial Total Collector Total Charlotte Collier Desoto Glades Hardee Hendry Highlands Lee Manatee Okeechobee Polk Sarasota District , ,854.1 Alachua Baker Bradford Clay Columbia Dixie Duval Gilchrist Hamilton Lafayette Levy Madison Nassau Putnam Source: Florida Department of Transportation,State Highway System Mileage Report for December 31, 1994.
69 Table 3-9 FEDERAL FUNCTIONAL CLASSIFICATION CENTERLINE MILES FOR FLORIDA COUNTIES AND DISTRICTS (1994) County Rural Urban Total Principal Arterial Minor Arterial Major Collector Minor Collector Principal Arterial Minor Arterial Total Collector Principal Arterial Minor Arterial Total Collector Total St. Johns Suwannee Taylor Union District , , ,533.4 Bay Calhoun Escambia Franklin Gadsden Gulf Holmes Jackson Jefferson Leon Liberty Okaloosa Santa Rosa Wakulla Walton Washington District , , ,362.1 Broward Indian River Martin Palm Beach Source: Florida Department of Transportation,State Highway System Mileage Report for December 31, 1994.
70 Table 3-10 FEDERAL FUNCTIONAL CLASSIFICATION CENTERLINE MILES FOR FLORIDA COUNTIES AND DISTRICTS (1994) County Rural Urban Total Principal Arterial Minor Arterial Major Collector Minor Collector Principal Arterial Minor Arterial Total Collector Principal Arterial Minor Arterial Total Collector Total St. Lucie District , ,377.4 Brevard Flagler Lake Marion Orange Osceola Seminole Sumter Volusia District , ,055.7 Dade Monroe District Citrus Hernando Hillsborough Pasco Pinellas District ,018.0 Statewide 4, , , , , , ,891.7 Source: Florida Department of Transportation,State Highway System Mileage Report for December 31, 1994.
71 Table 3-11 FEDERAL FUNCTIONAL CLASSIFICATION LANE MILES FOR FLORIDA COUNTIES AND DISTRICTS (1994) County Rural Urban Total Principal Arterial Minor Arterial Major Collector Minor Collector Principal Arterial Minor Arterial Total Collector Principal Arterial Minor Arterial Total Collector Total Charlotte Collier Desoto Glades Hardee Hendry Highlands Lee Manatee Okeechobee Polk ,369.8 Sarasota District 1 2, , , , ,460.0 Alachua Baker Bradford Clay Columbia Dixie Duval , , ,727.1 Gilchrist Hamilton Lafayette Levy Madison Nassau Putnam Source: Florida Department of Transportation,State Highway System Mileage Report for December 31, 1994.
72 Table 3-12 FEDERAL FUNCTIONAL CLASSIFICATION LANE MILES FOR FLORIDA COUNTIES AND DISTRICTS (1994) County Rural Urban Total Principal Arterial Minor Arterial Major Collector Minor Collector Principal Arterial Minor Arterial Total Collector Principal Arterial Minor Arterial Total Collector Total St. Johns Suwannee Taylor Union District 2 2, , , , , ,339.8 Bay Calhoun Escambia Franklin Gadsden Gulf Holmes Jackson Jefferson Leon Liberty Okaloosa Santa Rosa Wakulla Walton Washington District 3 2, , , , , ,235.2 Broward , , ,315.3 Indian River Martin Palm Beach , , ,852.6 Source: Florida Department of Transportation,State Highway System Mileage Report for December 31, 1994.
73 Table 3-13 FEDERAL FUNCTIONAL CLASSIFICATION LANE MILES FOR FLORIDA COUNTIES AND DISTRICTS (1994) County Rural Urban Total Principal Arterial Minor Arterial Major Collector Minor Collector Principal Arterial Minor Arterial Total Collector Principal Arterial Minor Arterial Total Collector Total St. Lucie District 4 1, , , ,657.3 Brevard , ,167.3 Flagler Lake Marion Orange , , ,475.5 Osceola Seminole Sumter Volusia ,132.5 District 5 2, , , , ,864.6 Dade , , ,471.1 Monroe District , , ,773.7 Citrus Hernando Hillsborough , , ,642.0 Pasco Pinellas ,008.7 District , , ,664.1 Statewide 13, , , , , , , ,994.6 Source: Florida Department of Transportation,State Highway System Mileage Report for December 31, 1994.
74 Table 3-14 FEDERAL FUNCTIONAL CLASSIFICATION DAILY VMT, THOUSANDS, FLORIDA COUNTIES AND DISTRICTS (1994) County Rural Urban Total Principal Arterial Minor Arterial Major Collector Minor Collector Principal Arterial Minor Arterial Total Collector Principal Arterial Minor Arterial Total Collector Total Charlotte , ,662.5 Collier 1, , ,300.9 Desoto Glades Hardee Hendry Highlands , ,297.7 Lee 1, , , , ,915.5 Manatee 1, , , ,442.3 Okeechobee Polk 2, , , , , ,343.5 Sarasota 1, , , , ,935.8 District 1 10, , , , , , ,126.9 Alachua 1, , , ,229.2 Baker Bradford Clay , ,457.5 Columbia 1, , ,896.8 Dixie Duval , , , , ,641.1 Gilchrist Hamilton Lafayette Levy Madison Nassau ,396.7 Putnam Source: Florida Department of Transportation,State Highway System Mileage Report for December 31, 1994.
75 Table 3-15 FEDERAL FUNCTIONAL CLASSIFICATION DAILY VMT, THOUSANDS, FLORIDA COUNTIES AND DISTRICTS (1994) County Rural Urban Total Principal Arterial Minor Arterial Major Collector Minor Collector Principal Arterial Minor Arterial Total Collector Principal Arterial Minor Arterial Total Collector Total St. Johns 1, , ,626.0 Suwannee Taylor Union District 2 10, , , , , , ,666.4 Bay , , ,303.5 Calhoun Escambia , , , , ,150.4 Franklin Gadsden ,176.3 Gulf Holmes Jackson ,367.8 Jefferson Leon , , ,988.9 Liberty Okaloosa , , ,960.5 Santa Rosa ,819.4 Wakulla Walton ,184.3 Washington District 3 6, , , , , , ,660.6 Broward , , , , ,536.9 Indian River , ,620.4 Martin 1, , , ,817.8 Palm Beach 1, , , , , ,543.6 Source: Florida Department of Transportation,State Highway System Mileage Report for December 31, 1994.
76 Table 3-16 FEDERAL FUNCTIONAL CLASSIFICATION DAILY VMT, THOUSANDS, FLORIDA COUNTIES AND DISTRICTS (1994) County Rural Urban Total Principal Arterial Minor Arterial Major Collector Minor Collector Principal Arterial Minor Arterial Total Collector Principal Arterial Minor Arterial Total Collector Total St. Lucie , , ,898.1 District 4 4, , , , , ,416.9 Brevard 2, , , ,298.8 Flagler , ,104.7 Lake 1, , , ,978.8 Marion 2, , , ,093.8 Orange 1, , , , , ,049.4 Osceola 1, , , ,957.1 Seminole , , ,793.6 Sumter 1, , ,612.3 Volusia 2, , , ,830.9 District 5 12, , , , , , ,719.4 Dade 1, , , , , ,333.1 Monroe 1, , ,758.1 District 6 2, , , , , ,091.2 Citrus ,090.5 Hernando , ,467.2 Hillsborough 1, , , ,043.0 Pasco 1, , , ,584.0 Pinellas , , , , ,450.9 District 7 4, , , , , ,635.6 Statewide 52, , , , , , , , , ,317.0 Source: Florida Department of Transportation,State Highway System Mileage Report for December 31, 1994.
77 Table 3-17 FLORIDA SYSTEM SUMMARY CENTERLINE MILES ( ) County Charlotte Collier Desoto Glades Hardee Hendry Highlands Lee Manatee Okeechobee Polk Sarasota District 1 1, , , , , , , ,854.1 Alachua Baker Bradford Clay Columbia Dixie Duval Gilchrist Hamilton Lafayette Levy Madison Nassau Putnam St. Johns Suwannee Taylor Union District 2 2, , , , , , , ,533.4 Source: Florida Department of Transportation,State Highway System Mileage Reports for
78 Table 3-18 FLORIDA SYSTEM SUMMARY CENTERLINE MILES ( ) County Bay Calhoun Escambia Franklin Gadsden Gulf Holmes Jackson Jefferson Leon Liberty Okaloosa Santa Rosa Wakulla Walton Washington District 3 2, , , , , , , ,364.6 Broward Indian River Martin Palm Beach St. Lucie District 4 1, , , , , , , ,379.4 Source: Florida Department of Transportation,State Highway System Mileage Reports for
79 Table 3-19 FLORIDA SYSTEM SUMMARY CENTERLINE MILES ( ) County Brevard Flagler Lake Marion Orange Osceola Seminole Sumter Volusia District 5 1, , , , , , , ,055.7 Dade Monroe District Citrus Hernando Hillsborough Pasco Pinellas District , , , , , , ,018.0 State Total 11, , , , , , , ,897.5 Source: Florida Department of Transportation,State Highway System Mileage Reports for
80 Table 3-20 FLORIDA SYSTEM SUMMARY LANE MILES ( ) County Charlotte Collier Desoto Glades Hardee Hendry Highlands Lee Manatee Okeechobee Polk 1, , , , , , , ,369.8 Sarasota District 1 5, , , , , , , ,460.0 Alachua Baker Bradford Clay Columbia Dixie Duval 1, , , , , , , ,727.1 Gilchrist Hamilton Lafayette Levy Madison Nassau Putnam St. Johns Suwannee Taylor Union District 2 7, , , , , , , ,339.8 Source: Florida Department of Transportation,State Highway System Mileage Reports for
81 Table 3-21 FLORIDA SYSTEM SUMMARY LANE MILES ( ) County Bay Calhoun Escambia Franklin Gadsden Gulf Holmes Jackson Jefferson Leon Liberty Okaloosa Santa Rosa Wakulla Walton Washington District 3 6, , , , , , , ,242.1 Broward 1, , , , , , , ,315.3 Indian River Martin Palm Beach 1, , , , , , , ,856.3 St. Lucie District 4 4, , , , , , , ,661.5 Source: Florida Department of Transportation,State Highway System Mileage Reports for
82 Table 3-22 FLORIDA SYSTEM SUMMARY LANE MILES ( ) County Brevard 1, , , , , , , ,167.3 Flagler Lake Marion Orange 1, , , , , , , ,475.5 Osceola Seminole Sumter Volusia 1, , , , , , , ,132.5 District 5 6, , , , , , , ,864.6 Dade 2, , , , , , , ,478.2 Monroe District 6 2, , , , , , , ,780.8 Citrus Hernando Hillsborough 1, , , , , , , ,642.0 Pasco Pinellas ,008.7 District 7 3, , , , , , , ,664.1 State Total 35, , , , , , , ,012.9 Source: Florida Department of Transportation,State Highway System Mileage Reports for
83 Table 3-23 FLORIDA SYSTEM SUMMARY DAILY VEHICULAR MILES TRAVELLED, THOUSANDS ( ) County Charlotte 1, , , , , , , ,662.5 Collier 1, , , , , , , ,300.9 Desoto Glades Hardee Hendry Highlands 1, , , , , ,297.7 Lee 3, , , , , , , ,915.5 Manatee 2, , , , , , , ,442.3 Okeechobee Polk 5, , , , , , , ,343.5 Sarasota 3, , , , , , , ,935.8 District 1 20, , , , , , , ,126.9 Alachua 3, , , , , , , ,229.2 Baker Bradford Clay 1, , , , , , , ,457.5 Columbia 1, , , , , , , ,896.8 Dixie Duval 11, , , , , , , ,641.1 Gilchrist Hamilton 1, , Lafayette Levy Madison Nassau 1, , , , , , , ,396.7 Putnam , St. Johns 2, , , , , , , ,626.0 Suwannee Taylor Union District 2 28, , , , , , , ,666.4 Bay 2, , , , , , , ,303.5 Calhoun Escambia 3, , , , , , , ,158.2 Franklin Gadsden 1, , , , , , , ,176.3 Gulf Source: Florida Department of Transportation,State Highway System Mileage Reports for
84 Table 3-24 FLORIDA SYSTEM SUMMARY DAILY VEHICULAR MILES TRAVELLED, THOUSANDS ( ) County Holmes Jackson 1, , , , , , , ,367.8 Jefferson Leon 2, , , , , , , ,988.9 Liberty Okaloosa 2, , , , , , , ,979.4 Santa Rosa 1, , , , , , , ,819.4 Wakulla Walton , , , , , , ,184.3 Washington District 3 17, , , , , , , ,687.4 Broward 13, , , , , , , ,536.9 Indian River 1, , , , , , , ,620.4 Martin 1, , , , , , , ,817.8 Palm Beach 11, , , , , , , ,558.8 St. Lucie 2, , , , , , , ,898.8 District 4 30, , , , , , , ,432.7 Brevard 5, , , , , , , ,298.8 Flagler , , ,104.7 Lake 2, , , , , , , ,978.8 Marion 3, , , , , , , ,093.8 Orange 10, , , , , , , ,049.4 Osceola 3, , , , , , , ,957.1 Seminole 3, , , , , , , ,793.6 Sumter 1, , , , , , , ,612.3 Volusia 6, , , , , , , ,830.9 District 5 37, , , , , , , ,719.4 Dade 18, , , , , , , ,355.0 Monroe 1, , , , , , , ,758.1 District 6 20, , , , , , , ,113.1 Citrus 1, , , , , ,090.5 Hernando 1, , , , , , , ,467.2 Hillsborough 11, , , , , , , ,043.0 Pasco 2, , , , , , , ,584.0 Pinellas 6, , , , , , , ,450.9 District 7 22, , , , , , , ,635.6 State Total 178, , , , , , , ,381.6 Source: Florida Department of Transportation,State Highway System Mileage Reports for
85 Table 3-25 MOTOR FUELS: CONSUMPTION BY USE IN FLORIDA, (in thousands of gallons) Year Total Quantity Consumed 1 Nonhighway Use 2 Highway Use ,549, ,969 1,331, ,695, ,851 1,454, ,787, ,149 1,525, ,933, ,033 1,641, ,950, ,431 1,765, ,980, ,451 1,800, ,071, ,801 1,917, ,169, ,988 2,022, ,286, ,073 2,160, ,409, ,646 2,291, ,562, ,505 2,428, ,711, ,851 2,561, ,959, ,496 2,803, ,215, ,949 3,069, ,484, ,969 3,312, ,771, ,210 3,585, ,215, ,098 4,045, ,695, ,054 4,494, ,510, ,058 4,342, ,639, ,547 4,456, ,827, ,774 4,650, ,023, ,635 4,846, ,337, ,114 5,152, ,374, ,358 5,171, ,293, ,430 5,116, ,390, ,165 5,240, ,469, ,779 5,317, ,723, ,810 5,548, ,934, ,767 5,740, ,110, ,402 5,843, ,394, ,337 6,116, ,700, ,337 6,387, ,863, ,739 6,530, ,034, ,036 6,680, ,043, ,520 6,674, ,930, ,863 6,549, ,163, ,516 6,827,210 1 Includes losses allowed for evaporation and handling. 2 Gasoline only. NOTE: Includes gasoline and all other fuels (except under nonhighway use) under state motor fuel laws. Source: 1994 Florida Statistical Abstract (Bureau of Economic and Business Research, College of Business Administration, University of Florida, 1994)
86 Table 3-26 MOTOR-FUEL USE (1993) (THOUSANDS OF GALLONS) State Private and Commercial Use Public Use (Gasoline) Summary of Total Use Losses Allowed Highway Non-Highway (Gasoline) Federal State, County, and Municipal Total Highway Non-Highway Total (Highway Highway Non- Total Amount Percent (Gasoline) Highway Change 1993/ 1992 Total for Evaporation (1) (2) (3) (4) (5) (6) (7) (8) (9) (10) (11) (12) (13) (14) Alabama 2,719,633 50,305 2,769,938 2,736 30,709 1,753 32,462 35,198 2,753, ,058 2,805,136 2,765 2,807,901 Alaska 350,729 30, ,199 1,576 6, ,725 8, , , , ,500 Arizona 2,241,369 37,495 2,278,864 5,101 27,539 1,436 28,975 34,076 2,274, ,931 2,312,940 18,570 2,331,510 Arkansas 1,671,870 34,127 1,705,997 1,538 23,227 1,211 24,438 25,976 1,696, ,338 1,731,973 13,049 1,745,022 California 14,611, ,906 14,826,108 23, ,970 9, , ,293 14,816, ,341 15,040,401-15,040,401 Colorado 1,817,620 31,756 1,849,376 4,295 28,664 1,494 30,158 34,453 1,850, ,250 1,883,829 7,941 1,891,770 Connecticut 1,496,768 88,539 1,585,307 2,406 19, ,982 23,388 1,519, ,528 1,608,695 (1,643) 1,607,052 Delaware 390,929 11, ,272 4,435 4, ,777 9, , , ,484 3, ,020 Dist. of Col. 189,576 3, ,769 2,969 3, ,492 6, , , ,230 (357) 198,873 Florida 7,097, ,769 7,263,015 7,785 82,638 4,091 86,729 94,514 7,187, ,860 7,357,529 73,678 7,431,207 Georgia 4,860,690 57,310 4,918,000 4,124 49,390 2,575 51,965 56,089 4,914, ,885 4,974,089 (3,812) 4,970,277 Hawaii 388,868 21, , , ,340 10, , , ,806 3, ,694 Idaho 673,731 23, ,168 2,416 11, ,681 14, , , ,265 5, ,674 Illinois 5,494, ,561 5,595,708 5,879 84,655 4,413 89,068 94,947 5,584, ,974 5,690,655 29,658 5,720,313 Indiana 3,545,790 59,878 3,605,668 2,436 45,378 2,366 47,744 50,180 3,593, ,244 3,655,848 28,298 3,684,146 Iowa 1,642,492 71,144 1,713,636 1,620 28,660 1,494 30,154 31,774 1,672, ,638 1,745,410 22,248 1,767,658 Kansas 1,462,341 49,821 1,512,162 1,619 26,114 1,361 27,475 29,094 1,490, ,182 1,541,256 12,377 1,553,633 Kentucky 2,480,016 59,092 2,539,108 2,625 32,451 1,692 34,143 36,768 2,515, ,784 2,575,876 19,705 2,595,581 Louisiana 2,278,213 66,098 2,344,311 2,662 33,299 1,736 35,035 37,697 2,314, ,834 2,382,008 (1,968) 2,380,040 Maine 704,836 14, , , ,940 10, , , ,157 2, ,831 Maryland 2,395,640 34,284 2,429,924 4,043 25,443 1,326 26,769 30,812 2,425, ,610 2,460,736 5,951 2,466,687 Massachusetts 2,593,273 30,869 2,624,142 3,991 33,486 1,746 35,232 39,223 2,630, ,615 2,663,365 24,157 2,687,522 Michigan 5,073, ,401 5,173,861 4,706 62,512 3,259 65,771 70,477 5,140, ,660 5,244,338 45,650 5,289,988 Minnesota 2,434,335 88,681 2,523,016 2,834 40,040 2,087 42,127 44,961 2,477, ,768 2,567,977 22,198 2,590,175 Mississippi 1,649,714 34,689 1,684,403 2,063 24,249 1,264 25,513 27,576 1,676, ,953 1,711,979 13,921 1,725,900 Missouri 3,371,550 91,008 3,462,558 3,272 43,197 2,252 45,449 48,721 3,418, ,260 3,511,279 28,674 3,539,953 Montana 569,154 29, ,467 2,359 9, ,977 12, , , , ,803 Nebraska 975,831 36,179 1,012,010 1,567 17, ,075 19, , ,075 1,031,652-1,031,652 Nevada 843,962 15, ,187 3,181 9, ,449 13, , , ,817 7, ,853 New Hampshire 565,359 12, , , ,039 9, , , ,039 3, ,083 Total Quantity See Note 2 on page 88. Source: U.S. Department of Transportation, Federal Highway Administration, 1993 Highway Statistics (October 1993).
87 Table 3-27 MOTOR-FUEL USE (THOUSANDS OF GALLONS) State Private and Commercial Use Public Use (Gasoline) Summary of Total Use Losses Allowed for Evaporation Handling, etc. Highway Non-Highway (Gasoline) Federal (Highway Civilian Use Only) Total Highway Non- Highway State, County, and Municipal Total Highway Non-Highway (Gasoline) Total Amount Percent Change 1993/ 1992 Total (Gasoline) (2) Total Quantity Consumed (1) (2) (3) (4) (5) (6) (7) (8) (9) (10) (11) (12) (13) (14) New Jersey 3,353,618 59,353 3,412,971 5,042 46,965 2,449 49,414 54,456 3,405, ,802 3,467,427-3,467,427 New Mexico 1,064,425 29,892 1,094,317 3,615 14, ,294 18,909 1,082, ,650 1,113, ,113,230 New York 6,261,951 98,109 6,360,060 11,465 99,208 5, , ,845 6,372, ,281 6,475,905 71,697 6,547,602 North Carolina 3,992,645 67,459 4,060,104 2,962 74,703 2,533 77,236 80,198 4,070, ,992 4,140,302 36,537 4,176,839 North Dakota 432,266 33, ,916 1,089 8, ,631 9, , , ,636 1, ,356 Ohio 5,711,765 99,217 5,810,982 4,978 77,700 4,051 81,751 86,729 5,794, ,268 5,897,711 49,475 5,947,186 Oklahoma 2,080,764 60,830 2,141,594 2,721 30,265 1,578 31,843 34,564 2,113, ,408 2,176,158 17,731 2,193,889 Oregon 1,718,023 35,861 1,753,884 4,187 22,864 1,192 24,056 28,243 1,745, ,053 1,782,127-1,782,127 Pennsylvania 5,634,814 66,709 5,701,523 7,324 70,933 3,698 74,631 81,955 5,713, ,407 5,783,478 35,789 5,819,267 Rhode Island 403,120 5, , , ,208 8, , , ,101 4, ,719 South Carolina 2,266,465 42,084 2,308,549 2,638 25,337 1,321 26,658 29,296 2,294, ,405 2,337,845 (2,102) 2,335,743 South Dakota 485,591 27, ,367 1,419 9, ,525 10, , , ,311 4, ,461 Tennessee 3,144,015 74,365 3,218,380 5,282 47,604 2,075 49,679 54,961 3,196, ,440 3,273,341 26,484 3,299,825 Texas 10,202, ,702 10,423,769 12, ,990 6, , ,823 10,344, ,479 10,572, ,572,632 Utah 957,619 21, ,967 2,177 16, ,397 19, , , ,541 8,307 1,006,848 Vermont 361,724 5, , , ,579 5, , , ,394 3, ,040 Virginia 3,673,593 54,167 3,727,760 4,840 43,974 2,419 46,393 51,233 3,722, ,586 3,778,993 1,341 3,780,334 Washington 2,683,027 52,322 2,735,349 6,335 32,489 1,694 34,183 40,518 2,721, ,016 2,775,867 5,898 2,781,765 West Virginia 1,020,673 11,556 1,032,229 1,217 15, ,807 18,024 1,037, ,389 1,050,253 1,069 1,051,322 Wisconsin 2,618,731 62,923 2,681,654 2,359 41,209 2,148 43,357 45,716 2,662, ,071 2,727,370 22,270 2,749,640 Wyoming 504,502 19, ,589 1,309 6, ,349 7, , , , ,247 Total 135,161,742 2,815, ,977, ,345 1,838,148 94,079 1,932,227 2,126, ,194, ,909, ,103, , ,779,218 Percent 96.47% 2.01% 98.48% 0.14% 1.31% 0.07% 1.38% 1.52% 97.92% % % - - (1) This table is one of a series (MF-21 through MF-26) giving an analysis of motor-fuel consumption, based on (2) Some States make a flat percentage allowance for losses in storage and handling, and others allow losses reports from State motor-fuel tax agencies. Gasohol is included with gasoline. In order to make the data uniform not to exceed a specified percentage. Still others permit distributors to claim stock losses in reconciling and complete, public use and nonhighway use were estimated by the Federal Highway Administration. These inventories, thus exempting the lost volume from taxation. Losses by destruction, where reported separately estimates may not be comparable to data for prior years due to revised estimation procedures. The resulting are included in this column. The maximum allowance used in this analysis to cover losses in storage and volumes differ in many cases from the unadjusted data reported in table MF-2. For some States, data are not handling are 1 percent. Because of accounting methods, losses can be reported as a net gain. comparable to prior years due to changes in data analysis and/or improvements in reporting procedures. All data are subject to review and revision. Source: U.S. Department of Transportation, Federal Highway Administration, 1993 Highway Statistics (October 1994).
88 Year Table 3-28 MOTOR VEHICLE REGISTRATIONS: NUMBER BY TYPE OF VEHICLE IN FLORIDA, (in thousands) All Motor Vehicles* Automobiles Buses Trucks Motorcycles , , , , , , , , , , , , , , , , , , , , , , , , , , , , , , , , , , , , , , , , , , , , , , , , , , , , * Includes motorcycles. NOTE: Excludes vehicles owned by the military service. Source: 1994 Florida Statistical Abstract (Bureau of Economic and Business Research, College of Business Administration, University of Florida, 1994).
89 Table 3-29 STATE MOTOR-VEHICLE REGISTRATIONS (1993) (1) Motor Vehicles State Automobiles Buses Trucks All Motor Vehicles Comparison of Total Motor-Vehicle Registrations, Private and Commercial (including taxicabs) Publicly Owned (3) Total Private and Commercial (4) Publicly Owned (3) Total Private and Commercial Publicly Owned (3) Total Private and Commercial Publicly Owned (3) Total Total 1992 Registrations Increase or Decrease 1993 Percent Change Motorcycles Private and Commercial Alabama 2,122,040 14,237 2,136,277 2,060 6,291 8,351 1,221,164 24,573 1,245,737 3,345,264 45,101 3,390,365 3,304,064 86, , Alaska 307,938 2, ,002 1, , ,020 7, , ,751 9, , ,095 2, , Arizona 2,052,873 15,565 2,068,438 1,351 3,049 4, ,585 16, ,751 2,856,809 34,780 2,891,589 2,800,901 90, , Arkansas 977,765 9, ,955 1,224 4,388 5, ,608 10, ,058 1,503,597 24,028 1,527,625 1,501,480 26, , California 17,134, ,450 17,300,825 26,002 15,421 41,423 5,251, ,713 5,481,464 22,412, ,584 22,823,712 22,202, , ,245 12,565 Colorado 2,244,327 9,370 2,253,697 1,504 4,062 5, ,617 (5) 23,208 23,208 2,995,448 36,640 3,032,088 2,915, , , Connecticut 2,444,846 10,965 2,455,811 7, , ,663 23, ,348 2,558,936 35,433 2,594,369 2,569,164 25, , Delaware 422,958 5, ,541 1, , ,976 2, , ,583 8, , ,982 9, , Dist. of Col. 245,890 3, ,844 2, ,737 5,406 5,650 11, ,676 9, , ,406 7, , Florida 7,984,802 87,690 8,072,492 4,814 33,947 38,761 1,931, ,255 2,058,303 9,920, ,892 10,169,556 10,232,336 (62,780) ,370 5,476 Georgia 3,939,156 20,735 3,959,891 3,416 11,330 14,746 1,606,039 51,749 1,657,788 5,548,611 83,814 5,632,425 5,899,437 (267,012) , Hawaii 653,878 5, ,365 3, ,241 93,261 6,624 99, ,474 13, , ,094 (10,603) , Idaho 631,008 5, ,250 1,262 2,110 3, ,621 19, , ,891 27,288 1,023,179 1,034,290 (11,111) , Illinois 6,588,729 61,436 6,650,165 14,419 1,572 15,991 1,386,546 17,762 1,404,308 7,989,694 80,770 8,070,464 7,981,725 88, , Indiana 3,394,011 19,897 3,413,908 8,900 13,990 22,890 1,198,353 35,150 1,233,503 4,601,264 69,037 4,670,301 4,515, , , Iowa 1,936,987 10,834 1,947,821 1,333 7,711 9, ,997 25, ,282 2,694,317 43,830 2,738,147 2,705,754 32, , Kansas 1,256,895 7,115 1,264,010 1,529 2,225 3, ,525 16, ,465 1,895,949 26,280 1,922,229 1,920,568 1, , Kentucky (6) 1,690,652 22,473 1,713,125 1,835 9,996 11, ,054 6, ,174 2,590,541 38,589 2,629,130 2,983,220 (354,090) ,493 2 Louisiana 1,983,123 26,961 2,010,084 14,726 4,896 19,622 1,117,688 18,761 1,136,449 3,115,537 50,618 3,166,155 3,093,511 72, , Maine 787,730 5, , ,232 2, ,957 10, ,358 1,010,308 17,634 1,027, ,134 49, , Maryland 2,944,238 12,450 2,956,688 6,333 4,566 10, ,480 20, ,971 3,522,051 37,507 3,559,558 3,688,899 (129,341) , Massachusetts 3,312,383 14,488 3,326,871 10, , ,073 30, ,887 3,791,745 45,752 3,837,497 3,663, , , Michigan 5,686,692 43,915 5,730,607 9,330 14,300 23,630 1,574,151 70,170 1,644,321 7,270, ,385 7,398,558 7,310,552 88, ,119 1,287 Minnesota 2,895,400 10,247 2,905,647 6,641 8,087 14, ,812 22, ,728 3,674,853 41,250 3,716,103 3,483, , , Mississippi 1,516,864 9,616 1,526,480 3,153 5,897 9, ,520 16, ,109 1,967,537 32,102 1,999,639 1,953,973 45, ,673 1 Missouri 2,850,633 7,245 2,857,878 4,343 7,737 12,080 1,180,212 15,516 1,195,728 4,035,188 30,498 4,065,686 4,004,062 61, , Montana 548,311 6, ,753 1,118 1,776 2, ,707 15, , ,136 24, , ,789 32, , Nebraska 930,404 11, ,264 1,100 4,694 5, ,089 17, ,968 1,404,593 34,433 1,439,026 1,355,050 83, , Publicly Owned (3) Source: U.S. Department of Transportation, Federal Highway Administration, 1993 Highway Statistics (October 1994).
90 Table 3-30 STATE MOTOR-VEHICLE REGISTRATIONS (1993) (1) Motor Vehicles State Automobiles Buses Trucks All Motor Vehicles Comparison of Total Motor-Vehicle Registrations, Private Publicly Owned (3) Total Private and Commercial (4) Publicly Owned (3) Total Private and Commercial Publicly Owned (3) Total Private and Commercial Publicly Owned (3) Total Total 1992 Registrations Increase or Decrease 1993 Percent Change Motorcycles Private and Commercial Nevada 622,163 9, ,592 1, , ,942 12, , ,634 22, , ,936 16, , New Hampshire 739,162 3, ,896 1, , ,704 (5) 10,416 10, ,276 14, , ,647 65, ,427 0 New Jersey 5,123,861 56,624 5,180,485 15,626 3,053 18, ,397 (5) 87,314 87,314 5,493, ,991 5,640,875 5,591,354 49, , New Mexico 843,704 12, ,920 2, , ,530 18, ,321 1,388,740 31,913 1,420,653 1,351,695 68, , New York 8,676,218 70,746 8,746,964 18,498 22,311 40,809 1,286,905 (5) 87,823 87,823 9,981, ,880 10,162,501 9,779, , ,726 1,264 North Carolina 3,811,288 29,707 3,840,995 8,963 25,027 33,990 1,431,612 57,974 1,489,586 5,251, ,708 5,364,571 5,306,911 57, , North Dakota 393,760 3, , ,750 2, ,795 8, , ,125 13, , ,335 6, , Ohio 7,448,445 34,392 7,482,837 11,096 20,615 31,711 1,702,988 61,437 1,764,425 9,162, ,444 9,278,973 9,029, , , Oklahoma 1,748,872 10,031 1,758,903 1,855 12,188 14, ,915 39, ,407 2,709,642 61,711 2,771,353 2,736,955 34, , Oregon 1,978,020 22,625 2,000,645 3,623 7,917 11, ,068 25, ,942 2,567,711 56,416 2,624,127 2,583,405 40, , Pennsylvania 6,559,139 40,329 6,599,468 25,562 6,924 32,486 1,594,667 (5) 55,445 55,445 8,179, ,698 8,282,066 8,179, , , Rhode Island 585,806 3, ,198 1, ,583 99,110 (5) 5,419 5, ,485 8, , ,025 73, , South Carolina 1,988,372 9,110 1,997,482 4,462 10,025 14, ,736 22, ,742 2,642,570 41,141 2,683,711 2,600,929 82, , South Dakota 481,060 4, , ,854 2, ,974 11, , ,740 17, , ,690 87, , Tennessee 3,969,479 19,704 3,989,183 3,303 12,396 15, ,176 48, ,966 4,882,958 80,890 4,963,848 4,645, , , Texas 8,719, ,546 8,880,679 15,234 50,436 65,670 3,954, ,182 4,171,972 12,689, ,164 13,118,321 12,767, , ,791 3,981 Utah 830,794 9, , , ,797 12, ,755 1,312,005 22,779 1,334,784 1,252,268 82, , Vermont 358,549 2, , ,201 1, ,824 6, , ,004 10, , ,810 18, ,577 0 Virginia 4,094,728 31,666 4,126,394 2,351 13,874 16,225 1,233,560 31,556 1,265,116 5,330,639 77,096 5,407,735 5,238, , , Washington 3,105,881 16,851 3,122,732 2,844 4,598 7,442 1,248,026 34,798 1,282,824 4,356,751 56,247 4,412,998 4,465,843 (52,845) , West Virginia 811,258 17, , ,641 3, ,324 34, ,809 1,290,504 54,891 1,345,395 1,272,907 72, , Wisconsin 2,447,561 12,581 2,460,142 7,621 4,318 11,939 1,303,887 38,727 1,342,614 3,759,069 55,626 3,814,695 3,734,711 79, , Wyoming 279,179 4, , ,476 2, ,786 10, , ,876 15, , ,815 74, , Total 145,101,340 1,212, ,314, , , ,432 40,977,036 1,829,318 42,806, ,642,869 3,420, ,063, ,362,228 3,701, ,939,963 37,893 Publicly Owned (3) (1) For additional details of publicly owned vehicles and of trucks, buses, and trailers registered, see tables MV-7, 9, 10, 11, (5) The following farm trucks, registered at a nominal fee and restricted to use in the vicinity of respectively. Excludes 8,001 Diplomatic Corps vehicles issued license plates by the United States Department of State. the owner's farm, are not included in this table: Connecticut, 7,863; New Hampshire, 3,497; (2) Where the registration year is not more than one month removed from the calendar year, registration-year data are given. New Jersey, 6,186; New York, 26,005; Pennsylvania, 22,088; and Rhode Island, 994. Where the registration year is more than one month removed, registrations are given for e thcalendar year. (6) The State reported motor-vehicle registration data for 1993 do not include transfer tags or (3) Includes Federal, State, county, and municipal vehicles. Vehicles owned by the military services are not included. registrations. (4) The numbers of private and commercial buses given here are estimates by the Federal Highway Administration of the numbers in operation, rather than the registration counts of the States. Source: U.S. Department of Transportation, Federal Highway Admi nistration, 1993 Highway Statistics (October 1994).
91 Table BRIDGES BY JURISDICTION Jurisdiction Number of Bridges State-Owned 6,046 Locally-Owned 4,810 Total 10,856 Source: 1993 National Bridge Inventory Data Base, FDOT. Table ROAD PAVEMENT CONDI TION BY PERCENT OF LANE MILES, STATE AND LOCAL ROADS Functional System Poor Mediocre Fair Good Total Rural Interstates 13.1% 17.9% 21.1% 47.9% 100.0% Other Principal Arterials 4.1% 7.7% 37.6% 50.6% 100.0% Minor Arterials 3.5% 9.8% 19.1% 67.6% 100.0% Major Collectors 0.4% 21.2% 44.8% 33.6% 100.0% Minor Collectors 13.1% 34.3% 29.3% 23.3% 100.0% Urban Interstates 16.7% 7.1% 11.3% 64.9% 100.0% Other Freeways & Expressways 0.1% 2.2% 15.4% 82.3% 100.0% Other Principal Arterials 3.9% 11.4% 36.7% 48.0% 100.0% Minor Arterials 2.8% 13.2% 28.1% 55.9% 100.0% Collectors 9.3% 14.6% 34.8% 41.3% 100.0% Total 6.5% 16.3% 32.2% 45.0% 100.0% Poor: (2.5 for interstate) Mediocre: ( for interstate) Fair: ( for interstate) Good: Source: 1992 HPMS.
92 Table CONGESTED PEAK HOUR TRAVEL BY PERCENT OF LANE MILES, STATE AND LOCAL ROADS Functional System Rural Moderately Congested Highly Congested Total Congested Interstates 7.3% 2.9% 10.2% Other Principal Arterials 0.1% 0.0% 0.1% Minor Arterials 0.0% 0.5% 0.5% Major Collectors 0.0% 0.7% 0.7% Minor Collectors 0.1% 0.0% 0.1% Urban Interstates 14.2% 51.0% 65.2% Other Freeways & Expressways 10.3% 13.9% 24.2% Other Principal Arterials 7.7% 5.9% 13.6% Minor Arterials 5.8% 7.0% 12.8% Collectors 0.8% 1.0% 1.8% Total 2.8% 3.8% 6.6% Moderately congested: volume/service flow ratio between 0.8 and Highly congested: volume/service flow ratio greater than Source: 1992 HPMS. Table BRIDGE DEFICIENCIES Deficiency Percent of Bridges Structurally Deficient 7.9% Functionally Deficient 28.6% Functionally Adequate 63.5% Source: 1993 BNIP.
93 Table 3-35 STATEWIDE MINIMUM LEVEL OF SERVICE STANDARDS FOR THE FLORIDA STATE HIGHWAY SYSTEM Rural Areas Transitioning Urbanized Areas, Urban Areas, or Communities Urbanized Areas Under 500,000 Urbanized Areas Over 500,000 Roadways Parallel to Exclusive Transit Facilities Inside Transportation Concurrency Management Areas Constrained and Backlogged Roadways INTRASTATE Limited Access Highway (Freeway) B C C(D) D(E) D(E) D(E) Maintain Controlled Access Highway B C C D E E Maintain OTHER STATE ROADS Other Multilane B C D D E * Maintain Two-Lane C C D D E * Maintain Level of service standards inside of parentheses apply to general use lanes only when exclusive through lanes exist. * means the level of service standard will be set in a transportation mobility element that meets the requirements of Rule 9J NOTE: Levels of service letter designations are defined in the Transportation Research Board's Highway Capacity Manual Special Report 209. Source: Florida Department of Transportation,Florida Highway System Plan Level of Service Manual (April 1992).
94 3. Toll Facilities 3.36 FLORIDA-OFFICE OF TOLL OPERATIONS (TOTAL LANES BY PROJECT) TURNPIKE SUMMARY FOR FLORIDA COUNTIES AND DISTRICTS (1994)
95 Table 3-36 FLORIDA-OFFICE OF TOLL OPERATIONS (TOTAL LANES BY PROJECT) Project Name # of Lanes Manual Automatic Total Beeline Expressway Choctawhatchee Bay Everglades Parkway Florida's Turnpike Holland E-W Expressway Homestead Extension Mayport Ferry Metro-Dade Expressway System Navarre Bridge Orlando Airport Expressway Orlando-Orange Pinellas Bayway System Polk County Parkway Sawgrass Expressway Seminole Co. Expressway Southern Conn. Extension Suncoast Parkway Sunshine Skyway Bridge Tampa Crosstown Expressway Veteran's Expressway Totals Source: Florida Department of Transportation, Office of Toll Operations,Total Lanes by Project (1995).
96 Table 3-37 TURNPIKE SUMMARY FOR FLORIDA COUNTIES AND DISTRICTS (1994) County Rural Urban Total Centerline Miles Lane Miles DVMT (Thous.) Centerline Miles Lane Miles DVMT (Thous.) Centerline Miles Lane Miles DVMT (Thous.) Charlotte Collier Desoto Glades Hardee Hendry Highlands Lee Manatee Okeechobee Polk Sarasota District Alachua Baker Bradford Clay Columbia Dixie Duval Gilchrist Hamilton Lafayette Levy Madison Nassau Putnam Source: Florida Department of Transportation,State Highway System Mileage Report for December 31, 1994.
97 Table 3-38 TURNPIKE SUMMARY FOR FLORIDA COUNTIES AND DISTRICTS (1994) County Rural Urban Total Centerline Miles Lane Miles DVMT (Thous.) Centerline Miles Lane Miles DVMT (Thous.) Centerline Miles Lane Miles DVMT (Thous.) St. Johns Suwannee Taylor Union District Bay Calhoun Escambia Franklin Gadsden Gulf Holmes Jackson Jefferson Leon Liberty Okaloosa Santa Rosa Wakulla Walton Washington District Broward , ,137.0 Indian River Martin Palm Beach ,002.6 Source: Florida Department of Transportation,State Highway System Mileage Report for December 31, 1994.
98 Table 3-39 TURNPIKE SUMMARY FOR FLORIDA COUNTIES AND DISTRICTS (1994) County Rural Urban Total Centerline Miles Lane Miles DVMT (Thous.) Centerline Miles Lane Miles DVMT (Thous.) Centerline Miles Lane Miles DVMT (Thous.) St. Lucie District , ,130.3 Brevard Flagler Lake Marion Orange Osceola Seminole Sumter Volusia District , ,359.8 Dade , ,120.8 Monroe District , ,120.8 Citrus Hernando Hillsborough Pasco Pinellas District Statewide , , , ,712.4 Source: Florida Department of Transportation,State Highway System Mileage Report for December 31, 1994.
99 3. Aviation Map FLORIDA S AIRPORTS SUMMARY STATISTICS FOR LARGE, MEDIUM, AND SMALL AIR TRAFFIC HUBS IN FLORIDA (1993) FLORIDA S AVIATION SYSTEM (1992)
100 FLORIDA'S AIRPORTS
101 Table 3-40 SUMMARY STATISTICS FOR LARGE, MEDIUM, AND SMALL AIR TRAFFIC HUBS IN FLORIDA (1993) Area (Airport Name) Percent of Enplanements Aircraft Departures Total Performed Enplaned Revenue Passengers Enplaned Revenue Tons Scheduled Freight Mail Florida 411, ,077 34,192, , , Miami/Ft. Lauderdale (Ft. Lauderdale-Hollywood Int'l) 23,388 1,120, , , ,077 35,312, , , ,273 39,579 3,877,844 47, , (Miami Int'l) , ,367 10,137, , , (Opa Locka) Community Total , ,948 14,014, , , Orlando (Herndon) (Orlando Int'l) ,823 91,166 8,714,400 49, , Community Total ,824 91,166 8,714,400 49, , Tampa & St. Petersburg/ Clearwater & Lakeland (Lakeland Municipal) (MacDill AFB) (St. Petersburg/Clwtr Int'l) , , (Tampa Int'l) ,601 60,377 4,576,551 25, , Community Total ,961 61,225 4,771,252 25, , Ft. Myers (Page Field) (Southwest) ,493 19,948 1,700,882 2, , Community Total ,746 20,202 1,700,882 2, , Source: U.S. Department of Transportation, Federal Aviation Administration, Airport Activity Statistics of Certified Route Carriers (1993).
102 Table 3-41 SUMMARY STATISTICS FOR LARGE, MEDIUM, AND SMALL AIR TRAFFIC HUBS IN FLORIDA (1993) Area (Airport Name) Jacksonville Percent of Enplanements Aircraft Departures Total Performed Enplaned Revenue Passengers Enplaned Revenue Tons Scheduled Freight Mail (Cecil Field NAS) ,471 (Jacksonville Int'l) ,858 18,994 1,226,313 6, , (Jacksonville NAS) ,510 10, (Craig Municipal) Community Total ,795 19,249 1,234,294 17, , West Palm Beach/ Palm Beach (Palm Beach Int'l) ,242 26,593 2,374,108 3, , Daytona Beach (Daytona Beach Regional) ,417 5, , Melbourne (Cape Kennedy Regional) ,412 4, , Pensacola (Pensacola NAS) , (Pensacola Regional) ,404 7, ,733 1, , Community Total ,886 7, ,921 10, , Sarasota/Bradenton (Sarasota-Bradenton) ,820 10, , Tallahassee (Tallahassee MUNI) ,309 7, ,086 1, Source: U.S. Department of Transportation, Federal Aviation Administration,Airport Activity Statistics of Certified Route Carriers (1993).
103 Table 3-42 FLORIDA'S AVIATION SYSTEM (1992) Public Airports Region Size (acres) Commercial Service Airports Based Aircraft (1990) Annual Operations (1990) Annual Enplanements (1990) Okaloosa County Air Terminal Northwest Florida $8, ,941 Panama City - Bay County Regional $181, ,029 Pensacola Regional 1, $145, ,010 Tallahassee Regional 2, $126, ,000 Gainesville Regional North Central Florida 1, $115, ,194 Jacksonville International Daytona Beach Regional Northeast Florida Metropolitan Area East Central Florida Metropolitan Area 7, $156,673 1,370,264 1, $292, ,339 Melbourne Regional 2, $276, ,585 Orlando International 14, $301,636 9,001,918 St. Petersburg - Clearwater International West Central Florida Metropolitan Area 1, $154, ,483 Tampa International 3, $238,797 5,310,105 Naples Municipal Southwest Florida $107, ,105 Sarasota - Bradenton 1, $174,938 1,021,360 Southwest Florida Regional 3, $76,125 1,872,335 Vero Beach Municipal Treasure Coast 1, $265,866 12,000 Chalk's Seaplane Base (Private) Ft. Lauderdale Hollywood International South Florida Metropolitan Area $3,552 28,800 1, $229,000 4,553,583 Key West International $98, ,510 Marathon $63,050 20,882 Miami International 3, $438,589 12,175,219 Palm Beach International 1, $225,693 2,699,800 Source: Florida Department of Transportation,The Florida Aviation System Plan Statewide Summary
104 Table 3-43 FLORIDA'S AVIATION SYSTEM (1992) Public Airports Region Size (acres) Reliever Airports Craig Municipal Northeast Florida Metropolitan Area Based Aircraft (1990) Annual Operations (1990) Annual Enplanements (1990) 1, $184,943 Not recorded Fernandina Beach Municipal $23,042 Not recorded Herlong 1, $67,000 Not recorded St. Augustine - St. Johns County Central Florida Regional East Central Florida Metropolitan Area $135,259 Not recorded 1, $135,825 Not recorded Kissimmee Municipal $126,080 Not recorded Merritt Island $126,217 Not recorded Orlando Executive $190,638 Not recorded Space Center Executive $126,120 Not recorded Albert Whitted Municipal West Central Florida Metropolitan Area $97,669 Not recorded Clearwater Airpark $43,829 Not recorded Peter O. Knight $67,400 Not recorded Vandenberg $107,830 Not recorded Lakeland Linder Regional (Central FL Region) 1, $162,039 Not recorded Lakeland Linder Regional Central Florida 1, $162,039 Not recorded Page Field Southwest Florida $120,565 Not recorded Boca Raton Dade - Collier Training and Transition South Florida Metropolitan Area $88,032 Not recorded 24, $35,907 Not recorded Ft. Lauderdale Executive 1, $230,882 Not recorded Homestead General Aviation $122,798 Not recorded Kendall - Tamiami Executive 1, $368,400 Not recorded North Perry $213,105 Not recorded Opa Locka 1, $148,487 Not recorded Palm Beach County Park $113,160 Not recorded Source: Florida Department of Transportation, The Florida Aviation System Plan Statewide Summary
105 Table 3-44 FLORIDA'S AVIATION SYSTEM (1992) Public Airports Region Size (acres) General Aviation Airports Based Aircraft (1990) Annual Operations (1990) Annual Enplanements (1990) Apalachicola Municipal Northwest Florida 1, $4,118 Not recorded Bob Sikes $38,248 Not recorded Carrabelle - Thompson $476 Not recorded De Funiak Springs Municipal $3,275 Not recorded Destin - Fort Walton Beach $62,880 Not recorded Marianna Municipal 3, $18,148 Not recorded Peter Prince Field $15,590 Not recorded Quincy Municipal $14,550 Not recorded Tri-County $8,143 Not recorded Wakulla County $6,029 Not recorded Cross City North Central Florida $6,676 Not recorded Crystal River $26,620 Not recorded Dunnellon Municipal 1, $9,044 Not recorded George T. Lewis $4,972 Not recorded Inverness $9,571 Not recorded Lake City Municipal 1, $23,683 Not recorded Ocala Municipal 1, $40,647 Not recorded Perry - Foley $7,018 Not recorded Suwannee County $12,660 Not recorded Williston Municipal 1, $18,425 Not recorded Flagler County Northeast Florida 1, $155,000 Not recorded Hilliard Airpark $2,925 Not recorded Kay Larkin Municipal $26,436 Not recorded Keystone Airpark 2, $19,102 Not recorded Arthur Dunn Airpark East Central Florida $39,499 Not recorded Deland Municipal 1, $76,123 Not recorded Leesburg Municipal $73,753 Not recorded New Smyrna Beach $228,425 Not recorded Ormond Beach Municipal 1, $195,770 Not recorded Valkaria $31,000 Not recorded Source: Florida Department of Transportation,The Florida Aviation System Plan Statewide Summary
106 Table 3-45 FLORIDA'S AVIATION SYSTEM (1992) Public Airports Region Size (acres) General Aviation Airports (cont.) Hernando County West Central Florida Metropolitan Area Based Aircraft (1990) Annual Operations (1990) Annual Enplanements (1990) 2, $46,600 Not recorded Plant City Municipal $47,500 Not recorded Zephyrhills Municipal $16,709 Not recorded Arcadia Municipal Central Florida $18,398 Not recorded Avon Park Municipal $25,743 Not recorded Bartow Municipal 1, $63,508 Not recorded Gilbert Field Municipal $68,122 Not recorded Lake Wales Municipal $21,667 Not recorded Okeechobee County $40,107 Not recorded Sebring Regional 1, $43,532 Not recorded Wauchula Municipal $8,498 Not recorded Airglades Southwest Florida 2, $11,007 Not recorded Buchan $17,195 Not recorded Charlotte County 1, $93,070 Not recorded Clewiston Municipal $21,651 Not recorded Everglades $6,373 Not recorded Immokalee 1, $30,020 Not recorded La Belle Municipal $15,544 Not recorded Marco Island $2,646 Not recorded Venice Municipal 1, $143,502 Not recorded St. Lucie County International Treasure Coast 1, $194,387 4,609 Sebastian Municipal $37,323 Witham Field $158,573 Belle Glade Municipal South Florida Metropolitan Area $15,683 Not recorded Opa Locka West $111,500 Not recorded Palm Beach County Glades $45,264 Not recorded Pompano Beach Municipal $203,053 Not recorded Watson Island Heliport $17 Not recorded Source: Florida Department of Transportation,The Florida Aviation System Plan Statewide Summary
107 3. Public Transportation 3.46 FLORIDA TRANSIT SYSTEM TOTALS (STATEWIDE TOTAL PERFORMANCE INDICATORS EXCLUDING PURCHASED MOTORBUS) 3.47 FLORIDA TRANSIT SYSTEM TOTALS (STATEWIDE TOTAL PERFORMANCE INDICATORS INCLUDING PURCHASED MOTORBUS) 3.48 FLORIDA S SECTION 9 TRANSIT OPERATORS, SYSTEM NAMES AND ABBREVIATIONS Map FLORIDA S TRANSIT SYSTEMS PERFORMANCE INDICATORS BY TRANSIT SYSTEM (1993) 3.52 STATEWIDE SUMMARY OF 1994 OPERATING STATISTICS FOR COMMUNITY TRANSPORTATION COORDINATORS 3.53 STATEWIDE SUMMARY OF 1994 CTCs BY TYPE 3.54 ONE-WAY PARATRANSIT TRIPS BY PASSENGER TYPE, 1993 AND SUMMARY OF CTC PERFORMANCE MEASURES FLORIDA SCHOOL DISTRICT TRANSPORTATION PROFILES 3.58 FLORIDA-GREYHOUND BUS FULL-SERVICE AGENCIES
108 ECAT TALTRAN JTA ARTS PPTS HART PSTA VOTRAN STS LYNX SCAT LAMTD FLORIDA'S TRANSIT SYSTEMS MCAT SCAT LeeTran CoTran BCT Tri-Rail MDTA KWDOT
109 Performance Indicators Table 3-46 FLORIDA TRANSIT SYSTEM TOTALS (STATEWIDE TOTAL PERFORMANCE INDICATORS EXCLUDING PURCHASED MOTORBUS) % Change County/Service Area Population (000) 9, , , , , , % Passenger Trips (000) 126, , , , , , % Revenue Miles (000) 64, , , , , , % Revenue Hours (000) 4, , , , , , % Total Operating Expense (000) $243, $265, $290, $306, $319, $341, % Total Operating Expense (000 of 1984 $) $212, $221, $231, $230, $230, $238, % Total Maintenance Expense (000) $65, $68, $79, $83, $84, $86, % Total Maintenance Exp. (000 of 1984 $) $57, $57, $62, $62, $61, $60, % Total Capital Expense (000) $71, $123, $85, $81, $144, $98, % Total Revenue (000) $364, $380, $412, $445, $464, $495, % Total Employees 4, , , , , , % Vehicles Available for Maximum Service 1, , , , , , % Vehicles Operated in Maximum Service 1, , , , , , % Number of Incidents 3, , , , , , % Total Roadcalls 19, , , , , , % Pass. Trips Per Revenue Mile % Operating Expense Per Pass. Trip $1.93 $1.94 $2.03 $2.06 $2.15 $ % Operating Exp. Per Revenue Hour $52.57 $55.77 $58.40 $62.96 $64.04 $ % Farebox Recovery 27.75% 26.67% 26.99% 28.83% 28.69% 30.02% 8.16% Average Fare $0.54 $0.52 $0.55 $0.59 $0.62 $ % Source: Center for Urban Transportation Research,Performance Evaluation of Florida's Transit Systems, Trend Analysis ( )
110 Performance Indicators Table 3-47 FLORIDA TRANSIT SYSTEM TOTALS (STATEWIDE TOTAL PERFORMANCE INDICATORS INCLUDING PURCHASED MOTORBUS) % Change County/Service Area Population (000) 9, , , , , , % Passenger Trips (000) 126, , , , , , % Revenue Miles (000) 65, , , , , , % Revenue Hours (000) 4, , , , , , % Total Operating Expense (000) $245, $270, $298, $309, $324, $374, % Total Operating Expense (000 of 1984 $) $213, $226, $237, $233, $234, $261, % Total Maintenance Expense (000) n/a n/a n/a n/a n/a n/a n/a Total Maintenance Exp. (000 of 1984 $) n/a n/a n/a n/a n/a n/a n/a Total Capital Expense (000) n/a n/a n/a n/a n/a n/a n/a Total Revenue (000) n/a n/a n/a n/a n/a n/a n/a Total Employees n/a n/a n/a n/a n/a n/a n/a Vehicles Available for Maximum Service n/a n/a n/a n/a n/a n/a n/a Vehicles Operated in Maximum Service 1, , , , , , % Number of Incidents n/a n/a n/a n/a n/a n/a n/a Total Roadcalls n/a n/a n/a n/a n/a n/a n/a Pass. Trips Per Revenue Mile % Operating Expense Per Pass. Trip $1.93 $1.92 $2.01 $2.06 $2.16 $ % Operating Exp. Per Revenue Hour $52.37 $54.59 $57.21 $62.39 $63.29 $ % Farebox Recovery n/a n/a n/a n/a n/a n/a n/a Average Fare n/a n/a n/a n/a n/a n/a n/a. Source: Center for Urban Transportation Research,Performance Evaluation of Florida's Transit Systems, Trend Analysis ( ).
111 Table 3-48 FLORIDA'S SECTION 9 TRANSIT OPERATORS, SYSTEM NAMES AND ABBREVIATIONS ARTS BCT ECAT HART JTA KWDOT LAMTD LeeTran MCAT MDTA LYNX CoTran PPTS PSTA SCAT (Sarasota) STS SCAT (Brevard) TALTRAN Tri-Rail VOTRAN Regional Transit System (Gainesville) Broward Transit Division Escambia County Area Transit Hillsborough Area Regional Transit Jacksonville Transportation Authority Key West Department of Transportation Lakeland Area Mass Transit District Lee County Transit Manatee County Area Transit Metro-Dade Transit Agency Lynx Transit (Orlando) Palm Beach County Transportation Authority Pasco County Public Transportation Service Pinellas Suncoast Transit Authority Sarasota County Area Transit Smyrna Transit System Space Coast Area Transit Tallahassee Transit Tri-County Commuter Rail Authority East Volusia Transit Authority
112 Performance Indicators Table 3-49 PERFORMANCE INDICATORS BY TRANSIT SYSTEM (1993) ARTS BCT ECAT HART JTA KWDOT LAMTD Service Area Population (000) , Passenger Trips (000) 2, , , , , Revenue Miles (000) 1, , , , , Revenue Hours (000) Total Operating Expense (000) $3, $38, $3, $20, $20, $ $1, Total Operating Expense (000 of 1984 $) $2, $26, $2, $14, $14, $ $1, Total Maintenance Expense (000) $ n/a $ $4, $4, $ $ Total Maintenance Exp. (000 of 1984 $) $ n/a $ $2, $3, $ $ Total Capital Expense (000) $ n/a $2, $1, $12, $ $2, Total Revenue (000) $5, n/a $3, $25, $27, $ $2, Total Employees n/a Vehicles Available for Maximum Service Vehicles Operated in Maximum Service Number of Incidents n/a Total Roadcalls n/a , Pass. Trips Per Revenue Mile Operating Expense Per Pass. Trip $1.36 $1.76 $2.61 $2.19 $2.09 $2.83 $1.50 Operating Exp. Per Revenue Hour $45.98 $57.25 $43.73 $58.28 $45.36 $53.70 $28.41 Farebox Recovery 41.70% n/a 18.88% 21.31% 22.39% 19.81% 28.29% Average Fare $0.57 n/a $0.49 $0.47 $0.47 $0.56 $0.42 Source: Center for Urban Transportation Research,Performance Evaluation of Florida's Transit Systems, Trend Analysis ( ).
113 Performance Indicators Table 3-50 PERFORMANCE INDICATORS BY TRANSIT SYSTEM (1993) LeeTran MCAT MDTA LYNX CoTran PPTS PSTA Service Area Population (000) , , Passenger Trips (000) 1, , , , , Revenue Miles (000) 1, , , , , Revenue Hours (000) , Total Operating Expense (000) $3, $1, $195, $20, $9, $0.00 $22, Total Operating Expense (000 of 1984 $) $2, $1, $136, $14, $6, $0.00 $15, Total Maintenance Expense (000) $ $ n/a $4, $1, $0.00 $4, Total Maintenance Exp. (000 of 1984 $) $ $ n/a $2, $1, $0.00 $3, Total Capital Expense (000) $43.69 $1, n/a $2, $4, $0.00 $5, Total Revenue (000) $3, $1, $270, $28, $10, $0.00 $28, Total Employees n/a Vehicles Available for Maximum Service , Vehicles Operated in Maximum Service Number of Incidents n/a n/a Total Roadcalls n/a n/a 2, Pass. Trips Per Revenue Mile n/a 1.36 Operating Expense Per Pass. Trip $1.79 $2.49 $2.14 $1.89 $3.36 n/a $2.59 Operating Exp. Per Revenue Hour $35.43 $45.55 $67.10 $42.98 $48.32 n/a $51.25 Farebox Recovery 19.36% 16.11% 31.63% 24.41% 15.10% n/a 18.37% Average Fare $0.35 $0.40 $0.68 $0.46 $0.51 n/a $0.48 Source: Center for Urban Transportation Research,Performance Evaluation of Florida's Transit Systems, Trend Analysis ( ).
114 Performance Indicators Table 3-51 PERFORMANCE INDICATORS BY TRANSIT SYSTEM (1993) SCAT (Sarasota) STS SCAT (Brevard) TALTRAN Tri-Rail VOTRAN Service Area Population (000) , Passenger Trips (000) 1, , , , Revenue Miles (000) 1, , , , , Revenue Hours (000) Total Operating Expense (000) $2, $ $4, $5, $19, $3, Total Operating Expense (000 of 1984 $) $2, $ $3, $4, $13, $2, Total Maintenance Expense (000) $ $18.75 n/a $1, $1, $1, Total Maintenance Exp. (000 of 1984 $) $ $13.13 n/a $ $1, $ Total Capital Expense (000) $ $ n/a $2, $1, $1, Total Revenue (000) $3, $39.99 $1, $9, $14, $5, Total Employees n/a n/a Vehicles Available for Maximum Service Vehicles Operated in Maximum Service Number of Incidents n/a n/a 4.00 Total Roadcalls n/a n/a Pass. Trips Per Revenue Mile Operating Expense Per Pass. Trip $2.20 $7.72 $5.81 $1.58 $7.30 $1.22 Operating Exp. Per Revenue Hour $39.68 $49.70 $26.98 $46.84 $ $36.24 Farebox Recovery 18.47% 6.68% 33.61% 30.26% 23.38% 23.82% Average Fare $0.41 $0.52 $1.95 $0.48 $1.71 $0.29 Source: Center for Urban Transportation Research,Performance Evaluation of Florida's Transit Systems, Trend Analysis ( ).
115 Table 3-52 STATEWIDE SUMMARY OF 1994 OPERATING STATISTICS FOR COMMUNITY TRANSPORTATION COORDINATORS Operating Statistics Urban CTCs* Rural CTCs All CTCs Number of CTCs Number of Counties Covered Number of Transportation Operators Square Miles in the Service Areas 32,368 19,721 53,123 Passenger Trips 24,665,681 1,585,853 26,251,534 Vehicle Miles 80,030,088 12,113,366 92,143,454 Revenue Miles 57,566,648 8,285,182 65,851,830 Operating Revenue $115,586,320 $13,383,013 $128,969,333 Operating Expense $113,387,288 $12,977,322 $126,364,610 Vehicles 3, ,788 Roadcalls 2, ,220 Accidents 1, ,177 Employees (Number) 4, ,022 Employees (Full-Time Equivalent) 2, ,999 Total Population 12,884,275 1,082,434 14,049,868 Category I TD Population 4,907, ,815 5,415,106 Category II TD Population 1,110, ,224 1,263,203 *Includes all CTCs where the service area contains an urbanized area with a population of 50,000 or more. Source: Florida Commission for the Transportation Disadvantaged, Statewide Operations Report Fiscal Year 1993/94. Tallahassee, Florida: May 1995.
116 Table 3-53 STATEWIDE SUMMARY OF 1994 CTCs BY TYPE Type of Type of Network Organization Sole Partial Complete Source Brokerage Brokerage Private Non-Profit Private For-Profit Government Agency Public Transit Agency Total Total Source: Florida Commission for the Transportation Disadvantaged, Statewide Operations Report Fiscal Year 1993/94, Tallahassee, Florida: May Table 3-54 ONE-WAY PARATRANSIT TRIPS BY PASSENGER TYPE, 1993 AND * 1994** Passenger Type Number of One-Way Trips Percent of Total Number of One-Way Trips Percent of Total Disabled 2,218, % 3,491, % Low-Income 4,290, % 4,598, % Elderly 1,455, % 6,575, % Children 621, % 3,238, % Disabled/Low-Income/Children 394, % 128, % Disabled/Low-Income 633, % 1,132, % Disabled/Elderly 343, % 1,288, % Low-Income/Elderly 671, % 1,131, % Disabled/Children 268, % 278, % Low-Income/Children 976, % 2,621, % Disabled/Low-Income/Elderly 1,001, % 750, % * Data represent 45 of 48 CTCs reporting. ** Data represent 51 of 53 CTCs reporting. Source: Florida Commission for the Transportation Disadvantaged, Statewide Operations Report Fiscal Year 1993/94. Tallahassee, Florida: May 1995.
117 Table 3-55 SUMMARY OF CTC PERFORMANCE MEASURES, Performance Measures Urban Rural All Urban Rural All CTCs Urban Rural All CTCs CTCs* CTCs CTCs CTCs* CTCs CTCs* CTCs Medians 1992 Medians 1993 Medians 1994 Medians SERVICE AVAILABILITY Vehicle Miles per TD Capita Revenue Miles per TD Capita SERVICE EFFECTIVENESS Passenger Trips per Vehicle Mile-Paratransit Passenger Trips per Revenue Mile-Paratransit Passenger Trips Per Driver Hour-Paratransit NR NR NR NR NR NR COST EFFICIENCY Operating Expense per Vehicle Mile-Paratransit $1.42 $1.03 $1.21 $1.45 $1.07 $1.22 $1.33 $1.00 $1.25 Operating Expense per Revenue Mile-Paratransit $1.61 $1.18 $1.50 $1.61 $1.31 $1.38 $1.65 $1.35 $1.44 Operating Expense per Passenger Trip-Total $7.43 $7.53 $7.43 $7.45 $8.27 $7.88 $8.51 $10.06 $8.78 Operating Expense per Passenger Trip-Paratransit $7.65 $7.53 $7.65 $7.96 $8.27 $7.98 $8.69 $10.06 $9.00 Operating Expense per Driver Hour-Paratransit NR NR NR NR NR NR $16.62 $18.05 $17.95 SYSTEM SAFETY Accidents per 100,000 Vehicle Miles SERVICE QUALITY Vehicle Miles between Roadcalls 23,573 66,636 42,225 24,631 52,785 36,524 35,048 68,279 46,485 LOCAL FINANCIAL SUPPORT Local Revenue percent of Operating Expense 27.6% 6.6% 14.1% 27.7% 6.1% 16.2% 24.2% 3.8% 13.4% Averages 1992 Averages 1993 Averages 1994 Averages SERVICE AVAILABILITY Vehicle Miles per TD Capita Revenue Miles per TD Capita SERVICE EFFECTIVENESS Passenger Trips per Vehicle Mile-Paratransit Passenger Trips per Revenue Mile-Paratransit Passenger Trips per Driver Hour-Paratransit NR NR NR NR NR NR COST EFFICIENCY Operating Expense per Vehicle Mile-Paratransit $1.12 $0.92 $1.08 $1.50 $1.05 $1.43 $1.39 $1.05 $1.35 Operating Expense per Revenue Mile-Paratransit $1.46 $1.12 $1.40 $1.70 $1.26 $1.63 $1.65 $1.26 $1.62 Operating Expense per Passenger Trip-Total $6.60 $7.20 $6.67 $6.27 $7.86 $6.42 $4.75 $8.84 $4.98 Operating Expense per Passenger Trip-Paratransit $7.61 $7.20 $7.55 $7.64 $7.86 $7.67 $8.21 $8.84 $8.28 Operating Expense per Driver Hour-Paratransit NR NR NR NR NR NR $17.58 $16.24 $17.36 SYSTEM SAFETY Accidents per 100,000 Vehicle Miles SERVICE QUALITY Vehicle Miles between Roadcalls 7,583 52,405 21,076 16,283 42,478 18,089 17,628 20,753 18,201 LOCAL FINANCIAL SUPPORT Local Revenue percent of Operating Expense 39.0% 10.2% 35.1% 34.5% 10.3% 31.6% 36.7% 7.6% 33.7% * Includes all CTCs where the service area contains an urbanized area with a population of 50,000 or more. Source: Florida Commission for the Transportation Disadvantaged, Statewide Operations Report Fiscal Year 1993/94. Tallahassee, Florida: May 1995.
118 # District # Daily Service Buses Table 3-56 FLORIDA SCHOOL DISTRICT TRANSPORTATION PROFILES # Service Buses in Inventory Enrollment Pre K-12 Number Transported # Transported Center-to- Center # Hazardous Walking # Handicapped/ Teen parent # Courtesy Riders (< 2 mi) 1 Alachua ,426 14, ,484 2 Baker ,567 2, Bay ,873 11, ,130 4 Bradford ,105 4,033 1, Brevard ,556 24, , ,388 6 Broward ,862 59, , Calhoun ,259 1, Charlotte ,650 9, , Citrus ,106 10, Clay ,142 10, , Collier ,924 11, Columbia ,710 5, Dade 1, ,465 56,999 1, , Desoto ,136 2, Dixie ,163 1, Duval ,785 53,664 2,139 2,803 1,847 1, Escambia ,641 32,922 1,148 6,079 1,367 1, Flagler ,757 3, Franklin 8 9 1, Gadsden ,537 5, , Gilchrist ,201 1, Glades , Gulf ,228 1, Hamilton ,332 1, Hardee ,978 2, Hendry ,498 3, , Hernando ,336 10, Highlands ,999 5, Hillsborough ,104 67, ,429 2,031 5, Holmes ,677 2, Indian River ,597 6, Jackson ,042 4, Jefferson ,082 1, Lafayette , Lake ,669 12, Lee ,390 30, , Leon ,836 14,933 1, ,709 1, Levy ,331 3, Liberty , Madison ,306 2, Manatee ,685 12, Marion ,702 19, Martin ,023 7, Monroe ,942 4, Nassau ,128 6, Okaloosa ,856 13, , , Okeechobee ,230 3, Orange ,638 50,655 1,524 3,828 1,062 2, Osceola ,122 10, Palm Beach ,145 54,869 2, , Pasco ,265 23, , Pinellas ,135 42, , Polk ,718 36, , Putnam ,649 7, , St. Johns ,056 10, , St. Lucie ,205 16, , Santa Rosa ,688 23, , , Sarasota ,747 8, Seminole ,250 18, , Sumter ,505 3, Suwannee ,525 3, Taylor ,612 2, Union ,044 1, Volusia ,972 24, Wakulla ,916 3, Walton ,890 3, Washington ,101 2, Total 12,453 13,003 2,039, ,208 18,667 28,999 30,461 63,648 Source: Florida School District Transportation Profiles, Volume 4, June 1995.
119 # District Total Annual Vehicle Miles Table 3-57 FLORIDA SCHOOL DISTRICT TRANSPORTATION PROFILES Total Transportation Positions Total Salaries and Benefits Bus Purchases Total Operating Expense Total Expense Expense per Eligible Student Expense per Student 1 Alachua 4,117, $4,531,502 $315,613 5,578,339 5,893,952 $ $ Baker 775, $824,535 $93,633 1,107,551 1,201,184 $ $ Bay 2,744, $3,298,675 $456,317 4,498,516 4,954,833 $ $ Bradford 732, $675,746 $219, ,250 1,063,826 $ $ Brevard 8,061, $11,478,28 $2,272,034 12,789,840 15,061,874 $ $ Broward 12,863, $27,088,55 $4,532,199 30,518,233 35,050,432 $ $ Calhoun 265, $310,854 $68, , ,415 $ $ Charlotte 1,671, $2,638,034 $436,216 3,206,292 3,642,508 $ $ Citrus 1,865, $3,030,725 $724,115 4,015,150 4,739,265 $ $ Clay 2,949, $3,510,515 $662,200 4,304,097 4,966,297 $ $ Collier 3,503, $4,607,627 $1,285,727 6,022,909 7,308,636 $ $ Columbia 1,104, $1,689,202 $588,139 2,056,031 2,644,170 $ $ Dade 22,115, $47,290,12 $1,204,855 57,548,478 58,753,333 $ $1, Desoto 468, $785,843 $0 1,016,247 1,016,247 $ $ Dixie 632, $421,146 $70, , ,736 $ $ Duval 15,135, $1,054,011 $0 28,824,964 28,824,964 $ $ Escambia 6,792, $7,788,309 $919,207 9,594,494 10,513,701 $ $ Flagler 887, $1,019,537 $344,230 1,312,749 1,656,978 $ $ Franklin 180, $203,271 $0 288, ,768 $ $ Gadsden 1,909, $1,405,186 $287,244 1,838,532 2,125,776 $ $ Gilchrist 252, $422,374 $241, , ,083 $ $ Glades 140, $172,998 $0 219, ,591 $ $ Gulf 327, $460,518 $100, , ,970 $ $ Hamilton 299, $454,807 $71, , ,420 $ $ Hardee 799, $1,120,893 $412,956 1,475,618 1,888,574 $ $ Hendry 690, $1,353,343 $159,945 1,716,558 1,876,503 $ $ Hernando 3,047, $3,402,710 $687,310 4,075,823 4,763,133 $ $ Highlands 1,543, $2,227,873 $482,624 2,743,365 3,225,989 $ $ Hillsborough 18,000, $30,391,45 $6,474,790 38,264,449 44,739,239 $ $ Holmes 480, $714,294 $133, , ,479 $ $ Indian River 1,665, $2,736,037 $418,712 3,235,113 3,653,825 $ $ Jackson 1,222, $1,318,223 $283,194 1,715,626 1,998,820 $ $ Jefferson 501, $598,797 $173, , ,984 $ $ Lafayette 158, $242,150 $43, , ,370 $ $ Lake 3,154, $3,561,001 $556,743 4,477,640 5,034,383 $ $ Lee 9,568, $12,036,81 $4,092,276 14,491,690 18,583,966 $ $ Leon 4,085, $4,701,844 $353,874 5,846,090 6,199,964 $ $ Levy 740, $1,242,747 $271,422 1,567,979 1,839,401 $ $ Liberty 146, $223,471 $101, , ,132 $ $ Madison 574, $643,776 $42, , ,276 $ $ Manatee 2,726, $4,641,900 $367,507 5,698,856 6,066,363 $ $ Marion 5,837, $6,674,120 $970,019 8,150,651 9,120,670 $ $ Martin 1,486, $2,478,038 $326,578 3,140,360 3,466,938 $ $ Monroe 1,147, $1,975,639 $588,417 2,454,522 3,042,939 $ $ Nassau 1,047, $1,747,322 $338,373 2,521,844 2,860,217 $ $ Okaloosa 2,637, $3,845,279 $572,424 4,487,653 5,060,077 $ $ Okeechobee 1,001, $1,082,165 $211,106 1,418,286 1,629,392 $ $ Orange 14,349, $22,003,91 $5,633,432 26,424,927 32,058,359 $ $ Osceola 2,137, $3,100,114 $526,887 3,608,526 4,135,413 $ $ Palm Beach 11,040, $15,170,76 $3,562,531 18,268,498 21,831,029 $ $ Pasco 5,276, $6,923,701 $1,324,380 8,483,838 9,808,218 $ $ Pinellas 12,000, $13,838,03 $2,909,514 16,675,279 19,584,793 $ $ Polk 8,671, $8,608,815 $3,318,335 11,334,925 14,653,260 $ $ Putnam 1,857, $2,170,429 $588,783 2,853,648 3,442,431 $ $ Santa Rosa 2,934, $2,175,109 $340,867 2,715,247 5,025,262 $ $ Sarasota 4,753, $6,065,944 $980,216 7,619,363 9,888,689 $ $ Seminole 4,532, $2,948,795 $890,566 4,134,696 11,413,917 $ $ St. Johns 1,847, $8,228,119 $421,588 9,467,101 3,056,114 $ $ St. Lucie 5,278, $9,310,818 $910,848 10,503,069 8,599,580 $ $ Sumter 726, $1,082,865 $263,537 1,400,909 1,664,446 $ $ Suwannee 787, $1,325,878 $221,937 1,694,011 1,915,948 $ $ Taylor 455, $804,229 $43,861 1,002,262 1,046,123 $ $ Union 233, $329,923 $36, , ,483 $ $ Volusia 4,692, $6,422,695 $1,500,440 8,178,473 9,678,913 $ $ Wakulla 853, $789,295 $415,968 1,043,307 1,459,275 $ $ Walton 889, $1,081,675 $172,762 1,376,609 1,549,371 $ $ Washington 488, $773,477 $73, ,192 1,064,664 $ $ Total 235,865,60 19,163 $327,276,8 $57,095,83 427,224,05 484,319,88 $ $ Source: Florida School District Transportation Profiles, Volume 4, June 1995.
120 Table 3-58 FLORIDA-GREYHOUND BUS FULL-SERVICE AGENCIES 1 Apopka Haines City Okeechobee Avon Park Hialeah Orlando Belleview Hollywood Orlando-East Blountstown Homestead Panama City Bonita Springs Immokalee Pensacola Boynton Beach Islamorada (Burger King) Perrine Bradenton Jacksonville (Downtown) Perry Brooksville Jacksonville West Plant City Callahan Key Largo (Milepost 102) Pompano Beach Chattahoochee Key West Port Charlotte Chiefland Kissimmee Quincy Chipley La Belle Ramrod Key Clearwater Lake City Sarasota Clewiston Lakeland Sebastian Cocoa Lake Placid Sebring Coral Gables Lake Wales South Bay Crestview Leesburg Starke Crystal River Live Oak St. Augustine Dade City Madison St. Petersburg Daytona Beach Marathon (Milepost 50) Stuart Debary Marianna Sun City Deerfield Beach Melbourne Tallahassee De Funiak Springs Miami Bayside (Downtown) Tampa De Land Miami West (Airport) Tavares Delray Beach Milton Titusville Fort Lauderdale Monticello Venice Fort Myers Naples Vero Beach Fort Pierce New Port Richey West Palm Beach Fort Walton Beach New Smyrna Beach Winter Haven Gainesville Ocala Youngstown 1 A Full-Service Agency handles tickets, baggage, and express including C.O.D. express. Note: Shading indicates major stations. Source: Russell's Guides, Inc., Russell's Official National Motor Coach Guide (July 1995).
121 3. Rail 3.59 FLORIDA RAILROADS (1994) 3.60 TENTATIVE WORK PROGRAM-RAIL/INTERMODAL AND SEAPORT DEVELOPMENT FUNDING (Fiscal Year 1995/ /2000) 3.61 REASON FOR DERAILMENT 3.62 FLORIDA RAIL FREIGHT TRAFFIC HISTORY TONNAGE 3.63 FLORIDA RAIL FREIGHT TRAFFIC (1993) TONNAGE F3.1 DESTINATION OF RAIL FREIGHT TONNAGE ORIGINATING IN FLORIDA F3.2 ORIGIN OF RAIL FREIGHT TONNAGE TERMINATING IN FLORIDA 3.64 FLORIDA CITIES SERVED BY AMTRAK PASSENGER RAIL
122 Railroad Table 3-59 FLORIDA RAILROADS (1994) Miles of Railroad Operated in Florida Percent of Florida Rail System Apalachicola Northern Bay Line Burlington Northern CSX Transportation 1 1, Florida Central Florida East Coast Florida Midland Florida Northern Florida West Coast Norfolk Southern Seminole Gulf South Central Florida Terminal Companies Totals 2, (1) Amtrak also operates in Florida but does not own any trackage in the state. It operates over CSXT main tracks from Georgia to Jacksonville and from Jacksonville to Tampa and Miami. Total includes the 81-mile Southeast Florida Rail Corridor owned by the State of Florida, but operated by CSXT for freight and Amtrak services. Source: Florida Department of Transportation Rail Office,1994 Florida Rail System Plan (March 1995). Table 3-60 TENTATIVE WORK PROGRAM-RAIL/INTERMODAL AND SEAPORT DEVELOPMENT FUNDING (Fiscal Year 1995/ /2000, Thousands of $) Type of Funds FY 95/96 FY 96/97 FY 97/98 FY 98/99 FY 99/00 5YR Total Pass. Service Dev. $20,617 $25,020 $57,020 $54,301 $78,120 $235,078 Intermodal Development $29,610 $24,742 $43,672 $31,508 $30,929 $160,461 Fixed Guideway $7,500 $16,000 $0 $0 $0.00 $23,500 Rail Branch Rehab. $571 $600 $600 $600 $600 $2,971 Total Intermodal/Rail $58,298 $66,362 $101,292 $86,409 $109,649 $422,010 Seaport Development $5,000 $10,000 $10,000 $10,000 $10,000 $45,000 Source: Florida Department of Transportation Rail Office,1994 Florida Rail System Plan (March 1995).
123 Table 3-61 REASON FOR DERAILMENT Year Total Track Equipment Operating Practices Other Source: Florida Department of Transportation Rail Office,1994 Florida Rail System Plan (March 1995). Table 3-62 FLORIDA RAIL FREIGHT TRAFFIC HISTORY TONNAGE (1000 TONS) Year Originating Terminating Total , , ,581 63, , ,032 (1) 87,101 (1) 162, ,912 (1) 68,717 (1) 124, ,196 78, , ,933 89, , ,915 83, , ,116 83, , ,859 82, ,475 (1) R-1 and R-2 Annual Reports. Class III carriers not included. Source: Florida Department of Transportation Rail Office,1994 Florida Rail System Plan (March 1995).
124 Table 3-63 FLORIDA RAIL FREIGHT TRAFFIC (1993) TONNAGE (1000 TONS) STCC Commodity Description Originated Terminated Totals Percent of Total 11 Coal 3,222 13,845 17, % 14 Nonmetallic Minerals; Except Fuels 33,759 36,387 70, % 20 Food or Kindred Products 2,256 4,128 6, % 24 Lumber or Wood Products; Except Furniture 26 Pulp, Paper, or Allied Products 28 Chemicals or Allied Products 46 Miscellaneous Mixed Shipments 1,463 4,626 6, % 2,357 1,776 4, % 10,098 8,442 18, % 2,136 4,651 6, % All Others 1 3,567 8,760 13, % Totals 58,859 82, , (1) Includes all commodities comprising less than 2 percent of total. Source: Florida Department of Transportation Rail Office,1994 Florida Rail System Plan (March 1995).
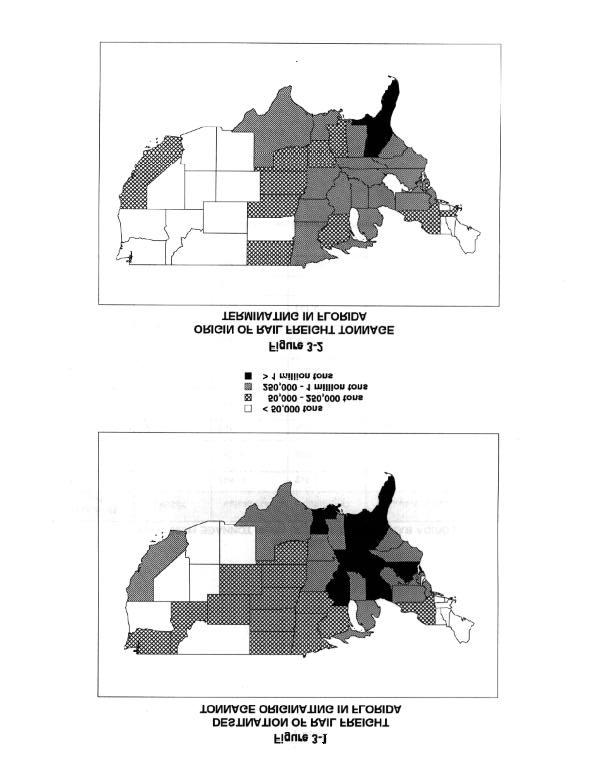
125
TABLE OF CONTENTS PREFACE & CONTACTS DEMOGRAPHICS TRAVEL BEHAVIOR CHARACTERISTICS MODAL STATISTICS TOURISM TRANSPORTATION FINANCING
 TABLE OF CONTENTS PREFACE & CONTACTS DEMOGRAPHICS TRAVEL BEHAVIOR CHARACTERISTICS MODAL STATISTICS TOURISM TRANSPORTATION FINANCING TRANSPORTATION EDUCATION & RESEARCH DIRECTORY MISCELLANEOUS INDEX on
Florida Maps of Agencies' Service Delivery Areas
 Florida Maps of Agencies' Service Delivery Areas Agency for Health Care Administration: Service Areas - Alachua, Bradford, Citrus, Columbia, Dixie, Gilchrist, Hamilton, Hernando, Lafayette, Lake, Levy,
Fuel Tax Rates Adjusted Beginning January 1, 2018
 Tax Information Publication TIP No: 17B05-03 Date Issued: November 14, 2017 Fuel Tax Rates Adjusted Beginning January 1, 2018 Beginning January 1, 2018, the statewide tax rates on motor fuel and diesel
EMERGENCY CONTACT SHEET FOR RESOURCES IN FLORIDA
 EMERGENCY CONTACT SHEET FOR RESOURCES IN FLORIDA Disaster Center Florida: Disaster Message Board, Family Disaster Plan, Weather Warnings, Animals in Disaster Lost and Found, Health and Welfare Inquiry,
Broward County Hollywood Memorial Regional Hospital Esther L Grossman Ctr 4320 Sheridan St. Hollywood, FL (954)
") Appendix D: D 6: Fatherhood Programs Alachua County 1731 NW 6th St Ste 1 Gainesville, FL 32609 (352) 213 6561 Baker County Northeast FL Healthy Start Coalition, Inc. 644 Cesery Blvd Ste 210 Jacksonville,
Appendix D: D 6: Fatherhood Programs Alachua County 1731 NW 6th St Ste 1 Gainesville, FL 32609 (352) 213 6561 Baker County Northeast FL Healthy Start Coalition, Inc. 644 Cesery Blvd Ste 210 Jacksonville,
FLORIDA WILDFIRE AVIATION PLAN
 FLORIDA DEPARTMENT OF AGRICULTURE AND CONSUMER SERVICES FLORIDA FOREST SERVICE FLORIDA WILDFIRE AVIATION PLAN CONTENTS: 1. PURPOSE 2. FLIGHT OPERATIONS MANNED AIRCRAFT 3. FLIGHT OPERATIONS UNMANNED AIRCRAFT
EMERGENCY CONTACT SHEET FOR RESOURCES IN FLORIDA
 EMERGENCY CONTACT SHEET FOR RESOURCES IN FLORIDA Florida County Emergency Contacts: Information on hurricane preparation and recovery: http://www.floridadisaster.org/fl_county_em.asp Florida Government
APPENDIX A Florida Clerk of Court s Offices
 APPENDIX A Florida Clerk of Court s Offices Alahua County Baker County Bay County 201 E. University Ave. 339 E. Macclenny Ave.P.O. Box 2269 Gainesville, FL 32602 Macclenny, FL 32063Panama City, FL 32402
Geographic Coverage by Service-type
 AL Baldwin AZ Apache AZ Graham AZ Greenlee AZ La Paz AZ Maricopa AZ Mohave AZ Navajo AZ Pima AZ Pinal AZ Yavapai CA Alameda CA Contra Costa CA El Dorado CA Fresno CA Imperial CA Kern CA Kings CA Los Angeles
Circuit 1, 17, and 20
 Florida Network of Youth and Family Services Programs by Circuit Circuit 1, 17, and 20 Lutheran Services Florida Shelters: Currie House Circuit 1 4610 West Fairfield Drive Pensacola, Florida 32506 850-453-2772
News & Views. Florida Association of Directors of Volunteer Services. Special Edition 2011 PRESIDENT S MESSAGE. Dear FADVS Members:
 Florida Association of Directors of Volunteer Services News & Views www.fadvs.org Special Edition 2011 Board of Directors President, Angela Phillips Pres Elect, Vacant VP Education, Joanne Webster PRESIDENT
Domestic Migration Patterns
 Planning Services Division October 2004 Number 27 Domestic Migration Patterns Between 2000 and 2003, 259,000 people moved into Broward from other counties in the United States while 233,000 moved away,
Metropolitan Statistical Area (MSA) Exports to the World
 Exports to the World") Florida s 2015 Metropolitan Statistical Area (MSA) Exports to the World PREPARED BY: Enterprise Florida, Inc. International Trade & Development 201 Alhambra Circle, Suite 610 T: (305) 808-3660 Coral Gables,
Florida s 2015 Metropolitan Statistical Area (MSA) Exports to the World PREPARED BY: Enterprise Florida, Inc. International Trade & Development 201 Alhambra Circle, Suite 610 T: (305) 808-3660 Coral Gables,
None Hillview Rd Pensacola FL (01/27/05 added 4 beds) None Mahan Center Blvd
 None Mahan Center Blvd") 01 5025095 exp 11/30 10-1513 75171 00 02 5002096 exp 03/31 10-1523 754 00 02 5001096 exp 02/28 10-1537 1500091 00 Covenant, Inc. 51 N th Ave Pensacola FL 325-89 (850) 433-2155 Bay, Calhoun, Escambia, Franklin,
01 5025095 exp 11/30 10-1513 75171 00 02 5002096 exp 03/31 10-1523 754 00 02 5001096 exp 02/28 10-1537 1500091 00 Covenant, Inc. 51 N th Ave Pensacola FL 325-89 (850) 433-2155 Bay, Calhoun, Escambia, Franklin,
GOLD Recognition for the Florida Breastfeeding Friendly Employer Award
 GOLD Recognition for the Florida Breastfeeding Friendly Employer Award A Birth Center- 2018 Alpha House of Tampa, Tampa, FL - 2014 Andover Academy, Plantation, FL - 2013 Andy Bear Early Learning Center-
Registry of Provisionally Spanish Approved Court Interpreters
 Updated: October 21, 2016 Registry of Provisionally Spanish Approved Court Interpreters Aquino, Tairy Miami, FL (786) 246 6439 Cell tairyaquino@hotmail.com 16 00415 SPA 3/18/2018 Broward, Miami Dade and
HARRY WARREN, INC. - FLORIDA ORGANIZATIONAL CHART AND TERRITORIES
 HARRY WARREN, INC. - FLORIDA ORGANIZATIONAL CHART AND TERRITORIES Oct 2, 2017 ORLANDO OFFICE & WAREHOUSE: POMPANO OFFICE & WAREHOUSE: TAMPA OFFICE & WAREHOUSE: 2301 NW 30 TH PLACE BLDG2, BAY 1 3502 RIGA
Florida Greenway And Trail Designations Sorted by Name
 Florida Greenway And Trail Designations Sorted by Name Name COUNTY(S) TYPE ACRES MILES NUMBER DATE Addison Blockhouse Historic State Park Volusia Site 147.92 OGT-DA0003 1/22/2002 Alafia River Paddling
Water Collection Schedule 2018: January. 1/4/2018 Hills. Austin-Davis Library Hills. Lutz Library Hills. Seffner Hills.
 Water Collection Schedule 2018: January Water Pick-up Date Location 1/4/2018 Hills. Austin-Davis Library Hills. Lithia State Park 1/9/2018 Melrose Fire Station 1/11/2018 Orange IFAS @ Orlando Osceola Harmony
ater Collection & Supply Schedule 2019: January
 ater Collection & Supply Schedule 2019: January Water Pick-up Date Location 1/3/2019 Hills. Austin-Davis Library 1/8/2019 Melrose Fire Station 1/15/2019 Orange IFAS @ Orlando Osceola Harmony 1/22/2019
USA MEDIGAP CPR a product of State of FLORIDA Accountable Alliance/USA Senior Care Network
 ALACHUA BREVARD SHANDS HOSPITAL AT THE UNIVERSITY OF FLORIDA WUESTHOFF HOSPITAL 1600 SW ARCHER RD 110 LONGWOOD AVE GAINESVILLE, FL 32610 (352) 265-0111 ROCKLEDGE, FL 32955 (321) 636-2211 WUESTHOFF MEDICAL
USA MEDICARE DIRECT a product of USA Senior Care Network, Inc.
 ALACHUA BREVARD SHANDS HOSPITAL AT THE UNIVERSITY OF FLORIDA WUESTHOFF HOSPITAL 1600 SW ARCHER RD 110 LONGWOOD AVE GAINESVILLE, FL 32610 (352) 265-0111 ROCKLEDGE, FL 32955 (321) 636-2211 WUESTHOFF MEDICAL
JATA Market Research Study Passenger Survey Results
 JATA Market Research Study Passenger Survey Results Prepared for the Jackson Area Transportation Authority (JATA) April, 2015 3131 South Dixie Hwy. Suite 545 Dayton, OH 45439 937.299.5007 www.rlsandassoc.com
USA MEDIGAP CPR a product of State of FLORIDA Accountable Alliance/USA Senior Care Network
 ALACHUA BREVARD SHANDS HOSPITAL AT THE UNIVERSITY OF FLORIDA WUESTHOFF HOSPITAL 1600 SW ARCHER RD 110 LONGWOOD AVE GAINESVILLE, FL 32610 (352) 265-0111 ROCKLEDGE, FL 32955 (321) 636-2211 WUESTHOFF MEDICAL
District 4 - Acute Care Subdistrict 4-1. Baker
 District 4 - Acute Care Subdistrict 4-1 North Subdistrict 4-1 County and North zip codes 32202, 32206, 32208, 32209, 32218, 32219, 32220, 32226 and 32254 District 4 - Acute Care Subdistrict 4-2 Southwest
APPENDIX 13-A JURISDICTIONAL DATA
 APPENDIX 13-A JURISDICTIONAL DATA PERMITTING OFFICE JURISDICTION NUMBER CLIMATE ZONE REPORTING GROUP ALACHUA COUNTY 111000 3 III ALACHUA DISTRICT SCHOOLS 111100 3 III UNIVERSITY OF FLORIDA 111200 3 III
ACFP Catering List Revised 10/1/18. Caterer Contact Information Serving Counties. Ph: (954)
") Caterer Contact Information Serving Counties South Florida A Marshall Catering & Take Out II Greg Marshall 613 East Atlantic Boulevard Pompano Beach, FL 33060 Ph: (954) 889-4410 amarshallcatering@gmail.com
Caterer Contact Information Serving Counties South Florida A Marshall Catering & Take Out II Greg Marshall 613 East Atlantic Boulevard Pompano Beach, FL 33060 Ph: (954) 889-4410 amarshallcatering@gmail.com
OFFICE OF ECONOMIC AND DEMOGRAPHIC RESEARCH
 MIKE HARIDOPOLOS President THE FLORIDA LEGISLATURE DEAN CANNON Speaker OFFICE OF ECONOMIC AND DEMOGRAPHIC RESEARCH June27,2012 HuntingF.Deutsch,ExecutiveDirector FloridaDepartmentofEconomicOpportunity
Jurisdictions that Meet the Population and Density Criteria Related to Exemptions for Dense Urban Land Areas as per s (29)(a), F.S.
(a), F.S.") B - municipalities located in the county, that has an average of at least 1,000 people per square mile of land area C - municipalities located therein, which has a population of at least 900,000, that
B - municipalities located in the county, that has an average of at least 1,000 people per square mile of land area C - municipalities located therein, which has a population of at least 900,000, that
THE FLORIDA LEGISLATURE
 THE FLORIDA LEGISLATURE OFFICE OF ECONOMIC AND DEMOGRAPHIC RESEARCH ANDY GARDINER President of the Senate STEVE CRISAFULLI Speaker of the House of Representatives June 11, 2015 Jesse Panuccio, Executive
Jurisdictions that Meet the Population and Density Criteria Related to Exemptions for Dense Urban Land Areas as per s (3)(a), F.S.
(a), F.S.") square and a B - municipalities located in the county, that has an average of at least 1,000 people per square C- 900,000, that has an average of at least 1,000 people per square D - 1 million Altamonte
square and a B - municipalities located in the county, that has an average of at least 1,000 people per square C- 900,000, that has an average of at least 1,000 people per square D - 1 million Altamonte
70CC44 70CC44B 70CC44C 70CC62 70CC88 70CD11 70CD17 70CD17A 70CD17B. Live Scan Device No.
 Department of Agriculture and Consumer Services Division of Licensing Approved Live Scan Fingerprinting s for Chapter 493, Florida Statutes Name and Address 01001010 Biometrics Inc. DBA Binary Biometrics
Solid Waste Management Facilities List
 Solid Waste Management Facilities List Updated: 4/14/2017 including Landfill, C and D Disposal, C and D Recycling, Waste Processing, Tire and Soil Treatment Facilities with financial assurance requirements
Jurisdictions that Meet the Population and Density Criteria Related to Exemptions for Dense Urban Land Areas as per s (29)(a), F.S.
(a), F.S.") Jurisdictions that Meet the Population and Density Criteria Related to Exemptions for Dense Urban Land Areas as per s. 380.06 (29)(a), F.S. A B municipalities located in the county, that has an average
Jurisdictions that Meet the Population and Density Criteria Related to Exemptions for Dense Urban Land Areas as per s. 380.06 (29)(a), F.S. A B municipalities located in the county, that has an average
A COMPARISON OF THE MILWAUKEE METROPOLITAN AREA TO ITS PEERS
 KRY/WJS/EDL #222377 (PDF: #223479) 1/30/15 PRELIMINARY DRAFT Memorandum Report A COMPARISON OF THE MILWAUKEE METROPOLITAN AREA TO ITS PEERS EXECUTIVE SUMMARY This memorandum report provides a statistical
FLORIDA CITIES BY POPULATION WITH COUNTY & FORM OF GOVERNMENT
 Municipality County Form of Government 2017 Population Westlake Palm Beach Council-Manager 5 Marineland Flagler, St. Johns Council-Manager 8 Weeki Wachee Hernando Council-Weak Mayor 9 Lake Buena Vista
FLORIDA CITIES BY POPULATION WITH COUNTY & FORM OF GOVERNMENT
 Municipality County Form of Government 2016 Population Weeki Wachee Hernando Council-Weak Mayor 5 Westlake Palm Beach Council-Manager 5 Marineland Flagler, St Johns Council-Manager 6 Bay Lake Orange Council-Manager
Puerto Ricans in Ohio, the United States, and Puerto Rico, 2014
 Issued April 2016 Centro DS2015US-12 Puerto Ricans in Ohio, the United States, and Puerto Rico, 2014 In 2014, Ohio had the tenth largest number of Puerto Ricans in the United States with 108,174 residents,
981 U.S 98, DESTIN, FL // FOR LEASE 98 PALMS 981 U.S 98, DESTIN, FL HARRY BELL Broker Associate D
 981 U.S 98, DESTIN, FL // PROPERTY SUMMARY Available SF: Lease Rate: Space Type: Building Size: Cross Streets: Traffic Count: 2,800 SF $19/SF(NNN) Retail 84,682 SF Holiday Isle & Emerald Coast Pkwy 60,000
PROFILE OF THE PUERTO RICAN POPULATION IN UNITED STATES AND PUERTO RICO: 2008
 PROFILE OF THE PUERTO RICAN POPULATION IN UNITED STATES AND PUERTO RICO: 2008 Sonia G. Collazo, Camille L. Ryan, Kurt J. Bauman U.S. Census Bureau Housing and Household Economic Statistics Division This
VOICE OF SOUTH MARION
 Primary City of FL ALACHUA ALACHUA 090100 ALACHUA COUNTY TODAY 5,000 0 0 0 THU 6 20 FL ORANGE APOPKA 090148 APOPKA CHIEF 5,000 0 0 0 FRI 6 21.5 FL FRANKLIN APALACHICOLA 090159 APALACHICOLA TIMES 5,000
Leasing Brochure. Park Plaza Shopping Center 1150 N. Federal Highway, Pompano Beach, Florida Under Construction - Coming Very Soon
 Park Plaza Shopping Center 1150 N. Federal Highway, Pompano Beach, Florida 33062 Leasing Brochure Under Construction - Coming Very Soon Exclusive Leasing Broker 2048 East Sample Road, Lighthouse Point,
SMALL MATCHING HISTORIC PRESERVATION GRANTS FY RECOMMENDED FUNDING LIST
 Rank Title Applicant County 1 2 SMALL MATCHING HISTORIC PRESERVATION GRANTS FY 2018-2019 RECOMMENDED FUNDING LIST List of Small Matching Applications submitted to the Secretary of State for review and
Puerto Ricans in Connecticut, the United States, and Puerto Rico, 2014
 Issued April 2016 Centro DS2016US-8 Puerto Ricans in Connecticut, the United States, and Puerto Rico, 2014 In 2014, Connecticut was the 6th state with most Puerto Ricans (301,182) in the United States.
Capital City to Sea Trail (CC2ST) SUMMARY
 SUMMARY") Capital City to Sea Trail (CC2ST) So far over $24M have been invested into the Capital City to Sea Trails. o $9M-Capital Region Transportation Planning Agency (CRTPA). Master Plan/Coastal Trail (Lighthouse
Capital City to Sea Trail (CC2ST) So far over $24M have been invested into the Capital City to Sea Trails. o $9M-Capital Region Transportation Planning Agency (CRTPA). Master Plan/Coastal Trail (Lighthouse
SMALL MATCHING HISTORIC PRESERVATION GRANTS FY FINAL RANKING PROJECT LIST
 Rank Appicant and Project County Grant Amount 1 2 3 4 5 6 7 8 9 10 11 12 13 SMALL MATCHING HISTORIC PRESERVATION GRANTS FY2018-2019 FINAL RANKING PROJECT LIST Vizcaya Museum and Gardens Preserving Robert
POLIDATA REGION MAPS FLORIDA
 FL POLIDATA REGION MAPS County-Based Regions and Markets for FLORIDA 67 Counties and Portions of 20 MSAs (Metropolitan Statistical Areas from OMB for 1999) 6 GMRs (Metro Groups from Polidata and Gary Maloney
ATTACHMENT G STATE OF FLORIDA DEPARTMENT OF FINANCIAL SERVICES DIVISION OF TREASURY DFS TR RFP CONSOLIDATED REVOLVING ACCOUNT SYSTEM SERVICES
 ATTACHMENT G STATE OF FLORIDA DEPARTMENT OF FINANCIAL SERVICES DIVISION OF TREASURY DFS TR RFP 1718-01 CONSOLIDATED REVOLVING ACCOUNT SYSTEM SERVICES AGENCY STREET ADDRESS CITY/STATE/ZIP RESPONDENT'S BANK
Puerto Ricans in Rhode Island, the United States, and Puerto Rico, 2013
 Issued September 2016 Centro DS2015US-07 Puerto Ricans in Rhode Island, the United States, and Puerto Rico, 2013 In 2013 an estimated 36,217 Puerto Ricans lived in Rhode Island and accounted for at least
FLORIDA CITIES BY COUNTY
 Alachua, Alachua County Archer, Alachua County Gainesville, Alachua County Hawthorne, Alachua County High Springs, Alachua County La Crosse, Alachua County Micanopy, Alachua County Newberry, Alachua County
FLORIDA CITIES BY COUNTY
 Alachua, Alachua County Archer, Alachua County Gainesville, Alachua County Hawthorne, Alachua County High Springs, Alachua County La Crosse, Alachua County Micanopy, Alachua County Newberry, Alachua County
T H E VILLAGE OF P h i l m o n t, N Y
 T H E VILLAGE OF P h i l m o n t, N Y Summit Reservoir Area Plan November 17, 2014 Executive Steering Committee Meeting 2 Agenda 1:00 1. Welcome 2. Housekeeping & updates i. Committee contact list review
A COMPARISON OF THE MILWAUKEE METROPOLITAN AREA TO ITS PEERS
 KRY/WJS/EDL #222377 v4 (PDF: #223479v2) 4/1/15 APPENDIX D REVISED DRAFT Memorandum Report A COMPARISON OF THE MILWAUKEE METROPOLITAN AREA TO ITS PEERS EXECUTIVE SUMMARY This report provides a statistical
Airport Profile. St. Pete Clearwater International BY THE NUMBERS 818, ,754 $ Enplanements. Passengers. Average Fare. U.S.
 Airport Profile St. Pete Clearwater International St. Pete-Clearwater International Airport (PIE) is located in Pinellas County, Florida about nine miles north of downwn St. Petersburg, seven miles southeast
Registry of Certified Court Interpreters Haitian Creole Language
 Registry of Certified Court Interpreters Haitian Creole Language This registry is provided as a resource for the Florida State Courts System to utilize in locating certified spoken language court interpreters.
TBARTA: 2015 Master Plan and Tampa Bay Express Project
 TBARTA: 2015 Master Plan and Tampa Bay Express Project The Real Story Who: Tampa Bay Area Regional Transportation Authority What: Develop and implement a Regional Transportation Master Plan for the seven-county
COUNTIES AND COMMUNITIES SERVED COUNTIES COMMUNITIES
 Peoples Gas System First Revised Sheet No. 6.101 a Division of Tampa Electric Company Cancels Original Sheet No. 6.101 AND SERVED *Bay Broward Charlotte *Callaway *Cedar Grove *Lynn Haven *Panama City
Irish Fair of Minnesota: 2017 Attendee Profile
 TOURISM CENTER Irish Fair of Minnesota: 2017 Attendee Profile Authored by Xinyi Qian, Ph.D. Irish Fair of Minnesota: 2017 Attendee Profile November 13, 2017 Authored by Xinyi (Lisa) Qian, Ph.D., University
IMPACT OF RIDE-SOURCING SERVICES ON TRAVEL HABITS AND TRANSPORTATION PLANNING. Zhen Chen
 IMPACT OF RIDE-SOURCING SERVICES ON TRAVEL HABITS AND TRANSPORTATION PLANNING by Zhen Chen Bachelor degree of Transportation Engineering, Beijing Jiaotong University, 2013 Submitted to the Graduate Faculty
Puerto Ricans in Massachusetts, the United States, and Puerto Rico, 2014
 Issued April 2016 Centro DS2016US-07 Puerto Ricans in Massachusetts, the United States, and Puerto Rico, 2014 In 2014, Massachusetts was the fifth state with most Puerto Ricans in the United States. In
Predictive Economic Impact Study for the Mount Dora to Seminole Wekiva Trail
 Predictive Economic Impact Study for the Mount Dora to Seminole Wekiva Trail Prepared By: Valerie Seidel vseidel@balmoralgroup.us 341 N. Maitland Ave., Suite 100 Maitland, FL 32751 Phone (407) 629-2185
part one: comparing puerto ricans
 part one: comparing puerto ricans snapshot: puerto ricans across major us metro areas This section uses data from the 2010 American Community Survey one-year estimates to examine the socioeconomic characteristics
METROPOLITAN STATISTICAL AREA
 Miami-Fort Lauderdale-West Palm Beach METROPOLITAN STATISTICAL AREA Broward County is part of the 8th largest metropolitan statistical area (MSA)() in the country with a population just over 6M in 2016.
1800 St Mary's St Pensacola PAT , Ext Lewis Turner Blvd Fort Walton Beach
 CIRCUIT COUNTY PROVIDER CONTACT PHONE EMAIL STREET ADDRESS CITY ZIP ASSESSMENT TOOL 1 Escambia DJJ/ Lori Jamison 850-595-8820 X215 lori.jamison@djj ELIGIBILITYSCREEN ING PHONE NUMBER 1800 St Mary's St
Civil Citation and Similar Prearrest Diversion Contact List by County
 Civil Citation and Similar Prearrest Diversion Contact List by County CIRCUIT COUNTY PROVIDER Similar Diversion Program Escambia DJJ/ CONTACT PHONE EMAIL STREET ADDRESS CITY ZIP ELIGIBILITY SCREENING PHONE
Appendix H. Charges for Use of Reclaimed Water
 Appendix H. Charges for Use of Reclaimed Water Alachua ALACHUA NRES $7.32 $0.67 Alachua GRU-KANAPAHA NRES $8.40 $0.70 Alachua GRU-KANAPAHA RESD $8.40 $0.70 Alachua GRU-MAIN STREET NRES $8.40 $0.70 Alachua
BOARD OF COUNTY COMMISSIONERS AGENDA ITEM SUMMARY. REQUESTED BY: DEPARTMENT: PREPARED BY: Name: Nicki van Vonno,
 8F1 BOARD OF COUNTY COMMISSIONERS AGENDA ITEM SUMMARY PLACEMENT: DEPARTMENTAL PRESET: 1:50 PM TITLE: STATUS UPDATE OF DERELICT VESSEL PROGRAM AGENDA ITEM DATES: MEETING DATE: 2/26/2013 COMPLETED DATE:
Airport Profile Pensacola International
 Airport Profile Pensacola International 2015 BY THE NUMBERS Enplanements 808,170 Airport Pensacola International Airport (PNS) is located approximately three nautical miles northeast of the central business
Puerto Ricans in Georgia, the United States, and Puerto Rico, 2014
 Issued September 2016 Centro DS2014GA-14 Puerto Ricans in Georgia, the United States, and Puerto Rico, 2014 In 2014, an estimated 89,462 Puerto Ricans lived in Georgia and accounted for 1.7 percent of
OFFERING MEMORANDUM East Arapahoe Road, Greenwood Village, CO. JEFF HALLBERG PRINCIPAL
 SENIOR VICE PRESIDENT / EXECUTIVE SUMMARY Shane and Company is located in Greenwood Village, CO just south of Downtown Denver. The City of Greenwood Village is a located in Arapahoe County, Colorado, United
FREE STANDING OUT PARCEL FOR LEASE Dollar General Plaza - Bank Building 2695 N Military Trail, West Palm Beach, FL 33419
 SUMMARY OVERVIEW Prime location! This free-standing bank/professional building is strategically located on Military Trail just North of Okeechobee Blvd and South of Community Dr. in the heart of West Palm
Broward County Commuting Patterns
 Planning Services Division October 2003 Number 15 Broward County Commuting Patterns Almost 275,000 workers travel across Broward County lines to get from home to work, including 168,000 Broward residents
THANK YOU TO OUR SPONSOR
 THANK YOU TO OUR SPONSOR THANK YOU TO OUR HOST POPULATION POPULATION GROWTH St. Petersburg & Pinellas County Population Growth Rate 3.50% 3.00% 2.50% 2.00% 1.50% 1.00% 0.50% 0.00% -0.50% -1.00% -1.50%
Anchoring Conflicts on Florida s Waterways
 Slide 1 Anchoring Conflicts on Florida s Waterways A Case Study Florida Fish and Wildlife Conservation Commission Division of Law Enforcement Boating and Waterways Section Slide 2 Anchoring in Florida
Top 31 Schools in League 6th Grade (80 Schools)
") 008-009 CONTEST SCORE REPORT SUMMARY FOR GRADES 6, 7, AND 8 Summary of Results 6th Grade Contests FLML Top s in League 6th Grade (80 s) * Lockmar Elem. Palm Bay 79 * H. Bishop Middle Gainesville 6 Our
008-009 CONTEST SCORE REPORT SUMMARY FOR GRADES 6, 7, AND 8 Summary of Results 6th Grade Contests FLML Top s in League 6th Grade (80 s) * Lockmar Elem. Palm Bay 79 * H. Bishop Middle Gainesville 6 Our
St. Johns County Transit Development Plan Update
 St. Johns County Transit Development Plan Update 2012-2021 Demographic Information Population 190,000 people in 2010 51% increase from 2000 Employment 64% over age 16 in labor force St. Augustine, Ponte
FY Annualized. FY Annualized
 REVENUE ESTIMATING CONFERENCE TAX: Stormwater Fees ISSUE: Stormwater Fees for Agricultural Lands BILL NUMBER(S): HB 1197 enrolled Sec 1 SPONSOR(S): State Affairs Committee; Representative Horner MONTH/YEAR
FLORIDA PROBLEM-SOLVING COURTS DIRECTORY
 Place your cursor on the county you wish to view Press the ctrl key on your keyboard then click on the county name Alachua County Bay County Brevard County Broward County Charlotte County Citrus County
Airport Planning Area
 PLANNING AREA POLICIES l AIRPORT Airport Planning Area LOCATION AND CONTEXT The Airport Planning Area ( Airport area ) is a key part of Boise s economy and transportation network; it features a multi-purpose
What FY Cultural and Museum Grants Qualify For and What Their Grants Will Be at $19-Million Appropriation
 at : Alachua 400 Arts Association of Alachua County, Inc. $23,000 $12,791 55.61% Alachua 217 City of Gainesville $150,000 $91,099 60.73% Alachua 119 Dance Alive, Inc. $50,000 $31,078 62.16% Alachua 322
SELECT LIST OF EMINENT DOMAIN MATTERS
 SELECT LIST OF EMINENT DOMAIN MATTERS Client Location Offer Award Abe s Bail Bonds, Inc./ Jessee Enterprises All About Animals, Inc. Bank of America Bank of America Bank of America N.A. Bank of America
SAM S CLUB PLAZA 315/335 SW PINE ISLAND RD CAPE CORAL, FL 33991
 SAM S CLUB PLAZA 315/335 SW PINE ISLAND RD CAPE CORAL, FL 33991 03 05 10 12 EXECUTIVE SUMMARY PROPERTY LOCATION COMPARABLE PROJECTS MARKET OVERVIEW CONTACT INFORMATION TIM SCHNEIDER Principal 239.334.3040
Westshore Development Forum April 9, 2014
 Florida Department of TRANSPORTATION Westshore Development Forum April 9, 2014 District Seven Secretary Paul Steinman Agenda D7 Overview Current Projects Future Projects Vision Florida Department of TRANSPORTATION
2006 RENO-SPARKS VISITOR PROFILE STUDY
 2006 RENO-SPARKS VISITOR PROFILE STUDY PREPARED FOR RENO-SPARKS CONVENTION & VISITOR AUTHORITY Study Conducted and Reported by 475 Hill Street, Suite 2 Reno, Nevada 89501 (775) 323-7677 www.infosearchintl.com
Word Count: 3,565 Number of Tables: 4 Number of Figures: 6 Number of Photographs: 0. Word Limit: 7,500 Tables/Figures Word Count = 2,250
 Katherine F. Turnbull, Ken Buckeye, Nick Thompson 1 Corresponding Author Katherine F. Turnbull Executive Associate Director Texas Transportation Institute Texas A&M University System 3135 TAMU College
Existing Services, Ridership, and Standards Report. June 2018
 Existing Services, Ridership, and Standards Report June 2018 Prepared for: Prepared by: Contents Overview of Existing Conditions... 1 Fixed Route Service... 1 Mobility Bus... 34 Market Analysis... 41 Identification/Description
Cato Elementary School School Report Card Jacksonville Cato Road North Little Rock, AR
 Cato Elementary School School Report Card 2013 2014 9906 Jacksonville Cato Road North Little Rock, AR 72120 501 833 1160 SCHOOL CHARACTERISTICS Principal Superintendent STUDENT DEMOGRAPHICS Shyrel Lee
SARASOTA COUNTY ENVIRONMENTAL SERVICES
 SARASOTA COUNTY ENVIRONMENTAL SERVICES Mercury Thermometer Exchange National Pollution Prevention Week September 20-26, 1999 Mark Engel & Lois Rose Organization of a Statewide Thermometer Exchange Program!
UNIVERSITY AVE SAN DIEGO, CA 92104
 3487-95 UNIVERSITY AVE SAN DIEGO, CA 92104 LISTED BY: Patsy Ma, MBA, CCIM, CRX, CLS President DRE# 00980137 patsyma@bpinternational.net Francisco Williams, CCIM Vice President Investment Sales DRE #01979442
POPULATION INTRODUCTION
 POPULATION INTRODUCTION The socio-economic data available at the time of this writing is a conglomeration of data provided by the Kentucky State Data Center, OKI Regional Council of Governments, 2010 U.S.
SAM S CLUB PLAZA 315/335 SW PINE ISLAND RD CAPE CORAL, FL 33991
 SAM S CLUB PLAZA 315/335 SW PINE ISLAND RD CAPE CORAL, FL 33991 03 EXECUTIVE SUMMARY 05 PROPERTY LOCATION 09 THEATER COMPETITION 11 MARKET OVERVIEW CONTACT INFORMATION TIM SCHNEIDER Principal 239.334.3040
SITE HOTEL PROPERTY. For Sale. I-70 & 7 Highway (NEC) 3.99+/- Acres Total NW 7 Highway, Blue Springs, Missouri A GREATER KANSAS CITY SUBURB
 3.99+/- Acres Total NW 7 Highway, Blue Springs, Missouri A GREATER KANSAS CITY SUBURB") 63,000 cars per day HOTEL PROPERTY 1110 NW 7 Highway, Blue Springs, Missouri A GREATER KANSAS CITY SUBURB N For Sale I-70 & 7 Highway (NEC) 3.99+/- Acres Total 29,000 cars per day SITE Estimated Population
63,000 cars per day HOTEL PROPERTY 1110 NW 7 Highway, Blue Springs, Missouri A GREATER KANSAS CITY SUBURB N For Sale I-70 & 7 Highway (NEC) 3.99+/- Acres Total 29,000 cars per day SITE Estimated Population
THE GALLOWAY OWENS DRIVE & WILLOW ROAD, PLEASANTON, CA
 AT THE CENTER OF IT ALL THE GALLOWAY A luxury mixed-use development featuring prime corner retail spaces located directly across from the Dublin/Pleasanton BART station OWNER: BRE PROPERTIES NORTHERN CALIFORNIA
Wright City Business Park
 Wright City Business Park 51.69 Acres SITE Wright City Business Park is a 51.69 acre site ideal for large distribution or manufacturing uses. Located approximately ¼ mile west of I-70 exit 199, Wright
AVSP 7 Summer Section 7: Visitor Profile - Demographics and Spending
 AVSP 7 Summer 2016 Section 7: Visitor Profile - Demographics and Spending Demographics Origin Visitors were asked what state, country, or province they were visiting from. The chart below shows results
2017 TBARTA Future Regional Priority Projects Adopted by TBARTA Board, December 9, 2016
 2017 TBARTA Future Regional Priority Projects Adopted by TBARTA Board, December 9, 2016 Project numbers do not signify ranking they are for mapping identification purposes only. 1. 15th Street East The
Louisville Neighborhoods A Statistical Portrait
 Louisville Neighborhoods A Statistical Portrait Michael Price Kentucky State Data Center University of Louisville March 2013 West Louisville 9th Street Algonquin Parkway Kentucky County Population Growth
CRYSTAL BEACH EMERALD COAST PKWY, DESTIN, FL 32541
 RETAIL SPACE AVAILABLE PROPERTY SUMMARY Available SF: Space Type: Property Size: Building Size: 1,495 SF Retail (NNN) 9.5 Acres 57,714 SF PROPERTY OVERVIEW The Crystal Beach Plaza is strategically located
COMPARATIVE INDICATORS TO OTHER HAMPTON ROADS CITIES. David Bradley
 COMPARATIVE INDICATORS TO OTHER HAMPTON ROADS CITIES David Bradley July 14, 2017 EXPENDITURES BY CATEGORY - FY 2015-16 ALL FUNDS 100.0% 8.1% 4.1% 7.2% 9.2% 5.8% 8.6% 6.9% 80.0% 60.0% 45.0% 49.1% 36.1%
North American Numbering Plan Administration (NANPA) Subject: 904 NPA Split, Creating 386 NPA (Northeast Florida)
 Subject: 904 NPA Split, Creating 386 NPA (Northeast Florida)") Number: PL-252 Date: December 29, 2000 From: North American Numbering Plan Administration (NANPA) Subject: 904 NPA Split, Creating 386 NPA (Northeast Florida) On October 20, 2000, the Florida Public Service
Number: PL-252 Date: December 29, 2000 From: North American Numbering Plan Administration (NANPA) Subject: 904 NPA Split, Creating 386 NPA (Northeast Florida) On October 20, 2000, the Florida Public Service