P.O. Box 1749 Halifax, Nova Scotia B3J 3A5 Canada Item No Transportation Standing Committee April 23, 2019
|
|
|
- Buddy Norris
- 5 years ago
- Views:
Transcription
1 P.O. Box 1749 Halifax, Nova Scotia B3J 3A5 Canada Item No Transportation Standing Committee April 23, 2019 TO: Chair and Members of Transportation Standing Committee SUBMITTED BY: ORIGINAL SIGNED Dave Reage, MCIP, LPP, Director, Halifax Transit ORIGINAL SIGNED Jacques Dubé, Chief Administrative Officer DATE: February 14, 2019 SUBJECT: 2018/19 Q3 Halifax Transit KPI Report INFORMATION REPORT ORIGIN This report originates from the following motion passed at the July 3, 2013 Transportation Standing Committee meeting: That the Transportation Standing Committee receive a quarterly report and presentation regarding Metro Transit strategic planning and operations. LEGISLATIVE AUTHORITY Section 4(a) of the Terms of Reference for the Transportation Standing Committee provides that the Transportation Standing Committee is responsible for overseeing HRM s Regional Transportation Objectives and Transportation outcome areas. BACKGROUND This report provides a summary of activities in the third quarter of the year and includes reporting on key performance measures. These include measures of revenue, ridership, boardings, overloads, on-time performance, customer service, service levels, and Access-A-Bus service details.
2 2018/19 Q3 Halifax Transit KPI Report Committee Report April 23, 2019 DISCUSSION Halifax Transit is committed to advancing Regional Council s transportation priority outcomes of: A Safe and Accessible Transportation Network Interconnected and Strategic Growth A Well-maintained Transportation Network To assist in achieving these priority outcomes, multi year initiatives were identified in the 2018/19 Halifax Transit Business Plan. These are described below, along with updates on relevant projects and programs that support the goals. Attachment A includes a detailed description of the deliverables identified in the business plan to support these priority outcomes. A Safe and Accessible Transportation Network Multi Year Initiative Transit Accessibility - Halifax Transit is committed to improving the accessibility of transit services in HRM. This includes improvements to the conventional service to make it an inclusive, viable option for more persons with reduced mobility, as well as improvements to the Access-A-Bus system to ensure it is meeting the needs of people who rely on that service. This includes physical infrastructure, policy and process improvements, engagement with the community, staff training and vehicle improvements. Q3 Highlights The Access-A-Bus review has resulted in the creation of the Continuous Improvement Service Plan which includes the roadmap for service improvements, eligibility requirements and discussions with stakeholders and is expected to reduce the booking time requirement as well as reduce the wait list. This plan was presented and approved by Regional Council, February 12, The Department of Community Services Transit Pass Pilot Program has continued to see increased enrollment. It is expected that over 16,500 Nova Scotians will be eligible to participate in the new pilot project and Halifax Transit anticipates an increase in ridership as the program rolls out. As of February 1, 2019, 8,833 passes have been issued, 1,600 of which have been distributed to children under the age of 12. Low Income Transit Pass Program (LITP) During the third quarter, an average of 69% of the 1000 total participants purchased a pass. In December, 120 participants who had not purchased a pass for six consecutive months were removed from the program and replaced with applicants from the waitlist. As of January 2019, the program remains at capacity, with 186 approved applicants on the waitlist. Inactive participants will continue to be removed each month between now and the end of the program year (May 2019) Month Passes purchased Inactive Participants Removed (began Dec. 2018) Applicants on waitlist June n/a 0 July n/a 100 August n/a 213 September n/a 263 October n/a 285 November n/a 289 December
3 2018/19 Q3 Halifax Transit KPI Report Committee Report April 23, 2019 Online Engagement Portal Halifax Transit s online engagement hub, Talk Transit, officially launched in October Since the launch, residents have given insightful feedback on the topics of fare structure, transit safety, transit priority measures, technology, and transferring. As of March 20, 1288 unique participants have filled out at least one Talk Transit survey. Demographic information offered by registrants shows that while various demographic groups are represented (based on age, ethnicity, ability, gender), further improvements are required to ensure the survey is more representative of the population. The updated demographic information is included in Attachment C to the report. While all districts are represented in Talk Transit responses, some are falling short of anticipated numbers. To combat this, Talk Transit survey stations have been provided at select community centres to facilitate in-person surveys. Staff will also be attending various civic events to ensure residents from across the municipality are given the opportunity to provide feedback on Transit topics. Multi-Year Initiative Transit Technology - Through the implementation of improved transit technology including Computer Aided Dispatch/Automated Vehicle Location (CAD/AVL), Electronic Fare Management Systems, and Bus Stop Announcement, Halifax Transit is transforming the way customers interact with the transit system. In addition to providing improved service reliability and enhanced customer experience, new technology will provide data and management opportunities to inform increased efficiency of the transit system. Q3 Highlights In the third quarter of 2018/19, the Halifax Transit Technology Program continued to focus on the delivery of three concurrent projects: Fixed Route Planning, Scheduling & Operations; Fare Management; and Paratransit. The Fixed Route Planning, Scheduling & Operations project team successfully closed off the vendor solution design phase with Trapeze in the March timeframe (Phase 1 - HASTUS replacement). With an approved design, the team has shifted focus to process development, test preparation, and training planning deliverables. The Fare Management project team continues to work on a fare strategy for Halifax Transit. The fare strategy will help Halifax Transit staff determine appropriate fare rates for each of Halifax Transit s fare products as well as future fare-related technology upgrades. The Paratransit project team continued work on the second phase of the Paratransit project the addition of mobile data computers (MDCs) to all Access-A-Bus vehicles. MDCs in all Access-A-Bus vehicles will provide real-time updates to operator manifests and turn-by-turn directions to Operators greatly improving the efficiency of the Access-A-Bus service. A Safe and Accessible Transportation Network Business Plan Deliverable Access-A-Bus Review Implementation Accessible transit Vehicle Procurement Service Plan Bus Stop Accessibility & Improvement Fare Management Solution Begin Implementation Fixed Route Planning, Scheduling, and Operations Begin Implementation Status In Progress Complete Complete In Progress In Progress Interconnected and Strategic Growth Multi Year Initiative Transit Service Plan - Halifax Transit intends to offer its residents a significantly improved transit service. Guided by principles of integrated mobility, high ridership opportunity, and future sustainability, Halifax Transit is undertaking a multi-year initiative that includes a holistic and comprehensive review of the transit system and implementation of approved recommendations.
4 2018/19 Q3 Halifax Transit KPI Report Committee Report April 23, 2019 Q3 Highlights The Mumford Terminal Opportunities Assessment was completed and direction was provided by Regional Council in January The Bus Rapid Transit Study is completed and will be brought forward to TSC in Q4. The Gottingen Street bus lane became fully functional at peak periods in December 2018, and the new Transit Priority Measure at the intersection of Main Street at Gordon Street became functional in January 2019, along with the reinstatement of a previously removed stop. Interconnected and Strategic Growth Business Plan Deliverable Moving Forward Together Plan Year 3 Implementation Mumford Terminal Site Recommendation Wrights Cove Terminal Transit Priority Measures Study/Implementation Status Complete Complete In Progress In Progress A Well-maintained Transportation Network Multi Year Initiative Transit Asset & Infrastructure Renewal - Halifax Transit will continue to promote transit as a key component of an integrated transportation system as a competitor to the single occupant vehicle. To create an enhanced and more accessible experience for its customers, Halifax Transit will continue investment in the renewal of on-street infrastructure including construction of stop locations as well as replacement of Conventional, MetroX and Access-A-Bus vehicles and ferries. Q3 Highlights Tender for the detailed design of the Woodside Ferry Terminal Recapitalization has been awarded and work is currently underway. Work on the fare management kiosk at Halifax Ferry Terminal was initiated in March 2019 as part of Phase 3 of the Halifax Ferry Terminal Refresh project. A Well Maintained Transportation Network Business Plan Deliverable Ferry Replacement Woodside Ferry Terminal Renovation Status Complete In Progress February 2019 Service Adjustments For the first time, Alderney Ferry Service will be offered on Easter Sunday, April 21, The following is a list of subsequent service adjustments that were implemented on February 18, 2019, to routes introduced in previous phases of the Moving Forward Together Plan: Route 194 West Bedford Express was amended to service the first entrance of Broad Street encountered from Larry Uteck Boulevard, to better serve the greater density of potential ridership. Route 123 Timberlea Express had minor routing change on the express portion of the route and several bus stop changes. Performance Measures Please see Attachment B, Halifax Transit 2018/19 Q3 Performance Measures Report for performance measures and detailed route level statistics. Comparisons for Mean Distance Between Failures (MDBF) to previous years will begin once comparable historical data becomes available, to show relative increase/decrease. Q3 Highlights: System wide On-Time Performance this quarter was 77%, improving 2% over last year. The average daily passenger counts this quarter were 97,371 on weekdays, 52,864 on Saturdays and 36,342 on Sundays.
5 2018/19 Q3 Halifax Transit KPI Report Committee Report April 23, 2019 The Departures Line received over 6000 passenger calls on a typical weekday this quarter. Overall boardings increased 7.3% this quarter from last year, while revenue increased 3.7%. Access-A-Bus trips increased 7.2% this quarter. This quarter 92% of customer feedback was resolved within service standards. The average fuel cost this quarter was 81 cents/litre, 15 cents/litre higher than the budgeted cost. The mean distance between failures for conventional transit services this quarter was 6,869 km. The mean distance between service calls (MDBS) for conventional was 3,252 kms, declining 9% compared to the previous year, the MDBS for Access-A-Bus was 75,730 kms. The maximum daily number of buses that could not complete their scheduled service due to a mechanical defect was 16, while the daily average was 7.7. Maintenance cost per kilometer was $1.11/km, nine cents lower than the budget cost of $1.20/km. FINANCIAL IMPLICATIONS There are no financial implications associated with this report. COMMUNITY ENGAGEMENT No community engagement took place as part of this report. ATTACHMENTS Attachment A: Halifax Transit 2018/19 Business Plan Deliverables Attachment B: Halifax Transit 2018/19 Q3 Performance Measures Report Attachment C: Talk Transit Survey Results Infographic A copy of this report can be obtained online at halifax.ca or by contacting the Office of the Municipal Clerk at Report Prepared by: Anthony Grace, Transit Planning Technician, Colin Redding, Transit Planning Technician, Morgan Cox, Transit Planning Technician,
6 Attachment A Halifax Transit 2018/19 Business Plan Deliverables Access-A-Bus Review Implementation Halifax Transit 2018/19 Business Plan Deliverables Deliverable Description Status Demand for the Halifax Transit Access-A-Bus service has increased significantly in recent years. In an effort to leverage the potential of existing resources and processes before increasing fleet size or staff, Halifax Transit will implement the findings of the 2016/17 comprehensive review of all facets of the service, including, redesign of internal processes, scheduling software, eligibility criteria and associated application administration, service coverage, customer interfaces, staff and client training, and other available sources of support. The Access-A-Bus review has resulted in the creation of the Continuous Improvement Service Plan which includes the roadmap for service improvements, eligibility requirements and discussions with stakeholders and is expected to reduce the booking time requirement as well as reduce the wait list. This plan was presented and approved by Regional Council, February 12, The Paratransit project team continues work on the second phase of the Paratransit project, adding mobile data computers (MDCs) to all Access-A-Bus vehicles which will provide real-time updates to operator manifests and turn-by-turn directions to Operators greatly improving the efficiency of the Access-A-Bus service. Accessible-transit Vehicle Procurement Plan Bus Stop Accessibility & Improvement To improve reliability, reduce maintenance costs and provide expanded service, Halifax Transit will develop a new tender document and procure accessible transit vehicles. To improve accessibility, as well as the customer experience, Halifax Transit will be installing accessible landing pads at several bus stops, replacing older bus shelters, partnering with TPW to create a plan to address remaining non-accessible bus stops, and installing benches at bus stops. Additionally, the team proposed a new runcut for February 2019 with more splits to cover peak morning and afternoon times, more fixed shifts, more consistent start times for blocks, and overall a better distribution to meet customer demand. Further optimization to repeater templates should increase passengers per hour and allow more capacity for demand trips. The protoype for the new buses was received in February, the remaining seven buses arrived at the end of March. The project is now complete. All pending work for concrete and shelter installations was completed.
7 Attachment A Halifax Transit 2018/19 Business Plan Deliverables Fare Management Fixed Route Planning, Scheduling and Operations Moving Forward Together Plan Year 3 Implementation Mumford Terminal Site Recommendation To increase revenues, increase operator safety, and provide timely data for management decisions, Halifax Transit will begin implementation of a fare management solution. Validating fareboxes, automated transfer hardware, and processing software will be installed. The primary objective of the Fixed Route Planning, Scheduling, and Operations project is to implement a Planning, Scheduling, and Operations software solution that enables Halifax Transit to operate more efficiently. The existing solution is not capable of supporting the streamlined existing or new business processes required by Halifax Transit. To improve the efficiency and effectiveness of the transit network, Halifax Transit will proceed with network design changes, including removal of service, introduction of new service, and changes to existing routes, as part of the implementation of the Moving Forward Together Plan. The existing Mumford Terminal is overcapacity and in need of replacement to improve the operations and the customer experience, and to allow for future service expansion. A site recommendation report and preparation of the detailed design tender documentation will be completed. The Fare Management project team continues to work on a fare strategy for Halifax Transit. The fare strategy will help Halifax Transit staff determine appropriate fare rates for each of Halifax Transit s fare products as well as future fare-related technology upgrades. A report summarizing the fare strategy is scheduled to go before the Transportation Standing Committee in the summer. The Fixed Route Planning, Scheduling & Operations project team successfully closed off the vendor solution design phase with Trapeze in the March timeframe (Phase 1 - HASTUS replacement). With an approved design, the team has shifted focus to process development, test preparation, and training planning deliverables. Software has been installed in the test and training environments to support these important next steps. Preparing for successful test execution will be an important next step to ensuring the solution works as documented in the detailed design. With a Phase 1 target launch date scheduled in the 2020 timeframe, the team will continue to work closely with the vendor and required business stakeholders to prepare for a successful execution of the priority work tasks. On August 20, 2018, the third year of the Moving Forward Together Plan implementation was rolled out. It saw changes to 13 routes across the network, with a focus on Fairview/Clayton Park. Regional Council approved the staff recommendation for the Mumford Transit Terminal in January Staff discussions continue with the Property Managers.
8 Attachment A Halifax Transit 2018/19 Business Plan Deliverables Wrights Cove Terminal Transit Priority Measures Study / Implementation Ferry Replacement Woodside Ferry Terminal Renovation To enable implementation of the Moving Forward Together Plan and improve the connectivity of the Halifax Transit network, Halifax Transit will work to create the detailed design for the new Wrights Cove Terminal. To improve the reliability of the transit network, and reduce the impact of traffic congestion on transit service, Halifax Transit will continue to study opportunities and implement transit priority measures. To support sustainable ferry operations into the future, Halifax Transit continues with the Ferry Replacement Project. With a funding contribution from the federal government's Public Transit Infrastructure Fund, 18/19 will see the construction, fit out and certification of the last of five replacement ferries, the Rita Joe. The Woodside Ferry Terminal requires significant rehabilitation to all aspects of the building, including envelope, mechanical and electrical systems, and customer waiting areas. In addition, with the expansion of the Halifax Transit ferry fleet, additional berthing space is required. Halifax Transit will complete the detailed design work required to move forward with these improvements. Draft Schematic designs have been completed. The final design is anticipated for completion in spring Construction on the Gottingen Street northbound transit lane is now complete and transit vehicles are currently using it during peak periods. Detailed design of the Bayers Road Corridor is underway, with an anticipated completion in early Work on the functional design for the Robie Street and Young Street Transit Priority Corridors is nearing completion and will be before Regional Council for consideration in the coming months. An additional transit priority measure has been implemented at the intersection of Main Streetand Gordon Avenue in Dartmouth. This project is complete. The final replacement ferry, Rita Joe was received and is now in full service. Detailed design work for the recapitalization of the Woodside Ferry Terminal has been awarded to Abbott Brown Architects. Design development is underway, with completion anticipated for summer 2019.


9 Attachment B: 2018/2019 Halifax Transit Q3 Performance Measures Report 2018/2019 Q3 Performance Measures Report
10 Contents Revenue & Boardings... 1 Historical Boardings & Revenue... 1 Revenue Actual vs. Planned... 3 Mean Distance Between Failures... 4 Mean Distance Between Service Calls... 5 Bus Maintenance Cost Quarter Average vs Budget... 6 Fuel Price Year to Date Average vs Budget... 6 Access-A-Bus Trip Details... 7 Overloads... 7 Customer Service All Services... 8 Boardings & Passengers per Hour... 9 Average Daily Boardings by Service Day Passengers per Hour Boardings & Passengers per Hour Express Service Peak Boardings and Passengers per Trip Boardings by District Weekday Boardings by District All Day Weekday Boardings by District AM Peak Period Passengers per Hour by Route Express Service Peak Passengers per Trip by Route Regional Express Peak Passengers per Trip by Route Ferry Passengers per Hour On-Time Performance Overall Network On-Time Performance Weekday On-Time Performance All Day Services Weekday Peak Period On-Time Performance All Day Services Weekday Peak Period On-Time Performance Peak Only Services... 23
11 Revenue & Boardings Revenue and boardings are reported to demonstrate how well transit services were used over the quarter, in comparison to the same quarter the previous year. By installing Automatic Passenger Counter (APC) systems throughout the network in the 2017/18 fiscal year, Halifax Transit is now able to track the number of boardings by counting passengers entering the bus at each stop, instead of estimating boardings from revenue. Therefore, the data source for boardings in the chart below changed effective 2017/18. When a trip requires a transfer, the boardings metric would count the same passenger each time they entered a new bus. This method of data collection provides a more accurate measure of how passengers are utilizing the system, as assumptions related to multi-use revenue sources, such as tickets and passes, are removed, and replaced by physical counts. In the third quarter, Conventional boardings increased 8.4% from this quarter last year, Ferry boardings decreased 10.4% and Access-A-Bus boardings increased 8.3%. Overall, system wide boardings increased this quarter by 7.3% compared to last year. Revenue this quarter increased 3.7% from last year. The route network changes implemented in August 2018 have resulted in more passengers transferring at the Lacewood Terminal and Mumford terminal, which partly attributes to the increase in boardings, but is estimated to account for less than 1% of the overall network wide increase in boardings. Historical Boardings & Revenue Conventional Boardings & Revenue - Q3 10 m 8 m $8.32 m $8.16 m $7.83 m $7.85 m 6.69 m 6.53 m 6.34 m 6.45 m $8.24 m 6.99 m $10 m $8 m 6 m 4 m $6 m $4 m Boardings Revenue 2 m $2 m 0 m 14/15 15/16 16/17 17/18 18/19 $0 m Ferry Boardings & Revenue - Q3 750, , ,000 $465.1k 307.1k $644.4k $636.3k $609.9k 418.4k 422.1k 405.8k $537.2k 363.6k $750,000 $500,000 $250,000 Boardings Revenue 0 14/15 15/16 16/17 17/18 18/19 $0 Halifax Transit 2018/19 Q3 Performance Measures Report 1
12 Access-A-Bus Boardings & Revenue - Q3 80,000 70,000 $63.9k $66.3k $66.k $68.9k $66.7k $80,000 $70,000 60,000 50,000 40, k 42.4k 42.6k 43.7k 47.3k $60,000 $50,000 $40,000 Boardings 30,000 20,000 $30,000 $20,000 Revenue 10,000 $10, /15 15/16 16/17 17/18 18/19 $0 Halifax Transit Boardings & Revenue - Q3 10 m $10 m 9 m $8.85 m $8.87 m $8.54 m $8.53 m $8.84 m $9 m 8 m 7.4 m $8 m 7 m 7.04 m 6.99 m 6.81 m 6.9 m $7 m 6 m $6 m 5 m 4 m $5 m $4 m Boardings Revenue 3 m $3 m 2 m $2 m 1 m $1 m 0 m 14/15 15/16 16/17 17/18 18/19 $0 m Halifax Transit 2018/19 Q3 Performance Measures Report 2
13 Revenue Actual vs. Planned The following charts provide an indication of how much revenue has been generated by each service type and by Halifax Transit in comparison to the planned budget revenue. Conventional revenue to date increased 4.9% from this time last year and is trending 0.4% above the planned amount. Ferry revenue to date decreased 8.6% from last year and is trending 1.1% above the planned amount. Access-A-Bus revenue to date has increased nearly 1% and is trending 1.7% below the planned amount. Overall revenue to date has increased 3.5% from this time last year and stands at 0.5% higher than the planned amount. $25,000, /19 YTD Actual vs Planned Conventional Revenue $22,810,709 $22,715,900 $20,000,000 $15,000,000 $10,000,000 $5,000,000 $0 Actual Planned $2,500, /19 YTD Actual vs Planned Ferry Revenue $2,263,939 $2,240,000 $2,000,000 $1,500,000 $1,000,000 $500,000 $0 Actual Planned $250,000 $200, /19 YTD Actual vs Planned Access-A-Bus Revenue $209,346 $213,000 $150,000 $100,000 $50,000 $0 Actual Planned Halifax Transit 2018/19 Q3 Performance Measures Report 3
14 $30,000,000 $25,000, /19 YTD Actual vs Planned Halifax Transit Revenue $25,283,994 $25,168,900 $20,000,000 $15,000,000 $10,000,000 $5,000,000 $0 Actual Planned Mean Distance Between Failures Halifax Transit consulted with a number of transit authorities in Canada, and the Canadian Urban Transit Association (CUTA), to understand the difference between past maintenance performance indicators and the industry standard. As a consequence, it was determined that Halifax Transit had reported all maintenance service calls, while other jurisdictions removed service calls associated with auxiliary equipment such as AVL, communication equipment, fareboxes, alarms, lights, passenger-related issues, etc. Also, some jurisdictions reported the number of change-offs (buses discontinuing their scheduled service) to be reflected as failures instead of service calls. Halifax Transit has selected to continue reporting service calls but as a separate metric; Mean Distance Between Service Calls. In order to remain consistent with the industry standard, a new metric defined as Mean Distance Between Failures (MDBF) has been selected and defined below. Halifax Transit s Mean Distance Between Failures (MDBF) is the distance in kms covered between failures. CUTA references the Federal Transit Administration s definition of failures which states that there are two classes of failures. The first being major mechanical system failures, which is the failure of some mechanical element of the revenue vehicle that prevents the vehicle from completing a scheduled revenue trip or from starting the next scheduled revenue trip because actual movement is limited or because of safety concerns. The second type is other mechanical system failures which is the failure of some other mechanical element of the revenue vehicle that, because of local agency policy, prevents the revenue vehicle from completing a scheduled revenue trip or from starting the next scheduled revenue trip even though the vehicle is physically able to continue in revenue service. Therefore, the MDBF is equal to the number of instances whereby a failure resulted in a change-off of the bus or service being lost. This metric does not consider failures resulting from passenger-related events (i.e. sickness on the bus), farebox defects or accident damages as they do not impede the scheduled revenue trips, which aligns with other transit authorities surveyed. Due to the nature of the data sources, Halifax Transit is looking to improve the accuracy of this number by removing failures that were logged, but resulted in no fault found. Currently, the reported number does include these items. Halifax Transit 2018/19 Q3 Performance Measures Report 4
15 Bus Maintenance has set a target of 7,000 kms between failures. The target for this KPI shall be revisited on annual basis to promote continuous improvement, which may be achieved by implementation and support of quality and preventative maintenance initiatives. For the third quarter of 2018, the MDBF for conventional transit is 6,869 kms. This is equivalent to a 7% improvement from the previous quarter. Bus Maintenance will continue to monitor this KPI and further develop quality initiatives to decrease aftertreatment and cooling system defects. Monthly Mean Distance Between Failures KMs 10,000 8,000 6,000 4,000 2,000-8,533 6,945 6,975 5,631 6,120 5,957 July August September October November December Q2 AVG MDBF 6,433 Q3 AVG MDBF 6,869 Mean Distance Between Service Calls In order to continue monitoring the number of maintenance service calls, this will be reflected as a separate metric; Mean Distance Between Service Calls (MDBS). This number will reflect the distance in kilometres covered on average between maintenance service calls. This number includes all instances of service calls including issues with secondary equipment, passenger-related events and damages to the bus resulting from minor accidents. Bus Maintenance is continuing to benchmark this metric in order to provide a target. For the third quarter of 2018, the MDBS for conventional transit was 3,252 kms. In comparison to the third quarter of 2017/2018 (3,582), this is a decrease of 9%. After investigation, there is no primary reason for this decline and may be an anomaly. For the third quarter of 2018, the MDBS for Access-A-Bus service was 75,730 kms. Bus Maintenance will continue to monitor this metric in order to reduce service calls. Kilometers Q3 Mean Distance Between Service Calls 3,808 3,756 3,413 3,381 3,226 2,997 Oct Nov Dec Halifax Transit 2018/19 Q3 Performance Measures Report 5
16 Bus Maintenance Cost Quarter Average vs Budget In the third quarter maintenance costs were $1.11/km, while the budgeted maintenance cost was $1.20/km. Therefore, in the third quarter the average cost per km was under budget by $0.09/km or 8%. Bus Maintenance will continue to strengthen budgeting processes to improve accuracy of future budgets. $1.40 Maintenance Cost per Kilometre - Q3 Average vs Budget $1.20 $1.00 $1.11 $1.20 $0.80 $0.60 $0.40 $0.20 $0.00 Average Price Budget Price Fuel Price Year to Date Average vs Budget The budgeted fuel price for 2018/19 was set at 66 cents/litre. In the third quarter, the average fuel price to date was $0.80 cents/litre, 15 cents higher than the budgeted cost per litre. Fuel Price per Litre - YTD Average vs Budget $0.900 $0.800 $0.801 $0.700 $0.660 $0.600 $0.500 $0.400 $0.300 $0.200 $0.100 $0.000 Average Price Budget Price Halifax Transit 2018/19 Q3 Performance Measures Report 6
17 Access-A-Bus Trip Details Access-A-Bus trip details are tracked monthly to provide an indication of efficiency in Access-A-Bus usage and booking. In April 2018 Access-A-Bus completed a scheduling software upgrade and process improvement review. After introducing these new, standardized processes, scheduling effectiveness has improved. These changes have resulted in statistics, such as the number of trip cancellations, no shows and errors, being recategorized and therefore may not be comparable with prior years. In the third quarter of 2018/19, 2,871 more trips were operated. Compared to third quarter last year this is an increase of 7.2%. The waitlist increased by 20% this quarter compared to last year, due to an increase in late cancellations and no shows. No shows and late cancellations are particularly challenging to fill, having little to no time to fill these bookings with passengers from the waitlist. Access-A-Bus Trip Details - Q3 60,000 50,000 40,000 30, ,873 9, ,252 11, ,000 39,674 42,545 10, /18 18/19 Actual Trips Operated Not Provided Cancelled Waitlisted No Shows Passenger Overloads Halifax Transit tracks overloads that are reported to help match scheduling requirements to passenger demands. The following graph shows the most commonly overloaded routes during the quarter. This does not include all overloads, as many go unreported for a number of reasons. Work is underway to improve the reporting process to ensure the data provides a more accurate reflection of actual conditions. 2018/19 Q3 Reported Overload Incidences by Route Reported Overload Incidences A/B Route Halifax Transit 2018/19 Q3 Performance Measures Report 7
18 Customer Service All Services Customer service statistics are measured monthly using the Hansen Customer Relationship Management software along with Crystal Reports. Feedback is first categorized by subject matter and then divided into two categories: feedback resolved within service standard and feedback resolved outside service standard. The service standard varies depending on the subject matter. This quarter, 52% of feedback received was related to bus operators and 12% regarding service issues. The remaining 36% is comprised of feedback regarding planning and scheduling, bus stops and shelters, marketing, compliments and other miscellaneous comments. Halifax Transit aims to address 90% of feedback within service standard. This quarter 92% of customer feedback was resolved within standard. This slight decrease is due to the transition of staff in several departments and is anticipated to improve in Q4. Call volumes to the Departures Line ( ) are displayed by day of the week. In the third quarter of 2018/19, average call volumes were lower than this time last year for both weekdays as well as for Saturdays and Sundays. Summary of Customer Feedback - Q3 6% 5% 4% 9% 1% 5% 6% Transit Technology Planning & Scheduling Bus Stops & Shelters Bus Operators 12% Service Issues Access-A-Bus Marketing 52% Compliments Other Feedback Feedback resolved within standard: 92% Customer Feedback Comparison - Q3 60% 50% 40% 30% 20% 10% 0% 1% 1% 5% 5% 7% 6% 49% 51% 13% 11% 6% 6% 6% 5% 4% 4% 9% 9% 2017/ /19 Halifax Transit 2018/19 Q3 Performance Measures Report 8
19 Passengers Average Departures Line Call Volumes - Q Weekday Saturday Sunday 2017/ /19 Boardings & Passengers per Hour Automatic Passenger Counter (APC) data is now being been used to report bus ridership statistics. The APCs provide data within a 90% degree of accuracy. Boardings by Route demonstrate passenger usage during the past quarter. APC data has been collected since September The standard deviation is included to demonstrate the degree of variance in boardings from the daily average passenger count. Average weekday boardings in the third quarter were 97,371 ± 13,558 (13.9% variance). Average Saturday boardings this quarter were 52,864 ± 7,501 (14.2% variance). Average Sunday boardings this quarter were 36,342 ± 2,643 (7.3% variance). New routes implemented on August 20, 2018 as part of the Moving Forward Together Plan are not comparable to individual routes they have replaced and as such are not compared by route. Boardings by route comparisons for the following routes will resume in the second quarter of 2019/20. Corridor Routes: 2 Fairview 3 Crosstown 4 Universities Express Routes: 123 Timberlea Express 135 Flamingo Express 136 Farnham Gate Express 137 Clayton Park Express 138 Parkland Express Local Routes: 21 Timberlea 28 Bayers Lake 30 Clayton Park West 39 Flamingo Rural Route: 433 Tantallon Halifax Transit 2018/19 Q3 Performance Measures Report 9
20 Average Daily Boardings by Service Day 120,000 Average Daily Boardings Comparison 100,000 80,000 94,165 94,170 88,392 93,680 97,371 60,000 40,000 51,229 48,484 50,355 55,390 52,864 20,000 32,906 32,460 33,764 39,152 36,342 0 Q3 Q4 Q1 Q2 Q3 2017/ /19 Weekday Saturday Sunday Passengers per Hour Passengers per hour measures the volume of passengers carried per service hour by route. Due to differences in service model/design, Express Routes are measured instead by passengers per trip. Ridership fluctuates significantly by season and therefore figures are compared to the same quarter in the previous year. Conventional route targets vary by time of day and are not illustrated at this time as data is being presented over the entire service day only. Express routes have a ridership target of 20 passengers per trip, while Regional Express Routes have a target of 15 passengers per trip. Halifax Transit 2018/19 Q3 Performance Measures Report 10
21 Boardings & Passengers per Hour Route Q3 Comparison - Average Daily Boardings by Route Weekday Saturday Sunday 17/18 18/19 17/18 18/19 17/18 18/19 Boardings Pass/Hr Boardings Pass/Hr Boardings Pass/Hr Boardings Pass/Hr Boardings Pass/Hr Boardings Pass/Hr 1 10, , , , , , (new) 4, , , (removed) 2, , (new) 6, , , (new) 4, , , (removed) 2, , , , , , , , , A/B 5, , , , , , A 3, , , , , B 1, , , , , , , , , , , , , , , , , , (removed) 1, (removed) 1, (removed) 2, , , (removed) (new) 1, , , , , , , , A/B (new) A (new) B (new) (new) 1, , , (removed) 1, , , Halifax Transit 2018/19 Q3 Performance Measures Report 11
22 Route Q3 Comparison - Average Daily Boardings by Route Weekday Saturday Sunday 17/18 18/19 17/18 18/19 17/18 18/19 Boardings Pass/Hr Boardings Pass/Hr Boardings Pass/Hr Boardings Pass/Hr Boardings Pass/Hr Boardings Pass/Hr 52 (removed) 5, , , , , , , , , , , , , , , , , , , , , , , , , , , , , , , , , , , , , , , , (new) 51 9 Alderney 3, , , , , , Woodside 2, , Halifax Transit 2018/19 Q3 Performance Measures Report 12
23 Express Service Peak Boardings and Passengers per Trip Q3 Comparison - Average Daily Peak Boardings by Route Route Weekday (Peak Only) 17/18 18/19 Boardings Pass/Trip Boardings Pass/Trip 31 (removed) (removed) (removed) (removed) (new) (new) (new) (new) (new) , , Halifax Transit 2018/19 Q3 Performance Measures Report 13

24 Boardings by District To assist in visualizing where ridership demands exist, boardings have been mapped by district. The allday boardings map illustrates typical boardings over an entire service day, whereas the AM Peak Period map represents boardings during the morning peak period only and therefore generally illustrates passenger origins. Weekday Boardings by District All Day Halifax Transit 2018/19 Q3 Performance Measures Report 14
25 Weekday Boardings by District AM Peak Period Halifax Transit 2018/19 Q3 Performance Measures Report 15
26 Passengers per Hour by Route Passengers per Hour (Excluding Express Routes) A/B A/B Halifax Transit 2018/19 Q3 Performance Measures Report 16
27 Express Service Peak Passengers per Trip by Route Express Service Peak Passengers per Trip - Q Route Passengers per Hour Regional Express Peak Passengers per Trip by Route Regional Express Service Peak Passengers per Trip - Q Route Passengers per Trip Ferry Passengers per Hour Ferry Passengers per Hour - Q3 Passengers per Hour Alderney 106 Woodside Halifax Transit 2018/19 Q3 Performance Measures Report 17
28 On-Time Performance On-time performance is a measure of route reliability and is tracked monthly to demonstrate schedule adherence across the network of routes. Terminals and select bus stops along each route are classified as time-points and have assigned and publicized scheduled arrival times. On-time performance demonstrates the percentage of observed time-point arrivals that are between one minute early and three minutes late. Transit industry standard targets for on-time performance tend to range between 85% and 90%, although service types are not always comparably grouped, nor are schedule adherence definitions consistent between agencies. Halifax Transit will analyze on-time performance across the network in order to establish a benchmark and target for the minimum percentage of trips to depart on time. Compared to third quarter last year, on-time performance improved from 75% to 77%. Overall Network On-Time Performance 100% Halifax Transit Overall On-Time Performance 90% 80% 70% 75% 82% 80% 76% 77% 60% 50% 40% 30% 20% 10% 0% Q3 Q4 Q1 Q2 Q3 2017/ /19 Halifax Transit 2018/19 Q3 Performance Measures Report 18
29 Weekday On-Time Performance All Day Services Q3 Weekday On Time Performance - All Day Services 1 *2 63% 67% 68% 73% *3 76% 80% *4 63% 81% 7 67% 74% 9A/B 70% 79% 10 76% 80% 14 62% 63% 15 70% 82% Route Number % 65% 73% 77% 88% 2017/ / % 82% 30A/B 92% *39 67% 69% 41 75% 80% 51 84% 85% 53 69% 73% 54 84% 84% 55 78% 84% 0% 10% 20% 30% 40% 50% 60% 70% 80% 90% 100% * Route 2 is compared to former route 2; Route 3 to former Route 52; Route 4 to former Routes 17, 18 and 42; and Route 39 to former Route 16. Halifax Transit 2018/19 Q3 Performance Measures Report 19
30 Q3 Weekday On Time Performance - All Day Services % 93% 93% 91% 58 90% 95% % 81% 83% 87% % 70% 74% 80% 63 91% 90% % 86% 88% 89% Route Number % 68% 76% 78% 2017/ / % 76% 80 64% 69% 81 65% 68% 82 79% 81% 83 96% 95% 87 63% 67% % 91% 89% 88% 90 62% 68% % 85% 0% 10% 20% 30% 40% 50% 60% 70% 80% 90% 100% Halifax Transit 2018/19 Q3 Performance Measures Report 20
31 Weekday Peak Period On-Time Performance All Day Services Q3 Weekday Peak On-Time Performance - All Day Services 1 *2 48% 51% 52% 60% *3 71% 77% *4 50% 74% 7 68% 69% 9A/B 10 64% 73% 77% 73% 14 49% 49% 15 62% 78% Route Number % 58% 65% 72% 82% 2017/ / % 86% 30A/B 90% *39 55% 58% 41 65% 67% 51 76% 76% 53 65% 67% % 77% 79% 79% 0% 10% 20% 30% 40% 50% 60% 70% 80% 90% 100% * Route 2 is compared to former route 2; Route 3 to former Route 52; Route 4 to former Routes 17, 18 and 42; and Route 39 to former Route 16. Halifax Transit 2018/19 Q3 Performance Measures Report 21
32 Q3 Weekday Peak On-Time Performance - All Day Services 56 95% 94% 57 88% 93% 58 89% 94% 59 71% 71% 60 80% 85% 61 59% 64% 62 69% 76% 63 89% 93% 64 65% 82% 65 83% 88% Route Number % 46% 63% 64% 2017/ / % 61% 80 57% 61% 81 57% 59% 82 69% 71% 83 96% 93% 87 50% 56% % 90% 87% 86% 90 51% 56% % 79% 0% 10% 20% 30% 40% 50% 60% 70% 80% 90% 100% Halifax Transit 2018/19 Q3 Performance Measures Report 22
33 Weekday Peak Period On-Time Performance Peak Only Services Q3 Weekday Peak On Time Performance - Peak Only Services 5 63% 70% 11 79% 84% 32 75% 72% % 99% 79 90% 92% 84 62% 65% *123 57% 57% 56% 55% 58% 71% Route Number % 50% 49% 57% 2017/ / % 76% % 65% 64% 69% % 87% % 77% 82% 90% % 80% % 69% 0% 10% 20% 30% 40% 50% 60% 70% 80% 90% 100% * Route 123 is compared to the former Route 23. Express Routes intentionally leave some non-holding timepoints prior to the scheduled time, skewing adherence values lower than what passengers experience at holding time points. Many of these non-holding timepoints are indicated with a bold black border in the riders guide. Schedule adherence reviewed on newly implemented Clayton Park Express Routes will result in new schedules being implemented in November Halifax Transit 2018/19 Q3 Performance Measures Report 23
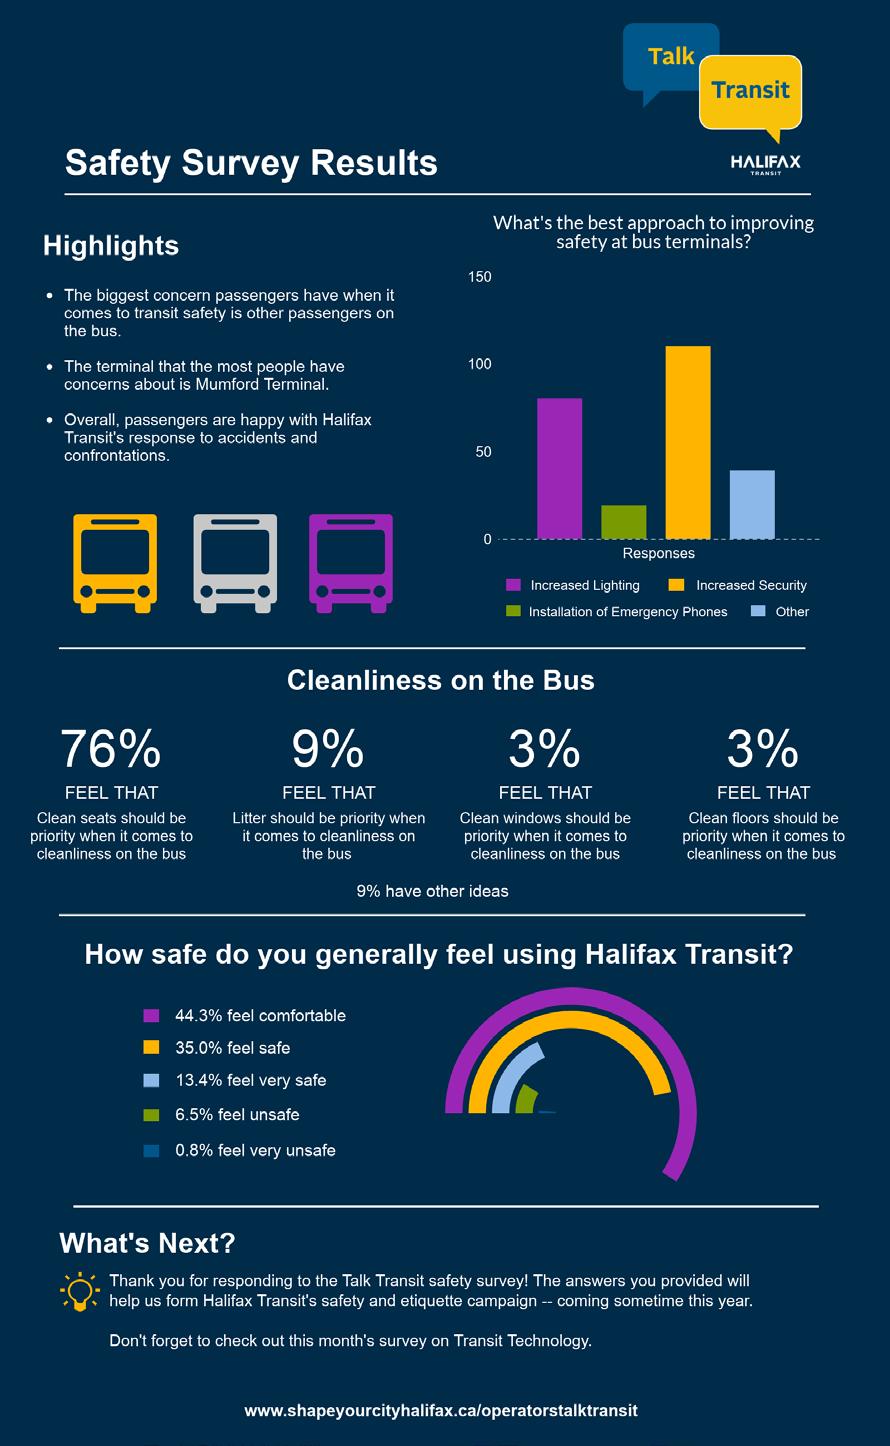
34 Talk Transit Demographic Information & Results Safety Survey - December The Halifax Transit Safety Survey yielded 251 responses total. Of these responses, nine were collected in person at Dartmouth North Community Centre, eight were collected in person at Halifax North Memorial Public Library, and 234 were collected through the online engagement portal, Talk Transit. Participation has been high in urban areas, variable in suburban areas, and lower in rural areas. Survey results have been captured in the report and presentation. Below you ll see how respondents self-identified in terms of demographics. Note that demographic questions were optional and some respondents chose not to respond to these questions. Self-Identification Number of Respondents Percentage of Respondents Aboriginal 6 2% Disabled 38 15% Visible Minority 16 6% Male 54 20% Female 97 39% Other Gender 3 1% Table 1 Self-Identification of Respondents Attachment C Ages of Respondents 12% 31% 19% 6% 10% 10% 12% No Age Provided Figure 2 Ages of Respondents - A total of 30 respondents (12%) are in the age range of A total of 49 respondents (20%) are in the age range of A total of 30 respondents (12%) are in the age range of A total of 24 respondents (10%) are in the age range of A total of 24 respondents (10%) are in the age range of A total of 16 respondents (6%) are in the age range of A total of 78 respondents (31%) did not provide an age 1
35 2
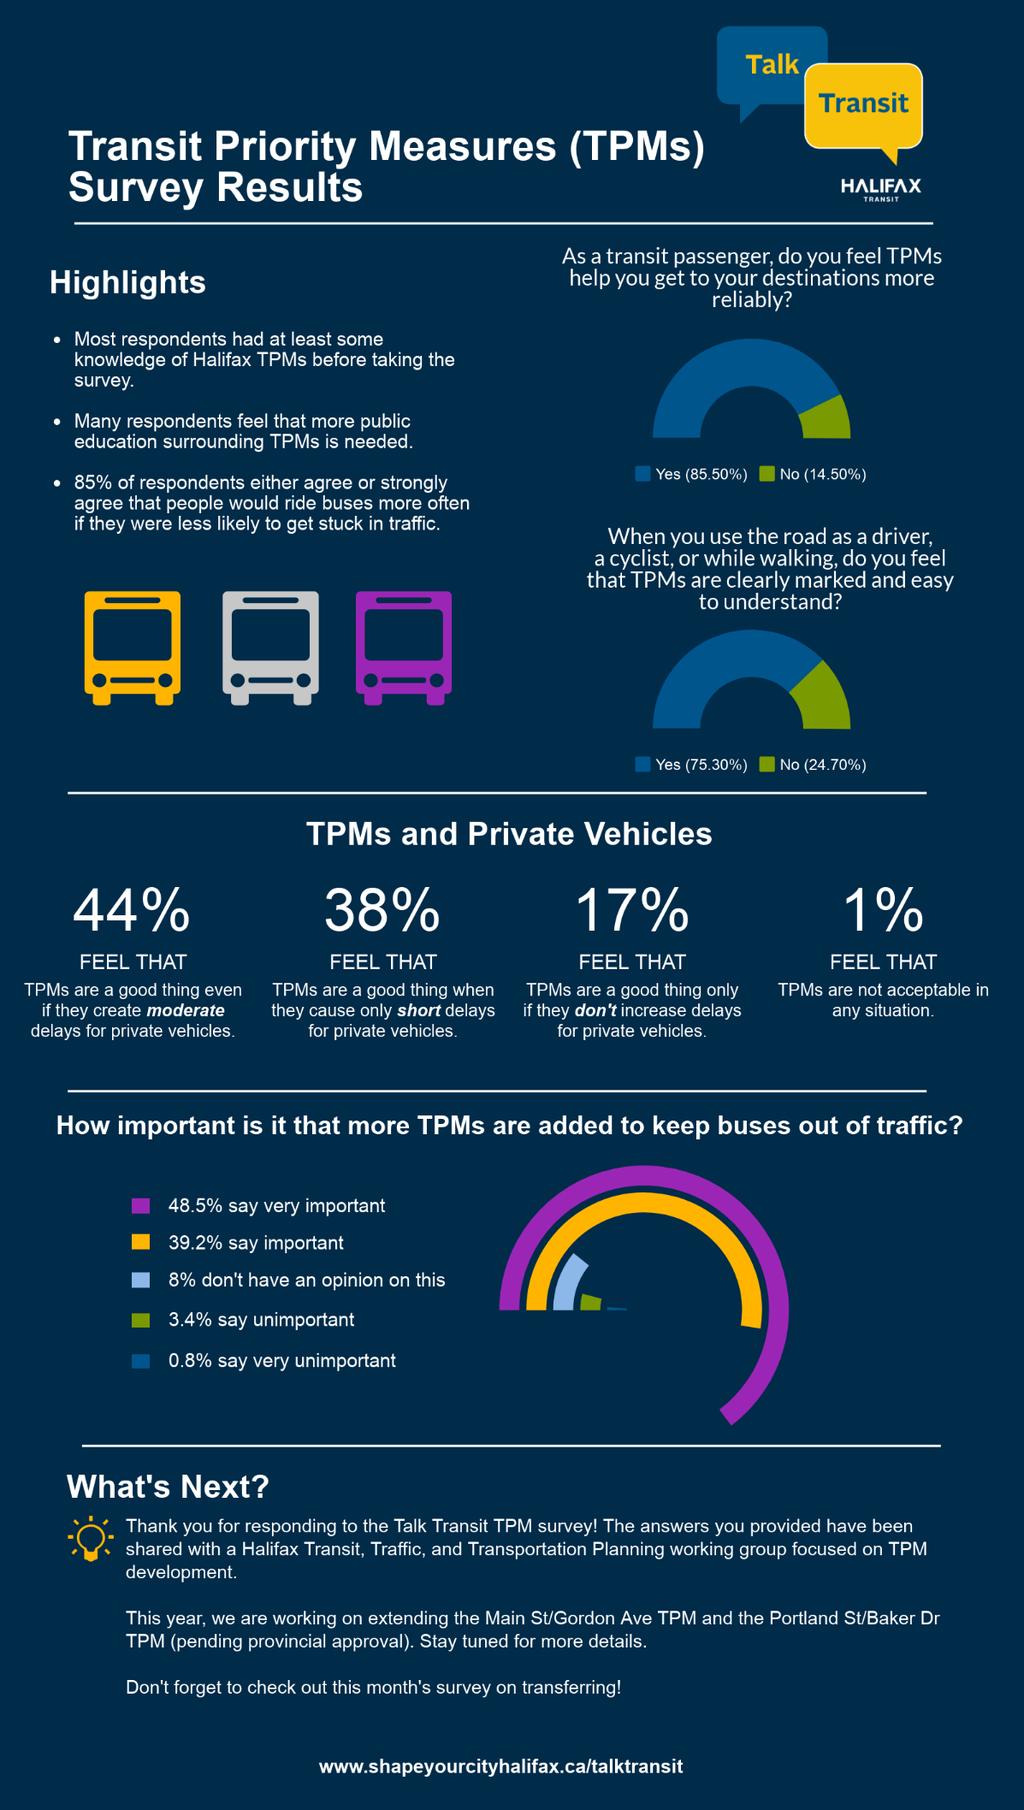
36 Transit Priority Measure (TPM) Survey January The Transit Priority Measure (TPM) Survey yielded 282 responses total. Of these responses, 15 were collected in person at Dartmouth North Community Centre, six were collected in person at St. Andrew s Community Centre, and 261 were collected through the online engagement portal, Talk Transit. Participation has been high in urban areas, variable in suburban areas, and lower in rural areas. Survey results have been captured in the report and presentation. Below you ll see how respondents self-identified in terms of demographics. Note that demographic questions were optional and some respondents chose not to respond to these questions. Self-Identification Number of Respondents Percentage of Respondents Aboriginal 5 2% Disabled 40 14% Visible Minority 11 4% Male 73 29% Female 92 33% Other Gender 2 1% Table 1 Self-Identification of Respondents Ages of Respondents 11% 31% 19% 5% 9% 11% 14% No Age Provided Figure 2 Ages of Respondents - A total of 30 respondents (11%) are in the age range of A total of 55 respondents (20%) are in the age range of A total of 39 respondents (14%) are in the age range of A total of 32 respondents (11%) are in the age range of A total of 24 respondents (9%) are in the age range of A total of 14 respondents (5%) are in the age range of A total of 88 respondents (31%) did not provide an age 3
37 4
P.O. Box 1749 Halifax, Nova Scotia B3J 3A5 Canada Item No Transportation Standing Committee October 25, 2018
 P.O. Box 1749 Halifax, Nova Scotia B3J 3A5 Canada Item No. 12.1.2 Transportation Standing Committee October 25, 2018 TO: Chair and Members of Transportation Standing Committee SUBMITTED BY: Original Signed
P.O. Box 1749 Halifax, Nova Scotia B3J 3A5 Canada Item No. 2 Halifax Regional Council November 13, 2018
 P.O. Box 1749 Halifax, Nova Scotia B3J 3A5 Canada Item No. 2 Halifax Regional Council November 13, 2018 TO: SUBMITTED BY: Mayor Savage and Members of Halifax Regional Council Original Signed Councillor
2017/2018 Q3 Performance Measures Report. Revised March 22, 2018 Average Daily Boardings Comparison Chart, Page 11 Q3 Boardings figures revised
 2017/2018 Q3 Performance Measures Report Revised March 22, 2018 Average Daily Boardings Comparison Chart, Page 11 Q3 Boardings figures revised Contents Ridership & Revenue... 1 Historical Revenue & Ridership...
2017/ Q1 Performance Measures Report
 2017/2018 - Q1 Performance Measures Report Contents Ridership & Revenue... 1 Historical Revenue & Ridership... 1 Revenue Actual vs. Planned... 3 Mean Distance Between Failures... 5 Maintenance Cost Quarter
P.O. Box 1749 Halifax, Nova Scotia B3J 3A5 Canada Item No. 4 Halifax Regional Council August 14, 2018
 P.O. Box 1749 Halifax, Nova Scotia B3J 3A5 Canada Item No. 4 Halifax Regional Council August 14, 2018 TO: Mayor Savage and Members of Halifax Regional Council Original Signed SUBMITTED BY: Councillor Tim
Attachment C: 2017/2018 Halifax Transit Year End Performance Report. 2017/2018 Year End Performance Measures Report
 Attachment C: 2017/2018 Halifax Transit Year End Performance Report 2017/2018 Year End Performance Measures Report Contents Annual Key Performance Indicators (KPIs)... 1 Weekday Cost per Passenger... 1
Att. A, AI 46, 11/9/17
 Total s San Diego Metropolitan Transit System POLICY 42 PERFORMANCE MONITORING REPORT Page 1 of 6 Date: 11/8/17 OBJECTIVE Develop a Customer-Focused and Competitive System The following measures of productivity
Date: 11/6/15. Total Passengers
 Total San Diego Metropolitan Transit System POLICY 42 PERFORMANCE MONITORING REPORT Page 1 of 6 OBJECTIVE Develop a Customer-Focused and Competitive System The following measures of productivity and service
PERFORMANCE REPORT NOVEMBER 2017
 PERFORMANCE REPORT NOVEMBER 2017 Note: New FY2018 Goal/Target/Min or Max incorporated in the Fixed Route and Connection Dashboards. Keith A. Clinkscale Performance Manager INTRODUCTION/BACKGROUND In June
MONTHLY OPERATIONS REPORT SEPTEMBER 2015
 MONTHLY OPERATIONS REPORT SEPTEMBER 215 Table of Contents SEPTEMBER 215 Section Page September Highlights... 3 Strategic Goals Progress Update... 4 Ridership... 6 Revenue... 9 Expenses... 1 System Summary...
PERFORMANCE REPORT JANUARY Keith A. Clinkscale Performance Manager
 PERFORMANCE REPORT JANUARY 2018 Keith A. Clinkscale Performance Manager INTRODUCTION/BACKGROUND Keith A. Clinkscale Performance Manager FIXED ROUTE DASHBOARD JANUARY 2018 Safety Max Target Goal Preventable
MONTHLY OPERATIONS REPORT DECEMBER 2015
 MONTHLY OPERATIONS REPORT DECEMBER 215 Table of Contents DECEMBER 215 Section Page December Highlights... 3 Strategic Goals Progress Update... 4 Ridership... 6 Revenue... 9 Expenses... 1 System Summary...
2017/2018 Annual Service Plan
 2017/2018 Annual Service Plan Contents Summary... 1 Proposed Service Adjustments 2017/2018... 5 Projects & Infrastructure 2017/2018... 13 Review of 2016/2017... 17 2016/17 Service Adjustments... 18 Projects
SAMTRANS TITLE VI STANDARDS AND POLICIES
 SAMTRANS TITLE VI STANDARDS AND POLICIES Adopted March 13, 2013 Federal Title VI requirements of the Civil Rights Act of 1964 were recently updated by the Federal Transit Administration (FTA) and now require
2 YORK REGION TRANSIT MOBILITY PLUS 2004 SYSTEM PERFORMANCE REVIEW
 2 YORK REGION TRANSIT MOBILITY PLUS 2004 SYSTEM PERFORMANCE REVIEW The Joint Transit Committee and Rapid Transit Public/Private Partnership Steering Committee recommends the adoption of the recommendation
PERFORMANCE REPORT DECEMBER 2017
 PERFORMANCE REPORT DECEMBER 2017 Note: New FY2018 Goal/Target/Min or Max incorporated in the Fixed Route and Connection Dashboards. Keith A. Clinkscale Performance Manager INTRODUCTION/BACKGROUND Keith
Transit System Performance Update
 Clause 5 in Report No. 4 of Committee of the Whole was adopted, without amendment, by the Council of The Regional Municipality of York at its meeting held on March 29, 2018. 5 2017 Transit System Performance
PERFORMANCE REPORT DECEMBER Performance Management Office
 PERFORMANCE REPORT DECEMBER 2018 Performance Management Office INTRODUCTION/BACKGROUND Performance Management Office FIXED ROUTE DASHBOARD FY 2019 Safety Max Target Goal Preventable Collisions per 100k
General Issues Committee Item Transit Operating Budget Ten Year Local Transit Strategy
 General Issues Committee Item 4.1 2017 Transit Operating Budget Ten Year Local Transit Strategy January 27, 2017 Presentation Outline 2017 Operating Budget Overview Ten Year Local Transit Strategy 2 2017
Sound Transit Operations December 2014 Service Performance Report. Ridership
 Ridership Total Boardings by Mode Mode Dec-13 Dec-14 % YTD-13 YTD-14 % ST Express 1,266,130 1,396,787 10.3% 16,605,299 17,661,976 6.4% Sounder 248,710 285,016 14.6% 3,035,735 3,361,317 10.7% Tacoma Link
1 YORK REGION TRANSIT/ VIVA SYSTEM PERFORMANCE
 Report No. 6 of the Transportation Services Committee Regional Council Meeting of June 23, 2011 1 YORK REGION TRANSIT/ VIVA SYSTEM PERFORMANCE The Transportation Services Committee recommends: 1. Receipt
AGENDA GUEMES ISLAND FERRY OPERATIONS PUBLIC FORUM
 AGENDA GUEMES ISLAND FERRY OPERATIONS PUBLIC FORUM Wednesday, August 17, 211 6: p.m. Guemes Island Community Hall ~ 7549 Guemes Island Road Thank you for attending the second Annual Public Forum in 211.
FIXED ROUTE DASHBOARD JULY 2018
 FIXED ROUTE DASHBOARD JULY 2018 Safety Max Target Goal Preventable Collisions per 100k Miles Non-Preventable Collisions per 100k Miles Total Incidents per 10,000 Boardings 1.6 1.3 0.8 2.63 2.1 2.0 1.60
METROBUS SERVICE GUIDELINES
 METROBUS SERVICE GUIDELINES In the late 1990's when stabilization of bus service was accomplished between WMATA and the local jurisdictional bus systems, the need for service planning processes and procedures
Transit Performance Report FY (JUNE 30, 2007)
") Transit Performance Report FY 2006-2007 (JUNE 30, 2007) J ANUARY 2008 TRANSIT PERFORMANCE REPORT FY 2006 2007 (JUNE 30, 2007) Transit Performance Report I SSUED: JANUARY 2008 The Transit Performance Report
Transit Performance Report FY 2006-2007 (JUNE 30, 2007) J ANUARY 2008 TRANSIT PERFORMANCE REPORT FY 2006 2007 (JUNE 30, 2007) Transit Performance Report I SSUED: JANUARY 2008 The Transit Performance Report
Board of Directors Information Summary
 Regional Public Transportation Authority 302 N. First Avenue, Suite 700, Phoenix, Arizona 85003 602-262-7433, Fax 602-495-0411 Board of Directors Information Summary Agenda Item #6 Date July 11, 2008 Subject
About This Report GAUGE INDICATOR. Red. Orange. Green. Gold
 ATTACHMENT A About This Report The Orange County Transportation Authority (OCTA) operates a countywide network of local, community, rail connector, and express bus routes serving over 6, bus stops. OCTA
COUNCIL AGENDA REPORT
 COUNCIL AGENDA REPORT Meeting Date: 6 June 2016 Subject: Boards Routed Through: 2017 Airdrie Transit s Community Services Advisory Board Date: 9 May 2016 Issue: Council is being asked to endorse the 2017
Sound Transit Operations August 2015 Service Performance Report. Ridership
 Ridership Total Boardings by Mode Mode Aug-14 Aug-15 % YTD-14 YTD-15 % ST Express 1,534,241 1,553,492 1.3% 11,742,839 12,354,957 5.2% Sounder 275,403 326,015 18.4% 2,139,086 2,463,422 15.2% Tacoma Link
EX28.6 REPORT FOR ACTION. Advancing Fare Integration SUMMARY. Date: October 16, 2017 To: Executive Committee From: City Manager Wards: All
 EX28.6 REPORT FOR ACTION Advancing Fare Integration Date: October 16, 2017 To: Executive Committee From: City Manager Wards: All SUMMARY In July 2016, City Council considered a current state assessment
Sound Transit Operations June 2016 Service Performance Report. Ridership
 Ridership Total Boardings by Mode Mode Jun-15 Jun-16 % YTD-15 YTD-16 % ST Express 1,622,222 1,617,420-0.3% 9,159,934 9,228,211 0.7% Sounder 323,747 361,919 11.8% 1,843,914 2,099,824 13.9% Tacoma Link 75,396
Quarterly Report Transit Bureau, Local Transit Operations. First Quarter, Fiscal Year 2015 (July 2014 September 2014) ART & STAR
 ART & STAR") Quarterly Report Transit Bureau, Local Transit Operations First Quarter, Fiscal Year 2015 (July 2014 September 2014) ART & STAR A Arlington Transit ART 1) Introduction The purpose of ART is to provide
Quarterly Report Transit Bureau, Local Transit Operations First Quarter, Fiscal Year 2015 (July 2014 September 2014) ART & STAR A Arlington Transit ART 1) Introduction The purpose of ART is to provide
SRTA Year End Fixed Route Ridership Analysis: FY 2018
 SRTA Year End Fixed Route Ridership Analysis: FY 2018 2018 Contents Introduction... 1 A. Key Terms Used in this Report... 1 Key Findings... 2 A. Ridership... 2 B. Fare Payment... 4 Performance Analysis
VCTC Transit Ridership and Performance Measures Quarterly Report
 VCTC Transit Ridership and Performance Measures Quarterly Report Overview Quarter 2 Fiscal Year 2018-2019 This report provides performance measures for VCTC Intercity Bus Service covering the FY 2018-19
Establishes a fare structure for Tacoma Link light rail, to be implemented in September 2014.
 RESOLUTION NO. R2013-24 Establish a Fare Structure and Fare Level for Tacoma Link MEETING: DATE: TYPE OF ACTION: STAFF CONTACT: PHONE: Board 09/26/2013 Final Action Ric Ilgenfritz, Executive Director,
Word Count: 3,565 Number of Tables: 4 Number of Figures: 6 Number of Photographs: 0. Word Limit: 7,500 Tables/Figures Word Count = 2,250
 Katherine F. Turnbull, Ken Buckeye, Nick Thompson 1 Corresponding Author Katherine F. Turnbull Executive Associate Director Texas Transportation Institute Texas A&M University System 3135 TAMU College
ATTACHMENT A.7. Transit Division Performance Measurements Report Fiscal Year Fourth Quarter
 TTCHMENT.7 Transit Division Performance Measurements Report Fiscal Year 2012-13 Fourth Quarter Introduction The Orange County Transportation uthority (OCT) operates a countywide network of local, community,
Crown Corporation BUSINESS PLANS FOR THE FISCAL YEAR Trade Centre Limited. Table of Contents. Business Plan
 Crown Corporation BUSINESS PLANS FOR THE FISCAL YEAR 2014 2015 Trade Centre Limited Business Plan 2014 2015 Table of Contents Message from the CEO and the Chair... Mission... Planning Context... Strategic
1 DEMAND RESPONSE OVERVIEW
 1 DEMAND RESPONSE OVERVIEW Forty-nine transit agencies in Ohio operate demand response service, not including demand response services operated as part of the transit service provided in conjunction with
DISTRICT EXPRESS LANES ANNUAL REPORT FISCAL YEAR 2017 JULY 1, 2016 JUNE 30, FloridaExpressLanes.com
 DISTRICT EXPRESS LANES ANNUAL REPORT FISCAL YEAR 2017 JULY 1, 2016 JUNE 30, 2017 FloridaExpressLanes.com This page intentionally left blank. TABLE OF CONTENTS List of Figures... ii List of Tables.... ii
JOSLIN FIELD, MAGIC VALLEY REGIONAL AIRPORT DECEMBER 2012
 1. Introduction The Federal Aviation Administration (FAA) recommends that airport master plans be updated every 5 years or as necessary to keep them current. The Master Plan for Joslin Field, Magic Valley
Ridership Growth Strategy (RGS) Status Update
 Status Update") For Information Ridership Growth Strategy (RGS) Status Update Date: July 10, 2018 To: TTC Board From: Deputy Chief Executive Officer Summary The TTC s Ridership Growth Strategy (RGS), with all its components,
For Information Ridership Growth Strategy (RGS) Status Update Date: July 10, 2018 To: TTC Board From: Deputy Chief Executive Officer Summary The TTC s Ridership Growth Strategy (RGS), with all its components,
MUSKEGON AREA TRANSIT SYSTEM PROPOSAL FOR FARE AND SERVICE ADJUSTMENTS TO BE PHASED IN BEGINNING JANUARY 1, 2018
 MUSKEGON AREA TRANSIT SYSTEM PROPOSAL FOR FARE AND SERVICE ADJUSTMENTS TO BE PHASED IN BEGINNING JANUARY 1, 2018 The Muskegon Area Transit System is proposing a series of System Adjustments to be implemented
PTN-128 Reporting Manual Data Collection and Performance Reporting
 2016 PTN-128 Reporting Manual Data Collection and Performance Reporting Sponsored by the Texas Department of Transportation Table of Contents PTN-128 WHAT, WHY AND WHO... 6 What is the PTN-128... 13 Why
ICAO Young Aviation Professionals Programme
 ICAO Young Aviation Professionals Programme In partnership with and The International Civil Aviation Organization (ICAO), in partnership with the International Air Transport Association (IATA) and Airports
8 CROSS-BOUNDARY AGREEMENT WITH BRAMPTON TRANSIT
 8 CROSS-BOUNDARY AGREEMENT WITH BRAMPTON TRANSIT The Transportation Services Committee recommends the adoption of the recommendations contained in the following report dated May 27, 2010, from the Commissioner
Chapter 3. Burke & Company
 Chapter 3 Burke & Company 3. WRTA RIDERSHIP AND RIDERSHIP TRENDS 3.1 Service Overview The Worcester Regional Transit Authority (WRTA) provides transit service to over half a million people. The service
YRT/VIVA PROPOSED FARE INCREASE
 Report No. 7 of the Transportation Services Committee Regional Council Meeting of September 22, 1 2012 YRT/VIVA PROPOSED FARE INCREASE The Transportation Services Committee recommends: 1. Receipt of the
Juneau Comprehensive Operations Analysis and Transit Development Plan DRAFT RECOMMENDATIONS January 2014
 Juneau Comprehensive Operations Analysis and Transit Development Plan DRAFT RECOMMENDATIONS January 2014 Tonight s Agenda System Strengths & Weaknesses Service Improvement Objectives Draft Recommendations
NSW PRE-BUDGET STATEMENT FUTURE ECONOMY FUTURE JOBS
 2017-18 NSW PRE-BUDGET STATEMENT FUTURE ECONOMY FUTURE JOBS Executive Summary The 2017-18 NSW State Budget presents an opportunity for the NSW Government to future-proof the tourism and transport sectors.
Item No Halifax Regional Council July 18, 2017
 P.O. Box 1749 Halifax, Nova Scotia B3J 3A5 Canada Item No. 14.3.1 Halifax Regional Council July 18, 2017 TO: Mayor Savage and Members of Halifax Regional Council Original Signed SUBMITTED BY: Councillor
The Corporation of the City of Kawartha Lakes Council Report
 The Corporation of the City of Kawartha Lakes Council Report Report Number ENG2017-008 Date: September 12, 2017 Time: 2:00 p.m. Place: Council Chambers Ward Community Identifier: All Subject: Author Name
THIRTEENTH AIR NAVIGATION CONFERENCE
 International Civil Aviation Organization AN-Conf/13-WP/22 14/6/18 WORKING PAPER THIRTEENTH AIR NAVIGATION CONFERENCE Agenda Item 1: Air navigation global strategy 1.4: Air navigation business cases Montréal,
ESCAMBIA COUNTY AREA TRANSIT MTAC REPORT
 ESCAMBIA COUNTY AREA TRANSIT MTAC REPORT November 8, 2017 Meeting Escambia County Area Transit 1515 W. Fairfield Drive Pensacola, FL 32501 850-595-3228 INTRODUCTION 2 Summary Background MTAC ECAT Benchmarks
Memorandum. DATE: May 9, Board of Directors. Jim Derwinski, CEO/Executive Director. Fare Structure Study Fare Pilot Program
 Memorandum DATE: May 9, 2018 TO: FROM: SUBJECT: Board of Directors Jim Derwinski, CEO/Executive Director Fare Structure Study Fare Pilot Program RECOMMENDATION Board action is requested to approve an ordinance
Gold Coast. Rapid Transit. Chapter twelve Social impact. Chapter content
 Gold Coast Rapid Transit Chapter twelve Social impact Chapter content Social impact assessment process...235 Existing community profile...237 Consultation...238 Social impacts and mitigation strategies...239
Item No Halifax Regional Council April 10, 2018
 P.O. Box 1749 Halifax, Nova Scotia B3J 3A5 Canada Item No. 14.3.2 Halifax Regional Council April 10, 2018 TO: SUBMITTED BY: Mayor Savage and Members of Halifax Regional Council Original Signed Councillor
FY Transit Needs Assessment. Ventura County Transportation Commission
 FY 18-19 Transit Needs Assessment Ventura County Transportation Commission Contents List of Figures and Appendices.. 2 Appendices... 1 Chapter 1: Introduction What is the Ventura County Transportation
Thank you for participating in the financial results for fiscal 2014.
 Thank you for participating in the financial results for fiscal 2014. ANA HOLDINGS strongly believes that safety is the most important principle of our air transportation business. The expansion of slots
Bus Reliability and Punctuality Performance
 Bus Reliability and Punctuality Performance Recommendation(s) That the Board: Board Meeting 26 August 2014 i. Notes the changes to the reporting of bus reliability and punctuality. As at July 2014 the
TRANSPORTATION SERVICE Actual
 PERFORMANCE REPORT-THIRD QUARTER VISION TO DELIVER REGIONAL MULTI-MODAL TRANSPORTATION SERVICES AND INFRASTRUCTURE IMPROVEMENTS THAT SIGNIFICANTLY AND CONTINUALLY INCREASE TRANSIT MARKET SHARE. MISSION
Agenda: SASP SAC Meeting 3
 Agenda: SASP SAC Meeting 3 Date: 04/12/18 Public Involvement Plan Update Defining the System Recommended Classifications Discussion Break Review current system Outreach what we heard Proposed changes Classification
New free City connector bus service
 The Adelaide City Council invites engagement from the community about New free City connector bus service 99C City Loop and Adelaide Connector free bus services to merge: Project Summary Adelaide City
Sound Transit Operations January 2014 Service Performance Report. Ridership
 Ridership Total Boardings by Mode Mode Jan-13 Jan-14 % YTD-13 YTD-14 % ST Express 1,343,290 1,426,928 6.2% 1,343,290 1,426,928 6.2% Sounder 245,135 256,775 4.7% 245,135 256,775 4.7% Tacoma Link 86,229
DEMOGRAPHICS AND EXISTING SERVICE
 EXECUTIVE SUMMARY The Central Corridor light-rail transit (LRT) project will open in 2014 and operate between downtown Minneapolis and downtown St. Paul, serving the University of Minnesota and University
Potomac River Commuter Ferry Feasibility Study & RPE Results
 1.1 Introduction The Prince William County Department of Transportation conducted a route proving exercise (RPE) and feasibility study of a proposed commuter ferry service on the Potomac River between
Performance monitoring report for 2014/15
 Performance monitoring report for 20/15 Date of issue: August 2015 Gatwick Airport Limited Summary Gatwick Airport is performing well for passengers and airlines, and in many aspects is ahead of the performance
Making the most of school-level per-student spending data
 InterstateFinancial Making the most of school-level per-student spending data Interstate Financial (IFR) was created by states, for states, to meet the financial data reporting requirement under ESSA and
In-Service Data Program Helps Boeing Design, Build, and Support Airplanes
 In-Service Data Program Helps Boeing Design, Build, and Support Airplanes By John Kneuer Team Leader, In-Service Data Program The Boeing In-Service Data Program (ISDP) allows airlines and suppliers to
KING STREET TRANSIT PILOT
 KING STREET TRANSIT PILOT Update toronto.ca/kingstreetpilot #kingstreetpilot HIGHLIGHTS TRANSIT RIDERSHIP TRANSIT CAPACITY To respond to this growth in ridership, the TTC has increased the capacity of
To ensure the sustainable provision of safe, reliable, friendly and efficient passenger and cargo shipping services for the residents of Sark and
 To ensure the sustainable provision of safe, reliable, friendly and efficient passenger and cargo shipping 1 1) Introduction 2) IOSS financial performance 2015-16 and 2016-17 Year to Date 3) IOSS operational
1.0 BACKGROUND NEW VETERANS CHARTER EVALUATION OBJECTIVES STUDY APPROACH EVALUATION LIMITATIONS... 7
 New Veterans Charter Evaluation Plan TABLE CONTENTS Page 1.0 BACKGROUND... 1 2.0 NEW VETERANS CHARTER EVALUATION OBJECTIVES... 2 3.0 STUDY APPROACH... 3 4.0 EVALUATION LIMITATIONS... 7 5.0 FUTURE PROJECTS...
WESTERN EL DORADO COUNTY SHORT AND LONG-RANGE TRANSIT PLAN Executive Summary
 WESTERN EL DORADO COUNTY SHORT AND LONG-RANGE TRANSIT PLAN Executive Summary Prepared for the El Dorado County Transportation Commission Prepared by The El Dorado County Transportation Commission (EDCTC)
Appendix B Ultimate Airport Capacity and Delay Simulation Modeling Analysis
 Appendix B ULTIMATE AIRPORT CAPACITY & DELAY SIMULATION MODELING ANALYSIS B TABLE OF CONTENTS EXHIBITS TABLES B.1 Introduction... 1 B.2 Simulation Modeling Assumption and Methodology... 4 B.2.1 Runway
CHAPTER 5: Operations Plan
 CHAPTER 5: Operations Plan Report Prepared by: Contents 5 OPERATIONS PLAN... 5-1 5.1 Proposed Service Changes... 5-2 5.1.1 Fiscal Year 2017... 5-2 5.1.2 Fiscal Year 2018... 5-6 5.1.3 Fiscal Year 2019...
Mount Pleasant (42, 43) and Connecticut Avenue (L1, L2) Lines Service Evaluation Study Open House Welcome! wmata.com/bus
 and Connecticut Avenue (L1, L2) Lines Service Evaluation Study Open House Welcome! wmata.com/bus") Mount Pleasant (42, 43) and Connecticut Avenue (L1, L2) Lines Service Evaluation Study Open House Welcome! Study Overview and Timeline Phase 1: Collect and Analyze Data Project Kickoff, September 2017
Mount Pleasant (42, 43) and Connecticut Avenue (L1, L2) Lines Service Evaluation Study Open House Welcome! Study Overview and Timeline Phase 1: Collect and Analyze Data Project Kickoff, September 2017
FACILITATION PANEL (FALP)
") International Civil Aviation Organization WORKING PAPER FALP/10-WP/19 Revised 29/8/18 FACILITATION PANEL (FALP) TENTH MEETING Montréal, 10-13 September 2018 Agenda Item 6: Other matters FACILITATION FOR
International Civil Aviation Organization WORKING PAPER FALP/10-WP/19 Revised 29/8/18 FACILITATION PANEL (FALP) TENTH MEETING Montréal, 10-13 September 2018 Agenda Item 6: Other matters FACILITATION FOR
Crown Corporation Business Plans. Trade Centre Limited
 Crown Corporation Business Plans Trade Centre Limited Contents Message from the CEO and the Chair... 5 Mandate... 7 Alignment with Government s Priorities... 7 Core Responsibilities... 9 Budget Context...
POST-IMPLEMENTATION COMMUNITY IMPACT REVIEW
 POST-IMPLEMENTATION COMMUNITY IMPACT REVIEW RNAV STAR updates and RNP AR approaches at Halifax Stanfield International Airport NAV CANADA 77 Metcalfe Street Ottawa, Ontario K1P 5L6 November 2017 The information
SKAGIT COUNTY PUBLIC WORKS DEPARTMENT Ferry Operations Division Ferry Fare Revenue Target Report
 SKAGIT COUNTY PUBLIC WORKS DEPARTMENT Ferry Operations Division 2018 Ferry Fare Revenue Target Report Skagit County Public Works Department 2018 Ferry Fare Revenue Target Report The following report is
TERMS OF REFERENCE. Drone Advisory Committee (DAC) Role Name or Title Organization. Director, UAS Integration Office. Director, UAS Integration Office
 Role Name or Title Organization. Director, UAS Integration Office. Director, UAS Integration Office") TERMS OF REFERENCE Drone Advisory Committee (DAC) Committee Leadership Role Name or Title Organization Chairman Lead Designated Federal Officer Subcommittee Oversight Oversight Brian Krzanich Administrator
TERMS OF REFERENCE Drone Advisory Committee (DAC) Committee Leadership Role Name or Title Organization Chairman Lead Designated Federal Officer Subcommittee Oversight Oversight Brian Krzanich Administrator
RTD s Performance Management System
 RTD s Performance Management System FTA s New Transit Asset Management (TAM) Program Why Set Targets? October 10, 2017 Donna DeMartino Chief Executive Officer (CEO) San Joaquin Regional Transit District
TRANSIT WINDSOR REPORT
 TRANSIT WINDSOR REPORT MISSION STATEMENT: PROVIDING SAFE, RELIABLE AND AFFORDABLE PUBLIC TRANSIT FOR THE COMMUNITY THROUGH CONTINUOUS IMPROVEMENT IN CUSTOMER CARE, ENVIRONMENTAL STEWARDSHIP AND EMPLOYEE
AIR CANADA REPORTS 2010 THIRD QUARTER RESULTS; Operating Income improved $259 million or 381 per cent from previous year s quarter
 AIR CANADA REPORTS 2010 THIRD QUARTER RESULTS; Operating Income improved $259 million or 381 per cent from previous year s quarter MONTRÉAL, November 4, 2010 Air Canada today reported operating income
APPENDIX B COMMUTER BUS FAREBOX POLICY PEER REVIEW
 APPENDIX B COMMUTER BUS FAREBOX POLICY PEER REVIEW APPENDIX B COMMUTER BUS FAREBOX POLICY PEER REVIEW The following pages are excerpts from a DRAFT-version Fare Analysis report conducted by Nelson\Nygaard
Aviation, Rail, & Trucking 6-1
 6-1 This chapter describes the services, facilities, and condition of air, rail, and trucking as components of the transportation system. These three intermodal areas have an impact on the factors to be
Mobile Farebox Repair Program: Setting Standards & Maximizing Regained Revenue
 Mobile Farebox Repair Program: Setting Standards & Maximizing Regained Revenue Michael J. Walk, Chief Performance Officer Larry Jackson, Directory of Treasury Maryland Transit Administration March 2012
Executive Summary. Introduction. Community Assessment
 Executive Summary Introduction The Red Rose Transit Authority (RRTA) Transit Development Plan provides an evaluation of existing RRTA fixed route services, with the outcome being practical recommendations
Interstate 90 and Mercer Island Mobility Study APRIL Commissioned by. Prepared by
 Interstate 90 and Mercer Island Mobility Study APRIL 2017 Commissioned by Prepared by Interstate 90 and Mercer Island Mobility Study Commissioned by: Sound Transit Prepared by: April 2017 Contents Section
IATA Fuel Efficiency Program
 IATA Fuel Efficiency Program IATA Fuel Efficiency Program The program was launched by IATA in 2004 in response to the rising price of fuel. It is focused on supporting the airlines to increase fuel efficiency
Aircraft Management Comprehensive Ownership, Operation and Maintenance Management Services
 Aircraft Management Comprehensive Ownership, Operation and Maintenance Management Services Aircraft Management Founded upon a heritage of service, Jet Aviation has a unique perspective that has developed
Nova Southeastern University Joint-Use Library Agreement: Review of Public Usage
 Exhibit 1 Nova Southeastern University Joint-Use Library Agreement: Robert Melton, CPA, CIA, CFE, CIG County Auditor Audit Conducted by: Gerard Boucaud, CISA, Audit Manager Dirk Hansen, CPA, Audit Supervisor
September 2014 Prepared by the Department of Finance & Performance Management Sub-Regional Report PERFORMANCE MEASURES
 September 2014 Prepared by the Department of Finance & Performance Management 2013 Sub-Regional Report PERFORMANCE MEASURES REGIONAL PERFORMANCE MEASURES RTA staff has undertaken the development of a performance
Regional Fare Change Overview. Nick Eull Senior Manager of Revenue Operations Metro Transit
 Regional Fare Change Overview Nick Eull Senior Manager of Revenue Operations Metro Transit Committee of the Whole April 5 th, 2017 Today s Presentation Fare change goals and considerations Public engagement
Seychelles Civil Aviation Authority. Telecomm & Information Services Unit
 Seychelles Civil Aviation Authority Telecomm & Information Services Unit 12/15/2010 SCAA 1 WORKSHOP EXERCISE Workshop on the development of National Performance Framework 6 10 Dec 2010 10/12/2010 SCAA
rtc transit Before and After Studies for RTC Transit Boulder highway UPWP TASK Before Conditions
 rtc transit Before and After Studies for RTC Transit UPWP TASK 3403-11-14 Before Conditions Report Boulder highway June 2011 Before and After Studies for RTC Transit BOULDER HIGHWAY BEFORE STUDY UPWP Task
October REGIONAL ROUTE PERFORMANCE ANALYSIS
 October 2018 2017 REGIONAL ROUTE PERFORMANCE ANALYSIS The Council s mission is to foster efficient and economic growth for a prosperous metropolitan region Metropolitan Council Members Alene Tchourumoff
REQUEST FOR EXPRESSIONS OF INTEREST FOR INDIVIDUAL CONSULTANT
 REQUEST FOR EXPRESSIONS OF INTEREST FOR INDIVIDUAL CONSULTANT AFRICAN DEVELOPMENT BANK Statistics Department (ECST) Avenue Joseph Anoma 01 B.P. 1387, Abidjan 01 Côte d Ivoire Email: b.adingra@afdb.org;
BaltimoreLink Implementation Status Report
 BaltimoreLink Implementation Status Report February 218 Joint Chairmen s Report JH1 Executive Summary BaltimoreLink, implemented on June 18, 217, is the complete overhaul and rebranding of the core transit
Bus Statistics for Ireland
 Statistical Bulletin Number: 03/2014 June 2014 Statistics for Ireland State Funded Services Bulletin Topics: Total number of passenger journeys patronage and general economic data Total operated kilometres