Transit / Accessibility
|
|
|
- Louisa Lloyd
- 5 years ago
- Views:
Transcription
1 Transit / Accessibility Total weekday boardings at East Garfield Park CTA stations (defined as stations within onehalf miles of the community) increased between 2000 and 2008, by approximately 44.8%. The Western-Congress stop had the highest percentage increase, at approximately 62%. The Kedzie-Homan-Congress stop had the lowest percentage increase, but the second most riders. East Garfield Park Average Weekday CTA Rail Boardings, Average Weekday Boardings 2,000 1,800 1,600 1,400 1,200 1, Kedzie-Lake Kedzie-Homan-Congress Pulaski-Lake Conservatory California-Lake Western-Congress Station Name %Change %Change Kedzie-Lake 6.91% 21.76% Kedzie-Homan- Congress 15.62% 8.43% Pulaski-Lake 9.56% 25.49% Conservatory 4.05% 28.53% California-Lake 15.24% 59.54% Western-Congress 33.79% 61.97% Total 14.03% 44.81%
2 Total weekday boardings at East Garfield Park Metra stations (also defined as stations within one-half miles) increased as a whole, although the entire gain came from the Western Avenue (Grand) station, which also serves the Near West Side. The Kedzie station actually experienced a 7.25% decline in average weekday boardings from 1995 to Average Weekday Boardings 2,500 2,000 1,500 1, East Garfield Park Metra Average Weekday Boardings, Kedzie Western Avenue (Grand)

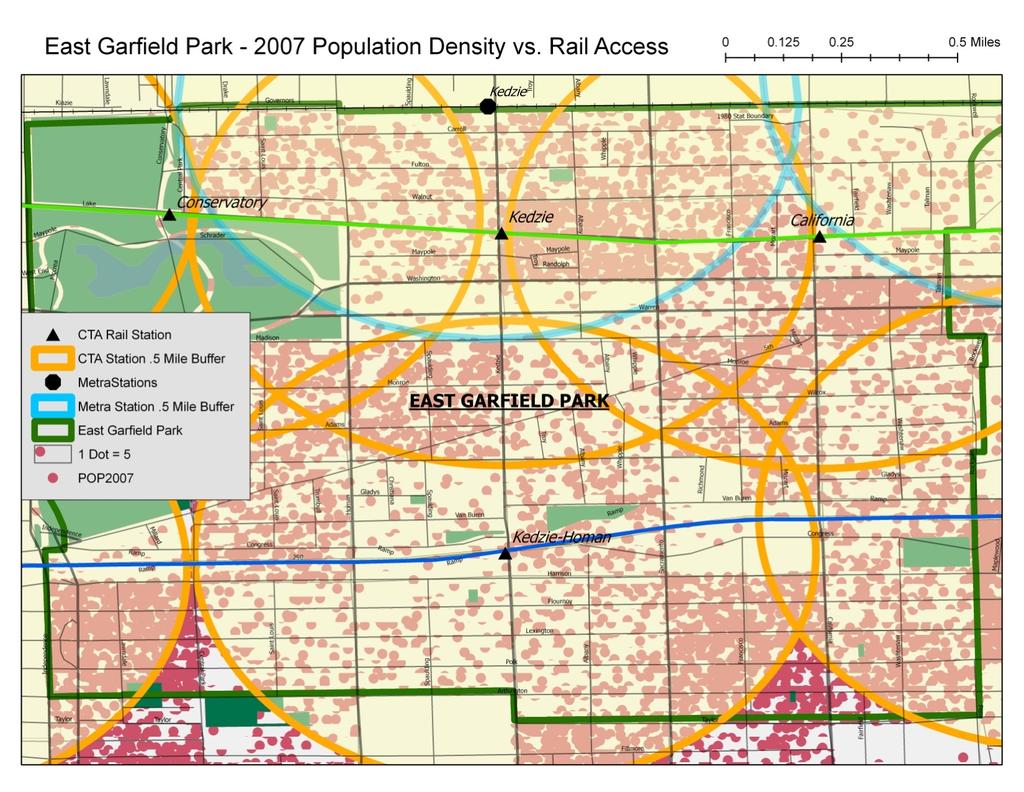
3 Using a half-mile buffer around rail stations (both CTA and Metra), there are only two areas of East Garfield with insufficient rail access two densely populated triangles along the southern edge of the community. Using a quarter-mile measure around CTA bus stops, there are only two areas of the community, at the extreme northeastern and northwestern corners, without sufficient access to bus service. However, the rail holes are covered by bus service, and the bus holes covered by rail.
4
5 A four-person household living in East Garfield Park and earning Chicago-area median income ($51,046) spends $887 a month or 20.8 % of their total income on transportation. A four-person household living in East Garfield Park and earning the median income for the neighborhood ($24,357) earns less and spends less on transportation expenses ($644 a month). However, their transportation expenses account for a greater share 36.1 % of their total income than a family earning more. These findings suggest lower-income households spend a greater percentage of their incomes on transportation. Monthly Transportation Cost for Typical Household (Center for Neighborhood Technology) For household earning area median income, size, and workers per hh Current Year Estimate $887 N/A % income spent on transportation for area median hh Current Year Estimate 20.8% N/A For household earning neighborhood median income, size, and workers per hh Current Year Estimate $664 N/A % income spent on transportation for neighborhood median hh Current Year Estimate 36.1% N/A

6 In 2000 (the most recent year for which data are available), 46% of East Garfield Park residents drove alone to work, the largest single mode of transportation to work. Otherwise, 23% took a bus and 11% drove in two-person carpools. Despite the fact the vast majority of the community s residents live within one-half miles of a CTA rail station, only 5% of people commuted that way. East Garfield Park Modes of Transportation to Work, % 6% 10% 23% 11% 45% Drove Alone 2p carpool Bus Subway/El Compared to the city as whole, East Garfield Park is only substantially different from the broader norm in that 23% of resident relied on a bus, as opposed to 13.74% for the city. Between 2000 and 2008 the population of East Garfield Park grew 2.1%, whereas CTA weekday boardings at East Garfield Park stations increased by 44.81% for the same period. Average weekday boardings on Metra increased by %, though the gains actually occurred at only one station, Western Avenue (Grand).
2954 WEST LAKE STREET KINZIE CORRIDOR
 OFFERING MEMORANDUM 2954 WEST LAKE STREET KINZIE CORRIDOR Presented by: ZACH PRUITT President 312.766.4289 zpruitt@cawleychicago.com NICHOLAS SCHAEFER Vice President 312.766.4285 nschaefer@cawleychicago.com
SAMTRANS TITLE VI STANDARDS AND POLICIES
 SAMTRANS TITLE VI STANDARDS AND POLICIES Adopted March 13, 2013 Federal Title VI requirements of the Civil Rights Act of 1964 were recently updated by the Federal Transit Administration (FTA) and now require
2nd Annual Historic L Station Tour. November 19, Presented By: The Illinois Historic Preservation Agency
 2nd Annual Historic L Station Tour November 19, 2000 Presented By: The Illinois Historic Preservation Agency With: Chicago-L.org The Chicago Design Consortium 2nd Annual Historic L Station Tour Guide Dearborn-Milwaukee
Sound Transit Operations August 2015 Service Performance Report. Ridership
 Ridership Total Boardings by Mode Mode Aug-14 Aug-15 % YTD-14 YTD-15 % ST Express 1,534,241 1,553,492 1.3% 11,742,839 12,354,957 5.2% Sounder 275,403 326,015 18.4% 2,139,086 2,463,422 15.2% Tacoma Link
Sound Transit Operations January 2014 Service Performance Report. Ridership
 Ridership Total Boardings by Mode Mode Jan-13 Jan-14 % YTD-13 YTD-14 % ST Express 1,343,290 1,426,928 6.2% 1,343,290 1,426,928 6.2% Sounder 245,135 256,775 4.7% 245,135 256,775 4.7% Tacoma Link 86,229
A COMPARISON OF THE MILWAUKEE METROPOLITAN AREA TO ITS PEERS
 KRY/WJS/EDL #222377 (PDF: #223479) 1/30/15 PRELIMINARY DRAFT Memorandum Report A COMPARISON OF THE MILWAUKEE METROPOLITAN AREA TO ITS PEERS EXECUTIVE SUMMARY This memorandum report provides a statistical
Sound Transit Operations March 2018 Service Performance Report. Ridership
 March 218 Service Performance Report Ridership Total Boardings by Mode Mar-17 Mar-18 % YTD-17 YTD-18 % ST Express 1,622,116 1,47,79-4.6% 4,499,798 4,428,14-1.6% Sounder 393,33 39,6.% 1,74,96 1,163,76 8.3%
Sound Transit Operations December 2014 Service Performance Report. Ridership
 Ridership Total Boardings by Mode Mode Dec-13 Dec-14 % YTD-13 YTD-14 % ST Express 1,266,130 1,396,787 10.3% 16,605,299 17,661,976 6.4% Sounder 248,710 285,016 14.6% 3,035,735 3,361,317 10.7% Tacoma Link
Chapter 4. Ridecheck and Passenger Survey
 Chapter 4. Ridecheck and Passenger Survey YOLOBUS operates a mix of local, intercity, commute and rural routes. Because there are limited roadways that intercity and rural routes can operate on, stop by
PUBLIC TRANSIT IN KENOSHA, RACINE, AND MILWAUKEE COUNTIES
 PUBLIC TRANSIT IN KENOSHA, RACINE, AND MILWAUKEE COUNTIES #118404v1 Regional Transit Authority June 19, 2006 1 Presentation Overview Existing Public Transit Transit System Peer Comparison Recent Transit
EDGEWATER RETAIL WITH PARKING
 EDGEWATER RETAIL WITH PARKING 5423 N BROADWAY CHICAGO, IL 60640 Tim Rasmussen, CCIM Assistant Vice President 312.676.1875 trasmussen@svn.com Shane Sackett Associate Advisor 312.529.5795 ssackett@svn.com
Lyft s Economic Impact 2015 REPORT
 Lyft s Economic Impact 2015 REPORT In more than 65 cities nationwide, Lyft has become a powerful vehicle of change and connectivity. We studied our seven most established markets to explore Lyft s positive
Retail Space At The Base Of Elevate Lincoln Park For Lease
 Retail Space At The Base Of Elevate Lincoln Park For Lease 2518-2536 NORTH LINCOLN AVENUE CHICAGO, IL 60614 DETAILS Available SF Up To 5,198 SF (Can Be Demised) Lease Rate Negotiable NNN's $15.00 PSF Lot
2nd Quarter. AEDC is pleased to present the Anchorage Quarterly Economic Indicators Report for the second quarter of 2010.
 2010 AEDC is pleased to present the Anchorage Quarterly Economic Indicators Report for the second quarter of 2010. This report summarizes recently updated data from the Anchorage Economic Indicators Database,
Sound Transit Operations June 2016 Service Performance Report. Ridership
 Ridership Total Boardings by Mode Mode Jun-15 Jun-16 % YTD-15 YTD-16 % ST Express 1,622,222 1,617,420-0.3% 9,159,934 9,228,211 0.7% Sounder 323,747 361,919 11.8% 1,843,914 2,099,824 13.9% Tacoma Link 75,396
Word Count: 3,565 Number of Tables: 4 Number of Figures: 6 Number of Photographs: 0. Word Limit: 7,500 Tables/Figures Word Count = 2,250
 Katherine F. Turnbull, Ken Buckeye, Nick Thompson 1 Corresponding Author Katherine F. Turnbull Executive Associate Director Texas Transportation Institute Texas A&M University System 3135 TAMU College
2015 SAN DIEGO VISITOR PROFILE
 2015 SAN DIEGO VISITOR PROFILE (UPDATED SEPTEMBER 2016) SAN DIEGO VISITOR PROFILE 6 THE SAN DIEGO VISITOR INDUSTRY In San Diego, the visitor industry is the second largest traded economy behind the research
JATA Market Research Study Passenger Survey Results
 JATA Market Research Study Passenger Survey Results Prepared for the Jackson Area Transportation Authority (JATA) April, 2015 3131 South Dixie Hwy. Suite 545 Dayton, OH 45439 937.299.5007 www.rlsandassoc.com
SOUTH LOOP RETAIL SPACE NEAR WINTRUST ARENA AND MCCORMICK PLACE
 SOUTH LOOP RETAIL SPACE NEAR WINTRUST ARENA AND MCCORMICK PLACE 1935 S WABASH CHICAGO, IL 60616 Wayne Caplan Senior Vice President 312.529.5791 wayne.caplan@svn.com SVN CHICAGO COMMERCIAL 940 WEST ADAMS
Oakland A s Gondola Economic Impact
 January 2019 Oakland A s Gondola Economic Impact KEY FINDING: The proposed gondola system, which will connect the A s planned stadium to downtown Oakland, will generate $685 million in total economic benefit
Puerto Ricans in Connecticut, the United States, and Puerto Rico, 2014
 Issued April 2016 Centro DS2016US-8 Puerto Ricans in Connecticut, the United States, and Puerto Rico, 2014 In 2014, Connecticut was the 6th state with most Puerto Ricans (301,182) in the United States.
Establishes a fare structure for Tacoma Link light rail, to be implemented in September 2014.
 RESOLUTION NO. R2013-24 Establish a Fare Structure and Fare Level for Tacoma Link MEETING: DATE: TYPE OF ACTION: STAFF CONTACT: PHONE: Board 09/26/2013 Final Action Ric Ilgenfritz, Executive Director,
TRANSPORT AFFORDABILITY INDEX
 TRANSPORT AFFORDABILITY INDEX Report - March 2018 AAA 1 AAA 2 Table of contents Foreword 4 Section One Overview 6 Section Two Summary of Results 8 Section Three Detailed Results 14 Section Four State by
LINCOLN PARK RESTAURANT/ RETAIL FOR LEASE
 LINCOLN PARK RESTAURANT/ RETAIL FOR LEASE 1745-1749 N SHEFFIELD AVE CHICAGO, IL 60614 Marcus Sullivan Assistant Vice President 312.756.7357 msullivan@svn.com Shane Sackett Associate Advisor 312.529.5795
Recommendation on bus/rail bus/rail experiments #78 Montrose Bus Six University of Chicago bus routes Six Westside/W est estside/w Suburban
 PRESIDENT S REPORT March 12, 2008 This spresentation tato Recommendation on 3 bus/rail experiments #78 Montrose Bus Six University of Chicago bus routes Westside/West Suburban Service Plan New CTA Chief
Sound Transit Operations January 2018 Service Performance Report. Ridership
 January 218 Service Performance Report Ridership Total Boardings by Mode Jan-17 Jan-18 % YTD-17 YTD-18 % ST Express 1,3,33 1,7,91.3% 1,3,33 1,7,91.3% Sounder 367,33 416,8 13.3% 367,33 416,8 13.3% Tacoma
Mount Pleasant (42, 43) and Connecticut Avenue (L1, L2) Lines Service Evaluation Study Open House Welcome! wmata.com/bus
 and Connecticut Avenue (L1, L2) Lines Service Evaluation Study Open House Welcome! wmata.com/bus") Mount Pleasant (42, 43) and Connecticut Avenue (L1, L2) Lines Service Evaluation Study Open House Welcome! Study Overview and Timeline Phase 1: Collect and Analyze Data Project Kickoff, September 2017
Mount Pleasant (42, 43) and Connecticut Avenue (L1, L2) Lines Service Evaluation Study Open House Welcome! Study Overview and Timeline Phase 1: Collect and Analyze Data Project Kickoff, September 2017
2018 Service Implementation Plan Executive Summary
 2018 Service Implementation Plan Executive Summary March 2018 2018 SERVICE IMPLEMENTATION PLAN Executive Summary 2018 Service Implementation Plan Each year, Sound Transit prepares a Service Implementation
Chicago Transit Authority: Transit Management within The Loop
 Chicago Transit Authority: Transit Management within The Loop Issues in Transportation Leadership Final Presentation CEE 970 Colloquium in Transportation Management & Policy Spring 2012 Introduction Jamesa
RESULTS FROM WYOMING SNOWMOBILE SURVEY: EXECUTIVE SUMMARY
 RESULTS FROM 2000-2001 WYOMING SNOWMOBILE SURVEY: EXECUTIVE SUMMARY Prepared for the Wyoming Department of State Parks and Historic Sites, Wyoming State Trails Program. Prepared By: Chelsey McManus, Roger
Report on Palm Beach County Tourism Fiscal Year 2007/2008 (October 2007 September 2008)
") Report on Palm Beach County Tourism Fiscal Year 2007/2008 (October 2007 September 2008) Prepared for: Tourist Development Council of Palm Beach County Prepared by: 4020 S. 57 th Avenue Lake Worth, FL 33463
Report on Palm Beach County Tourism Fiscal Year 2007/2008 (October 2007 September 2008) Prepared for: Tourist Development Council of Palm Beach County Prepared by: 4020 S. 57 th Avenue Lake Worth, FL 33463
EXHIBIT 1. BOARD AUTHORIZATION FOR PUBLIC HEARING AND SUBSEQUENT ISSUANCE OF A JOINT DEVELOPMENT SOLICITATION
 EXHIBIT 1. BOARD AUTHORIZATION FOR PUBLIC HEARING AND SUBSEQUENT ISSUANCE OF A JOINT DEVELOPMENT SOLICITATION Washington Metropolitan Area Transit Authority Board Action/Information Summary @Action O Information
6 HIGH-OCCUPANCY-VEHICLE (HOV) LANES AND TRAVEL DEMAND MANAGEMENT (TDM) PROGRAMS
 LANES AND TRAVEL DEMAND MANAGEMENT (TDM) PROGRAMS") 6 HIGH-OCCUPANCY-VEHICLE (HOV) LANES AND TRAVEL DEMAND MANAGEMENT (TDM) PROGRAMS Travel demand management (TDM) programs enable roadways, which have a fixed capacity, to accommodate more travelers without
6 HIGH-OCCUPANCY-VEHICLE (HOV) LANES AND TRAVEL DEMAND MANAGEMENT (TDM) PROGRAMS Travel demand management (TDM) programs enable roadways, which have a fixed capacity, to accommodate more travelers without
September 2014 Prepared by the Department of Finance & Performance Management Sub-Regional Report PERFORMANCE MEASURES
 September 2014 Prepared by the Department of Finance & Performance Management 2013 Sub-Regional Report PERFORMANCE MEASURES REGIONAL PERFORMANCE MEASURES RTA staff has undertaken the development of a performance
A COMPARISON OF THE MILWAUKEE METROPOLITAN AREA TO ITS PEERS
 KRY/WJS/EDL #222377 v4 (PDF: #223479v2) 4/1/15 APPENDIX D REVISED DRAFT Memorandum Report A COMPARISON OF THE MILWAUKEE METROPOLITAN AREA TO ITS PEERS EXECUTIVE SUMMARY This report provides a statistical
Puget Sound Trends. Executive Board January 24, 2019
 Puget Sound Trends Executive Board January 24, 2019 Overview Topics covered in today s presentation: How many jobs are there? Housing Trends Where do people work? How long does it take to get to work?
Slugging in Houston Casual Carpool Passenger Characteristics
 Slugging in Houston Slugging in Houston Casual Carpool Passenger Characteristics Mark W. Burris, Texas A&M University Justin R. Winn, Wilbur Smith Associates Abstract In the last 30 years, determined travelers
Like many transit service providers, the Port Authority of Allegheny County (Port Authority) uses a set of service level guidelines to determine
 uses a set of service level guidelines to determine") Transit service consists of two fundamental elements: frequency (how often service operates) and service span (how long service runs during the day). Combined, these two factors measure how much service
Transit service consists of two fundamental elements: frequency (how often service operates) and service span (how long service runs during the day). Combined, these two factors measure how much service
THE GALLOWAY OWENS DRIVE & WILLOW ROAD, PLEASANTON, CA
 AT THE CENTER OF IT ALL THE GALLOWAY A luxury mixed-use development featuring prime corner retail spaces located directly across from the Dublin/Pleasanton BART station OWNER: BRE PROPERTIES NORTHERN CALIFORNIA
Intercity Bus and Passenger Rail Study
 Intercity Bus and Passenger Rail Study Prepared for the Michigan Department of Transportation University of Michigan, College of Architecture and Urban Planning Intercity Bus and Passenger Rail Study Prepared
The Importance of Service Frequency to Attracting Ridership: The Cases of Brampton and York
 The Importance of Service Frequency to Attracting Ridership: The Cases of Brampton and York Jonathan English Columbia University CUTA Conference May 2016 Introduction Is density the most important determinant
Existing Services, Ridership, and Standards Report. June 2018
 Existing Services, Ridership, and Standards Report June 2018 Prepared for: Prepared by: Contents Overview of Existing Conditions... 1 Fixed Route Service... 1 Mobility Bus... 34 Market Analysis... 41 Identification/Description
Provincial Review 2016: Limpopo
 Provincial Review 2016: Limpopo Limpopo s growth since 2003 has been dominated by the mining sector, especially platinum, and by national construction projects. As a result, the provincial economy grew
Destination Visitor Survey Strategic Regional Research Queensland: Understanding the Queensland Touring Group
 Destination Visitor Survey Strategic Regional Research : Understanding the Touring Group Introduction Tourism is a major industry for (Qld), directly contributing around 124,000 jobs annually. In the year
MARCH 2016 NET RENT PER SF*
 CHICAGO Bishop Plaza 4630 S. Bishop St. Chicago, IL 60609 1,000-2,379 $24 - $26 $8.77 $2,730 - $6,893 Highly visible Walmart-anchored center located in the famed shopping district of the Historic Union
Living on the edge: The impact of travel costs on low paid workers living in outer London executive summary. living on the edge 1
 Living on the edge: The impact travel costs on low paid workers living in outer London executive summary living on the edge 1 introduction key findings London has a world-class public transport system
2011/12 Household Travel Survey Summary Report 2013 Release
 6.8 % 5.1 % 3.4 % 1.2 Household Travel Survey Summary Report 2013 Release Bureau of Transport Statistics Household Travel Survey Summary Report, 2013 Release Bureau of Transport Statistics The Bureau of
Congestion Pricing The Latest Weapon the U.S. War on Traffic Congestion. Darren Henderson, AICP
 Congestion Pricing The Latest Weapon the U.S. War on Traffic Congestion Darren Henderson, AICP Today s s Discussion How bad is congestion? What has been done about it? What else can be done? How Bad is
VALUE OF TOURISM. Trends from
 VALUE OF TOURISM Trends from 2005-2015 March 2017 TABLE OF CONTENTS 1. Overview... 2 Key highlights in 2015... 2 2. Contributions to the economy... 4 TOURISM REVENUE... 5 Total revenue... 5 Tourism revenue
Fast Lanes Study Phase III Telephone Survey Results
 Fast Lanes Study Phase III Telephone Survey Results Methodology 2012 Fast Lanes Study 6/7/12 2 194,000 196,000 651,000 Adults (18+) 261,000 Methodology Areas in Mecklenburg & Union Counties defined by
2016 October - December
 2016 October - December TOURIST ARRIVAL QUARTERLY REPORT Research and Statistics Department Ministry of Tourism, Economic Development, Investment & Energy Statistics Division 1 P a g e Foreword This report
LA Metro Rapid - Considerations in Identifying BRT Corridors. Martha Butler LACMTA, Transportation Planning Manager Los Angeles, California
 LA Metro Rapid - Considerations in Identifying BRT Corridors Martha Butler LACMTA, Transportation Planning Manager Los Angeles, California LA Metro Transportation planner/coordinator, designer, builder
Puerto Ricans in Ohio, the United States, and Puerto Rico, 2014
 Issued April 2016 Centro DS2015US-12 Puerto Ricans in Ohio, the United States, and Puerto Rico, 2014 In 2014, Ohio had the tenth largest number of Puerto Ricans in the United States with 108,174 residents,
PALM BEACH MPO. May 3, Valerie Neilson, AICP Multimodal Manager Palm Beach MPO
 PALM BEACH MPO May 3, 2017 Valerie Neilson, AICP Multimodal Manager Palm Beach MPO VNeilson@PalmBeachMPO.org US-1 MULTIMODAL CORRIDOR STUDY 1. Project Overview 2. Goals 3. Timeline 4. Next Steps PROJECT
PUBLIC TRANSPORTATION INTRODUCTION
 PUBLIC TRANSPORTATION INTRODUCTION 1 OUTLINE Current Status and Recent Trends Significant Influences A Critical Assessment Arguments Supporting Public Transport Future Influences Ingredients for Future
RIDERSHIP TRENDS. October 2017
 RIDERSHIP TRENDS October 2017 Prepared by the Division of Strategic Capital Planning December 2017 Table of Contents Executive Summary...1 Ridership...3 Estimated Passenger Trips by Line...3 Estimated
The Boulder (and Boulder County) Experience. June 6 th, 2017 RTD s Pass Program Working Group 2 nd Meeting
 Experience. June 6 th, 2017 RTD s Pass Program Working Group 2 nd Meeting") The Boulder (and Boulder County) Experience June 6 th, 2017 RTD s Pass Program Working Group 2 nd Meeting The Boulder (and Boulder County) Experience This will cover: 1) Eco Pass Revenues to RTD 2) Public
The Boulder (and Boulder County) Experience June 6 th, 2017 RTD s Pass Program Working Group 2 nd Meeting The Boulder (and Boulder County) Experience This will cover: 1) Eco Pass Revenues to RTD 2) Public
ACRP Synthesis 36 Exploring Airport Employee Commute and Parking Strategies. Diane M. Ricard, Principal DMR Consulting.
 ACRP Synthesis 36 Exploring Airport Employee Commute and Parking Strategies Diane M. Ricard, Principal DMR Consulting dricard@alum.mit.edu Exploring Airport Employee Commute and Parking Strategies Webinar
Sound Transit Operations January 2017 Service Performance Report. Ridership. Total Boardings by Mode
 January 217 Service Performance Report Ridership ST Express Sounder Tacoma Link Link Paratransit Jan-16 Jan-17 % 1,433,7 1,3,33 4.9% 331,27 7,121 98,411 3,633 Total Boardings by Mode 363,6 74,823 1,76,914
UNIVERSITY CITY TOMORROW S URBAN CENTER
 UNIVERSIT Y CIT Y TO M O R R O W S U R B A N C E N T E R ABOUT University City: Tomorrow s Urban Center University City is poised to begin a new chapter as the opening of Charlotte s LYNX Blue Line Extension
International migration. Total net migration. Domestic migration
 Indicator Direction Comparables a. Net population migration b. Crime rate (city) c. Housing costs d. Cost-of-living index N.A. e. State & local tax intensity f. Performing arts groups g. Air quality index
23,760 SF ASSEMBLAGE ZONED LR2
 MAPLE LEAF TOWNHOUSE OR MULTI-FAMILY DEVELOPMENT OPPORTUNITY Under Construction: Townhouse Development Under Construction: 6-Story Multifamily Project 23,760 SF ASSEMBLAGE ZONED LR2 2020, 2024, 2100 &
Federal Budget Submission. Prepared for the House of Commons Standing Committee on Finance. Greater Toronto Airports Authority
 2018-2019 Federal Budget Submission Prepared for the House of Commons Standing Committee on Finance Greater Toronto Airports Authority - August 2017 - Contact: Lorrie McKee Director, Public Affairs and
Sound Transit Operations February 2018 Service Performance Report. Ridership
 February 218 Service Performance Report Ridership Total Boardings by Mode Feb-17 Feb-18 % YTD-17 YTD-18 % ST Express 1,373,96 1,372,88 -.1% 2,877,294 2,88,719.1% Sounder 314,96 32,187 11.9% 681,923 768,69
Memorandum. DATE: May 9, Board of Directors. Jim Derwinski, CEO/Executive Director. Fare Structure Study Fare Pilot Program
 Memorandum DATE: May 9, 2018 TO: FROM: SUBJECT: Board of Directors Jim Derwinski, CEO/Executive Director Fare Structure Study Fare Pilot Program RECOMMENDATION Board action is requested to approve an ordinance
Coast to coast. STR Coastal Town Review Coastal Towns Market Review Report_JE.indd 3
 Coast to coast. STR Coastal Town Review 16 Coastal Towns Market Review Report_JE.indd 3 4//17 8:31:38 AM Table of Contents Introduction...3 United Kingdom...4 Blackpool...6 Bournemouth...8 Brighton...
FALKLAND ISLANDS International Tourism Statistics Report 2012
 FALKLAND ISLANDS International Tourism Statistics Report 2012 2 Falkland Islands Tourism 2012 Land-Based Tourism Number of tourist arrivals All tourists: Leisure tourists: 7,791 17% compared to 2011 1,937
Title VI Service Equity Analysis
 Pierce Transit Title VI Service Equity Analysis Pursuant to FTA Circular 4702.1B NE Tacoma Service May 2016 Pierce Transit Transit Development Dept. PIERCE TRANSIT TITLE VI SERVICE EQUITY ANALYSIS TABLE
APPENDIX B. Arlington Transit Peer Review Technical Memorandum
 APPENDIX B Arlington Transit Peer Review Technical Memorandum Arlington County Appendix B December 2010 Table of Contents 1.0 OVERVIEW OF PEER ANALYSIS PROCESS... 2 1.1 National Transit Database...2 1.2
YARTS ON-BOARD SURVEY MEMORANDUM
 YARTS ON-BOARD SURVEY MEMORANDUM Prepared for the Yosemite Area Regional Transportation System Prepared by LSC Transportation Consultants, Inc. This page left intentionally blank. YARTS On-Board Survey
2008 Lodging Industry Profile. All figures are for year-end Figures for 2008 will be available in fall 2009.
 2008 Lodging Industry Profile All figures are for year-end 2007. Figures for 2008 will be available in fall 2009. 2007 At-a-Glance Statistical Figures 48,062 properties* 4,476,191 guestrooms $139.4 billion
1 DEMAND RESPONSE OVERVIEW
 1 DEMAND RESPONSE OVERVIEW Forty-nine transit agencies in Ohio operate demand response service, not including demand response services operated as part of the transit service provided in conjunction with
San Francisco Municipal Transportation Agency (SFMTA) Travel Decision Survey 2012
 Travel Decision Survey 2012") Note: The weighting used in this report is not consistent with Travel Decision Surveys (TDS) 2013 and 2014, and findings from this report should not be compared with findings from TDS 2013 and TDS 2014.
Note: The weighting used in this report is not consistent with Travel Decision Surveys (TDS) 2013 and 2014, and findings from this report should not be compared with findings from TDS 2013 and TDS 2014.
Fiscal Management and Control Board. Fare Policy October 16, Draft for Discussion & Policy Purposes Only
 Fiscal Management and Control Board Fare Policy October 16, 2015 1 Components of Fares Fare Level Different types of pricing by: By mode By time of day By distance By rider type (reduced fare) Subscription
Interstate 90 and Mercer Island Mobility Study APRIL Commissioned by. Prepared by
 Interstate 90 and Mercer Island Mobility Study APRIL 2017 Commissioned by Prepared by Interstate 90 and Mercer Island Mobility Study Commissioned by: Sound Transit Prepared by: April 2017 Contents Section
Peer Performance Measurement February 2019 Prepared by the Division of Planning & Market Development
 2017 Regional Peer Review Peer Performance Measurement February 2019 Prepared by the Division of Planning & Market Development CONTENTS EXECUTIVE SUMMARY... 3 SNAPSHOT... 5 PEER SELECTION... 6 NOTES/METHODOLOGY...
CITY OF COTATI: LOCAL ECONOMIC REPORT
 EDB Sonoma County Economic Development Board Cotati Chamber of Commerce economy 2010-11 CITY OF COTATI: LOCAL ECONOMIC REPORT E c o n o m i c D e v e l o p m e n t B o a r d 4 0 1 C o l l e g e Av e n
Puerto Ricans in Rhode Island, the United States, and Puerto Rico, 2013
 Issued September 2016 Centro DS2015US-07 Puerto Ricans in Rhode Island, the United States, and Puerto Rico, 2013 In 2013 an estimated 36,217 Puerto Ricans lived in Rhode Island and accounted for at least
A Public Transportation Review Evaluating Metro s Operational Efficiency, Service Capacity and Fiscal Impact
 A Public Transportation Review Evaluating Metro s Operational Efficiency, Service Capacity and Fiscal Impact Minneapolis St. Louis Denver Indianapolis Louisville Austin Cleveland Pittsburgh Columbus Cincinnati
Provincial Review 2016: KwaZulu-Natal KwaZulu-Natal
 Provincial Review 2016: KwaZulu-Natal KwaZulu-Natal KwaZulu-Natal has a strong role in South Africa s manufacturing and agriculture, and has its largest port and main North-South freight corridor. Its
Travel Decision Survey Summary Report. San Francisco Municipal Transportation Agency (SFMTA)
") Note: The weighting used in this report is not consistent with Travel Decision Surveys (TDS) 2013 and 2014, and findings from this report should not be compared with findings from TDS 2013 and TDS 2014.
Note: The weighting used in this report is not consistent with Travel Decision Surveys (TDS) 2013 and 2014, and findings from this report should not be compared with findings from TDS 2013 and TDS 2014.
Santa Barbara County Association of Governments 2002 COMMUTE PROFILE
 Santa Barbara County Association of Governments 2002 COMMUTE PROFILE for Santa Barbara, San Luis Obispo and Ventura Counties FINAL REPORT Santa Barbara County Association of Governments - 2002 COMMUTE
FALLS FLAT: COMPARING THE TTC`S FARE POLICY TO OTHER LEADING TRANSIT AGENCIES
 FALLS FLAT: COMPARING THE TTC`S FARE POLICY TO OTHER LEADING TRANSIT AGENCIES Brady Yauch Executive Director and Economist of Consumer Policy Institute (416) 964-9223 ext 236 bradyyauch@consumerpolicyinstitute.org
FINAL. Summary Report 2017 On-Board Passenger Survey
 FINAL Summary Report 2017 On-Board Passenger Survey June 13, 2018 Acknowledgements Project Team WETA Staff Kevin Connolly Manager, Planning and Development Michael Gougherty Senior Planner, Planning and
TRANSPORT AFFORDABILITY INDEX
 TRANSPORT AFFORDABILITY INDEX Report - December 2016 AAA 1 AAA 2 Table of contents Foreword 4 Section One Overview 6 Section Two Summary of Results 7 Section Three Detailed Results 9 Section Four City
RELATED SANTA CLARA SANTA CLARA, CALIFORNIA. RELATED SANTA CLARA Santa Clara, CA
 RELATED SANTA CLARA SANTA CLARA, CALIFORNIA RELATED SANTA CLARA Santa Clara, CA JUNE 2016 APPROVAL TIMELINE RELATED SANTA CLARA Santa Clara, CA 1 ACRES PARKS & OPEN SPACE (40% OF TOTAL SITE) PARCEL 3 PARK
MVT Neighborhood Perception Survey Summary Results Covering Calendar Year 2017
 MVT Neighborhood Perception Survey Summary Results Covering Calendar Year 2017 Survey Overview Launched January 2018 Circulated electronically and by hard copy via: MVT CID s Triangle Times newsletter
ECONOMIC PROFILE PARK CITY & SUMMIT COUNTY, UTAH
 ECONOMIC PROFILE PARK CITY & SUMMIT COUNTY, UTAH Prepared by the Park City Chamber of Commerce & Visitors Bureau PO Box 1630, Park City, UT 84060 1.800.453.1360 Economic Profile Packet Sections 1. Introduction
Marketing and Passenger Demographics
 Marketing and Passenger Demographics This chapter presents information obtained from surveys and related sources about regional bus users in Massachusetts. If broad user characteristics in this market
Active Red Light Camera Approaches
 1 Western Cermak SB 32 Lawrence Pulaski EB 2 Cermak Western EB 33 Central Irving Park SB 3 Western Peterson NB 34 Irving Park Central EB 4 Peterson Western SB 35 Western Lawrence SB 5 Irving Park Narragansett
Puerto Ricans in Massachusetts, the United States, and Puerto Rico, 2014
 Issued April 2016 Centro DS2016US-07 Puerto Ricans in Massachusetts, the United States, and Puerto Rico, 2014 In 2014, Massachusetts was the fifth state with most Puerto Ricans in the United States. In
NSW BUSINESS CONDITIONS SEPTEMBER Quarterly snapshot of NSW economy informed by the businesses of NSW
 NSW BUSINESS CONDITIONS SEPTEMBER 218 Quarterly snapshot of NSW economy informed by the businesses of NSW NSW THIS QUARTER The NSW Business Chamber s Business Conditions Survey points to tougher trading
SUB-REGIONAL PERFORMANCE MEASURES
 SUB-REGIONAL PERFORMANCE MEASURES 29 REPORT Overall regional performance is a function of five major areas: Service Coverage - monitors both how much service is available to people in the region (in terms
LINCOLN PARK RETAIL 2800 N LINCOLN AVE, UNIT 101 CHICAGO, IL Deena Zimmerman Vice President
 LINCOLN PARK RETAIL 2800 N LINCOLN AVE, UNIT 101 CHICAGO, IL 60657 Deena Zimmerman Vice President 312.756.7336 dzimmerman@svn.com Lorile Herlihy Senior Advisor 312.529.5794 lherlihy@svn.com SVN CHICAGO
2015 Independence Day Travel Overview U.S. Intercity Bus Industry
 2015 Independence Day Travel Overview U.S. Intercity Bus Industry Chaddick Institute for Metropolitan Development, DePaul University June 25, 2015 This Intercity Bus Briefing summarizes the Chaddick Institute
Appraisal of Factors Influencing Public Transport Patronage in New Zealand
 Appraisal of Factors Influencing Public Transport Patronage in New Zealand Dr Judith Wang Research Fellow in Transport Economics The Energy Centre The University of Auckland Business School, New Zealand
at EAST HILLS r e s t a u r a n t s t h e a t e r s h o p p i n g l i f e s t y l e c o m m u n i t y FEATURES
 FEATURES Formerly the East Hills Mall r e s t a u r a n t s t h e a t e r s h o p p i n g l i f e s t y l e c o m m u n i t y City Lights at East Hills will offer 350,500sf of mixed use retail featuring
Providing public transportation since 1999 between Washington and Milwaukee Counties
 Providing public transportation since 1999 between Washington and Milwaukee Counties Background Information Started in 1999, funded by a three-year CMAQ grant. Employers and fare revenue covered local
STUDY PROCESS. Study. PHASE I Research. PHASE II Develop & Analyze Options. PHASE III Recommendations. Regional Transit
 STUDY PROCESS PHASE I Research PHASE II Develop & Analyze Options PHASE III Recommendations February 2008 - July 2008 July 2008 - September 2008 September 2008 - December 2008 Analyze transit and projected
Washington Metropolitan Area Transit Authority Services Utilization Study
 Washington Metropolitan Area Transit Authority Services Utilization Study Maryland House Bill 300 Table of Contents Page 2 Executive Summary Slide 3 Notes Slide 4 Metro Systemwide Fact Sheet Slide 5 How