Research Report Van Crashes in Great Britain. How van drivers compare to all motorists
|
|
|
- Phoebe Richards
- 5 years ago
- Views:
Transcription


1 Research Report 214 How van drivers compare to all motorists
2 Van drivers are our everyday heroes, Let s take care of them Foreword by Darrell Sansom, Managing Director, AXA Business Insurance As one of the UK s major commercial vehicle insurers, we commissioned this study from our partners at Road Safety Analysis, because we felt there was a crying need for definitive data on the unique risks that van drivers face on our roads. Chief among them, tiredness whether that s down to unrealistic scheduling or a tendency to ignore the warning signs in order to get on with the job. You ll find similarly worrying trends when we come to reversing, tailgating, motorway driving and parking up. I believe that we should all be vitally interested in the safety and well-being of the nation s van drivers at work beleaguered as they often are by white van man stereotypes. After all, van drivers are the everyday heroes of our economic recovery: they are the self-employed businesspeople who are driving growth; shift workers contributing to our current construction boom; and delivery drivers making the online retail revolution possible. Our report shows that in many respects, they are also professional, confident drivers who come out better than everyone else on things like speed, drink-driving and handling heavy traffic. The study does, however, raise the red flag on a range of areas where van drivers are a higher risk on the roads. We re now working with partner road safety bodies to develop recommendations on how best to address these areas of concern. In the meantime, the message we are sending to drivers is: take van driving lessons before you get behind the wheel of this highly specialised vehicle. Learn how it responds differently to a car and how stopping distances vary massively depending on your vehicle and load. And employers, take care of your drivers! Be aware that a driver s working day can quickly become dangerously long, especially when they re combining a long shift doing other work with very early starts and lengthy journeys home. About AXA Business Insurance AXA Business Insurance is part of AXA Insurance UK plc, which belongs to the AXA group of companies. With us, you choose the business insurance that s right for you. We offer public liability, employers liability and professional indemnity insurance online to start ups, sole traders, selfemployed people and small businesses. In addition we offer van insurance and landlord insurance. AXA Business Insurance also runs Business Guardian Angel which provides resources to help protect and grow small businesses. You can follow AXA Business Insurance on for business insurance help, for the latest business news. PAGE 1
3 Executive Summary This report looks at all reported injury collisions in Britain between 28 and 212 and compares trends for van drivers with all motor vehicles. Van is defined as a motor vehicle primarily designed for carriage of goods of 3.5 tonnes maximum gross weight and under, including car based vans. Van drivers are more likely to be in their early 4 s than any other age group, although the differences are quite slight, other than for very young drivers under the age of 25 and those aged 6 or over where numbers are low. Within the 25 to 54 age range we see that van drivers are crash-involved between 14 and 24% more than expected based on trends seen for all drivers of other vehicles. This is likely to reflect increased exposure on the road as they drive much greater distances than other drivers. Van drivers are more likely to come from lower-income households, with higher crash rates than those seen for drivers of other vehicles from similar backgrounds. Van drivers are more likely to crash on Primary roads (motorways and dual carriageways) than expected, and much less likely to be crash-involved on urban roads of all type. On all types of roads van drivers are likely to be much further away from home (5 miles as the crow flies) than drivers of other vehicles which heavily reflects their driving patterns. We can see that van drivers are less likely to be involved in crashes at junctions (except slip roads) than other drivers, especially roundabouts. As well as looking at the total number of crashes involving van drivers by region, we can also reflect on the over-representation based on other vehicles. This shows that in London, vans are crash-involved at a rate 22% higher than other vehicles, with the North East (18%) and West Midlands (13%) also showing increased crash rates. Unsurprisingly we see much greater crash-involvement rates on weekdays, although with a noticeable different trend on Fridays which is lower than Monday to Thursday. Van drivers are 14% more likely than drivers of other vehicles to be involved in a crash in the first four days of the working week. Monthly trends show little if any difference to all other drivers although hourly rates are significantly changed. Mornings (6am 12 noon) show crash-involvement rates over a third higher than other vehicles. Astonishing figures are reported for vehicle manoeuvres where vans are almost one and a half times more likely to be involved in a crash while reversing compared to all other vehicles. Contribution to collisions can also be analysed with different factors groups and reviewed separately compared to the trend for all other vehicles. This shows increased levels of close following, fatigue impairment, observation and manoeuvre errors. On the positive side van drivers are less likely to be reported as contributing to a crash by speeding, or drink and drug impairment. PAGE 2
4 Contents Introduction... 4 Scope... 4 Presentation of results... 4 Who are crash-involved van drivers?... 5 Where are van drivers involved in crashes?... 6 When are van drivers involved in crashes? How are van drivers involved in crashes? PAGE 3
5 INTRODUCTION Road Safety Analysis (RSA) was commissioned by AXA Business Insurance to analyse the circumstances of crashes involving van drivers. The research is primarily based on STATS19 collision data collected by police forces and reported to the Department for Transport, then supplied to RSA for inclusion in the web based analysis tool MAST Online. Scope The analysis focuses on drivers involved in injury collisions (as reported to the police) in Britain between 28 and 212. It compares trends for van drivers and the crashes in which they are involved with outcomes typical for all motor vehicle drivers involved in such incidents. Throughout this study, van is defined as a motor vehicle primarily designed for carriage of goods of 3.5 tonnes maximum gross weight and under, including car based vans. Presentation of results Since the principal objective of this research is to identify how road risk for van drivers compares to other road users, conclusions are generally communicated in terms of how much they differ. These differences are expressed numerically as 1 based indices, where a value of exactly 1 indicates van drivers at the same level as all drivers involved in collisions, while an index over 1 indicates a higher frequency than average and under 1 indicates a lower frequency. In order to provide context for these indices, absolute numbers of van drivers are also included. To provide a quantitative indication of over or under representation, absolute numbers are often compared with what would be expected if van drivers did not differ from the crash-involved driving population as a whole. Because it is acknowledged that police records of injury crashes are likely to be subject to a significant degree of under reporting, such numbers should always be understood as a sample rather than a total measure. Results are generally presented in a graphical format using column charts. In order to facilitate understanding and comparison, most charts follow a standard format in which certain chart elements are consistently used and presented in the same manner, as follows: Main title: which metric related to van driver collision involvement is being examined Horizontal axis: categories into which that metric is divided (selected to highlight important trends) 3-D bevelled columns: 1 based indices for van drivers compared to all motor vehicle drivers Solid columns: Actual recorded number of van drivers of the variety indicated by the colour Patterned columns: Expected number of van drivers of the variety indicated by the colour, if they had been distributed across the metric in exactly the same proportions as all recorded drivers PAGE 4

6 WHO ARE CRASH-INVOLVED VAN DRIVERS? This section explores who the van drivers involved in collisions are, in terms of socio-demographics. The first chart shows the annual average number of van drivers in each age group, compared to the expected annual average if van drivers shared the same age-distribution patterns as all drivers involved in collisions. It shows that van drivers involved in collisions are aged between 17 and 49 years old. However, when compared to all drivers, there are significantly fewer van drivers who are aged under 25 years old and who are involved in collisions. Instead, van drivers aged between 25 and 59 years old are all over-represented compared to all crash-involved drivers, with those between 35 and 54 years old particularly over-represented. There is an underrepresentation at 6 years and over, compared to all drivers. Overall, the age analysis suggests that van drivers are of working age. 2,4 Age of van drivers compared to all motor vehicle drivers Drivers of known age and gender (Average annual sample: 1,75 van drivers) 2, 1, , Under to 29 3 to to 39 4 to to 49 5 to to 59 6 and over 61 Actual annual average van drivers Expected annual van drivers (in proportion with all drivers) Frequency Index (1 = van drivers in same ratio as all drivers) The home postcodes of van drivers involved in collisions were analysed to gain an understanding of levels of deprivation amongst these drivers compared to all drivers. Home postcodes were recorded for three-quarters of the van drivers included in the dataset. Those with known residency were examined using the UK Index of Multiple Deprivation (IMD) values for each postcode. IMD uses a range of economic, social and housing data to create a single deprivation score for each small area of the country. In England and Wales, small areas are known as lower layer super output areas (LSOAs) whilst in Scotland, they are data zones. Each small area has an average population of 1,4 residents, enabling comparative analysis across the country. IMD analysis uses deciles, which create ten groups of equal frequency, ranging from the 1% most deprived areas to the 1% least deprived areas. It should be remembered that the indices of multiple deprivation include income, employment, health, education, access to services and living environment and are not merely about relative wealth. The following chart shows the results of the IMD analysis. The dashed orange shows the expected distribution of the number of annual average van drivers if crash involvement was equally spread across all the deciles. The chart shows that in the 1% to 4% least deprived deciles, van drivers are under-represented, so drivers from these areas are not as frequently involved in collisions as would be expected if they were represented at the same levels as all drivers. Instead, van drivers from the 5% to 2% most deprived deciles are over-represented, compared to all crash involved drivers. PAGE 5
7 Crash involved van driver deprivation by IMD compared to all motor vehicle drivers Drivers of known residency (Average annual sample: 9,735 van drivers) 1,2 1, Actual annual average van drivers Expected annual van drivers (in proportion with all drivers) Frequency Index (1 = van drivers in same ratio as all drivers) Expected distribution if crash involvement spread equally actross all deciles WHERE ARE VAN DRIVERS INVOLVED IN CRASHES? The places where van drivers were involved in collisions, compared to all drivers, were analysed to see if any interesting trends emerged Road categories on which vans are involved in crashes, compared to all motor vehicles Reported injury crashes (average annual sample: 13,32 vans) 119 Primary (motorways and dual carriageways) 17 Rural Main (single carriageway A and B) 13 Rural Minor (single carriageway unclassified) 95 Urban Main (single carriageway A and B) 87 Urban Minor (single carriageway unclassified) Actual vans reported each year, compared to expectation based on all vehicles Frequency Index (1 = vans in same ratio as all vehicles) Compared to all drivers, van drivers are over-represented on primary roads and slightly over-represented on rural main roads. This is slightly surprising as it might be expected that van drivers would spend a high percentage of their time on short urban journeys (as delivery drivers or tradesmen). The charts shows that each PAGE 6
8 year, 4 more van drivers are involved in collisions on primary roads (motorways and dual carriageways) than would be expected if their crash involvement patterns were the same as all drivers. Miles from home when involved in collision 28 to 212, by road category Van drivers compared to all motor vehicle drivers Van driver miles from home on Van driver miles from home overall All drivers miles from home on All drivers miles from home overall Urban Minor M and Dualled A Rural Main Urban Main Rural Minor Distance from home is calculated using crash location information and the home postcode of the related driver. It is an as the crow flies measure in miles. Absolute average distance from home values are often not very meaningful in themselves, especially over large sample sizes. The value of this measure lies principally in identifying and examining cases which differ significantly from relevant norms. For van drivers, distance from home was analysed against road type and road class and compared to all crash-involved drivers. The Department for Transport classifies roads as either rural or urban, where rural roads are located outside urban areas and have a population of less than 1, people. Urban roads are those that are located within urban areas with a population of 1, or more. For road class, there are three main categories: Motorway and dualled A roads; main roads which are A and B category roads; and minor roads, which are C and unclassified roads. When van drivers are involved in a collision, they tend to be further from home on motorways and dualled A roads and on rural main roads than on other road types (where the distance from home figures are below the van driver miles from home overall figure). This finding is shown in the chart above where for M and dualled A roads and for Rural Main roads, the distance from home is higher than the dashed dark blue line representing the van driver average distance from home. For the other road types, the distance from home is below the dashed average line. The higher distance from home on certain roads is interesting when considered in conjunction with their over-representation on these types of roads. Compared to all drivers, van drivers tend to be further from home on all road types. This is shown in the following chart where all road types have an index over 12. Van drivers are on average 5 miles further away from home on motorways and dualled A roads and 3.6 miles further on urban minor roads than all drivers. Overall, van drivers are on average 5 miles further from home on all road types at the time of their collision, compared to all crash-involved drivers. Whilst van drivers are involved in collisions on Urban Main and Urban Minor roads at lower than expected rates compared to all drivers, they have higher distances from home on these roads than other drivers, as indicated by the high indices of 162 and 172 for urban main and urban minor roads respectively. This might suggest that the urban roads on which van drivers are involved in crashes on are not local to them (in the way that they would be with other types of driver) and instead might reflect the business purposes they are using the van for. PAGE 7

9 Van drivers distance from home when collision involved, relative to motor vehicle drivers By road category (Average annual sample: 9,759 van drivers) All motor vehicle drivers average 11 miles from home; van drivers 16 miles from home M and Dualled A Rural Main Rural Minor Urban Main Urban Minor All Average miles from home compared to all motor vehicles Index (1 = same distance as all motor vehicle drivers on same category of road) Junction categories at which vans are involved in crashes, compared to all motor vehicles Reported injury crashes (average annual sample: 13,32 vans) No Junction Slip Give way / Stop Controlled Roundabout 83 Difference Index In addition to the road class, road type and distance from home, the junctions at the crash locations of van drivers can be analysed. Van drivers are slightly over-represented away from junctions, compared to all drivers, and are also slightly over-represented on slip roads. However, the numbers involved on slip roads is far less than those away from junctions (nearly 5,5 van drivers are involved in collisions away from junctions each year, compared to just over 2 van drivers on slip roads). This analysis shows that there are high numbers of all types of driver involved in collisions away from junctions, but for van drivers, their involvement away from junctions is slightly higher than expected. The slip road over-representation might reflect the types of road that they are over-represented on (such as motorways and dualled A roads). Lastly, it is worth noting that high numbers of PAGE 8
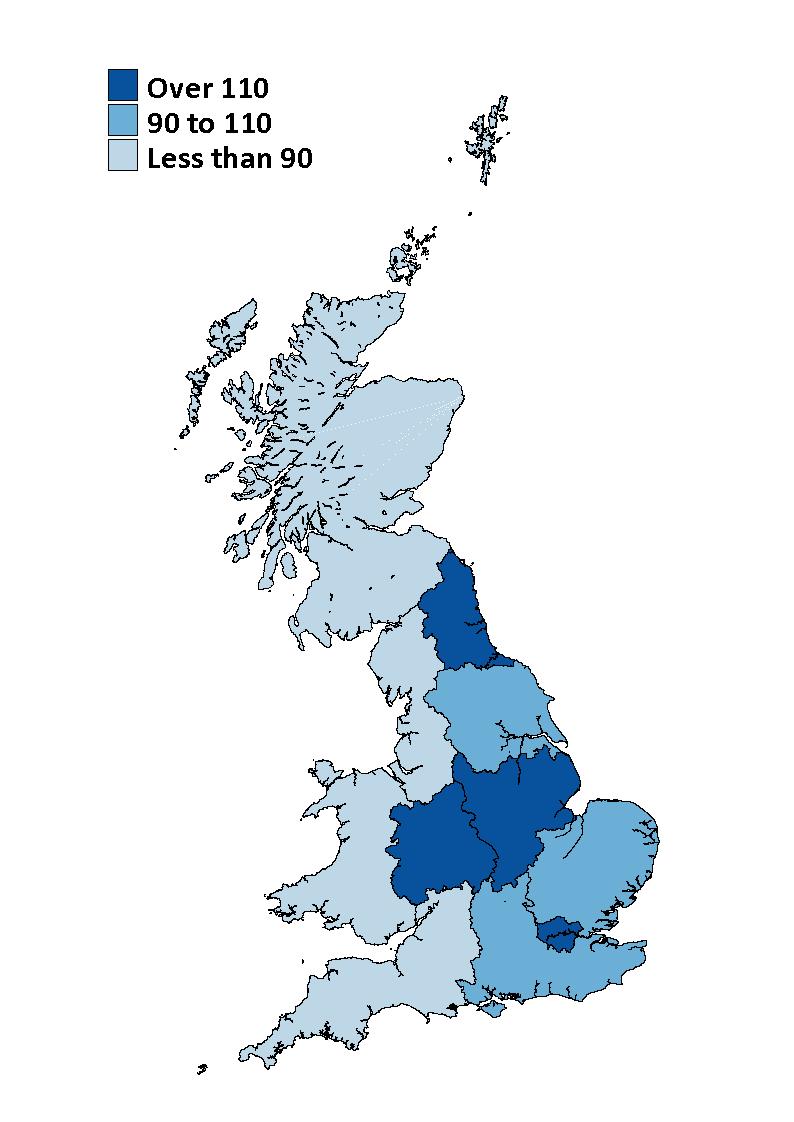
10 Average annual sample of reported crashes van drivers (approximately 5, a year) are involved in collisions at Give Way or Stop junctions but that this is lower than expected when compared to the crash involvement patterns of all drivers. 4, Regional locations of crashes involving van drivers, compared to all crashes Reported injury crashes (total average annual sample: 12,345 van crashes) 3,5 3, 2,5 2, 1,5 1, East East London Midlands North East North West South East South West West Yorkshire Scotland Midlands and Humber Wales Actual annual average van crashes Expected annual van driver crashes (in proportion with all crashes) Frequency index (1 = van driver crashes in same ratio as all crashes) The locations where van drivers were involved in collisions were analysed at a regional level. The regions used are those formerly covered by the Government Office regions of England. These areas are used because they are a convenient way to categorise parts of England on a regional basis, even though regional governmental offices as such no longer exist. The other countries of the UK are shown as a single region. The chart above shows that crashes involving van drivers in the East are exactly as expected when compared to the distribution of all crashes. In comparison, there are higher than expected annual average number of van driver crashes in the East Midlands, the North East, the West Midlands and especially in London. For the rest of the UK, there are lower than expected numbers of van driver crashes when compared to the distribution of all crashes. The thematic map overleaf shows the indices from the chart, where it is easy to see the over-representation of van driver crashes in London, the Midlands and the North East. It also shows that the west of England and Scotland and Wales are the regions which are under-represented. PAGE 9
11 PAGE 1
12 Average annual sample of reported involved drivers per diem WHEN ARE VAN DRIVERS INVOLVED IN CRASHES? The times when van drivers were involved in collisions were analysed to identify trends in day, time or month of year. Compared to all drivers, van drivers are unsurprisingly over-represented on weekdays, especially between Monday and Thursday (with an over-representation of 14%). Whilst on average each year 2,283 van drivers are involved in collisions on Fridays (which is similar to the average number on Mondays to Thursdays), this is not as over-represented compared to all drivers. This suggests that overall, all types of driver have high crash involvement on Fridays. Van drivers are involved in collisions at the weekends less often than expected if they crashed at the same frequency as all drivers. The day of week analysis appears to reflect that many van drivers will be travelling for work purposes. 2,5 Days of week when van drivers are involved in collisions, compared to all motor vehicles Reported injury crashes (total average annual sample for all van drivers: 13,32) 2, 1, , 5 Mon to Thurs Fri Sat and Sun 61 Actual annual van drivers per diem Expected annual van drivers per diem (in proportion with all drivers) Frequency Index (1 = van drivers in same ratio as all drivers) The month of year analysis produced indices of close to 1 across all four quarters of the year. This shows that van drivers are involved in collisions throughout the year at similar frequencies to all drivers. The overall highest numbers of van drivers involved in collisions were seen in July to September (with an average of 3,364 a year) and October to December (with an average of 3,396 a year). The time of day analysis (shown overleaf) also reflects the working nature of van drivers. Van drivers are overrepresented in collisions by over 3%, compared to all drivers, between 6am and noon. Whilst the highest numbers of van drivers are involved in collisions between 3pm and 6pm (3,13 on average annually), the numbers involved are slightly lower than expected if they were involved in collisions at the same frequency as all drivers. Van drivers feature in collisions less often than expected, compared to all drivers between 6pm and 3am. PAGE 11
 4, 3,5 3, 2,5 2, 11 11 1,5 1, 5 98 99 Jan-Mar Apr-Jun Jul-Sep Oct-Dec Actual annual van drivers per diem Expected annual")
13 Average annual sample of reported involved drivers Average annual sample of reported involved drivers Months of year when van drivers are involved in collisions, compared to all motor vehicles Reported injury crashes (total average annual sample: 13,32 vehicles) 4, 3,5 3, 2,5 2, ,5 1, Jan-Mar Apr-Jun Jul-Sep Oct-Dec Actual annual van drivers per diem Expected annual van drivers per diem (in proportion with all drivers) Frequency Index (1 = van drivers in same ratio as all drivers) Times of day when van drivers are involved in collisions, compared to all motor vehicles Reported injury crashes (total average annual sample: 13,32 vehicles) 4, 3,5 3, , , 1,5 95 1, Midnight to 3 AM 3 AM to 6 AM 6 AM to 9 AM 9 AM to Noon Noon to 3 PM 3 PM to 6 PM 6 PM to 9 PM 5 9 PM to Midnight PAGE 12

14 HOW ARE VAN DRIVERS INVOLVED IN CRASHES? Analysis of the manoeuvres of van drivers produces some interesting results. More van drivers than expected were involved in collisions when reversing or parked, compared to all drivers. Van drivers are also over-represented with U turns and changing lanes compared to all drivers, although the actual additional numbers compared to expectations are small. There are, on average annually, 47 van drivers who were reversing and 744 who were parked at the time of their collision. There are also 1,629 each year who were stopping or starting at the time of their collision and a further 1,29 who were turning right but these are both at similar frequencies to all crash-involved drivers. There are over 5,5 van drivers each year who were travelling straight ahead at the time of their collision, however, this is slightly lower than expected, given how often all drivers were travelling straight ahead. +35 Manoeuvres by crash involved van drivers, compared to all motor vehicle drivers Reported injury crashes (Average annual sample: 13,32 van drivers) Actual vans reported each year, compared to expectation based on all vehicles Index (1 = vans in same ratio as all vehicles) It is possible to analyse the contributory factors (CFs) recorded by a police officer when they completed the collisions records. The following analysis only looks at collisions investigated at the scene by an officer and even then, it needs to be remembered that these factors reflect the officer s opinion at the time of reporting and might not be the result of extensive investigation. For analytical purposes, contributory factors have been grouped into four themed groups and 13 subcategories, as shown in the table overleaf. The chart overleaf shows the crash contributions attributed to van drivers, compared to all drivers, ordered by indices. Van drivers are over-represented, compared to all drivers, as being assigned Close Following, Fatigue Impairment and Observation Error contributory factors. There are, on average, 64 van drivers who are thought to have contributed to their collision through close following each year. There were just over 1 each year who were thought to have contributed through fatigue. Road users of all types are most likely to be attributed Observation Error contributory factors, reflected in the annual average of 4,289 van drivers. Despite all road users being regularly assigned these contributory factors, there were nearly 6 more van drivers than expected assigned these CFs each year. At the other end of the scale, van drivers are particularly under-represented, compared to all drivers, in being assigned Nervous Behaviour contributory factors. This would suggest that they drive in a confident manner and are not inexperienced drivers. Other areas where van drivers are under-represented, compared to all PAGE 13

15 drivers, are in the assignment of contributory factors related to control errors, substance impairment, speed choices and junction errors. Injudicious Action Driver Errors or Driver Impairment or Driver Behaviour or Reactions Distraction Inexperience Traffic Contraventions Manoeuvre Errors Substance Impairments Nervous Behaviour Disobeyed automatic Poor turn or manoeuvre Impaired by alcohol Nervous, uncertain or traffic signal panic Disobeyed double white Failed to signal or Impaired by drugs (illicit Learner or inexperienced lines misleading signal or medicinal) driver/rider Disobeyed Give way or Stop signs or markings Inexperience of driving on the left Passing too close to cyclist, horse rider or pedestrian Disobeyed pedestrian crossing facility Illegal turn or direction of travel Speed Choices Control Errors Distraction Unsafe Behaviour Exceeding speed limit Sudden braking Driver using mobile Aggressive driving phone Travelling too fast for conditions Unfamiliar with model of vehicle Swerved Distraction in vehicle Careless, reckless or in a hurry Loss of control Distraction outside vehicle Close Following Observation Error Health Impairments Following too close Failed to look properly Uncorrected, defective eyesight Failed to judge other person s path or speed Junction Errors Junction overshoot Junction restart (moving off at junction) Illness or disability, mental or physical Fatigue Impairment Fatigue Crash contributions attributed to van drivers compared to all motor vehicle drivers Police attended injury crashes (Average annual sample: 1,532 van drivers) Actual vans reported each year, compared to expectation based on all vehicles Index (1 = vans in same ratio as all vehicles) PAGE 14


16 The following charts look at the over-represented contributory factors of observation errors, manoeuvre errors and close following against the manoeuvre the van driver was making at the time. Each chart shows two indices one for van drivers and one for all motor vehicles, as a comparison. Crash contributions attributed to observation error - by driver manoeuvre Police attended injury crashes (Average annual sample: 3,456 van drivers) Going Ahead Starting or Stopping Waiting Overtaking Changing Lane Turning Reverse / U- turn Vans index All motor vehicles index Crash contributions attributed to manoeuvre error - by driver manoeuvre Police attended injury crashes (Average annual sample: 1,131 van drivers) Overtaking Left turn Ahead Starting or Straight stopping Right turn Bend Lane Change Reversing U turn Vans index All motor vehicles index Van drivers were more likely than all drivers to be assigned observation error contributory factors. When looking at these contributory factors against vehicle manoeuvre, it can be seen that van drivers follow a similar pattern to all drivers regarding when these contributory factors were attributed: both categories of driver were more likely to be assigned these CFs when changing lane, turning, or reversing/performing a U Turn. Van drivers and PAGE 15

17 all drivers were less likely to be attributed these contributory factors when going ahead or waiting. It shows that observation errors are most likely to occur when drivers are performing a manoeuvre as opposed to just generally driving. Similarly, manoeuvre error contributory factor by driver manoeuvre analysis shows that van drivers and all drivers undertake comparable behaviour. Both categories of driver were assigned manoeuvre error contributory factors when overtaking, performing a left or right turn, a lane change and especially a U turn at similar rates. It should be remembered that whilst van drivers were over-represented overall as crashing whilst performing a U-turn, there were only 142 van drivers each year who were involved in a collision whilst performing this manoeuvre. 25 Crash contributions attributed to close following - by driver manoeuvre Police attended injury crashes (Average annual sample: 624 van drivers) Only shows manoeuvre types of moving vehicles reported at least once per week on average Going Ahead Stopping Overtaking Vans index All motor vehicles index Van drivers and all drivers were most likely to be assigned the close following contributory factor when stopping. Van drivers were slightly more over-represented with this CF when going ahead. Combined with the observation error factors, it would suggest that van drivers need to be more aware of the stopping distances required for their type of vehicle, given its size and weight, and ensure that they leave sufficient time and space in order to react. As seen earlier, van drivers are over-represented on primary roads; tend to be further from home at the time of their collision; and are often tired. The combination of these elements, with the close following, observation and manoeuvre errors, reveal the unique circumstances of their crashes. PAGE 16
NEWS RELEASE. GB Drink Drive Trends Revealed. From Release Reference Date
 NEWS RELEASE From Release Reference Date Richard Owen Under embargo until 0000 Wednesday 16 th December GB Drink Drive Trends 2015 Tuesday, 15 th December 2015 GB Drink Drive Trends Revealed New study
Produced by: Destination Research Sergi Jarques, Director
 Produced by: Destination Research Sergi Jarques, Director Economic Impact of Tourism Oxfordshire - 2016 Economic Impact of Tourism Headline Figures Oxfordshire - 2016 number of trips (day & staying) 27,592,106
PEMBROKESHIRE & CORNWALL VISITOR SURVEYS 2011/12 COMPARING THE DESTINATIONS. February 2013
 PEMBROKESHIRE & CORNWALL VISITOR SURVEYS 2011/12 COMPARING THE DESTINATIONS February 2013 Prepared for: Visit / Destination Pembrokeshire Partnership Client Contact: Emma Rojano/ Mark Horner TERMS OF CONTRACT
Produced by: Destination Research Sergi Jarques, Director
 Produced by: Destination Research Sergi Jarques, Director Economic Impact of Tourism North Norfolk District - 2016 Contents Page Summary Results 2 Contextual analysis 4 Volume of Tourism 7 Staying Visitors
Produced by: Destination Research Sergi Jarques, Director
 Produced by: Destination Research Sergi Jarques, Director Economic Impact of Tourism Norfolk - 2016 Contents Page Summary Results 2 Contextual analysis 4 Volume of Tourism 7 Staying Visitors - Accommodation
Produced by: Destination Research Sergi Jarques, Director
 Produced by: Destination Research Sergi Jarques, Director Economic Impact of Tourism Epping Forest - 2014 Economic Impact of Tourism Headline Figures Epping Forest - 2014 Total number of trips (day & staying)
Produced by: Destination Research Sergi Jarques, Director
 Produced by: Destination Research Sergi Jarques, Director Economic Impact of Tourism Norfolk - 2017 Contents Page Summary Results 2 Contextual analysis 4 Volume of Tourism 7 Staying Visitors - Accommodation
Produced by: Destination Research Sergi Jarques, Director
 Produced by: Destination Research Sergi Jarques, Director Economic Impact of Tourism Oxfordshire - 2015 Economic Impact of Tourism Headline Figures Oxfordshire - 2015 Total number of trips (day & staying)
LSOA IMD Rank (1= most deprived)
") The Indices of Deprivation 2015 provide a set of relative measures of deprivation for small areas (Lower-layer Super Output Areas*) across England, based on seven domains of deprivation. The domains were
The Indices of Deprivation 2015 provide a set of relative measures of deprivation for small areas (Lower-layer Super Output Areas*) across England, based on seven domains of deprivation. The domains were
Regional Spread of Inbound Tourism. VisitBritain Research, August 2018
 Regional Spread of Inbound Tourism VisitBritain Research, August 218 1 Contents Introduction Summary Key metrics by UK area Analysis by UK area Summary of growth by UK area Scotland Wales North East North
The Economic Impact of Tourism Brighton & Hove Prepared by: Tourism South East Research Unit 40 Chamberlayne Road Eastleigh Hampshire SO50 5JH
 The Economic Impact of Tourism Brighton & Hove 2013 Prepared by: Tourism South East Research Unit 40 Chamberlayne Road Eastleigh Hampshire SO50 5JH CONTENTS 1. Summary of Results 1 1.1 Introduction 1 1.2
Construction Industry Focus Survey. Sample
 Construction Industry Focus Survey 1 CONTENTS Executive Summary 1 1. Leading Activity Indicator 2 2. Activity by sector and constraints Residential, Non-residential, Civil Engineering 3. Orders and Tenders
The Economic Impact of Tourism on Calderdale Prepared by: Tourism South East Research Unit 40 Chamberlayne Road Eastleigh Hampshire SO50 5JH
 The Economic Impact of Tourism on Calderdale 2015 Prepared by: Tourism South East Research Unit 40 Chamberlayne Road Eastleigh Hampshire SO50 5JH CONTENTS 1. Summary of Results 1 2. Table of Results Table
HEATHROW COMMUNITY NOISE FORUM
 HEATHROW COMMUNITY NOISE FORUM 3Villages flight path analysis report January 216 1 Contents 1. Executive summary 2. Introduction 3. Evolution of traffic from 25 to 215 4. Easterly departures 5. Westerly
OFFERING THE UK A LIFELINE
 OFFERING THE UK A LIFELINE R oad markings are the most cost-effective safety device available to road engineers. Markings guide road users, provide advance warning of potential dangers ahead and create
Tourism to the Regions of Wales 2008
 Tourism to the Regions of Wales 28 Key Facts on UK Domestic Tourism North Wales North Wales accounts for 37% of all trips and 35% of all spend in Wales 87% of visits to North Wales are for holiday purposes
Economic Impact of Tourism. Hertfordshire Results. Commissioned by: Visit Herts. Produced by:
 Commissioned by: Visit Herts Produced by: Destination Research www.destinationresearch.co.uk December 2016 Contents Page Introduction and Contextual Analysis 3 Headline Figures 5 Volume of Tourism 7 Staying
APPENDIX 8. Leeds Socio-Economic Baseline Report. Report. July Metro and Leeds City Council
 APPENDIX 8 Leeds Socio-Economic Baseline Report Report July 2009 Prepared for: Prepared by: Metro and Leeds City Council Steer Davies Gleave West Riding House 67 Albion Street Leeds LS1 5AA +44 (0)113
The Economic Impact of Tourism on Scarborough District 2014
 The Economic Impact of Tourism on Scarborough District 2014 Prepared by: Tourism South East Research Unit 40 Chamberlayne Road Eastleigh Hampshire SO50 5JH CONTENTS 1. Summary of Results 1 2. Table of
Safety Culture in European aviation - A view from the cockpit -
 LSE STUDY SUMMARY Safety Culture in European aviation - A view from the cockpit - In 2016, the London School of Economics and Political Science (LSE) carried out a study on European pilots safety culture
Commissioned by: Economic Impact of Tourism. Stevenage Results. Produced by: Destination Research
 Commissioned by: Produced by: Destination Research www.destinationresearch.co.uk December 2016 Contents Page Introduction and Contextual Analysis 3 Headline Figures 5 Volume of Tourism 7 Staying Visitors
Perth & Kinross Council. Community Planning Partnership Report June 2016
 Perth & Kinross Council Community Planning Partnership Report June 2016 Contents Foreword... 3 Section 1: Spring 2016 destination follow up of 2014/15 school leavers... 4 Background... 4 Section A: Initial
CONGESTION MONITORING THE NEW ZEALAND EXPERIENCE. By Mike Curran, Manager Strategic Policy, Transit New Zealand
 CONGESTION MONITORING THE NEW ZEALAND EXPERIENCE 26 th Australasian Transport Research Forum Wellington New Zealand 1-3 October 2003 By, Manager Strategic Policy, Transit New Zealand Abstract New Zealand
Tourism Business Monitor Accommodation Report. Wave 2 Post-Easter holidays
 Tourism Business Monitor 2017 Accommodation Report Wave 2 Post-Easter holidays Contents Background Key Findings Business Dashboards Visitor Profile Business Performance Workforce Business Confidence 2
National Rail Performance Report - Quarter /14
 A London TravelWatch report The voice of transport users National Rail Performance Report - July 2014 London TravelWatch is the official body set up by Parliament to provide a voice for London s travelling
Isles of Scilly Visitor Survey Final report. Produced for and on behalf of the Islands Partnership. May 2017
 Isles of Scilly Visitor Survey 2016 Final report Produced for and on behalf of the Islands Partnership by The South West Research Company Ltd. May 2017 Contents Page Summary 3 6 Introduction 7 10 Visitor
Saighton Camp, Chester. Technical Note: Impact of Boughton Heath S278 Works upon the operation of the Local Highway Network
 Technical Note: Impact of Boughton Heath S278 Works July 2013 SAIGHTON CAMP CHESTER COMMERCIAL ESTATES GROUP TECHNICAL NOTE: IMPACT OF BOUGHTON HEATH S278 WORKS UPON THE OPERATION OF THE LOCAL HIGHWAY
The performance of Scotland s high growth companies
 The performance of Scotland s high growth companies Viktoria Bachtler Fraser of Allander Institute Abstract The process of establishing and growing a strong business base is an important hallmark of any
REPORT. VisitEngland Business Confidence Monitor Wave 5 Autumn
 REPORT VisitEngland Business Confidence Monitor 2011 5-7 Museum Place Cardiff, Wales CF10 3BD Tel: ++44 (0)29 2030 3100 Fax: ++44 (0)29 2023 6556 www.strategic-marketing.co.uk Page 2 of 31 Contents Page
Economic Impact of Tourism. Cambridgeshire 2010 Results
 Economic Impact of Tourism Cambridgeshire 2010 Results Produced by: Tourism South East Research Department 40 Chamberlayne Road, Eastleigh, Hampshire, SO50 5JH sjarques@tourismse.com http://www.tourismsoutheast.com
Tram Passenger Survey
 Key findings Autumn 2015 Foreword Jeff Halliwell Now in its third year, our Tram Passenger Survey has covered passengers views of their journey in six network areas in Britain. For the second time this
Latest Tourism Trends. Humphrey Walwyn Head of VisitEngland Research
 Latest Tourism Trends Humphrey Walwyn Head of VisitEngland Research 1 Inbound Tourism 2 2003 2004 2005 2006 2007 2008 2009 2010 2011 2012 2013 2014 2015 2016 2017 UK inbound long term trend Spend per visit
Visit Wales Research Update
 Visit Wales Research Update 19 January 21 This update summarises tourism performance by drawing upon Visit Wales own research and information from other relevant sources. It is based upon information available
State of the States October 2017 State & territory economic performance report. Executive Summary
 State of the States October 2017 State & territory economic performance report. Executive Summary NSW ON TOP; VICTORIA CLOSES IN How are Australia s states and territories performing? Each quarter CommSec
IATA ECONOMICS BRIEFING AIRLINE BUSINESS CONFIDENCE INDEX OCTOBER 2010 SURVEY
 IATA ECONOMICS BRIEFING AIRLINE BUSINESS CONFIDENCE INDEX OCTOBER SURVEY KEY POINTS Results from IATA s quarterly survey conducted in October show business conditions continued to improve during the third
East Lothian. Skills Assessment January SDS-1154-Jan16
 East Lothian Skills Assessment January 2016 SDS-1154-Jan16 Acknowledgement The Regional Skills Assessment Steering Group (Skills Development Scotland, Scottish Enterprise, the Scottish Funding Council
Self Catering Holidays in England Economic Impact 2015
 Self Catering Holidays in England Economic Impact 2015 An overview of the economic impact of self catering holidays in England Published by The South West Research Company Ltd March 2017 Contents Page
UK household giving new results on regional trends
 CGAP Briefing Note 6 UK household giving new results on regional trends 01 08 July 10 Tom McKenzie and Cathy Pharoah In a climate of growing political emphasis on charitable activity at local levels, this
Juneau Household Waterfront Opinion Survey
 Juneau Household Waterfront Opinion Survey Prepared for: City and Borough of Juneau Prepared by: April 13, 2004 TABLE OF CONTENTS Executive Summary...1 Introduction and Methodology...6 Survey Results...7
BUSINESS BAROMETER December 2018
 Credit: Chris Orange BUSINESS BAROMETER December Credit: Nigel Moore 1 Contents Summary of findings 3 Annual monthly performance: visitor attractions..4 Visit Herts Team update 5 National context.8 Visitor
Existing Services, Ridership, and Standards Report. June 2018
 Existing Services, Ridership, and Standards Report June 2018 Prepared for: Prepared by: Contents Overview of Existing Conditions... 1 Fixed Route Service... 1 Mobility Bus... 34 Market Analysis... 41 Identification/Description
Commissioned by: Visit Kent. Economic Impact of Tourism. Canterbury Results. Produced by: Destination Research
 Commissioned by: Visit Kent Produced by: Destination Research www.destinationresearch.co.uk November 2016 Contents Page Introduction and Contextual Analysis 3 Headline Figures 6 Volume of Tourism 8 Staying
North Lanarkshire. Skills Assessment January SDS-1163-Jan16
 North Lanarkshire Skills Assessment January 2016 SDS-1163-Jan16 Acknowledgement The Regional Skills Assessment Steering Group (Skills Development Scotland, Scottish Enterprise, the Scottish Funding Council
Merseyside & Cheshire Local Authority Profile
 Injury Surveillance in the North West of England Merseyside & Cheshire Local Authority Profile St Helens Road Traffic Collisions April 2012 to March 2015 February 2016 Jennifer Germain, Simon Russell and
Community Rail Partnership Action Plan The Bishop Line Survey of Rail Users and Non-Users August 2011 Report of Findings
 Community Rail Partnership Action Plan The Bishop Line Survey of Rail Users and Non-Users August 2011 Report of Findings Analysis and report NWA Social Research 1 Contents Page No. A. Summary of Main Findings...
Performance monitoring report for 2014/15
 Performance monitoring report for 20/15 Date of issue: August 2015 Gatwick Airport Limited Summary Gatwick Airport is performing well for passengers and airlines, and in many aspects is ahead of the performance
National Passenger Survey Spring putting rail passengers first
 National Passenger Survey putting rail passengers first What is Passenger Focus? Passenger Focus is the independent national rail consumer watchdog. Our mission is to get the best deal for Britain s rail
NETWORK MANAGER - SISG SAFETY STUDY
 NETWORK MANAGER - SISG SAFETY STUDY "Runway Incursion Serious Incidents & Accidents - SAFMAP analysis of - data sample" Edition Number Edition Validity Date :. : APRIL 7 Runway Incursion Serious Incidents
Shortest Response Times Longest Response Times 0:03:14 0:42:55 0:04:23 0:44:11 0:04:35 2:00:04
 1) Please provide, for the period between 1 January 2017 and 31 August 2017, the number of calls to 999 in your area for requests regarding events relating to what is understood to fall under the term
2013 IRVING HOTEL GUEST SURVEY Final Project Report
 2013 IRVING HOTEL GUEST SURVEY Final Project Report Research prepared for the Irving Convention & Visitors Bureau by Destination Analysts, Inc. Table of Contents SECTION 1 Introduction 2 SECTION 2 Executive
National Rail Passenger Survey: User Guidance Report. Autumn 2013 (wave 29)
") National Rail Passenger Survey: User Guidance Report Autumn 2013 (wave 29) Rebecca Joyner Research Director Tel: 020 7490 9148 rebecca.joyner@bdrc continental.com Contents Page No. 1. Background... 1 2.
National Rail Passenger Survey: User Guidance Report Autumn 2013 (wave 29) Rebecca Joyner Research Director Tel: 020 7490 9148 rebecca.joyner@bdrc continental.com Contents Page No. 1. Background... 1 2.
Economic Impact of Tourism. Norfolk
 Economic Impact of Tourism Norfolk - 2009 Produced by: East of England Tourism Dettingen House Dettingen Way, Bury St Edmunds Suffolk IP33 3TU Tel. 01284 727480 Contextual analysis Regional Economic Trends
Appendix A: Summary of findings drawn from an analysis of responses to the questionnaire issued to all households in Trimley St Martin
 Transport and Works Act 1992 The Network Rail (Felixstowe Branch Line Improvements Level Crossing Closure) Order Trimley St Martin Parish Council Statement of Case The statement of Case of the Parish Council
Understanding Business Visits
 Understanding Business Visits Foresight issue 153 VisitBritain Research 1 Contents Introduction Summary and Highlights Business Visits in Context UK Business visits and spend Averages Duration of stay
Crash and Behavioral Characteristics, and Health Outcomes, Associated with Vehicular Crashes by Tourists in Wisconsin,
 Crash and Behavioral Characteristics, and Health Outcomes, Associated with Vehicular Crashes by Tourists in Wisconsin, 1992-1996 Wayne Bigelow, M.S. Center for Health Systems Research & Analysis University
The Future of Street Lighting in Leeds November 2017 to January 2018 Public Consultation Document
 The Future of Street Lighting in Leeds November 2017 to January 2018 Public Consultation Document Should we turn off more street lights between midnight and 5:30 am? If so, how should we decide which ones
Estimates of the Economic Importance of Tourism
 Estimates of the Economic Importance of Tourism 2008-2013 Coverage: UK Date: 03 December 2014 Geographical Area: UK Theme: People and Places Theme: Economy Theme: Travel and Transport Key Points This article
Civil Aviation Authority:
 Civil Aviation Authority: UK Aviation Consumer Survey August 2018 CONTENTS Background and method Headline measures Flying behaviour Recent experience Travel disruption Disability Key driver analysis Public
Chapter 1: The Population of NHS Greater Glasgow and Clyde
 Population Estimate (thousands) Chapter 1: The Population of NHS Greater Glasgow and Clyde Population Trends and Projections National Records of Scotland estimated (NRS SAPE) 1 the 2013 NHS Greater Glasgow
Insight Department: Scotland The key facts on tourism in 2016
 Insight Department: Scotland The key facts on tourism in 2016 September 2017 Executive Summary & Background Information In 2016 just under 14.5 million overnight tourism trips were undertaken in Scotland.
East West Rail Consortium
 East West Rail Consortium EWR Wider Economic Case: Refresh 18 th November 2015 Rupert Dyer Rail Expertise Ltd Rail Expertise Ltd. Tel: 01543 493533 Email: info@railexpertise.co.uk 1 Introduction 1.1 The
Youth/Backpacker Visitation to the Northern Territory. Year ending June 2017
 Youth/Backpacker Visitation to the Northern Territory Year ending June 2017 2 The following is a summary of information relevant to the Northern Territory tourism industry using visitation results from
Sound Transit Operations August 2015 Service Performance Report. Ridership
 Ridership Total Boardings by Mode Mode Aug-14 Aug-15 % YTD-14 YTD-15 % ST Express 1,534,241 1,553,492 1.3% 11,742,839 12,354,957 5.2% Sounder 275,403 326,015 18.4% 2,139,086 2,463,422 15.2% Tacoma Link
Oct-17 Nov-17. Sep-17. Travel is expected to grow over the coming 6 months; at a slightly faster rate
 Analysis provided by TRAVEL TRENDS INDEX SEPTEMBER 2018 CTI reading of.8 in September 2018 indicates that travel to or within the U.S. grew 1.6% in September 2018 compared to September 2017. LTI predicts
A TRANSPORT SYSTEM CONNECTING PEOPLE TO PLACES
 THE MAYOR'S VISION FOR TRANSPORT A TRANSPORT SYSTEM CONNECTING PEOPLE TO PLACES VISION We will build a transport system that works for everyone, connecting people to the places they want to go within the
NOT FOR BROADCAST OR PUBLICATION BEFORE 00:01, TUESDAY 1 MARCH 2016
 PRESS RELEASE NOT FOR BROADCAST OR PUBLICATION BEFORE 00:01, TUESDAY 1 MARCH 2016 The Bank of Scotland Rural Quality of Life Survey tracks where living standards are highest in Great Britain by ranking
Isles of Scilly Online Visitor Survey Final report. Produced for and on behalf of the Islands Partnership. May 2016
 Isles of Scilly Online Visitor Survey 2015 Final report Produced for and on behalf of the Islands Partnership by The South West Research Company Ltd. May 2016 Contents Page Summary 3 Introduction 7 Visitor
Passenger Traffic Achieves Strong Growth of 4.8% for the Month of August
 Passenger Traffic Achieves Strong Growth of 4.8% for the Month of August Montréal, 7 October Passenger traffic experienced a slight surge in growth to almost +5% for August compared to previous months
Predicting Flight Delays Using Data Mining Techniques
 Todd Keech CSC 600 Project Report Background Predicting Flight Delays Using Data Mining Techniques According to the FAA, air carriers operating in the US in 2012 carried 837.2 million passengers and the
SURVEY OF U3A MEMBERS (PART 1)
") SURVEY OF U3A MEMBERS (PART 1) Introduction To provide a satisfactory service to its member U3As, The Third Age Trust recognised that it needs to be aware of the diversity of individual U3A members and
SURVEY OF U3A MEMBERS (PART 1) Introduction To provide a satisfactory service to its member U3As, The Third Age Trust recognised that it needs to be aware of the diversity of individual U3A members and
The Economic Impact of Tourism on Oxfordshire Estimates for 2013
 The Economic Impact of Tourism on Oxfordshire Estimates for 2013 County and District Results September 2014 Prepared by: Tourism South East Research Unit 40 Chamberlayne Road Eastleigh Hampshire SO50 5JH
National Rail Passenger Survey: User Guidance Report. Spring 2014 (wave 30)
") National Rail Passenger Survey: User Guidance Report Spring 2014 (wave 30) Rebecca Joyner Director Tel: 020 7490 9148 rebecca.joyner@bdrc continental.com Contents Page No. 1. Background... 1 2. Summary
National Rail Passenger Survey: User Guidance Report Spring 2014 (wave 30) Rebecca Joyner Director Tel: 020 7490 9148 rebecca.joyner@bdrc continental.com Contents Page No. 1. Background... 1 2. Summary
Tram Passenger Survey (TPS) All networks
 All networks") Tram Passenger Survey (TPS) All networks Rosie Giles Tel: Email: Rosie.Giles@transportfocus.org.uk results March Insight Team, Transport Focus, Fleetbank House, - Salisbury Square, London, ECY JX Contents
Tram Passenger Survey (TPS) All networks Rosie Giles Tel: Email: Rosie.Giles@transportfocus.org.uk results March Insight Team, Transport Focus, Fleetbank House, - Salisbury Square, London, ECY JX Contents
JATA Market Research Study Passenger Survey Results
 JATA Market Research Study Passenger Survey Results Prepared for the Jackson Area Transportation Authority (JATA) April, 2015 3131 South Dixie Hwy. Suite 545 Dayton, OH 45439 937.299.5007 www.rlsandassoc.com
The Economic Impact of Tourism on the District of Thanet 2011
 The Economic Impact of Tourism on the District of Thanet 2011 Prepared by: Tourism South East Research Unit 40 Chamberlayne Road Eastleigh Hampshire SO50 5JH CONTENTS 1. Summary of Results 1 2. Table of
CEREDIGION VISITOR SURVEY 2011 TOTAL SAMPLE. November 2011
 CEREDIGION VISITOR SURVEY 2011 TOTAL SAMPLE November 2011 TERMS OF CONTRACT Unless otherwise agreed, the findings of this study remain the copyright of Beaufort Research Ltd and may not be quoted, published
National Rail Passenger Survey: User Guidance Report
 National Rail Passenger Survey: User Guidance Report Spring 2015 (Wave 32) Rebecca Joyner Director Tel: 020 7490 9148 rebecca.joyner@bdrc continental.com Contents Page No. 1. Background... 1 2. Summary
2017/ Q1 Performance Measures Report
 2017/2018 - Q1 Performance Measures Report Contents Ridership & Revenue... 1 Historical Revenue & Ridership... 1 Revenue Actual vs. Planned... 3 Mean Distance Between Failures... 5 Maintenance Cost Quarter
PERFORMANCE REPORT NOVEMBER 2017
 PERFORMANCE REPORT NOVEMBER 2017 Note: New FY2018 Goal/Target/Min or Max incorporated in the Fixed Route and Connection Dashboards. Keith A. Clinkscale Performance Manager INTRODUCTION/BACKGROUND In June
National Rail Passenger Survey Autumn 2013 Main Report
 National Rail Passenger Survey Autumn 2013 Main Report What is Passenger Focus? Passenger Focus is the independent consumer watchdog for Britain s rail passengers and England s bus, coach and tram passengers
West Somerset 2015 Local data version
 West Somerset 2015 Local data version Introduction This report examines the volume and value of tourism and the impact of visitor expenditure on the local economy in West Somerset and Somerset county in
PERFORMANCE REPORT DECEMBER 2017
 PERFORMANCE REPORT DECEMBER 2017 Note: New FY2018 Goal/Target/Min or Max incorporated in the Fixed Route and Connection Dashboards. Keith A. Clinkscale Performance Manager INTRODUCTION/BACKGROUND Keith
Regional Spread of Inbound Tourism
 Regional Spread of Inbound Tourism Foresight issue 164 VisitBritain Research, January 2019 1 Contents Introduction Summary Key metrics by UK area Analysis by UK area Summary of growth by UK area Scotland
NOISE AND FLIGHT PATH MONITORING SYSTEM BRISBANE QUARTERLY REPORT JULY - SEPTEMBER 2011
 NOISE AND FLIGHT PATH MONITORING SYSTEM BRISBANE QUARTERLY REPORT JULY - SEPTEMBER 211 Date Version Comments Page 2 Foreword Airservices Australia has established a Noise and Flight Path Monitoring System
The Economic Impact of Tourism Brighton & Hove Prepared by: Tourism South East Research Unit 40 Chamberlayne Road Eastleigh Hampshire SO50 5JH
 The Economic Impact of Tourism Brighton & Hove 2014 Prepared by: Tourism South East Research Unit 40 Chamberlayne Road Eastleigh Hampshire SO50 5JH CONTENTS 1. Summary of Results 1 1.1 Introduction 1 1.2
NOISE AND FLIGHT PATH MONITORING SYSTEM BRISBANE QUARTERLY REPORT OCTOBER - DECEMBER 2013
 NOISE AND FLIGHT PATH MONITORING SYSTEM BRISBANE QUARTERLY REPORT OCTOBER - DECEMBER 213 Date Version Comments Page 2 Foreword Airservices Australia has established a Noise and Flight Path Monitoring System
The Economic Impact of Poole s Visitor Economy 2015
 The Economic Impact of Poole s Visitor Economy 2015 Produced By The South West Research Company Ltd October 2016 Contents Page Introduction 3 Poole data 4 Dorset data 17 Introduction This report examines
SAMTRANS TITLE VI STANDARDS AND POLICIES
 SAMTRANS TITLE VI STANDARDS AND POLICIES Adopted March 13, 2013 Federal Title VI requirements of the Civil Rights Act of 1964 were recently updated by the Federal Transit Administration (FTA) and now require
2017/2018 Q3 Performance Measures Report. Revised March 22, 2018 Average Daily Boardings Comparison Chart, Page 11 Q3 Boardings figures revised
 2017/2018 Q3 Performance Measures Report Revised March 22, 2018 Average Daily Boardings Comparison Chart, Page 11 Q3 Boardings figures revised Contents Ridership & Revenue... 1 Historical Revenue & Ridership...
Insight Department: Scotland The key facts on tourism in 2016
 Insight Department: Scotland The key facts on tourism in 2016 September 2017 Executive Summary & Background Information In 2016 just under 14.5 million overnight tourism trips were undertaken in Scotland.
National Passenger Survey Autumn putting rail passengers first
 National Passenger Survey Autumn 2005 putting rail passengers first What is Passenger Focus? Passenger Focus is the independent national rail consumer watchdog. Our mission is to get the best deal for
Sound Transit Operations June 2016 Service Performance Report. Ridership
 Ridership Total Boardings by Mode Mode Jun-15 Jun-16 % YTD-15 YTD-16 % ST Express 1,622,222 1,617,420-0.3% 9,159,934 9,228,211 0.7% Sounder 323,747 361,919 11.8% 1,843,914 2,099,824 13.9% Tacoma Link 75,396
Coast to coast. STR Coastal Town Review Coastal Towns Market Review Report_JE.indd 3
 Coast to coast. STR Coastal Town Review 16 Coastal Towns Market Review Report_JE.indd 3 4//17 8:31:38 AM Table of Contents Introduction...3 United Kingdom...4 Blackpool...6 Bournemouth...8 Brighton...
The tourism value of the natural environment and outdoor activities in
 The tourism value of the natural environment and outdoor activities in the South West Produced on behalf of the South West Coast Path Association By The South West Research Company Ltd January 2016 1 Contents
Taking Part 2015/16: WEST MIDLANDS
 Taking Part 2015/16: WEST MIDLANDS 1 This report provides an overview of the arts and cultural engagement of adults living in the West Midlands. Data is taken from the Taking Part Survey 2015/16 and makes
The Economic Impact of Gloucestershire s Visitor Economy Forest of Dean district
 The Economic Impact of Gloucestershire s Visitor Economy 201 Forest of Dean district Produced on behalf of the Wye Valley and Forest of Dean Tourism Association By The South West Research Company Ltd January
The Economic Impact of Gloucestershire s Visitor Economy Forest of Dean district
 The Economic Impact of Gloucestershire s Visitor Economy 2014 Forest of Dean district Produced on behalf of the Wye Valley and Forest of Dean Tourism Association By The South West Research Company Ltd
Sound Transit Operations December 2014 Service Performance Report. Ridership
 Ridership Total Boardings by Mode Mode Dec-13 Dec-14 % YTD-13 YTD-14 % ST Express 1,266,130 1,396,787 10.3% 16,605,299 17,661,976 6.4% Sounder 248,710 285,016 14.6% 3,035,735 3,361,317 10.7% Tacoma Link
FIXED ROUTE DASHBOARD JULY 2018
 FIXED ROUTE DASHBOARD JULY 2018 Safety Max Target Goal Preventable Collisions per 100k Miles Non-Preventable Collisions per 100k Miles Total Incidents per 10,000 Boardings 1.6 1.3 0.8 2.63 2.1 2.0 1.60
WAVERLEY TOPS ANNUAL RURAL AREAS QUALITY OF LIFE SURVEY
 NOT FOR BROADCAST OR PUBLICATION BEFORE 00.01HRS 29 TH MARCH 2013 The Halifax Rural Areas Quality of Life Survey tracks where living standards are highest in Great Britain by ranking local performance