MOVING PEOPLE. Solutions for Policy Thinkers. Improving public transport service: Hobart A corridors case study
|
|
|
- Diane Holmes
- 5 years ago
- Views:
Transcription


1 MOVING PEOPLE Solutions for Policy Thinkers Improving public transport service: Hobart A corridors case study
2
, Business School, University of Sydney ISBN: 978-0-9945094-2-0 Copyright 2016 Bus Industry Confederation Inc. First Published July 2016. This work is copyright.")
3 MOVING PEOPLE Solutions for Policy Thinkers Improving public transport service: Hobart A corridors case study Authors: Adjunct Professor John Stanley and Yale Wong, Institute of Transport and Logistics Studies (ITLS), Business School, University of Sydney ISBN: Copyright 2016 Bus Industry Confederation Inc. First Published July This work is copyright. Apart from any use as permitted under the Copyright Act 1968, no part may be reproduced by any process without prior written permission from the Bus Industry Confederation. Requests and enquiries concerning reproduction and rights should be addressed to the BIC National Secretariat, PO Box 6171, KINGSTON ACT enquiries@bic.asn.au. 1
4 Foreword This special edition research paper was commissioned by the Bus Industry Confederation (BIC) to provide an independent perspective on the Hobart light rail debate and the need for transport decisions to be made within a broader land use setting framework and on the basis of an agreed assessment process for rapid transit and public transport infrastructure projects for Australia, (see the BIC report, Rapid Transit: Investing in Australia s Transport Future 2014). The BIC advocates for an assessment process that does not look at public transport projects in isolation but addresses the value the project will add to improving the existing road and public transport network (or not) and also looks at alternative uses of the proposed funding for projects like Hobart light rail, that may provide a better overall outcome, in this case, for Hobart or even Tasmania. 2 Moving People > Bus Industry Confederation Improving public transport service
5 Contents Foreword 2 1. Setting 4 2. Land use transport development directions: Goal setting, land use and then transport 5 3. Broad strategic land use transport development directions for Australian cities 8 4. Hobart context Population and densities Linking public transport service levels to density Public transport in the Hobart northern corridor The LRT case Bus rapid transit Bus priority enhancements Opportunities for other corridors Governance Public transport service provision in low demand settings Conclusions 28 Appendix A: Light rail in the northern corridor 29 Appendix B: Transit corridors 33 References 35 Figures Figure 1: Dwelling density in Greater Hobart 9 Figure 2: Glenorchy Interchange, an on-road, dedicated bus-only facility with six bus stands (viewed westbound) 10 Figure 3: Main Rd at Glenorchy, showing on-street parking (viewed southbound) 10 Figure 4: Main Rd at Glenorchy (evening), showing on-street parking and pedestrian crossing facilities (viewed southbound) 11 Figure 5: Hobart City Interchange, an on-road, dedicated bus-only facility with ten bus stands and a Metro information centre (viewed southbound) 11 Figure 6: Main Rd inbound load profile (weekday average) 13 Figure 7: Main Rd outbound load profile (weekday average) 13 Figure 8: Level crossing at Sunderland St, showing cycling facilities and corridor width (viewed northbound) 14 Figure 9: LRT route 17 Figure 10: Rosny Park Interchange, an on-road, shared [with general traffic] facility with six bus stands (viewed southbound) 21 Figure 11: Shoreline Central, an on-road, shared facility with two bus stops (viewed westbound) 21 Table 5: Eastern Shore approximate headways for route services by direction, operator and time period 22 Figure 12: Kingston Central, an on-road, shared [with general traffic] facility with two bus stops (viewed northbound) 23 Figure 13: Park and ride facility at Kingston, located on Dension St 300 m southwest of Channel Court (viewed northbound) 23 Figure A1: Population density within 500 m of Canberra s Capital Metro corridor in Tables Table 1: Weighted average elasticities of vehicle miles of travel with respect to built environment variables 6 Table 2: Suggested density thresholds for transit service 10 Table 3: Main Rd approximate headways for route services by direction, operator and time period 12 Table 4: Brooker Hwy approximate headways for route services by direction, operator and time period 15 Table 6: Southern Outlet approximate headways for route services by direction, operator and time period 24 Table A1: Benefit-cost ratio sensitivity analysis for alternate transfer penalties 30 Table A2: Comparison of light rail projects recently opened or currently under construction in Australia with the four operating parameters proposed for Hobart (ACIL Tasman 2013, ACT Government 2014, GoldLinQ nd, NSW Government 2013) 32 Moving People > Bus Industry Confederation Improving public transport service 3
6 1. Setting There have been a large number of reports written on public transport development options in Hobart s northern corridor in the last eight years, as summarised by Infrastructure Tasmania (2016). Most have looked at possible development of light rail along the old rail corridor and others have looked too at substantial upgrading of bus services, including the possibility of a busway being implemented. More modest improvements have also been considered, including looking at ways in which the current bus service could be enhanced, through measures such as increasing frequency, straightening out routes and providing improved running times. This paper considers such opportunities, focusing mainly on the Hobart northern corridor but also looking at the eastern and southern corridors, to test whether the time might be right for a step up in mass rapid transit or whether upgrading existing services is a more effective approach. The report s conclusions are presented in section 6 and there are two included Appendices. Appendix A summarises some of the detail on LRT evaluations in the corridor and presents some comparative information about other LRT projects in Australia. Appendix B presents some summary thinking about transit corridors, which should play a stronger role in Hobart thinking about land use transport integration. Australia s Bus Industry Confederation (BIC) is the peak body for the bus sector in Australia. It represents the interests of operators and suppliers, recognising that the best interests of its members will be best achieved when they can demonstrate they are clearly adding value to their communities. The BIC has been exploring opportunities to upgrade urban bus service levels in Australia, including where Bus Rapid Transit (BRT) might be the most appropriate development opportunity. The BIC is aware of the interest in Light Rail Transit (LRT) on the part of many people in Hobart, particularly as a development opportunity in the northern corridor. It has asked the Institute of Transport and Logistics Studies (ITLS) at the University of Sydney Business School to examine the corridor and suggest whether LRT or BRT might be a preferred option in that corridor, or whether some other approach to upgrading public transport might be more appropriate at this stage. This paper reports the ITLS initial findings. They are based on a review of the main studies that have been undertaken, our research in other cities around the world (by the authors and other ITLS experts), consultations with a number of experts in the area and site visits. The views expressed are our own and are in no way attributable to any of those with whom we have held consultations. Section 2 of the report sets the scene for considering urban transport prioritisation by discussing common goals and related land use transport development directions, with a focus on key built form variables and how they impact travel. Section 3 talks more specifically about land use transport development directions for Australia s major cities and Section 4 discusses Hobart development against the background of sections 2 and 3. It focuses particularly on development density, because of the important role this plays in land use transport integration. Section 4 then discusses public transport in the Main Rd corridor, looking at opportunities for light rail, bus rapid transit and other bus priority enhancements. It also includes consideration of some bus service upgrade opportunities in Hobart s eastern and southern corridors. The section finishes with a discussion about governance arrangements for the delivery of improved public transport services in Hobart. Section 5 considers the provision of public transport services in low patronage settings, to balance somewhat the dominant focus in the report on trunk services. 4 Moving People > Bus Industry Confederation Improving public transport service

 in a report written for the Australian Council of Learned Academies, as input to an ACOLA report to Australia s Chief")

7 2. Land use transport development directions: Goal setting, land use and then transport Before discussing the particular matter of development in Hobart s northern corridor, it is useful to think briefly about urban land use transport development directions for cities, since decisions about major transport infrastructure should be taken in this context. There is much common ground here between Australian cities and cities in the US, Canada and in many European countries. These development directions have been summarised by Stanley and Brain (2015) in a report written for the Australian Council of Learned Academies, as input to an ACOLA report to Australia s Chief Scientist on sustainable mobility (ACOLA 2015). Stanley and Brain argue that, if Australia s cities and regions are to sustainably improve the wellbeing of their citizens, present and future, and protect the planet in so doing, then goals in the following form are needed for strategic land use transport planning: 1. Increase economic productivity 2. Reduce environmental footprint 3. Increase social inclusion and reduce inequality 4. Improve health and safety outcomes 5. Promote intergenerational equity this goal is likely to be achieved if the preceding goals are met 6. Engage communities widely 7. Pursue integrated land use transport plans. Reflecting the commonality of focus noted above, the Southern Tasmania Regional Land Use Strategy reflects these goals, indicating that it is: strategically underpinned by the concept of Sustainable Development and guided by the following planning principles: Inter-generational equity; The precautionary approach; Social Equity; Efficiency; Conservation of biodiversity; and Community participation (STRPP 2013, p. 17). Moving People > Bus Industry Confederation Improving public transport service 5
8 That Strategy then sets out ten strategic directions that reflect these principles, across economic, social and environmental platform objectives, including a focus on integrated land use transport planning and the creation of vibrant and attractive activity centres and strong, healthy, liveable communities. In structuring integrated land use transport planning, ITLS strongly supports Professor Robert Cervero s view that the dominance of major transport infrastructure projects in city shaping, and in the economic, social and environmental performance of a city, is such that it is crucial for land use transport planning to start with a clear vision of the kind of city that is desired and then use transport and other measures to help deliver that result (Cervero 2014). Access to jobs, education, services, family and friends, recreational and cultural opportunities and the like are common reasons why people live in, and need to move around, cities and regions. The concept of accessibility, of being able to reach places to undertake activities, ties land use and transport together. The most comprehensive review of connections between the built environment and travel, which underpins much contemporary international thinking about integrated land use transport planning, is the metaanalysis by Ewing and Cervero (2010), who talk about the following five Ds of built form in terms of how they impact (in particular) on car travel distances (vehicle kilometres of travel, or VKT): 1. density higher densities support more local activity opportunities, higher public transport service levels and walking. Destination density is particularly important 2. diversity of land uses makes it easier to undertake activities locally, associated with concepts such as mixed-use development and jobs/housing balance 3. design particularly creating interesting places where people want to be, are safe and feel safe, and promoting interactions between people and with the natural environment, which is important to well-being 4. destination accessibility which is about ease of access to trip destinations and developing activity nodes and corridors which link these nodes and 5. distance to transit, supported by fine-grained pedestrian opportunities, embedded in design elements such as intersection density and street connectivity. For example, Ewing and Cervero (2010) find that halving the distance to the nearest transit stop is associated with a 29 per cent increase in transit trips. Ewing and Cervero report impact elasticities, which show the relative sensitivity of response variables (primarily VKT in their case) to changes in a range of causal influences (the respective Ds). Most individual reported elasticities are small but the combined effect of a number of measures can be important, particularly when regional and local measures are both used. This underlines the importance of integrated approaches to land use transport policy and planning, encompassing integrated regional and local scales of thinking. For example, combined elasticity values for VKT with respect to multiple built-environment variables can total about -0.2 to -0.3, based on the values reported by Ewing and Cervero, as summarised in Table 1. This suggests that having a range of supportive land use transport measures might reduce car use in the applicable area by perhaps 20 to 30 or so per cent over a long period of time, given the length of time it takes to change some elements of the built form. This would be additional to impacts on VKT that might result directly from improved public transport. Table 1: Weighted average elasticities of vehicle miles of travel with respect to built environment variables Built Environment Variable Measure Number of Studies Weighted Average Elasticity of VMT Density Household/population density Job density Diversity Land use mix Jobs-housing balance Design Intersection/street density Per cent of 4-way intersections Destination accessibility Job accessibility by automobile Job accessibility by transit Distance to downtown Distance to transit Distance to nearest transit stop Source: From Ewing and Cervero (2010) Table Moving People > Bus Industry Confederation Improving public transport service
, who found that population centrality, the jobs-housing balance, city shape and density, in combination, had a significant effect on the amount of vehicle travel in US cities, as did public")
 to a city with the characteristics of")
 travel of 25 per cent.")
9 This order of impact magnitude is supported by research by Bento et al. (2005), who found that population centrality, the jobs-housing balance, city shape and density, in combination, had a significant effect on the amount of vehicle travel in US cities, as did public transport service levels. The effect of moving a sample of households from a city like Atlanta (733 persons per km2; 7000 rail miles of service/km2; 10,000 bus miles of service/km2) to a city with the characteristics of Boston (1202 persons/km2; 18,000 rail miles of service/km2; 13,000 bus miles of service/km2), which amounts to about a two-thirds increase in density and 80 per cent increase in transit service kilometres, was a projected reduction in annual vehicle (car) travel of 25 per cent. With public transport mode shares only accounting for a small percentage of total trips, a reduction in car trips of this order can mean a very large relative increase in PT mode share but it will not be achieved overnight, given the time it takes to increase densities. In terms of starting integrated land use transport planning at a regional scale, many cities in Europe, Canada, Australia and much of the US now commonly focus on achieving more compact urban settlement patterns, the logic of triple bottom line goal achievement suggesting compactness as a worthwhile direction for regional development (e.g. to reap economies of agglomeration, reduce social exclusion and reduce a city s environmental footprint). We note that this development direction is reflected, for example, in the Hobart City Council s Sustainable Transport Strategy (HCC 2009). The international focus on achieving more compact cities has often concentrated on increasing densities through highrise development in central/inner areas, where accessibility levels are usually highest, but there is now also considerable interest in medium density development around major transit nodes and along strategic transit corridors, including in inner and middle urban areas. Vancouver, for example, has been very successful at focusing infill development along strategic transit corridors and this approach is becoming more common in cities like Sydney and Melbourne. Regional scale thinking needs to be complemented by local or neighbourhood level thinking to best reflect the various D s of land use transport integration. Neighbourhoods are key building blocks to achieve a well-functioning city, strong communities arising from well-resourced and well-functioning neighbourhoods (Stanley et al. 2015). Such neighbourhoods will be good for people, the environment and economic participation. All neighbourhoods need to offer the activities and social infrastructure to meet essential needs: personal wellbeing, mental health and social equity; a sense of place and belonging; participation and choice; and the ability to successfully adapt to external challenges. The ability to be mobile and be able to access friends, activities, government and business, is a requirement to achieve most such needs. However, it is unusual to see neighbourhood level thinking embedded in strategic land use transport planning. The idea of the 20 minute city (sometimes called the 20 minute neighbourhood) seeks to achieve this embedding. Some cities that have demonstrated an explicit systemic focus and understanding at a neighbourhood level, integrated with topdown regional thinking, include Portland (Oregon), Vancouver, Freiburg (Germany), Berlin, Malmö (Sweden), New York and Melbourne, with its recent work on the 20 minute city or 20 minute neighbourhoods, building on Portland s work. The idea of a 20 minute city is that land use transport planning should aim, in part, to ensure that most (but not all) of the activities that people need for a good life are available within a 20 minute trip by foot, bicycle or public transport (not having to have a car) from where they live. This requires a range of local activities and it also requires local mobility choices, particularly safe walking/cycling opportunities and an adequate service level on local public transport (discussed in more detail in sections 4 and 5). Good mobility opportunities and availabilities of local services and infrastructure can, in turn, most easily be provided where urban densities are planned for this purpose, thereby also reducing the need to travel (also discussed in Section 4). Initiatives like complete streets should be integrated with ideas like that of the 20 minute neighbourhood. Minimum urban development densities are a fundamental requirement for the delivery of 20 minute neighbourhoods, as discussed in Section 4.2. Moving People > Bus Industry Confederation Improving public transport service 7
 that flow there-from for cities with over a million or so")

 supportive mixed use activity centres, that mainly provide a sub-regional population-serving role major transport corridors that link the")
10 3. Broad strategic land use transport development directions for Australian cities The main land use implication for Australian capital cities from the preceding discussion involves pursuit of more compact settlement patterns, anchored by: the CBD and close surrounds, because of the wider economic benefits (in production and consumption) that flow there-from for cities with over a million or so population, a small number of additional high tech/knowledge-based inner/middle urban clusters (at a rate of about one per million city population), which should form the basis for a polycentric city and focal points for inner/ middle urban area growth major urban renewal opportunity areas (e.g. in areas that have lost large numbers of manufacturing jobs) supportive mixed use activity centres, that mainly provide a sub-regional population-serving role major transport corridors that link the core nodes to the centre, to each other and to outer areas and tie in the renewal opportunity areas a series of constituent 20 minute cities/ neighbourhoods. This land use development direction is increasingly being embedded in integrated strategic long term land use transport plans for Australia s major cities, recognising the need for local nuance. Supportive strategic transport directions are an essential part of delivering on these land use directions, along the following lines: ensuring strong radial public transport to the central areas of our cities, to support their agglomeration economies this is highly relevant to Hobart s main radial corridors good arterial roads across the entire city (including to the central city in smaller cities, where road performs the major movement role for freight and people, including by road-based public transport) fast and frequent trunk public transport services, supporting inner/middle urban nodes/corridors. Hobart Metro s Turn up and GO initiatives are in accord with this direction. In larger cities, this direction includes circumferential movement, such as Melbourne s SmartBus and Sydney s Metrobus networks, linked to the cluster (node) development focus better public transport connections from outer suburbs to areas of employment/activity concentration (recognising that job creation in outer suburbs is very difficult at anything greater than about 300 jobs per 1000 population, much less than is needed to provide local jobs for all who want them) supportive local public transport access, which is hardest in the lowest density settings high priority to walking and cycling throughout the whole city. Governance arrangements should support integrated delivery of these development directions across all levels of government. 8 Moving People > Bus Industry Confederation Improving public transport service

11 4. Hobart context 4.1 Population and densities At the time of the 2011 Census, Greater Hobart had a population of 212,000, some 11 per cent higher than in 2001 (a growth rate of about 1 per cent per annum over the decade). The population increase over this period was largely concentrated in the outer Local Government Areas (LGAs) of Kingborough (+6000, rounded), Clarence (+4500), Brighton (+2900) and Sorell (+2700). The LGAs of Hobart and Glenorchy, which are most relevant to the northern corridor, only added 4300 people over the decade, or about 430 a year, with the Glenorchy increase (~2200 over the decade) slightly larger than that in Hobart (~2100). In short, only 20 per cent of Greater Hobart s population growth over the decade was in the two municipalities. The language of compact settlement patterns is part of the Hobart land use transport planning lexicon but delivery is not. Greater Hobart has established a fixed urban boundary, which is supportive of compact settlement, but our consultations have suggested that there is room for about years growth within that boundary. Whereas the larger capital cities are typically planning on 70 per cent of their urban dwelling growth happening as urban infill and are achieving this (or higher), Hobart is currently achieving only about 15 per cent infill development. This will do little to lift densities, which are currently extremely low in Greater Hobart, as shown in Figure 1. The average dwelling density in new suburban fringe developments in Melbourne is about dwellings per hectare (dw/ha), putting it in the blue groupings of Figure 1, which is more comparable to a middle urban setting in Greater Hobart s northern corridor. In contrast, we are advised that greenfield dwellings in Hobart are typically developed at ~7-10 dw/ha, well below the Melbourne rate. This low density may be seen as an advantage for Hobart by some, in terms of providing living space for residents. However, it also ensures relatively long work trip lengths, enforces car dependency and its attendant consequences and makes effective public transport provision very difficult. The population growth rates in the Cities of Glenorchy and Hobart over the 2001 to 2011 decade, at 5.2 and 4.4 per cent respectively (for the decade), shows how slowly population densities increased over that period (the same rate as population, in gross terms). Dwelling density increased at about the same rate as population density in Glenorchy over the decade (at 5.3 per cent), but more slowly than population density in City of Hobart (at 1.2 per cent, compared to 4.4 per cent for population density), implying increasing average persons per dwelling in Hobart but not Glenorchy. On both population and dwelling measures, densities are low and increasing only very slowly. Figure 1: Dwelling density in Greater Hobart Source: City of Hobart Moving People > Bus Industry Confederation Improving public transport service 9


12 4.2 Linking public transport service levels to density Of all the practical things that can be done to deliver more compact cities, integrated planning of land use and transport is fundamental, particularly as this relates to the provision of public transport and active transport, especially walking. Cities like London, Vancouver, Toronto and Portland (Oregon) understand this very clearly and are well down the path of implementation at regional and local levels. London, for example closely links development densities to public transport service levels and may seek developer contributions for new developments that infringe thresholds in the Public Transport Accessibility Level/density link. For lower density cities, the public transport service level/density link has been illustrated in the Ontario Ministry of Transport s Transit-Supportive Guidelines (OMOT 2012), as shown in Table 2. The Ontario Guidelines emphasise that these thresholds are:... suggested minimum density thresholds for areas within a 5-10 minute walk of transit capable of supporting different types and levels of transit service. The thresholds presented are a guide and not to be applied as standards. Other factors such as the design of streets and open spaces, building characteristics, levels of feeder service, travel time, range of densities across the network and mix of uses can also have a significant impact on transit ridership. Mobility hubs and major transit station areas may require higher minimum densities. (OMOT 2012, p. 24) The Ministerial Advisory Committee advising Victoria s Planning Minister on the state s long term planning strategy, of which one of the current authors is a member, has recently proposed minimum average densities in Melbourne s growth suburbs of 25 dwellings/ha, helping the case for supportive base public transport service levels in the minute headway range, as part of the delivery of 20 minute neighbourhoods. Densities at which LRT/BRT are suggested as appropriate are much higher in Table 2, at about 70 dw/ Ha. Very few parts of Greater Hobart are anywhere near this density, suggesting that the case for rapid public transport (LRT/BRT) is likely to be very hard to sustain, unless there is a concerted push on increasing densities, through measures such as Transit Oriented Development. Table 2: Suggested density thresholds for transit service Transit Service Type Basic transit service (one bus every minutes) Frequent transit service (one bus every minutes) Very frequent bus service (one bus every 5 minutes with potential for BRT or LRT) Dedicated Rapid Transit (LRT/BRT) Suggested Minimum Density 22 units per ha/50 37 units per ha/80 45 units per ha/ units per ha/160 Subway 90 units per ha/200 Source: Based on OMOT (2012), p. 24 Figure 2: Glenorchy Interchange, an on-road, dedicated bus-only facility with six bus stands (viewed westbound) Figure 3: Main Rd at Glenorchy, showing onstreet parking (viewed southbound) 10 Moving People > Bus Industry Confederation Improving public transport service


13 4.3 Public transport in the Hobart northern corridor Main Road Hobart s Main Rd/New Town Rd/Elizabeth St corridor serves as the primary transit corridor to Hobart s northern suburbs, connecting the suburbs of Glenorchy, Derwent Park, Moonah, New Town and North Hobart with the Hobart CBD. As a council-owned major arterial, Main Rd carries 19,700 vehicle movements at its peak load point (Tasmanian Government 2011), and complements the role that the Brooker Highway plays as a high-speed dual carriageway catering for freight traffic and longer distance travel. A range of residential, commercial and industrial land uses have frontage onto Main Rd, or close thereto, which also serves as the access route for important trip attractors including shopping centres, schools, hospitals, churches, hotels, parks and other community facilities. The corridor, for the purposes of this study, is 7.5 km in length, beginning at Glenorchy Interchange (Figure 2), where six bus stands offer a spacious facility to terminate buses and to accommodate customers making onward connections. It is at the town centres of Glenorchy, Moonah and North Hobart where congestion is particularly acute. The combination of a reduced speed limit, significant on-street parking (Figure 3), traffic calming devices 1 and pedestrian facilities (Figure 4) can result in delays for all motorised modes. Light industrial developments can be found at Derwent Park, which is also the location for Metro s sole Hobart depot. An interchange facility exists at this location, built to serve the northern suburbs before Glenorchy interchange was commissioned. Despite now serving little purpose, it continues to cause delays for southbound services, which must detour into the off-road facility. Today, its sole benefit is to provide better accessibility for customers using the 69 space park and ride facility and bike racks, which are provided by Metro at this location. Further south, residential properties are prevalent in New Town, ranging in densities from low to medium. 1 Buses then divert around Elizabeth Mall (via Campbell St/ Argyle St) to enter the Hobart City interchange (Figure 5). Main Rd is primarily single carriageway, with one lane in each direction, although there are segments with two lanes, as well as dedicated turning lanes at some intersections. A total of 24 traffic signals can be found on the corridor, including a southbound bus-only light at Main Rd/Eady St in Glenorchy. This unusual design encourages private vehicles to use Brooker Hwy, although they are able to continue south on Main Rd by completing a U-turn at the Eady St/Elwick Rd/King George V Ave roundabout. Based on bus running times, peak period travel from Glenorchy to Hobart CBD is around 50 per cent slower than during off-peak times (34 min as compared with 23 min). Bus priority measures along the corridor have been estimated to speed up travel times by as much as 10 min during the peaks. Implementation is contingent upon adequate resolution of the challenges facing Main Rd, including limited widening opportunities, competition for road space and the diverse mix of road uses. Main Rd serves as the trunk route for bus services, with routes branching out at Glenorchy to suburbs like Claremont, Bridgewater and Brighton. Under this configuration, the layering of routes along Main Rd provides a high frequency corridor, branded as Metro s Turn up and GO service. There has been a trend globally towards the consolidation of route bus services onto fewer, higher frequency routes, to capitalise on the patronage-coverage trade-off first espoused in Walker (2008). Metro s Hobart Network Review, implemented in January 2015, represented the first system reimagining in 30 years, and was, at heart, guided by these network planning principles. With no change in service kilometres, the reallocation of resources permitted higher frequencies on major corridors, whilst lower patronage routes saw their services diluted, now operating either every two hours in the inter-peak and evening, or not at all, with services running in the peak-period, peak-direction only. Figure 4: Main Rd at Glenorchy (evening), showing on-street parking and pedestrian crossing facilities (viewed southbound) Figure 5: Hobart City Interchange, an on-road, dedicated bus-only facility with ten bus stands and a Metro information centre (viewed southbound) 1 Some of these devices make it difficult for Metro to operate its larger, 14.5 m steerable tag axle fleet Moving People > Bus Industry Confederation Improving public transport service 11
14 Metro Tasmania is the largest public transport operator in Tasmania, being a state-owned company that is working under contract to the Tasmanian government. Metro owns and operates 218 buses, of which 148 run in Hobart, with a peak availability of 141 buses. This fleet delivers 1,600 services per weekday in Hobart, of which more than one third service the northern suburbs. Private operators play a smaller role, providing just 10 per cent of services in Greater Hobart. As a non-urban operator, O Driscoll Coaches also run along Main Rd, but do not compete directly with Metro, as their services face pick up and set down restrictions along the route (to better cater for customers travelling longer distances). O Driscoll Coaches has been adding capacity on its New Norfolk services in recent years and seen a corresponding increase in patronage. It is estimated that up to 25 buses per hour operate along Main Rd in the AM peak, of which around 15 are route services (Table 3), and 10 dedicated school services. During the weekday inter-peak, six buses per hour operate on average in each direction. This makes Main Rd the busiest of all major public transport corridors in Greater Hobart (barring perhaps the Tasman Bridge, where there are no stops or catchment in either direction). Metro s northern suburb services carry approximately 2.2 million passengers per year. Metro advises that these services are already near capacity, with inbound buses in the AM peak frequently reaching capacity on arrival into Moonah. This is likely an artefact of Hobart s narrow peaks, a result of its size, economic structure and geography, which also increases the costs of service provision. This arises from the many drivers who are employed, and the buses which are procured, to service the peaks exclusively, being idle at other times of the day. Metro s Greencard smart ticketing system requires validation only upon boarding, resulting in poor data relating to customers alighting patterns. By assuming symmetric return journeys, we have been able to estimate passenger alightings and generate load profiles for the Main Rd corridor, from data kindly made available by Metro. Passenger patterns are shown but numbers (y-axis) have been redacted, to protect Metro s commercial confidences (Figures 6 and 7). The data shows that significant passenger movements occur north of the city on Bathurst St/Campbell St and Argyle St/Liverpool St. Furthermore, it shows high passenger turnover at Moonah Shops, North Hobart, as well as at the Metro Depot where park and ride facilities are provided. Table 3: Main Rd approximate headways for route services by direction, operator and time period AM Peak Inter-Peak PM Peak Evening Saturday Sunday INBOUND Metro 6-10 min 10 min min 30 min min 30 min O Driscoll 2 5 trips 4 trips 2 trips 2 trips 9 trips 3 trips OUTBOUND Metro min 10 min 6-10 min 30 min min 30 min O Driscoll 2 1 trip 6 trips 5 trips 2 trips 9 trips 3 trips Source: Authors, from timetables 2 2 O Driscoll Coaches operating as Derwent Valley Link to New Norfolk and Bothwell 12 Moving People > Bus Industry Confederation Improving public transport service
15 Figure 6: Main Rd inbound load profile (weekday average) Patronage Passengers Onboard Passenger Boardings Passenger AlighEngs (EsEmate) Figure 7: Main Rd outbound load profile (weekday average) Moving People > Bus Industry Confederation Improving public transport service 13

16 4.3.2 Railway corridor The northern rail corridor has become available since 2014, when freight services between Hobart and Brighton ceased, with the construction of a new intermodal transport hub at Brighton. Historically, the railway has been double track between Hobart and Claremont but one track has now been decommissioned and replaced with a cycleway, which runs the full length of the rail corridor. The railway follows a less direct route than Main Rd, with vastly different catchment characteristics between Hobart City and Glenorchy, as compared with that of Main Rd. The rail line runs virtually parallel to Main Rd between Glenorchy and Moonah, about 30 metres away at its closest and 250 metres at the furthest. The potential public transport service catchment of the railway would therefore be quite similar to Main Rd through this section, although the line is situated some distance away from the activity centre of Moonah Shops. The rail corridor is also quite derelict, with significant investments required to regenerate the area, attract development and enhance its connectivity with existing trip attractors on Main Rd. The section of route between Glenorchy and New Town is relatively straight and well suited for high speeds (Figure 8). Further, the rail easement is wide, so a double track railway or two lane carriageway can be accommodated without property acquisition or removal of the cycleway. There are seven level crossings between Glenorchy and New Town, of which Elwick Rd and Derwent Park Rd can be considered important collector roads. All level crossings have been permanently open since 2014 but future use of the rail corridor will need to consider how these at-grade intersections with crossroads are treated. There are also three underpasses and one overpass at Risdon Rd, which may pose as limiting infrastructure. Further engineering studies are required to determine their suitability for any new transport developments. At New Town, the rail corridor deviates significantly east towards Brooker Hwy. Between Queens Domain and Macquarie Point, the railway follows the bank of the Derwent River and is hence circuitous, narrow and not suitable for high speeds. The sharpest bends occur at Pavilion Point (under Tasman Bridge) and behind the Hobart Cenotaph. Between New Town and Hobart City, the line is bound by Queens Domain and the Derwent River, and hence there is no adjacent catchment of any type (population or employment). The railway terminates at Macquarie Point, about 650 metres short of the current Hobart City Interchange and there are no corridors available to access the CBD without property acquisition or a reallocation of road space. There appear to be stabling facilities for trains at both Macquarie Point and the Tasmanian Transport Museum at Glenorchy but whether it is practical to use them in future is questionable. Figure 8: Level crossing at Sunderland St, showing cycling facilities and corridor width (viewed northbound) 14 Moving People > Bus Industry Confederation Improving public transport service
17 4.3.3 Brooker Highway Brooker Hwy is an urban arterial and national highway managed by the Tasmanian state government. It is an important freight corridor, transporting 2.7 million tonnes per annum ( ), and carrying 50,000 vehicles per day at its peak load point (Tasmanian Government 2011). It is a dual carriageway until Granton and limited access for some of its length between Hobart City and Glenorchy. In this section there are nine sets of traffic signals and two roundabouts, of which one is signal-controlled. The highway is two lanes in each direction but there are a number of intersections in Glenorchy, Derwent Park and Moonah where it widens to three lanes. This can increase intersection throughput, though it may also be argued that the subsequent merge after the signals results in a bottleneck for through-traffic. Between Glenorchy and the CBD, there is one gradeseparated trumpet interchange with the B36 Domain Hwy, which provides a more direct route from the northern suburbs across the Tasman Bridge. Land use patterns along the highway consist primarily of low density residential. These are most prevalent at Moonah and Lutana, where a number of bus stops provide access to these homes. There are a limited number of trip attractors in terms of schools, parks and even a cemetery, but the Brooker Hwy is a pedestrian-hostile, high-speed environment and so bus stops along this section of route record significantly less patronage than that of Main Rd (every transit user is also a pedestrian). On approach to Hobart, the highway is flanked on one side by Queens Domain and on the other by residential developments in North Hobart. However, these have frontage onto adjacent roads where bus services also operate, so there are no bus stops providing access from Brooker Hwy in this area. The Brooker Hwy between Hobart City and Glenorchy carries about 15 per cent of northern suburb bus passengers, whilst the other 85 per cent travel by Main Rd (Tasmanian Government 2011). This reflects bus services on Brooker Hwy operating primarily in the peak-period, peak-direction only (Table 4). The sole exception is Route X20 to Bridgewater, which offers a quicker service for this community during the day. Travel times on Brooker Hwy between Glenorchy and Hobart City are some 25 per cent quicker than Main Rd (25 min compared with 34 min peak travel time). Service allocations for route services are roughly even in peak periods between Main Rd and Brooker Hwy. It is unclear, at present, the patronage mix between these two corridors at peak times, and further investigation is required to understand the importance of destinations along Main Rd. Table 4: Brooker Hwy approximate headways for route services by direction, operator and time period AM Peak Inter-Peak PM Peak Evening Saturday Sunday INBOUND Metro 7.5 min 30 min 60 min No service No service No service Tassielink 3 No service 2 trips No service 1 trip 1 trip 1 trip O Driscoll 4 1 trip No service No service No service No service No service OUTBOUND Metro 60 min 30 min 7.5 min No service No service No service Tassielink 3 No service 2 trips 1 trip No service 1 trip 1 trip O Driscoll 4 No service No service 1 trip No service No service No service Source: Authors, from timetables 34 3 Some services operate on specific days only 4 O Driscoll Coaches operating as Derwent Valley Link to New Norfolk Moving People > Bus Industry Confederation Improving public transport service 15
18 4.3.4 Hybrid alignment The choice of route in the corridor can be considered largely independent of the choice of transport technology, be it bus-based or rail-based. Indeed, it is best practice in transport planning to select the desired corridor first, then choose the most appropriate mode to meet the particular transport demands and challenges on that corridor, all the while adopting land use policy in line with these transport developments (Walker 2012). Previous studies of future transit options between Glenorchy and Hobart City have considered the Main Rd, railway and Brooker Hwy corridors in isolation and as mutually exclusive (Tasmanian Government 2011). Regardless of mode, it is clear that each corridor is accompanied by a range of strengths and weaknesses. Perhaps the greatest weakness of the rail corridor alignment is the lack of catchment between New Town and the CBD, compounded by the difficulty of linking Macquarie Point to the CBD, particularly in light of patronage data showing high passenger turnover north of the CBD and in North Hobart. Coupled with the time penalties associated with the topography and eastward detour, it is unlikely to compensate for the extra travel time arising due to congestion on Main Rd (clearly, depending on what scenario is implemented there). We believe this is a very substantial penalty against the rail corridor, at least between New Town and Hobart City, for both BRT and LRT. The Brooker Hwy corridor is also affected by a less than ideal catchment. Not only are there insufficient trip attractors on the highway, it also skips the major activity centres of Moonah and North Hobart on Main Rd. Whilst it may be argued that a significant number of peak services (indeed, half of all route services) already operate there with some success, any investment in BRT/LRT schemes should concentrate resources on a single corridor to improve returns, including the provision of a stronger stimulus for urban renewal. Use of Brooker Hwy will result in a dilution of services, whilst challenges with serving Main Rd remain. Use of the rail corridor is most preferable between Moonah and Glenorchy, so as to serve Main Rd destinations whilst improving right of way for the service. Detailed modelling is required to confirm that the detour can save travel time and not detract Main Rd customers who face increased walking distances. Under a hybrid alignment for bus-based or railbased services, the vehicle would then join New Town Rd/ Elizabeth St near New Town High School (perhaps using Bromby St), for a more direct entrance into Hobart CBD, whilst also serving a larger catchment. Ewing and Cervero (2010) work cited in Section 2 suggests that the probability of achieving zero sparks effects is far higher than that of achieving strong sparks effects in such a low density setting. Development of the subsequent business case for light rail in the northern corridor (ACIL Tasman 2013) looked at Hobart to Glenorchy, sensibly dropped the strong sparks effect and opted instead for a 20 per cent sparks effect, which has more plausibility 5. Figure 9 shows the route and feeder bus services for this stage 1 LRT. The evaluation estimated capital costs of $70-78 million (or about $8-9m/km) and annual operating costs of $ m for the first 20 years of operation, then $3.2m per annum. However, to achieve a BCR of 1.1 again, at a 7 per cent real discount rate (for OOSM1 6 = 3 stops; fast system, the best rated option in the evaluation), this evaluation made the heroic assumption that there are no transfer penalties associated with modal transfers (between bus and LRT). Standard transfer penalties (of 5 minutes) reduced the base BCR to zero and a 2 minute penalty reduced it to These are not encouraging results for a viable project, which is not surprising given Hobart s densities. Professor Bent Flyvberg, now at Oxford University, coined the term optimism bias, to explain why major transport projects often cost more than expected and deliver lower patronage levels. Strong sparks and zero transfer penalties are useful analytically to show the kind of extreme and unrealistic assumptions that are needed to deliver a good economic result on the Hobart LRT but, if they were taken as plausible contexts for such an evaluation, they would aptly fit Flyvberg s description. The business case report (ACIL Tasman 2013) assumed accelerated Transit Oriented Development (TOD) would take place around the LRT stops, creating an additional 50 units of development annually for 20 years (on top of an assumed base increase of 100 units annually in the North Hobart corridor, which extends past Brighton, although most of the development was expected to be between Glenorchy and Moonah). The emphasis on TOD in the evaluation is appropriate. We are not in a position to comment in detail on the likelihood of achieving this scale of impact but note that the gain of 150 units a year is a strong driver of LRT patronage growth in the business case evaluation. At an assumed 1.4 persons per dwelling, as used in the business case, this TOD would represent about half the rate of annual population increase that was achieved in Glenorchy and the City of Hobart combined over the decade. 4.4 The LRT case There has been considerable interest in possibly developing a light rail transit service in Hobart s northern corridor, on the disused rail line. A 2011 evaluation of a possible project from Hobart to Claremont (ACIL Tasman 2011), suggested a potential benefit-cost ratio of 1.1 at a 7 per cent real discount rate, highly dependent on exceedingly optimistic sparks effects essentially a huge patronage boost attributable to the initiative s characteristics. Strong sparks effects had the effect of lifting year 1 projected weekly patronage to 90,000, over three times the base (no sparks) patronage estimate and about 2-3 times current patronage in the corridor. Zero sparks effects delivered an expected BCR of zero. The 5 The effect of the 20 per cent sparks effect was to increase LRT mode share by 20 per cent above base estimates 6 Optimal Operating Service Models, of which four were tested (see Appendix A) 16 Moving People > Bus Industry Confederation Improving public transport service

19 Figure 9: LRT route Infrastructure Tasmania works with Glenorchy and Hobart City Councils to develop a detailed understanding of opportunities for land use planning and rezoning in relation to increased residential and commercial density adjacent to the rail corridor. This work should include identification of all potential locations for high-density residential development, the density target and ultimate dwelling yield. The investigation should identify sites within close proximity to potential light rail stations and required conversion of industrial land to residential or mixed use. Councils should also identify supportive planning scheme provisions that facilitate ease of re-zoning and future development. (Infrastructure Tasmania 2016, p. 18). This is the right starting point to progress thinking about what is possible and how it might best be achieved in terms of accelerated densification. Source: PWC (2014), Figure 1, p. 5. Vancouver is one of the most successful cities internationally at increasing densities around its frequent transit network. Almost half the population increase in metropolitan Vancouver between 2001 and 2011, and a little over half the growth in dwelling numbers over the decade, was located close to the frequent transit network (defined as within a 500 metre buffer of local bus and streetcar routes and a kilometre of rapid transit). This was a very effective transit corridor/station based development strategy, which has been instrumental in that city realising its strategic goal of developing a more compact urban area. This is a rare example of such a successful city-wide development strategy around transit (a key element of TOD). Toronto, for example, also aims for a compact settlement strategy based strongly around high frequency transit but achieves much lower rates of such development than Vancouver. However, it is more realistic for a local government area within a city to aim for half its growth to be concentrated in one particular trunk transit corridor. The rate of sustained TOD development assumed in the LRT business case is a relatively ambitious target for the relevant Tasmanian governments (local and state) to pursue, given the lack of medium density development in the corridor at present and the slow rate of densification being currently achieved in Greater Hobart. However, policy and planning measures should certainly strive towards achieving such a densification outcome. In this regard, we note that Infrastructure Tasmania has proposed: The economic case for LRT is weak, based on the various studies that have been undertaken. Could non-economic arguments change the outlook sufficiently for LRT to warrant an early start on the project? The business case (ACIL Tasman 2013) mentions Melbourne research on social exclusion, notes the relatively low socio-economic status of Hobart, but does not pursue valuation of potential social inclusion benefits from LRT, primarily arguing that these benefits are not currently included in project bids to Infrastructure Australia. The Victorian government, however, has recognised the value of these benefits. One of the current authors led the valuation work on social exclusion in the relevant Melbourne research and Professor David Hensher from ITLS was also intimately involved (see, for example, Stanley et al. 2011; 2012; Stanley and Hensher 2011). The Melbourne research showed that enabling an additional trip by a person at risk of social exclusion was worth about $20 for someone of median household income, increasing proportionately as household income reduces. The value is not mode-specific; it relates to additional trips. Local service coverage is the key to access provision to support trip making by people at risk of social inclusion and, in a Hobart setting, this coverage is largely provided by bus. Thus, the issue of reducing risks of social exclusion are certainly relevant to Hobart public transport provision but will mainly be a potential benefit for bus, not light rail. This thinking underpins ideas like minimum public transport service standards to support inclusion. 7 Although the LRT economic case is weak at present, there are good grounds for retaining the option for possibly developing LRT at some future time in Hobart s northern corridor, which means keeping the rail line available for such a purpose. If densities can be substantially increased over the next decade or so in the Glenorchy/Moonah area, through accelerated and sustained medium density mixeduse transit oriented development along the Main Rd section of the corridor, in particular, then the case for LRT (or BRT) should be revisited. Greater demonstrated evidence of medium density mixed-use development happening in the corridor would provide increased confidence that the state and corridor councils are serious about developing a more compact urban form and, accordingly, strengthen the case for rapid transit in the corridor, which may be LRT. 7 Stanley and Hensher (2011) show, for example, that social inclusion benefits are the largest single benefit from route bus operations in Melbourne Moving People > Bus Industry Confederation Improving public transport service 17
20 Infrastructure Tasmania s (2016) recommendation about engaging with the private sector to gauge interest in higher density development in the corridor is an important early part of this process. Appendix A in this report presents further discussion of the light rail option, including additional detail and comment on the business case evaluation results, together with some comparisons with other light rail projects in Australian cities. The latter comparisons suggest that the Hobart costs may be on the low side and would obviously need close verification should further work be undertaken on the project. Appendix B includes some discussion about transit corridors. 4.5 Bus rapid transit Metro currently carries 2.2 million passengers a year in the northern corridor counting all services that use Main Rd, its busiest corridor. 8 There are additional loadings from private route operators, who operate through the corridor from further afield, as well as dedicated school services which run on the route. Metro has been re-designing services in the corridor in recent times, to a Turn up and Go model, with additional through services. The target is for 90 per cent of corridor residents to be living within 400 metres of a high frequency route, with services departing every 10 minute during the day (weekdays 07:00 to 19:00). PWC (2014) suggests that this has been effective, with patronage increasing by 3.4 per cent to the time of their report, after years of stable or slowly declining patronage numbers. Service kilometres have not increased in total, as the higher frequencies have come from a re-organising of existing service kilometres, including removal of some underutilised services. Would a BRT in the corridor drive sufficient increased numbers to be worthwhile? Bus rapid transit has often been seen as inferior to light rail transit but there is evidence of a shift back towards BRT, as governments around the world increasingly recognise that bus-based transport can provide the same (or even better) mobility benefits as LRT at significantly lower cost (Hensher 2007). For example, in relation to the Appendix A example of Canberra, studies have shown that Canberra s Capital Metro corridor built as BRT could provide the same benefits as light rail but at only half the cost (Terrill, Emslie and Coates 2016). On the Gold Coast, the benefit-cost ratio of BRT was 2.53, somewhat higher than that of LRT at 2.3, with infrastructure costs 10 per cent lower, rolling stock costs 61 per cent cheaper but with operational costs 32 per cent higher (GoldLinQ nd, p. 18). A primary benefit of BRT is its ability to integrate with existing bus modes, as services can be through-routed to form the trunk system, rather than relying on connections and transfers at either end. Customers prefer a one-seat journey and penalise transfers highly, with recent experiments conducted in Canberra showing a per cent decrease in patronage when a connection was introduced (Wong 2014). Through-routing also permits higher frequencies on the system, although the vehicle capacities are usually smaller, leading to higher labour costs for the same number of passengers carried. This is countered, however, by savings in infrastructure costs, fleet costs and depots costs. 8 Multiplying the 90,200 weekly patronage estimate for the LRT in the ACIL Tasman (2011) report suggests annual LRT boardings of over twice the current bus loadings in the corridor, or nearly triple by year 10. The quality of BRT systems differ in terms of their right-ofway, busway alignment, fare collection method, intersection treatment and station design, amongst other factors. The Institute for Transportation and Development Policy has developed a metric through which to rank BRT systems worldwide (ITDP 2014). In Australia, Brisbane s busways receive a silver score of 77, as one of the most infrastructureintensive systems in the developed world. The gradeseparated environment, including elevated carriageways in the suburbs and underground stations and tunnels in the CBD, allows the system to operate virtually independent of general traffic. Less costly implementations of BRT are exemplified by Sydney s Liverpool-Parramatta T-Way, North West T-Way, M2 Busway and Melbourne s Doncaster Area Rapid Transit services. These bronze or basic BRT services feature at-grade intersections, lower quality stops, and may include sections where services run on-road in dedicated bus lanes. As noted, LRT is usually more costly than BRT in capital terms. The cost of a BRT scheme in Hobart will depend entirely on the specifications to which it is built. Use of the railway corridor is possible by converting the tracks into a road carriageway. The railway easement is sufficiently wide for opposing lanes between Glenorchy and New Town. South of New Town to Macquarie Point, the corridor is limited by bridges, embankments and cuttings which prevent the construction of opposing lanes without removing the cycleway. It has been suggested that passing lanes could be constructed, much like passing loops on a railway, to allow opposing buses to pass. We believe this is impractical given the greater variability of buses as compared with light rail, which operates with blocks and signals. This is exacerbated by the higher frequency expected from BRT in a throughrouted network. Passing lanes will also need to be located at stops, or be sufficiently long such that vehicles need not come to a halt. Studies in Hobart s northern corridor suggest that LRT between Hobart and Glenorchy would cost $70-78 million and that a longer BRT between Hobart and Claremont would be some $40m more costly (PWC 2014). We are not aware of like for like capital cost comparisons but expect that they would not be very different between LRT and BRT between Glenorchy and Hobart, although vehicle capital cost comparisons might favour bus, because of the current availability of many vehicles (as well as lower per unit costs). An objective choice between LRT and BRT, or some other alternative, needs equivalent capital and operating cost comparisons to be in place. There are currently about 25 buses an hour running along the corridor during the AM peak, or about one every two minutes, including Metro, school and private route services. If a BRT was to operate on the rail alignment, it would probably need to operate in the peak direction only during the peak period, because of the lack of room for dual lanes between New Town and Macquarie Point. This proposal is problematic on a number of fronts. Firstly, it assumes that all customers travel into Hobart CBD and out at peak times. The increasing diversity of trips is recognised by Metro in its latest network with new direct routes from the eastern shore to Glenorchy (Route 605), as well as better headway regularity on its Turn up and GO corridors during the day. Secondly, it adds confusion for passengers who do not follow these expected travel patterns. Customers making trips in the opposite direction, or returning home before PM peak arrangements have taken effect, will be forced to rely on coverage services 18 Moving People > Bus Industry Confederation Improving public transport service
21 which call at different stops, operating on different routes and to different times. What was previously a simple commute has now had many added variables, resulting in unnecessary complexity for the travelling public. Also, the proposal is difficult to implement operationally, especially during transition periods when the BRT switches direction. Will a late running bus hold up the BRT transition and hence delay all subsequent trips? Or will the vehicle be forced off the busway, inconveniencing customers and further delaying the bus and driver. There will also be no way for buses to overtake a vehicle broken down on the BRT, potentially leading to lengthy traffic jams until the vehicle can be towed away. Such a system will have no resilience against a single point of failure. A single-lane, reversible BRT for Northbourne Ave (on the Capital Metro corridor) has previously been proposed by the alternative government in Canberra but has since been withdrawn. Many of the reasons why LRT is a poor performer at present for Hobart also apply to BRT, such as development densities and capital costs. To be economically viable as a BRT, the LRT experience suggests that any service in the corridor would need to operate direct and as quickly as possible, while keeping capital costs to a low level. The indirect easterly loop in the rail line to Macquarie Point, however, takes most current public transport travellers out of their way, and lacks activity density that will generate patronage, until such time as Macquarie Point is an activity centre. North Hobart is a far more direct route to the city centre along the northern corridor, albeit hampered by traffic congestion. We believe a high quality BRT is currently only likely to be an effective option between Glenorchy and New Town High School. A lower quality scheme featuring bus priority enhancements, for instance in the form of continuous bus lanes, would then run on New Town Rd/Elizabeth St into Hobart CBD. This hybrid scheme operates on the same corridor to that we suggest in Appendix A as a possibly more effective light rail corridor than the full rail corridor. We expect that the corridor would be more economically efficient being built as BRT, due to its likely lower cost and better integration qualities. Naturally, once a corridor has been selected, a full cost-benefit analysis of BRT and LRT is required to determine which is the best mode overall for implementation. 4.6 Bus priority enhancements Metro s northern corridor bus service improvements noted in section 4.4 are currently hitting capacity constraints. AM Peak buses are often full for half the route from Moonah. There is very little priority given to bus operation in the corridor, with only one B-light in operation. PWC (2014), in its report Riverline Hobart Light Rail Strategic Assessment, included an option to improve bus frequency on key corridors, building on the early success of the Turn up and GO initiatives noted in section 4.4. They saw this option as supporting improved access to the CBD and reduced car dependency but confronting challenges in terms of the limited capacity for additional bus movements. medium term. Research has shown that minor initiatives to clear bottlenecks and pinchpoints have a far higher benefitcost ratio (often up to 20-30) than new infrastructure which seeks to add capacity to a road or rail network (BCR around 1-2) (Eddington 2006; Infrastructure NSW 2014). The Main Road Draft Transit Corridor Plan (Tasmanian Government 2014a, b, c) was developed by the Tasmanian Department of State Growth, in conjunction with Hobart City Council and Glenorchy City Council, and aims to provide increased bus priority, optimise bus stop locations and rationalise on-road parking. These changes are expected to improve peak travel time by around 10 minutes on the corridor. As Main Rd is a council asset (unlike Brooker Hwy, which as a road with state/ national significance, is administered by the Tasmanian state government), it is the responsibility of council to implement the plans. Given the limited road space available on Main Rd, it is imperative that this be allocated to the most spatially efficient mode of transport in peak periods this is bus. Each component of the Main Road Draft Transit Corridor Plan (Tasmanian Government 2014a) attempts to allocate more space to buses in an effort to improve their running times. Where space permits, the plan attempts to add a queue jump for buses at key intersections. Given that congestion builds up from an intersection rather than occurring mid-block, queue jumps allow the greatest time savings per unit of road space allocated to buses. A caveat is that the design must ensure the turning lane is long enough to ensure a bus can enter despite queued through-traffic, and that turning traffic is not queued so far back as to block this access (usually not an issue as they are free left hand turns). Where space does not permit, the plan calls for turning lane exemptions to allow buses to head straight through an intersection. Whilst not ideal, this is an improvement on the status quo, but intersection design and signal phases must ensure that sufficient opportunities are provided for the turning lane to clear. As an example, the current missing left turn signal from Main Rd southbound onto Risdon Rd does not represent an optimal signal phasing and design for this particular type of intersection treatment. The Main Road Draft Transit Corridor Plan (Tasmanian Government 2014b) also proposes a rationalisation of bus stops to improve bus travel speeds. At present, there are some sections of the corridor where bus stops are located just 200 metres apart. The plan proposes that stops be located 400 metres apart (a 5 minute walk), thus trading increased walking distances for faster bus travel times. Bus stops on Canberra s Flemington Rd (Capital Metro) corridor are located 1 km apart, the same distance as heavy rail station spacing in Sydney s inner suburbs. There was no political pain attached with their implementation, as these stop spacings were designed at the outset for this section of the frequent network. However, in other parts of Canberra where bus stops have been rationalised to improve Disability Discrimination Act compliance, the government has faced a backlash from the community. The lesson here is for the council to manage this process very carefully. Bus priority enhancements represent the most cost effective solution for improving public transport on Hobart s northern corridor (and elsewhere in Hobart), particularly in the short to Moving People > Bus Industry Confederation Improving public transport service 19
22 Reforming on-road parking is also a key part of the Main Road Draft Transit Corridor Plan (Tasmanian Government 2014c). This involves removing parking spaces around intersections to increase throughput, as well as relocating parking spaces associated with the bus stop optimisation program. This has been a contentious component of the plan, with heavy opposition from businesses and homeowners, and the council understandably reluctant to offend ratepayers. Glenorchy City Council (despite inprinciple support) has faced political pain with the attempt at removing just three parking spaces on Main Rd southbound outside the Metro depot to construct a new bus stop (such that southbound services will no longer need to divert into the depot, potentially saving 3 minutes on every run). The implementation difficulties here draw attention to the allocation of responsibility for the road and, in particular, whether responsibility should sit with the state government. We return to this matter in section 4.8. Clearways are another mechanism to manage the allocation of road space to improve bus travel times, with a focus on peak periods. It is possible that time limited parking restrictions, suited to Hobart s narrow peak periods, may garner greater community acceptance than an outright removal of parking spaces. Clearways already exist in Hobart on the Davey St/Macquarie St couplet. These operate between 07:30 and 09:00 in the morning and provide for a dedicated turning lane for left turning traffic. There is the potential to implement similar part time clearways on Main Rd, for the peak-period in the peakdirection. To provide some context, part time clearways in Melbourne operate from 07:00-09:00 for the AM peak, and from 16:00-18:00 in the PM peak. In Sydney, these operate from 06:00-10:00 in the AM peak and from 15:00-19:00 in the PM peak. Clearly, our proposals for Hobart are minor in scale and should have minimal effects on businesses in the area, particularly if they operate for only about 90 minutes onedirection in each peak. 4.7 Opportunities for other corridors Eastern Shore The Eastern Shore is Metro s latest addition to its Turn up and GO network, having been introduced following the Hobart Network Review implemented in January The corridor runs east from Hobart City, to Rosny Park, Bellerive and Howrah, via the A3 Tasman Hwy, Rosny Hill Rd, Cambridge Rd and Clarence St. Major destinations along the route include the Rosny Park Interchange (Figure 10), which serves Tasmania s largest shopping centre Eastlands, as well as Bellerive Shops and Shoreline Central (Figure 11). The Eastern Shore corridor, together with buses from the B32 East Derwent Hwy, Cambridge Rd (north) and B33 South Arm Hwy, are the only route services to use Tasman Bridge. The latest data shows the Tasman Bridge carrying up to 75,000 vehicles per weekday (Tasmanian Government 2016), the highest volume of any state road in Tasmania (Tasmanian Government 2012). A tidal flow system on the bridge proper and a contra-flow lane on the highway s eastbound carriageway between the CBD and Tasman Bridge work to enhance capacity in the peak-direction. Buses travelling through Rosny Park experience some delays from the town centre s many traffic signals and high intersection density. This congestion is arguably more severe on approach from the west, as the local arterial network lacks the capacity to soak up peak traffic being funnelled out of the A3 Tasman Hwy. Travel times on Cambridge Rd and Clarence St in Bellerive and Howrah are far less variable, though disruptions can occur during major events at the Blundstone Arena. Part-time clearways should operate along the full corridor. One difficulty, however, is that clearways on Main Rd may have the effect of simply shifting the bottleneck down the road, because of the prevalence of traffic calming devices and pedestrian crossing facilities at the major activity centres. Should these be dismantled, vehicle speeds will rise and pedestrians face greater difficulty crossing the road, thereby compromising the relatively pedestrian friendly environment currently in these centres. Peak direction time limits on the clearways can be accompanied by lowering of speed limits if necessary, to help deal with such concerns. Short term operational improvements at Metro may also help to reduce running times. At present, the Metro depot is used as a location for hotseating (change of driver). Although this is an efficient location for drivers to take crib breaks, as well as begin and end their shifts, it does result in a few minutes of delay for through passengers. It is prudent for Metro schedulers to explore alternative arrangements for hotseating when the next round of shifts are built. 20 Moving People > Bus Industry Confederation Improving public transport service
 Figure 11:")
 Moving People > Bus Industry Confederation Improving public")
23 Figure 10: Rosny Park Interchange, an on-road, shared [with general traffic] facility with six bus stands (viewed southbound) Figure 11: Shoreline Central, an on-road, shared facility with two bus stops (viewed westbound) Moving People > Bus Industry Confederation Improving public transport service 21
24 Since the launch of Metro s new network, trunk corridor services on the Eastern Shore now operate every 10 min or better from 07:00 to 19:00 Monday to Friday (Table 5). As a result of this, service levels now compare more favourably with the service offering on Metro s northern suburbs Main Rd corridor. Tassielink, a private interurban operator, also operates along the corridor, but only as far as Rosny Park, before re-joining the A3 Tasman Hwy. Their services do not compete directly with those of Metro, but rather serve commuters travelling to destinations further afield, including Colebrook, Port Arthur and the East Coast. Table 5: Eastern Shore approximate headways for route services by direction, operator and time period AM Peak Inter-Peak PM Peak Evening Saturday Sunday INBOUND Metro 7.5 min 9 10 min 10 min 30 min min 30 min Tassielink 10 3 trip 5 trips 3 trips No service 6 trips No service OUTBOUND Metro 10 min 10 min 7.5 min 9 30 min min 30 min Tassielink 10 1 trip 5 trips 5 trip No service 6 trips No service Source: Authors, from timetables A number of traffic management improvements could be made to enhance bus operations on the Eastern Shore corridor. It is clear that the largest single bottleneck on the Hobart road network is the Tasman Hwy. The current tidal flow/contra-flow arrangements fail to adequately prioritise higher efficiency vehicles. The introduction of a peak-period, peak-direction bus or high occupancy vehicle (HOV) lane can improve journey times for a large number of commuters, whilst only modestly increasing the trip time for other users. There are three inbound lanes on the highway in the AM peak on approach to the CBD. The right lane is routed into Liverpool St (which is how buses access the Hobart City Interchange), but uses the eastbound carriageway under a contra-flow arrangement between Tasman Bridge and the CBD. This is a potential safety risk, as larger vehicles are likely to cause greater damage in the advent of a head-on collision. The middle lane branches out to Liverpool St, but will cause significant weaving as motorists cross between the left and right lanes, again ruling it out from consideration on safety grounds. The left lane is most suitable, except that it is routed into Davey St, precluding use by buses under the existing network configuration. 910 A possible solution here is to build a right turn from left only queue jump for buses to access Liverpool St from the A3 Tasman Hwy. Whilst this will involve some infrastructure costs and delay motorists travelling into the CBD, it can balance the competing objectives of safety, allocating bus priority and ensuring route integrity. The designation of the left-hand through-lane on the inbound carriageway of the A3 Tasman Hwy at the B32 East Derwent Hwy as a bus or HOV lane will complement this proposal and further improve the flow for priority vehicles. Bus or HOV lanes are more difficult to allocate in the PM peak outbound direction, as buses branching out into the suburbs will need to use both the left and right lanes of the carriageway. However, evidence suggests that the wider PM peak window (arising from the non-coincidence of school and work finishing times) causes less delay, and so there is less urgency and it can be considered as part of a larger package of works. Allocating bus priority on the Tasman Bridge and its approaches will likely bring the greatest benefits for the Eastern Shore corridor. However, additional time savings may be made by restricting the Rosny Park Interchange to buses only (as it originally was at inception), installing better bus priority throughout the Rosny Park town centre, as well as reconfiguring Shoreline Central roads so that both eastbound and westbound buses need not travel in loops to service the stops. This can be done by signalising the intersection of Rokeby Rd and the B33 South Arm Hwy to permit all traffic movements rather than just left in and left out. Perhaps most importantly, designation of a bus or HOV lane on the Tasman Bridge would be a powerful statement about the importance of making more efficient use of congested infrastructure and an assertion of the important role of public transport in achieving this objective. It would be a material contributor, we believe, to building a stronger public transport culture in Hobart. 9 Excludes Routes 605 which operates peak-period, peak-direction only between Shoreline Central, Rosny Park and Glenorchy Interchange. A total of 6 trips are scheduled per working day 10 Tassielink service to Colebrook, Port Arthur and the East Coast only operate along the Eastern Shore corridor as far as Rosny Park Interchange. Some services operate school term or school holidays only 22 Moving People > Bus Industry Confederation Improving public transport service


25 4.7.2 Southern Outlet The A6 Southern Outlet is a limited access dual carriageway that connects Hobart City with the southern town of Kingston. The highway begins at the Davey St/Macquarie St couplet, approximately 1.5 km southwest of the CBD. It crosses mountainous terrain and offers a more direct route to Kingston than the sole alternative of B68 Sandy Bay Rd/Channel Hwy, which is a circuitous single carriageway following the side of Mount Nelson and the Derwent River bank. For this reason, and coupled with strong population growth in Kingston, the A6 Southern Outlet carries a daily average of 33,900 vehicles (2015), a figure that is growing by 3 per cent per annum. The highway features Tasmania s sole bus lane, converted from a breakdown lane which begins on the inbound carriageway 1.7 km north of Olinda Grove, and continues for 700 metres before finishing abruptly 250 metres from Davey St. This is to allow general traffic to enter the left lane and make left turns at both Davey St and Macquarie St (both two way roads from this point on). Bus services follow Davey St/Macquarie St and the A6 Southern Outlet, exiting at the Kingston interchange to join the Channel Hwy. The Kingston Central stops offer poor customer amenities for what are the largest stops in southern Hobart (Figure 12). However, a park and ride facility is provided a short distance from the centre, on a branch where approximately half of services continue south, to offer reasonably frequent services into the Hobart CBD (Figure 13). Figure 12: Kingston Central, an on-road, shared [with general traffic] facility with two bus stops (viewed northbound) Figure 13: Park and ride facility at Kingston, located on Dension St 300 m southwest of Channel Court (viewed northbound) Moving People > Bus Industry Confederation Improving public transport service 23
26 As is evident in Table 6, Metro s service offering for the Southern Outlet is highly peaked, with high frequency in peak times (buses departing every 5 min), but no service in the evenings and on Sundays. Technically, alternative services are available via the B68 Channel Hwy / Sandy Bay Rd, but travel takes up to 10 min longer (28 min compared with 18) than on the A6 Southern Outlet. This represents a peak-first service allocation which offers good services for nine-to-five workers in the CBD at the detriment of commuter classes with other travel patterns (shift workers, students and senior), who may be more likely to use transit (Walker 2012). The Southern Outlet is the only corridor where genuine competition between operators exists. Tassielink is free from any pick up and set down restrictions, frequently conveying Metro customers who have missed their service. Indeed, on Sundays, Tassielink is the only operator of Southern Outlet services, as all Metro services divert via the B68. The integrated ticketing system 11 allows customers to make use of their Metro Greencard on board Tassielink services. However, the fare structures remain separate, the result being that when one reaches their day cap on Metro services, he/ she will continue to be charged by Tassielink as normal for their services. Table 6: Southern Outlet approximate headways for route services by direction, operator and time period AM Peak Inter-Peak PM Peak Evening Saturday Sunday INBOUND Metro 5 min 15 min 15 min No service min No service Tassielink 3 trips 4 trips 3 trips No service 6 trips 6 trips OUTBOUND Metro 15 min 15 min 5 min No service min No service Tassielink 2 trips 4 trips 4 trips 1 trip 6 trips 6 trips Source: Authors, from timetables The abrupt termination of the A6 Southern Outlet bus lane metres from the Davey St/Macquarie St couplet is a major bottleneck for the system. Whilst we recognise the limited space available to widen the road at that section, we believe there are opportunities to reconfigure the intersection to ensure that buses receive full priority through the signal. For example, general left turning movements can be made from the second left lane (shared with through traffic), allowing the leftmost lane to be used as a queue jump for buses. Smart light technology will be required to ensure that the B-phase is able to clear all buses, so that no vehicles remain to obstruct any left turning movements. Although this proposal will add another phase to the signals, as well as slightly reduce throughput at the intersection, it will speed up journeys significantly for bus users from Kingston. The current 700 metre length of the bus lane is generally sufficient, though on rare occasions traffic may be backed up past this point. In such circumstances of bumper-to-bumper traffic, 11 buses could be granted special permission to use the hard shoulder, 12 as is currently allowed on the Eastern Freeway in Melbourne. The Tasmanian government s impending assumption 13 of ownership of the Macquarie St/Davey St couplet represents the first time the state government has taken control of urban arterials, which may increase the opportunity to provide 11 Installed at the expense of Tassielink 12 Shoulder widths vary and may need to be widened on some sections for safe passage 13 Subject to council agreement at the time of print continuous bus lanes along both streets. The couplet, a major cross city route for traffic, has been recognised to be close to or at capacity, though there has been a surprising reduction in traffic over the past year in the order of 1,000-3,500 vehicles per day (Tasmanian Government 2016). To maintain some parking spaces, access for taxis, and to ensure that stopped buses do not block other bus traffic, the bus lane could be designated as the second left lane, as is the case on Sydney s George St (and now Elizabeth St), the busiest northsouth transit corridor in the Sydney CBD. This would benefit not only Kingston customers, but also passengers travelling to and from Sandy Bay, the University of Tasmania, South Hobart, and beyond. Finally, we suggest greater integration between operators, particularly relevant on the A6 Southern Outlet where competing operators supplement each other s services. Moving private operators onto Metro s Greencard is a logical first step, but much more is required in terms of integrating fare structures, coordinating services to minimise connection times and producing joint customer information, which are relevant for the system as a whole, not just one operator. In the Kingston example, for instance, this means reducing the effective fare penalty for choosing different operators for forward and return journeys, better scheduling to ensure that the departures for Metro and Tassielink do not coincide (thereby enhancing effective frequency), and timetables and maps which show both operators services as available. 24 Moving People > Bus Industry Confederation Improving public transport service
27 4.8 Governance Setting strategic transport (including public transport) service priorities, including infrastructure upgrade requirements, means resolving tensions between regional and local level issues, often involving conflicts between movement and place-making. For example, providing for bus priority operation along Main Rd is an effective way to support regional operation of public transport but may have adverse local consequences, such as on businesses that rely on on-street car parking, as illustrated in Figure 12. A way to manage this conflict is to minimise the times for which bus priority is sought and ensure that off-street parking is available in close proximity. The latter seems to be the case along parts of the commercial section of Main Rd. Appropriate governance arrangements can help to tackle these conflicts. Governance arrangements, with respect to the division of responsibilities between various layers of government, should be determined primarily by the incidence of benefits and costs associated with matters of policy concern. Local government currently has responsibility for traffic management along Main Rd. This seems an inappropriate allocation of responsibilities, given that this corridor is the busiest public transport (bus) route in Hobart. In the absence of an LRT or BRT running along the rail line or Brooker Highway, traffic management along Main Rd should be a state responsibility. This would simplify the process of taking decisions of regional significance, such as assuring peakperiod bus priority operation along the entire corridor. Local councils along the route clearly need to be closely engaged in negotiating traffic management solutions but should not have final decision-making responsibility on the major urban public transport corridor. Governance arrangements that support building a public transport culture are integral to success. Responsibility for Main Rd switching to the State Government is part of this process (as is the dedication of a bus or HOV lane on Tasman Bridge, as noted above). More importantly, responsibility for public transport system planning should be accorded a higher priority within the state government. At present, for example, Metro plays the major role in terms of bus system planning, which effectively equates to public transport system planning in the city, and is achieving patronage gains in the process. As a contracted public transport service provider, Metro should not be responsible for public transport network planning. Their responsibility should be at operational level, with input to the strategic planning process. Public transport strategic planning should sit firmly and identifiably in state government, arguably in a Public Transport Authority, whose role is to build a public transport culture in Hobart (or, preferably, Tasmania as whole). This is an important governance issue. It is apparent that Hobart is a car city and lacks a public transport culture. Implementing the strategic land use transport directions set out in the Southern Tasmania Regional Land Use Strategy (STRPP 2013) will not succeed unless there is significant change in this regard. While the car will remain the major personal means of travelling longer distances in Hobart, public transport, walking and cycling need to play greater roles, to ease congestion pressures, support social inclusion and lower the environmental footprint of transport in Hobart. Building a public transport culture is an important part of this transition. It depends substantially on better PT services, which have started in Hobart, and must be supported by operating priority, improved vehicles, stops, information, and so on. Melbourne pursued this path for buses with some vigour between about 2005 and 2010 and achieved a patronage increase of over 30 per cent in a short period. Brisbane and Perth have done likewise, Perth including rail more strongly in the mix. Moving People > Bus Industry Confederation Improving public transport service 25


 have argued that a minimum boarding rate of about 8 passengers per hour is sufficient to economically justify a local bus service, based primarily on the quantified social")
28 5. Public transport service provision in low demand settings With Metro increasingly focused on trunk (patronage-driven) service offerings, what is happening to low patronage local (coverage) bus services? In many outer suburban areas and in many regional settings, population numbers and/or densities may be so low (e.g dwellings per hectare as in Hobart) that it is very difficult to achieve reasonable boarding levels on a network of local public transport services (which will usually be bus services). Stanley and Hensher (2011) have argued that a minimum boarding rate of about 8 passengers per hour is sufficient to economically justify a local bus service, based primarily on the quantified social inclusion benefits from the service. This can be considered in multiples. Thus, for example, if an hourly service attracts 8 or more boardings per hour, this meets the target (anything less than an hourly headway for a capital city route service is of dubious value). If two 30 minute headway services each meet this target, then a 30 minute service would be justified. Individual services can be subjected to this test. If a service fails to meet the benchmark boarding rate, for reasons such as densities being too low, options include: replacing it with a lower cost service (such as smaller buses or taxis; see below) continuing it, particularly if removing the service would lower boarding rates on other services along the route. Smaller buses Capital costs of route buses typically account for about one quarter of total costs. Smaller buses have lower capital costs and, prima facie, might be expected to reduce total service delivery costs. However, international experience suggests that opportunities for downsizing buses are likely to be minimal. UK deregulation, for example, led to an influx of smaller vehicles, most of which have since disappeared, being replaced by larger vehicles on successful routes and removed completely on poorly patronised routes (Professor Chris Nash, University of Leeds, personal communication). Demand responsive/flexible services Demand responsive and flexible transit services are advocated by some analysts in low volume settings. Various evaluations of such schemes have been undertaken and they typically reflect the inherently costly nature of more closely aligning service provision with the requirements of individual clients. Labour primarily drives the cost of various forms of public transport service, because it is the largest cost component. The key to providing cost-effective public transport services in a low patronage setting is thus labour cost, not vehicle cost. Social enterprise model: ConnectU BusVic and the BIC research in Warrnambool, Victoria, showed substantial unmet travel demand from people largely unable to use public transport and without other means of transport. At the same time, that there was a range of underutilised transport assets in the community, particularly community buses and cars. ConnectU, a local social enterprise, commenced providing transport service in October 2012 as a locally initiated response to this research, supported by groups such as BusVic, the Bus Industry Confederation and Warrnambool Bus Lines. To deal with the labour cost problem, ConnectU uses volunteers to provide most of the transport service. It achieved patronage growth of a staggering 17.5 per cent per month compound over its first two years of operation but lack of resources has constrained further growth. The service is a form of costeffective community transport, which provides a solution 26 Moving People > Bus Industry Confederation Improving public transport service


29 to transport for transport disadvantaged people who are unable to use route services. It could take on a larger role, with suitable resourcing, co-ordinating across route, school, community and other local transport needs, which would enable costs to be reduced. Delivering such an outcome primarily depends on achieving: strong community support at the local level, for asset pooling, service integration and use state government encouragement for service integration changes in federal funding arrangements, to support co-ordinated local transport needs facilitation, rather than more narrowly focused transport funding (through, for example, HACC programs). This general approach to service provision in low volume settings is consistent with conclusions reached by the UK House of Commons Transport Committee in its recent report on Passenger transport in isolated communities. That Committee concluded: ambulance and patient transfer operators; school boards and school bus companies; intercity bus companies; taxi operators; and volunteer groups. The level of coordination between agencies should be tailored to local conditions, and can include shared information or referral, joint acquisition and sharing of supplies and services, use of excess capacity, joint use of resources, and centralised services for intake and dispatch. (OMOT 2012, p. 105) The local coordination function should be performed by the entity best placed to do this in any local context. Having local government as a champion is a cornerstone for success, with the range of ways this can be manifest with support for the program. If Metro continues to focus service on high frequency trunk services, as is appropriate, then an approach like ConnectU, extended somewhat, might be an efficient way to support local mobility opportunities. The Tasmanian Government should support trials of this approach, as are currently being progressed in South Australia. Total transport involves pooling transport resources to deliver a range of services. For example, it might involve combining hospital transport with local bus services. That new approach could revolutionise transport provision in isolated communities by making more efficient use of existing resources. We recommend that the DfT initiates a large-scale pilot to test the concept in practice. (UK House of Commons Transport Committee p. 3) A similar approach has been proposed by the Ontario Ministry of Transport: All public transportation services within a community should be coordinated to expand or provide more efficient transit service. This can include coordination between conventional or specialised agencies; long term care agencies; social service agencies; hospitals, Moving People > Bus Industry Confederation Improving public transport service 27
30 6. Conclusions Hobart is a very low density, car dependent city. While land use transport planning in the metropolitan area generally talks about achieving a more compact settlement pattern, development directions are still very strongly geared to low density outer urban growth. The central area is the city s dominant activity hub but the topography, development pattern more broadly and low priority accorded to public transport over time mean that there are only a few major trunk transport corridors serving the centre and a high reliance on the car in those corridors. This setting makes effective and efficient trunk public transport operation problematic, particularly without operating priority. A number of studies have looked at using the old railway line along the northern corridor as a possible light rail corridor, to provide public transport operating priority. However, the lack of proximate customers and circuitous nature of the route mean that this fares poorly in economic terms. Bus rapid transit faces similar challenges. The report concludes that the most cost-effective way to upgrade public transport in Hobart is to improve bus operation along existing arterial roads, with bus priority at peak periods in peak directions, with some possibility of a short section of BRT in the northern corridor on the rail line where it runs close to Main Rd. The analysis suggests that low-hanging fruit, such as clearways (cheap signage) and intersection treatments (queue jumps) can support significant mobility improvements for public transport passengers (10 minute travel savings), without the need to spend large amounts on LRT or a full BRT system in the medium term. This is in accord with the fundamental infrastructure planning principle of making the most efficient use of existing infrastructure before seeking to add to that infrastructure. It also emphasises the importance of infrastructure decisions being informed by cost benefit analysis. When more capital-intensive options are needed, governments should let the analysis indicate the preferred mode, rather than start with a pre-conceived answer. LRT or full BRT over longer distances needs to wait for more evidence of successful transit oriented development (TOD) at scale in the relevant corridor(s). Consultations between state and local governments and the development sector are an early priority in this regard, to chart a pathway to stronger TOD in Hobart. North Hobart to Glenorchy seems likely to be a good opportunity in this regard, which raises questions about the eventual route of a BRT or LRT. While development along the current rail line may help stimulate Macquarie Point regeneration, the off-centre location of this development poses challenges for the most effective trunk public transport route to/from the north. The report has also looked at ways in which existing bus services in the southern and eastern corridors might be improved, to increase patronage, with the associated economic, social and environmental benefits. We have highlighted, in particular, the opportunity for a bus or HOV lane on the Tasman Bridge as a high profile initiative that would stand as a clear and highly visible statement of support for public transport. Upgrading bus services along existing arterial roads, such as the Main Rd corridor, raises governance questions. The report has argued that the major Hobart trunk public transport corridors, which are mainly on arterial roads, should be under state government control, not controlled by local government, to ensure that regional priorities hold sway over local concerns. Ways of minimising regional/local conflict have been suggested, such as use of clearways for a narrow time window. The report also suggests that a public transport authority could be an important way of raising the profile of public transport and helping to build a much-needed public transport culture in Tasmania s towns and cities. Improving peak bus operation to increase public transport use, by getting people out of their cars, poses risks of accentuating an already peaked public transport service, with implications for fleet size and utilisation. One way to reduce risks of accentuating a narrow peak, with the costs this may entail, is to offer public transport fare reductions in the shoulder period, when capacity is available. This would have a minimal impact on Metro revenues but would ease pressures to increase fleet size solely for peak operation, through beneficial effects on peak spreading (as demonstrated in Melbourne and Canberra). The improvements suggested in this report will assist public transport operators providing service within the corridors and those providing services through the corridors under consideration. It has been beyond the scope of the report to suggest other initiatives, outside the corridors of interest, which might assist the latter operators. This is worthy of investigation, because increasing longer distance use of public transport can help to ease traffic pressures and their associated costs in the trunk corridors. In terms of the Tasmanian Government possibly seeking federal funding support for urban public transport improvements, the analysis in this report suggests that a focus on place-making and infrastructure initiatives to support increased mixed-use densities along the main Hobart trunk public transport corridors, plus assistance to implement relatively low cost traffic management improvements, is where the initial priority should be. This requires the federal government to take an integrated land use transport view of urban development and the public transport role therein and to support integrated packages of initiatives that best support city development, with the kinds of public transport initiatives identified in this report being a vital part of the package. In Hobart s case, it could extend to assistance with fleet upgrades, given the high average age of route buses. This approach requires broader thinking than is embedded in simply providing funding support for one-off big infrastructure projects. 28 Moving People > Bus Industry Confederation Improving public transport service
31 Appendix A: Light rail in the northern corridor Light rail to Hobart s northern suburbs has been on the agenda for the better part of the last decade, with various levels of support from major political parties in Tasmania. A number of proposals have been suggested, including running the line to Claremont, Granton, Bridgewater and Brighton, the full length of the discussed railway. Major studies have deemed the final stations to be unviable and today there is only serious consideration for light rail as far as Glenorchy. Over the years, the light rail proposal has been subject to numerous studies, ultimately culminating in a business case that is ACIL Tasman (2013). The business case conducted cost-benefit analyses for four identified options, each with an increasing number of stations built: Option 1 (Fast System): stops at Glenorchy, Moonah and Elizabeth St Option 2 (Northern Focus): stops at Glenorchy, Derwent Park, Moonah and Elizabeth St Option 3 (Suburban Focus): stops at Glenorchy, Derwent Park, Moonah, New Town and Elizabeth St Option 4 (High Access Focus): stops at Glenorchy, Derwent Park, Moonah, New Town, Macquarie Point and Elizabeth St. Some comparative data on each of these four options are summarised in Table A2, contextualised with reference to other light rail systems in Australia either recently opened or currently under construction. The included examples of light rail on the Gold Coast, in Sydney and Canberra are new systems in their own right rather than extensions of an existing system, to offer greater comparability by precluding the network effects which arise in the case of extensions. An exception to this is the Sydney CBD and South East Light Rail which, although complementing the existing Inner West Light Rail, is effectively a new line in its own right (apart from sharing the same operator in the future). Note that some cost information for these projects are commercially sensitive and hence not available in the public domain. The ACIL Tasman (2013) business case suggested construction costs of $70 to $78 million depending on operating model, which is low by Australian standards. This is due to a number of factors, including the existing available alignment (hence no need for property acquisitions), low infrastructure costs associated with the lack of tunnels and bridges required, a limited number of stops and a limited number of light rail vehicles (resulting in relatively high headways). Patronage estimates are 5.2 million passenger boardings 14 in the first year of operations which is a questionable 136 per cent increase on the 2.2 million passengers currently carried by Metro s northern suburb services. In addition, the proposed 15 minute peak headway represents a decrease in current service levels, which currently operate as frequently as a bus every 6-10 minutes. By contrast, the Sydney CBD and South East Light Rail is only assuming a 56 per cent increase in patronage compared with existing bus customers along the corridor (NSW Government 2013). The results show that a three-stop system (Option 1) appears to offer the highest benefit-cost ratio ( Based on the business case figure of 16,450 one way trips per day, annualised by the authors by a factor of ). However, this is reliant on a zero transfer penalty and significant sparks effects to make the investment worthwhile, as discussed in section 4 of the current report. The business case modelled the composition of light rail passengers, with 91 per cent calculated to arrive by feeder bus, 1.1 per cent accessing the station by foot and 7.9 per cent choosing to park and ride (ACIL Tasman 2013, p. 34). The modelling assumed that since bus stops are pervasive across Hobart, this means that it is almost always quicker to get on a bus to access an LRV 15 stop rather than by car, bicycle or foot (ACIL Tasman 2013, p. 33). Wait time uncertainty associated with the poor reliability of buses, the need to pick up and set down passengers en route, and the often circuitous routing of coverage services, which add delays for through-riders, makes this assumption a difficult one to accept. On top of this is the transfer time required when connecting between both within mode or between modes. Even if connection times were finely coordinated, a buffer is generally required between the penultimate and final timing points of a bus route to help ensure reliability. It is not practical for a light rail vehicle to be delayed were an arriving bus to be running late. In addition, connecting times for return journeys from the city to the suburbs would be significantly longer, as it is clearly not the case that feeder buses are being proposed to run so frequently that they can meet every arriving light rail vehicle. Finally, it is operationally inefficient to coordinate every single connection (particularly concurrently in both directions). Buses may be forced to layover longer than required in order to maintain the integrity of connections, and this may lead to a rise in peak vehicle requirements as well as labour costs. For these reasons, a zero transfer penalty as assumed in the business case is a completely unrealistic proposition. The sensitivity analysis in ACIL Tasman (2013) modelled longer transfer penalties and it is clear that, under more realistic scenarios, the light rail proposal is no longer an economically viable venture (Table A1). An additional comment is that transfer penalties cannot merely account for the actual time required to make the connection. This is because passengers are inherently averse to making transfers. Natural experiments conducted during a recent network change (September 2014) in Canberra found, given all else equal, a patronage decline of per cent when customers previously enjoying a oneseat ride were now forced to make a connection for the same journey (Wong 2014). The business case s benefit-cost ratio for Option 1 is dependent upon a 20 per cent sparks effect, which seeks to capture the community s inherent preference for railbased transport over bus-based modes. This preference has been well documented for decades (Hensher 1999), and has translated into higher patronage forecasts, and greater land value increases assumed for light rail projects. In the Gold Coast, for example, supporters now argue how the light rail system has morphed into a tourist icon, helping to support economic activity in the region. Too often, however, analysts have spruiked these wider economic benefits, including on tourism and development, as though they were the major end goal of mass transit. If the objective of government is to boost tourism and development, then cost-benefit analyses must be undertaken to determine whether building a transport project is more cost effective than other forms of investment (as an example, in tax concessions and community infrastructure) to support tourism and development. 15 Light rail vehicle Moving People > Bus Industry Confederation Improving public transport service 29
32 Table A1: Benefit-cost ratio sensitivity analysis for alternate transfer penalties Five minutes Two minutes One minute Zero minutes Benefit-Cost Ratio 4% % % Net Present Value 4% -$83,453,527 -$25,251,088 $8,309,913 $44,326,000 7% -$75,710,900 -$37,231,886 -$14,998,119 $8,706,000 10% -$69,572,184 -$42,687,482 -$27,121,490 -$10,635,000 Internal Rate of Return N/A 1% 5% 8% Source: ACIL Tasman (2013, p. 33) The low level of walk-up customers (1.1 per cent) is symptomatic of the lack of catchment along the proposed light rail corridor. As discussed in section 4, there are few residential developments and virtually no major trip attractors along the light rail route, and the current growth trajectory favouring greenfield developments in the south (Kingston) and far north (Austins Ferry and beyond) are of little help. The Gold Coast light rail, by contrast, is located within walking distance to more than 20 per cent of Gold Coast residents, as well as the hotels of 50,000-60,000 tourists (GoldLinQ 2008, p. 18). The Gold Coast is a highly linear city with many trip attractors on the corridor, including a hospital, university, and three major urban centres, resulting in a 25 per cent increase in public transport usage (both light rail and buses) one year after opening (July 2014). Even Canberra, one of the most heavily sprawled cities in the world, has been concentrating development along the Capital Metro corridor (Figure A1), to build density along its frequent network first introduced in Transport for Canberra (ACT Government 2012), making the corridor a more viable candidate for light rail. The experience of Canberra in its journey towards light rail is proving to be an excellent comparison with the current debates in Hobart. Canberra is also a sprawling, low density city with a similar population to Hobart, and has been reliant on buses as the only mode of public transport, whose mode share (7.8 per cent compared with 6.4 per cent for Hobart in 2011) has been stagnant for decades. Like Hobart, Canberra s economic structure also features a large proportion of university students and public servants, though it differs in that the city is experiencing a far higher rate of population growth than Hobart. An LRT/BRT debate has emerged in recent years, primarily along the Gungahlin- City (Capital Metro) corridor. Both major parties have toyed with the idea of light rail, particularly gaining prominence in the lead up to territory elections. It was only with the 2012 Parliamentary Agreement between ACT Labor (in minority government) and Green crossbencher Shane Rattenbury that a firm commitment to build light rail was made. This political decision, rather than a rational debate based on transport needs, exemplifies the choice versus blind commitment analogy introduced in Hensher (1999). The business case for Capital Metro boasted a benefit-cost ratio of 1.2 (ACT Government 2014: 103), of which a high component were land use and wider economic benefits. Many commentators have criticised their inclusion, most recently the Grattan Institute through its latest report Roads to riches: Better transport investment : The business case for Canberra light rail, published in 2014, reported an estimated business cost ratio of 1.2. However, land use benefits and wider economic impacts, which are typically excluded from project evaluations by Infrastructure Australia because the risks of overestimating them are so high, account for almost three fifths of the projected benefits. If these land use benefits and wider economic impacts are excluded, the benefit-cost ratio is just 0.5 well below the level needed to deliver a net benefit to the community. (Terrill, Emslie and Coates 2016, p. 42) The uncanny similarity with the experience so far in Hobart is telling. Given the tendency for recent infrastructure appraisals to be very optimistic on the scale of wider economic benefits, we believe a benefit-cost ratio close to one on the transport component should be required, including social inclusion benefits, before wider economic benefits are included, to highlight the role played by the latter in making the economic case. Wider economic benefits are a legitimate addition but should be treated with suspicion if they exceed about onethird of the size of the transport benefits. The future success of Capital Metro in Canberra, given its history, will be an important lesson for Hobart. Canberra also faces major institutional challenges in its transport cluster as previous planning decisions had sat within the operator and there was a strong disconnect between government policy and implementation. A range of reforms in this space, including establishment of a new integrated transport agency Transport Canberra come July 2016, is a widely applauded move. We have suggested this as an appropriate way forward for Tasmania too (see Section 4.8). 30 Moving People > Bus Industry Confederation Improving public transport service
 The engineering assessment in ACIL Tasman (2013) discussed a range of cost inputs relating to rail gauge, track replacement and the procurement of rolling stock.")
33 Figure A1: Population density within 500 m of Canberra s Capital Metro corridor in (Source: ACT Government 2014, p. 61) The engineering assessment in ACIL Tasman (2013) discussed a range of cost inputs relating to rail gauge, track replacement and the procurement of rolling stock. Many light rail proponents have argued that presence of the existing tracks permit significant cost savings, which allow light rail to be competitive with bus-based rapid transit. However, the existing tracks have been deemed unsuitable (sinking?) for passenger rail, especially at higher speeds. A full track replacement has been recommended by the business case, with the option to widen the present narrow gauge (1067 mm) to a standard gauge (1435 mm) 16. Although this would incur a higher capital cost at the outset, it would allow savings in the procurement of off the shelf or second-hand light rail vehicles, suitable to the operating environment of Hobart. Although some light rail manufactures do produce vehicles for the metre gauge (1000 mm), an estimated premium of 10 per cent of the vehicle cost will be incurred for modification to Hobart s 1067 mm gauge. What is missing from the analysis of LRT and BRT in the northern corridor is consideration of a hybrid alignment, using the heavy rail corridor between Glenorchy and New Town High School, before switching to New Town Rd / Elizabeth St (perhaps using Bromby St) for the remainder of the journey into Hobart CBD. This would avoid the circuitous route along Derwent River, where tight turning radii will restrict LRT operations to 40 km/h or less, as well as expand the catchment for the service. The authors believe that although this would deliver more benefits for the LRT, it will also cost significantly more than any of the four options proposed in ACIL Tasman (2013). This is based on current experience from Newcastle (NSW), where a primarily on-road route has been selected for light rail, rather than using the recently closed heavy rail corridor, an outcome which will cost an additional $100 million. Part of the reason for this, we believe, is to facilitate a sale of the former rail corridor (prime harbourfront real estate). 16 All light rail systems in Australia operate to standard gauge, including in Melbourne, where heavy rail runs to a broad gauge (1600 mm) Moving People > Bus Industry Confederation Improving public transport service 31
34 Table A2: Comparison of light rail projects recently opened or currently under construction in Australia with the four operating parameters proposed for Hobart (ACIL Tasman 2013, ACT Government 2014, GoldLinQ nd, NSW Government 2013) Gold Coast Sydney Canberra Hobart (Option 1) Hobart (Option 2) Hobart (Option 3) Hobart (Option 4) DESCRIPTION Name G:link CBD and South East Light Rail Capital Metro Fast System Northern Focus Suburban Focus High Access Focus Consortium (Lead Operator) GoldLinQ (Keolis Downer) ALTRAC (Transdev) Canberra Metro (Deutsche Bahn) Opening Jul-14 Early Length 13 km 12 km 12 km 8.6 km 8.6 km 8.6 km 8.6 km Stops Fleet Size Vehicle Capacity Peak Headway 7.5 min 4 min (trunk), 8 min (branch) 6 min 15 min 15 min 15 min 15 min Annual Patronage 6.18 million ( ) 31.4 million (2021) 4.8 million (2021) 5.2 million 18??? COST PROJECTIONS Total Cost $1.2 billion ( 14) $1.6 billion ( 13) $823 million ( 14) $74 million ( 13) $74.3 million ( 13) $74.7 million ( 13) $82.7 million ( 13) Price/km $92 million ( 14) $133 million ( 13) $69 million ( 14) $8.6 million ( 13) $8.6 million ( 13) $8.7 million ( 13) $9.6 million ( 13) Capex N/A N/A $619 million ( 14) $71.3 million ( 13) $71.6 million ( 13) $72.0 million ( 13) $79.7 million ( 13) Opex N/A N/A $204 million $2.7 million $2.7 million $2.7 million $3.0 million ( 14) 19 ( 13) 20 ( 13) 20 ( 13) 20 ( 13) 20 BENEFIT-COST RATIO Transport N/A ???? Wider Benefits N/A Total Total stops for the system, which includes two branches (10 stops on the trunk, 5 stops on the Kingsford branch and 4 stops on the Randwick branch) 18 Based on the business case figure of 16,450 one way trips per day in the first year of operations, annualised by the authors by a factor of Whole of life, extending 30 years from the anticipated commencement of operations 20 Annual operational and maintenance costs combined (effective for years 1-5 of operations) 32 Moving People > Bus Industry Confederation Improving public transport service
35 Appendix B: Transit corridors The Main Rd corridor provides Hobart s best opportunity to develop a transit corridor in the city. Transit corridors are areas adjacent to trunk public transport routes that link the major nodes within an urban area or which the private development market has chosen as suitable for higher density development, extending metres laterally from those routes, depending on the public transport service level (faster trunk services with dedicated right of way are consistent with longer walk distances). The corridors should include a mix of land uses and the Vancouver experience shows that they are major opportunity areas for accommodating urban growth in an efficient manner, by corridor infill. Key land use considerations for local/state authorities in relation to transit corridors include the following: transit corridors should be identified and formally included in a city s strategic land use transport plan and in the relevant local authority plans, with target development densities specified and indicative achievement dates, depending on the significance of the particular corridors such corridors will typically be along arterial roads, like Main Rd, which means a focus on allocating decision-making responsibility for traffic management and resolving competing demands for use (e.g. between movement and place-making) nodes should be planned where transit corridors intersect and these should have a focus on mixeduse intensification corridors should include a full range of main street type uses, such as retail, cultural, personal services, institutional, office, active and passive recreation (places to sit and observe), together with residential, and permeability along the building line should be high (i.e. an absence of barrier effects along the building), to encourage walkability and associated public transport use densities and building types along the corridor should integrate with the scale and intensity of the local neighbourhoods and development should encourage greater integration between areas on both sides of the trunk public transport route, rather than forming a barrier to interaction (requiring specific local initiatives for achievement) provision for affordable housing and social/ community infrastructure should be included. Moving People > Bus Industry Confederation Improving public transport service 33
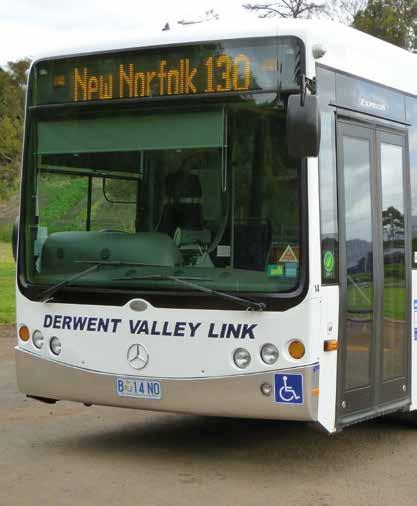
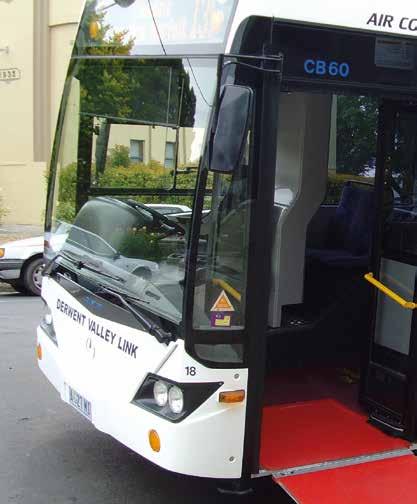
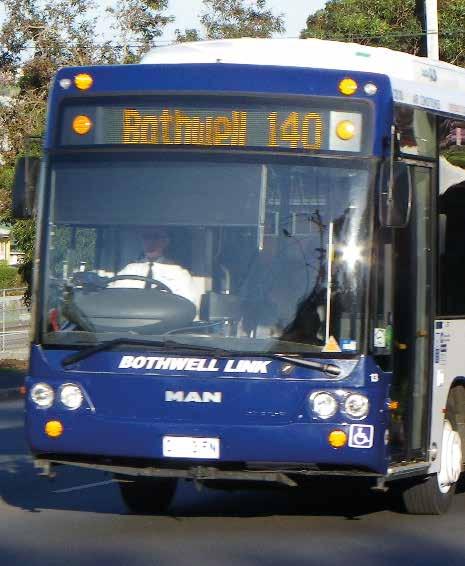
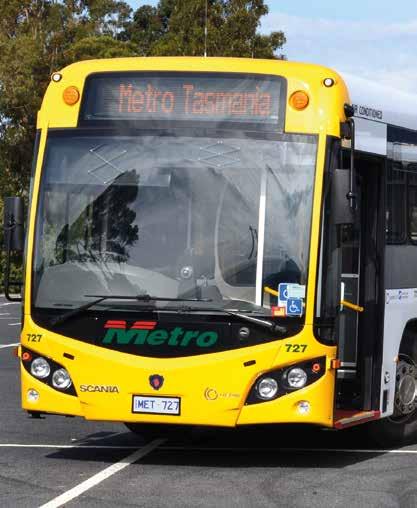
36 34
37 References ACIL Tasman (2011), Hobart to Northern Suburbs Light Rail Business Case, Prepared for the Department of Infrastructure, Energy and Resources, July. ACIL Tasman (2013), Stage 1 Light Rail Business Case: Hobart to Glenorchy, Report prepared for the Department of Infrastructure, Energy and Resources, May. ACT Government (2012), Transport for Canberra: Transport for a Sustainable City , Canberra, Australia. ACT Government (2014), Capital Metro: Full Business Case, Canberra, Australia. Australian Council of Learned Academies (2015), Delivering sustainable urban mobility: Final report, October, accessed 28 April 2016 at FullReport_web.pdf Bento, A.M., Cropper, M.L., Mobarak, A.M. and Vinha K. (2005). The Effects of Urban Spatial Structure on Travel demand in the United States, The Review of Economics and Statistics, vol. 87, no. 3, pp Cervero, R (2014), Land use/transport integration: implications for infrastructure in North American and Australian cities, in Stanley, J and Roux, A (eds) Infrastructure for 21st century Australian cities: Papers from the ADC Forum National Infrastructure and Cities Summit, Melbourne: ADC Forum. Eddington, R. (2006), The Eddington Transport Study Main Report: Transport s Role in Sustaining the UK s Productivity and Competitiveness, Norwich, United Kingdom. Ewing, R. and R. Cervero (2010), Travel and the built environment, Journal of the American Planning Association, vol. 76, no. 3, pp GoldLinQ (2008), Gold Coast Rapid Transit: In Brief Draft Concept Design and Impact Management Plan October 2008, Gold Coast, Australia. GoldLinQ (nd), Gold Coast Rapid Transit Concept Design Impact Management Plan: Volume 2 Chapter 11 Economic Environment, Gold Coast, Australia. Hensher, D. A. (1999), A bus-based transitway or light rail? Continuing the saga on choice versus blind commitment, Road & Transport Research, vol. 8, no. 3, p Hensher, D. A. (2007), Sustainable public transport systems: Moving towards a value for money and network-based approach and away from blind commitment, Transport Policy, vol. 14, no. 1, pp Hobart City Council (2009), Sustainable transport strategy , Hobart: Hobart City Council. Infrastructure NSW (2014), State Infrastructure Strategy Update 2014, Sydney, Australia. Infrastructure Tasmania (2016), Review of a proposed light rail system in Hobart: Final advisory report, January, accessed 20 April at data/assets/ pdf_file/0004/129613/light_rail_strategy_ pdf NSW Government (2013), CBD and South East Light Rail: Business Case Summary, Sydney, Australia. ITDP (2014), The BRT Standard, Institute for Transportation and Development Policy, New York, United States. Ontario Ministry of Transport (2012), Transit Supportive Guidelines. Ministry of Transportation. Government of Ontario. PWC (2014), Riverline Hobart Light Rail Strategic Assessment, Report prepared for Department of Infrastructure, Energy and Resources, March. Southern Tasmania Regional Planning Project (2013), Southern Tasmania Regional Land Use Strategy , as amended 1 October 2013, accessed 20 April 2016 at land_use_strategy_2013_amended_8thnov_web.pdf Stanley, J. and Hensher, D. (2011). Economic modelling, in G. Currie (ed.) New perspectives and methods in transport and social exclusion research, Bingley, UK: Emerald. Stanley, J., Hensher, D., Stanley, J.R., & Vella-Brodrick D. (2011). Mobility, social exclusion and well-being: Exploring the links, Transportation Research Part A, vol. 45, no. 8, pp Stanley, J.K., Stanley J.R., & Hensher, D. (2012). Mobility, Social Capital and Sense of Community: What Value?. Urban Studies, vol. 49, no. 16, pp Stanley, J. and Brain P. (2015). Delivering sustainable urban mobility: Economic perspectives, Report prepared for the Australian Council of Learned Academies, February. Stanley, J., Stanley, J. and Davis, S. (2015), Connecting neighbourhoods: The 20 minute city, Bus and Coach Industry Policy Paper 4, Canberra: Bus Industry Confederation. Tasmanian Government (2011), Glenorchy to Hobart CBD Transit Corridor: High level review of corridor options, Hobart, Australia. Tasmanian Government (2012), Tasman Highway Tasman Bridge Eastern Approaches Upgrade, Hobart, Australia. Tasmanian Government (2014a), Main Road Draft Transit Corridor Plan: Bus Priority information sheet, Hobart, Australia. Tasmanian Government (2014b), Main Road Draft Transit Corridor Plan: Bus Stop Optimisation information sheet, Hobart, Australia. Tasmanian Government (2014c), Main Road Draft Transit Corridor Plan: On-street Car Parking information sheet, Hobart, Australia. Tasmanian Government (2016), Hobart Congestion Traffic Analysis 2016, Hobart, Australia. Terrill, M., Emslie, O. and Coates, B. (2016), Roads to riches: Better transport investment, Grattan Institute, Melbourne, Australia. UK House of Commons Transport Committee (2014), Passenger Transport In Isolated Communities. cmtran/288/288.pdf. Viewed 7th August Walker, J. (2008), Purpose-driven public transport: creating a clear conversation about public transport goals, Journal of transport geography, vol. 16, no. 6, pp Walker, J. (2012), Human Transit: How Clearer Thinking about Public Transit Can Enrich Our Communities and Our Lives, Island Press, Washington, D.C. Wong, Y. (2014), ACTION Network Review: A Comparative Study of Network 12 and Network 14, Australian National Internships Library, Australian National University, Canberra, Australia. 35
38 36 Moving People > Bus Industry Confederation Improving public transport service

39 BUS INDUSTRY CONFEDERATION PO Box 6171, KINGSTON ACT 2604 Tel: Fax: enquiries@bic.asn.au Web:
5 Rail demand in Western Sydney
 5 Rail demand in Western Sydney About this chapter To better understand where new or enhanced rail services are needed, this chapter presents an overview of the existing and future demand on the rail network
TOWN PLANNING SUBMISSION TO THE GREATER SYDNEY COMMISSION LANDS AT ARTARMON
 TOWN PLANNING SUBMISSION TO THE GREATER SYDNEY COMMISSION LANDS AT ARTARMON March 2017 TABLE OF CONTENTS 1.0 INTRODUCTION 3 2.0 THE SUBJECT SITE 4 3.0 STRATEGIC PLANNING CONTEXT 6 4.0 SUMMARY AND CONCLUSIONS
CHRISTCHURCH MOTORWAYS. Project Summary Statement February 2010
 CHRISTCHURCH MOTORWAYS Project Summary Statement February 2010 Table of Contents 1. Purpose of Document 2. Strategic Context 3. Benefits 4. Project Scope and Economics 5. Implementation Plan 1 ROADS OF
ALL ABOARD LABOR S LONG TERM PASSENGER TRANSPORT STRATEGY
 ALL ABOARD LABOR S LONG TERM PASSENGER TRANSPORT STRATEGY Revitalising Passenger Transport Increasing traffic congestion in our cities and a lack of transport services in our regional towns is frustrating
Kilometres. Blacktown. Penrith. Parramatta. Liverpool Bankstown. Campbelltown
 0 5 10 15 20 Kilometres Penrith Blacktown Parramatta Liverpool Bankstown Campbelltown accessibility outcomes Legend Outcomes targeted in Western Sydney are: public transport that is accessible throughout
Report to: Greater Cambridge Partnership Joint Assembly 18 January A10 Foxton level crossing bypass and travel hub
 Report to: Greater Cambridge Partnership Joint Assembly 18 January 2018 Lead officer: Chris Tunstall GCP Director of Transport A10 Foxton level crossing bypass and travel hub 1. Purpose 1.1 The list of
WELLINGTON $422 MILLION $614 MILLION $83 MILLION 22% SPEND $1.9 BILLION
 WELLINGTON WELLINGTON $1.9 BILLION FORECAST TOTAL WELLINGTON INVESTMENT The Wellington region s transport challenges are dominated by the region s concentration of population in the metropolitan cities,
Draft Greater Sydney Region Plan
 Powered by TCPDF (www.tcpdf.org) Draft Greater Sydney Region Plan Submission_id: 31119 Date of Lodgment: 12 Dec 2017 Origin of Submission: Online Organisation name: Serapark Pty Ltd Organisation type:
FUTURE TRANSPORT STRATEGY AND GREATER SYDNEY SERVICES AND INFRASTRUCTURE PLAN. Western Parkland City
 FUTURE TRANSPORT STRATEGY AND GREATER SYDNEY SERVICES AND INFRASTRUCTURE PLAN Western Parkland City 2 Transport for NSW Future Transport Strategy and Greater Sydney Services and Infrastructure Plan Western
Draft Western District Plan
 Powered by TCPDF (www.tcpdf.org) Draft Western District Plan Submission_id: 31732 Date of Lodgment: 15 Dec 2017 Origin of Submission: Online Organisation name: APP Corporation Pty Ltd Organisation type:
NSW PRE-BUDGET STATEMENT FUTURE ECONOMY FUTURE JOBS
 2017-18 NSW PRE-BUDGET STATEMENT FUTURE ECONOMY FUTURE JOBS Executive Summary The 2017-18 NSW State Budget presents an opportunity for the NSW Government to future-proof the tourism and transport sectors.
PREFACE. Service frequency; Hours of service; Service coverage; Passenger loading; Reliability, and Transit vs. auto travel time.
 PREFACE The Florida Department of Transportation (FDOT) has embarked upon a statewide evaluation of transit system performance. The outcome of this evaluation is a benchmark of transit performance that
Public Transport for Perth in 2031
 South West Group Submission Public Transport for Perth in 2031 October 2011 South West Group Vision and Mission Local Governments in South Metropolitan Perth, through cooperation with industry, community
PO Box 257 PO Box 257 PARRAMATTA NSW 2124 PARRAMATTA NSW 2124
 31 March 2017 Sean O Toole Sheridan Dudley District Commissioner - West District Commissioner - South West Greater Sydney Commission Greater Sydney Commission PO Box 257 PO Box 257 PARRAMATTA NSW 2124
Submission to Infrastructure Victoria s Draft 30-Year Infrastructure Strategy
 Submission to Infrastructure Victoria s Draft 30-Year Infrastructure Strategy 1. Introduction This submission is a response to Infrastructure Victoria s assessment of the need to construct a heavy rail
PLANNING THE SUNBURY GROWTH CORRIDOR
 SUNBURY GROWTH CORRIDOR NOVEMBER 2016 PLANNING THE SUNBURY GROWTH CORRIDOR Sunbury Planning Background The Victorian Planning Authority, in consultation with Hume City Council, is undertaking a number
South East Traffic Solution
 South East Traffic Solution A MAJORITY LIBERAL GOVERNMENT WILL: Complete the Hobart Airport Interchange project Fix the Tasman Highway near Tasmania Golf Club Replace the Midway Point Roundabout with additional
Delivering better bus services for regional centres in Southern Tasmania
 Delivering better bus services for regional centres in Southern Tasmania A MAJORITY LIBERAL GOVERNMENT WILL: Double bus services between Sorell and Hobart on week days Double bus services between Margate
A TRANSPORT SYSTEM CONNECTING PEOPLE TO PLACES
 THE MAYOR'S VISION FOR TRANSPORT A TRANSPORT SYSTEM CONNECTING PEOPLE TO PLACES VISION We will build a transport system that works for everyone, connecting people to the places they want to go within the
Sunshine Coast Council Locked Bag 72 Sunshine Coast Mail Centre QLD Submitted via online portal. 2 June 2017.
 Sunshine Coast Council Locked Bag 72 Sunshine Coast Mail Centre QLD 4560 Submitted via online portal 2 June 2017 Dear Sir /Madam, RE: DRAFT ENVIRONMENTAL AND LIVEABILITY STRATEGY The Green Building Council
Roundhouse Way Transport Interchange (Part of NATS City Centre Package)
") Roundhouse Way Transport Interchange (Part of NATS City Centre Package) 15/16 16/17 17/18 18/19 19/20 Total TOTAL COST Roundhouse Way Transport Interchange 0.5m 0.5m FUNDING CIL 0.05m 0.05m Growth Deal
Roundhouse Way Transport Interchange (Part of NATS City Centre Package) 15/16 16/17 17/18 18/19 19/20 Total TOTAL COST Roundhouse Way Transport Interchange 0.5m 0.5m FUNDING CIL 0.05m 0.05m Growth Deal
4 Transport projects underway in Western Sydney
 4 Transport projects underway in Western Sydney About this chapter This chapter provides an overview of the Australian and NSW government s significant investments in road, bus and rail infrastructure
CITY OF MELBOURNE 10 Year Financial Plan People s Panel Report. 8 November 2014
 CITY OF MELBOURNE 10 Year Financial Plan People s Panel Report 8 November 2014 The Panel s Decision Making Principles 1. SMART (Specific, Measurable, Achievable, Realistic, Timely) 2. Sustainable 3. Forward
CRITICAL FACTORS FOR THE DEVELOPMENT OF AIRPORT CITIES. Mauro Peneda, Prof. Rosário Macário AIRDEV Seminar IST, 20 October 2011
 CRITICAL FACTORS FOR THE DEVELOPMENT OF AIRPORT CITIES Mauro Peneda, Prof. Rosário Macário AIRDEV Seminar IST, 20 October 2011 Introduction Airports are becoming new dynamic centres of economic activity.
8 CROSS-BOUNDARY AGREEMENT WITH BRAMPTON TRANSIT
 8 CROSS-BOUNDARY AGREEMENT WITH BRAMPTON TRANSIT The Transportation Services Committee recommends the adoption of the recommendations contained in the following report dated May 27, 2010, from the Commissioner
Agenda Item 5: Rail East Midlands Rail Franchise Consultation
 Strategic Transport Forum 15 th September 2017 Agenda Item 5: Rail East Midlands Rail Franchise Consultation Recommendation: It is recommended that the Forum agree (subject to any amendments agreed by
Why does Sydney need a new fast Metro to the West? A fast Metro to the west is a vital component of this Plan
 Why does Sydney need a new fast Metro to the West? (as shown in 10,000 Friends of Greater Sydney Stage 1 Rail Plan) The Stage 1 Rail Plan was developed to support an integrated transport plan that would
East Lancashire Highways and Transport Masterplan East Lancashire Rail Connectivity Study Conditional Output Statement (Appendix 'A' refers)
") Report to the Cabinet Member for Highways and Transport Report submitted by: Director of Corporate Commissioning Date: 1 June 2015 Part I Electoral Divisions affected: All East Lancashire Highways and
Report to the Cabinet Member for Highways and Transport Report submitted by: Director of Corporate Commissioning Date: 1 June 2015 Part I Electoral Divisions affected: All East Lancashire Highways and
N4 Carrick-on-Shannon to Dromod Road Project. 2.1 Introduction
 Chapter 2 Need for the Scheme 2.1 Introduction The National Primary Route N4, Dublin to Sligo is a strategic corridor from Dublin to the northwest and border counties (See RCSR 101 in Volume 2). The National
PCAL Case Study Retail Areas: Rouse Hill Town Centre
 PCAL Case Study Retail Areas: Rouse Hill Town Centre Introduction Rouse Hill Town Centre is a new mixed use development on a greenfield site in Sydney s North West. It has been planned to be a major hub
A. CONCLUSIONS OF THE FGEIS
 Chapter 11: Traffic and Parking A. CONCLUSIONS OF THE FGEIS The FGEIS found that the Approved Plan will generate a substantial volume of vehicular and pedestrian activity, including an estimated 1,300
ENVIRONMENT ACTION PLAN
 ENVIRONMENT ACTION PLAN 2015 16 Airservices Australia 2015 This work is copyright. Apart from any use as permitted under the Copyright Act 1968, no part may be reproduced by any process without prior written
EAST WEST RAIL EASTERN SECTION. prospectus for growth
 EAST WEST RAIL EASTERN SECTION prospectus for growth September 2018 executive summary The East West Rail Consortium, a partnership of local authorities, rail operators and Network Rail, continues to promote
JOINT CORE STRATEGY FOR BROADLAND, NORWICH AND SOUTH NORFOLK EXAMINATION MATTER 3C EASTON/COSTESSEY
 Matter 3C Easton/Costessey Representor No. 8826 JOINT CORE STRATEGY FOR BROADLAND, NORWICH AND SOUTH NORFOLK EXAMINATION MATTER 3C EASTON/COSTESSEY SUBMISSION ON BEHALF OF TAYLOR WIMPEY DEVELOPMENTS AND
Figure 3: Global Sydney. Draft Metropolitan Strategy for Sydney. North Sydney CBD. Second Harbour Crossing. Walsh Bay Arts Precinct.
 Newtown Glebe Macdonaldtown Pyrmont Ultimo Sydney International Convention, Exhibition & Entertainment Precinct Sydney Education & Health Erskineville Figure 3: Global Sydney Waterloo Second Harbour Crossing
SYDNEY S SECOND AIRPORT
 COLLIERS RADAR SYDNEY S SECOND AIRPORT The Catalytic Effect of Transport Infrastructure By Sass J-Baleh Manager Research sass.jbaleh@colliers.com Summary Industrial land values across the Sydney markets
State Road Upgrades Southern Region
 State Road Upgrades Southern Region A MAJORITY LIBERAL GOVERNMENT WILL: Undertake an historic reset of roads and traffic management in Southern Tasmania taking roads to the next level. Underpin the extraordinary
Sustainable Urban Development. Presentation to WVCC 1 December 2010
 Sustainable Urban Development Presentation to WVCC 1 December 2010 Introduction Paul Carmody Hindmarsh (Consultation Manager) Tony Adams CB Richard Ellis (Planners) Simon Parsons PTW (Architects) Brett
Wellington $312 $49 $456 OVERVIEW WELLINGTON REGIONAL SUMMARY
 National Land Transport Programme 2015 18 Wellington WELLINGTON REGIONAL SUMMARY OVERVIEW The Wellington region is made up of a number of cities, urban areas and supporting rural hinterland. The city is
RIVERLINESTAGEONE ATASMANIANGRENS POLICYINITIATIVE. LaunchedbyNickMcKimMP March2014. AuthorisedbyNickMcKimMP,ParliamentHouse,Hobart
 RIVERLINESTAGEONE ATASMANIANGRENS POLICYINITIATIVE LaunchedbyNickMcKimMP March2014 AuthorisedbyNickMcKimMP,ParliamentHouse,Hobart ` > YOUR TEAM IN STATE PARLIAMENT > WANT MORE INFO? State Parliamentary
Airport forecasting is used in master planning to guide future development of the Airport.
 Airport Forecasts Airport forecasting is used in master planning to guide future development of the Airport. 4.1 INTRODUCTION Airport forecasting ensures development is appropriate for passengers, ground
Update on the Thameslink programme
 A picture of the National Audit Office logo Report by the Comptroller and Auditor General Department for Transport Update on the Thameslink programme HC 413 SESSION 2017 2019 23 NOVEMBER 2017 4 Key facts
Like many transit service providers, the Port Authority of Allegheny County (Port Authority) uses a set of service level guidelines to determine
 uses a set of service level guidelines to determine") Transit service consists of two fundamental elements: frequency (how often service operates) and service span (how long service runs during the day). Combined, these two factors measure how much service
Transit service consists of two fundamental elements: frequency (how often service operates) and service span (how long service runs during the day). Combined, these two factors measure how much service
Australian Government s Select Committee Inquiry into Regional Development and Decentralisation
 Australian Government s Select Committee Inquiry into Regional Development and Decentralisation Author: Kevin Turner Level of Which Submission Chief Executive Officer, RDA Tasmania Has Been Authorised:
Macleod Trail Corridor Study. Welcome. Macleod Trail Corridor Study Open House. Presentation of Proposed Design Concepts
 Macleod Trail Corridor Study Welcome Macleod Trail Corridor Study Open House Presentation of Proposed Design Concepts Study Purpose Develop a corridor plan for Macleod Trail that aligns with The City s:
Gold Coast. Rapid Transit. Chapter twelve Social impact. Chapter content
 Gold Coast Rapid Transit Chapter twelve Social impact Chapter content Social impact assessment process...235 Existing community profile...237 Consultation...238 Social impacts and mitigation strategies...239
METROBUS SERVICE GUIDELINES
 METROBUS SERVICE GUIDELINES In the late 1990's when stabilization of bus service was accomplished between WMATA and the local jurisdictional bus systems, the need for service planning processes and procedures
OBJECTION TO AMENDMENT TO PLANNING SCHEME AND GRANTING OF PLANNING PERMIT
 PLANNING AND ENVIRONMENT ACT 1987 OBJECTION TO AMENDMENT TO PLANNING SCHEME AND GRANTING OF PLANNING PERMIT AMENDMENT C32 APPLICATION 0873/02 Public Transport Users Association Inc. 247-249 Flinders Lane
https://gsc-public-1.s3-ap-southeast-2.amazonaws.com/s3fs-public/draft-eastern-city-district-plan.pdf
 GSC Sydney East Rev Draft -references Port Botany - 30 https://gsc-public-1.s3-ap-southeast-2.amazonaws.com/s3fs-public/draft-eastern-city-district-plan.pdf Pages 6. The District s freight routes, particularly
CAIRNS RECTANGULAR PITCH STADIUM NEEDS STUDY PART 1 CAIRNS REGIONAL COUNCIL DRAFT REPORT SEPTEMBER 2011
 CAIRNS RECTANGULAR PITCH STADIUM NEEDS STUDY PART 1 CAIRNS REGIONAL COUNCIL DRAFT REPORT SEPTEMBER 2011 CAIRNS RECTANGULAR PITCH STADIUM NEEDS STUDY PART 1 Cairns Regional Council September 2011 Coffey
AUCKLAND $1.2 BILLION $1.9 BILLION $149 MILLION 15% SPEND $5.7 BILLION
 AUCKLAND AUCKLAND $5.7 BILLION FORECAST TOTAL AUCKLAND INVESTMENT The next 10 years are expected to underline Auckland s performance as the fastest growing major city in Australasia. The city is expected
November 11, 2009 BY . Planning and Growth Management Department 110 Laurier Avenue West, 4 th Floor Ottawa, Ontario K1P 1J1. Dear Mr.
 November 11, 2009 Planning and Growth Management Department 110 Laurier Avenue West, 4 th Floor Ottawa, Ontario K1P 1J1 BY E-MAIL Attention: Mr. Don Herweyer Dear Mr. Herweyer: Reference: Abbott-Fernbank
Llandudno Junction. Regeneration Proposals for the Future. December 2009
 Llandudno Junction Regeneration Proposals for the Future December 2009 Llandudno Junction - Vision Statement 1 Purpose 1.1 The purpose of this document is to describe key priorities to support the regeneration
These elements are designed to make service more convenient, connected, and memorable.
 Transit is most attractive when it is frequent enough that people don t need to consult a timetable, and can instead just go to a stop and know that the train or bus will arrive shortly. Nearly all major
Major Scheme Business Case Summary Report for Programme Entry
 Paper A Heart of South West Local Transport Board Major Scheme Business Case Summary Report for Programme Entry M5 Junction 25, Taunton July 2016 1 SCHEME SUMMARY Scheme Name M5 Junction 25, Taunton Date
AUSTRALIAN TRAVEL TIME METRIC 2017 EDITION
 AUSTRALIAN TRAVEL TIME METRIC 217 EDITION For more information please contact: Brendan Lyon Chief Executive Officer Infrastructure Partnerships Australia Suite 3.3, Level 3, 9 Pitt Street Sydney NSW 2
Measure 67: Intermodality for people First page:
 Measure 67: Intermodality for people First page: Policy package: 5: Intermodal package Measure 69: Intermodality for people: the principle of subsidiarity notwithstanding, priority should be given in the
THE ECONOMIC IMPACT OF NEW CONNECTIONS TO CHINA
 THE ECONOMIC IMPACT OF NEW CONNECTIONS TO CHINA A note prepared for Heathrow March 2018 Three Chinese airlines are currently in discussions with Heathrow about adding new direct connections between Heathrow
Guildford Borough Transport Strategy 2017, Topic Paper: Transport, June 2017 (accompanying Local Plan 2017) Local Plan Transport Strategy 2017
 Local Plan Transport Strategy 2017") Guildford Society Transport Group Position Paper August 2017 Based on submissions in response to the June/July 2017 Local Plan consultation including material presented to Drop-in Session 15 July 2017.
Guildford Society Transport Group Position Paper August 2017 Based on submissions in response to the June/July 2017 Local Plan consultation including material presented to Drop-in Session 15 July 2017.
The Government s Aviation Strategy Transport for the North (TfN) response
 response") The Government s Aviation Strategy Transport for the North (TfN) response Transport for the North Background Good transport links are a crucial part of a strong economy supporting labour markets and delivering
The Government s Aviation Strategy Transport for the North (TfN) response Transport for the North Background Good transport links are a crucial part of a strong economy supporting labour markets and delivering
Draft City Centre Transport Proposals
 Draft City Centre Transport Proposals Introduction This draft position paper provides an overview of the current City Centre transport issues, including concepts of the possible future City Centre transport
City of Hobart Transport Strategy
 City of Hobart City of Hobart Transport Strategy 2018-2030 Community Engagement Module 1 Freight Port and Air Regulatory, policy and reference material Hobart 2025 Strategic Framework http://www.hobartcity.com.au/publications/strategies_and_plans/hobart_2025_strategic_frame
Appendix 9. Impacts on Great Western Main Line. Prepared by Christopher Stokes
 Appendix 9 Impacts on Great Western Main Line Prepared by Christopher Stokes 9 IMPACTS ON GREAT WESTERN MAIN LINE Prepared by Christopher Stokes Introduction 9.1 This appendix evaluates the impact of
Northern Beaches Transport Action Plan
 Northern Beaches Transport Action Plan The NSW Government is taking action now to deliver transport improvements for the Northern Beaches, as well as planning for the future growth of the area. $633 million
A Response to: Belfast On The Move Transport Masterplan for Belfast City Centre, Sustainable Transport Enabling Measures
 West Belfast Partnership 218-226 Falls Road Belfast BT12 6AH T: 02890809202 A Response to: Belfast On The Move Transport Masterplan for Belfast City Centre, Sustainable Transport Enabling Measures Issued
East West Rail Consortium
 East West Rail Consortium EWR Wider Economic Case: Refresh 18 th November 2015 Rupert Dyer Rail Expertise Ltd Rail Expertise Ltd. Tel: 01543 493533 Email: info@railexpertise.co.uk 1 Introduction 1.1 The
Draft Greater Sydney Region Plan
 Draft Greater Sydney Region Plan Submission_id: 31221 Date of Lodgment: 13 Dec 2017 Origin of Submission: Online Organisation name: Infrastructure Group Organisation type: Other First name: Jacob Ibrahim
PERTH CITY SWAN PERTH AIRPORT CURTIN UNIVERSITY WESTFIELD CAROUSEL TANGNEY CITY OF CANNING JANDAKOT AIRPORT SWAN TANGNEY
 THE CITY OF CANNING CITY OF CANNING PERTH CITY SWAN PERTH AIRPORT CURTIN UNIVERSITY WESTFIELD CAROUSEL TANGNEY CITY OF CANNING JANDAKOT AIRPORT SWAN TANGNEY UNTAPPED POTENTIAL The Canning City Centre,
The implementation of this Master Plan will be undertaken in logical stages to meet passenger and workforce demands.
 The implementation of this Master Plan will be undertaken in logical stages to meet passenger and workforce demands. Connecting People Building Opportunities 198 Brisbane Airport Corporation CHAPTER 10
CITY RAIL LINK. New Public Transport Stations and Development Opportunities at Karangahape Road, Newton and Aotea Quarter
 134 AC_BEU_CCMP_3_TM5_8_FD.indd 134 20/07/12 12:30 PM 05 CITY RAIL LINK New Public Transport Stations and Development Opportunities at Karangahape Road, Newton and Aotea Quarter 5 MO VE 0 1 2 8 KEY 1 Britomart
Growing Regional Victoria 2018 Victorian Election Priorities GROWING REGIONAL VICTORIA 2018 VICTORIAN ELECTION PRIORITIES
 GROWING REGIONAL VICTORIA 2018 VICTORIAN ELECTION PRIORITIES Message from the Chair, Cr Margaret O Rourke Regional Cities Victoria Growing Regional Victoria Regional Cities Victoria (RCV) is uniquely positioned
Gold Coast. Rapid Transit. Chapter content. Chapter four Route selection and staging
 Chapter four Route selection and staging Gold Coast Rapid Transit Chapter four Route selection and staging Chapter content Route selection...73 Section one: Helensvale to Griffith University...74 Section
Response to the London Heathrow Airport Expansion Public Consultation
 Response to the London Heathrow Airport Expansion Public Consultation Summary This report sets out the response to the Heathrow Airport s consultation on airport expansion and airspace change. The consultation
Comments on the High Speed Rail Phase-2 Report
 22 nd May 2013 Director, High Speed Rail Study Department of Infrastructure and Transport GPO Box 594 Canberra ACT 2601 Dear Director, In response to the invitation to provide comment to the High Speed
Connecting Sydney Olympic Park and GPOP with Greater Sydney. Final Summary Report 29 May 2017
 Connecting Sydney Olympic Park and GPOP with Greater Sydney Final Summary Report 29 May 2017 GPOP sits at the core of the emerging Central City. East Sydney is at the centre of the established Eastern
November Creating liveable cities in Australia A scorecard and priority recommendations for Brisbane
 November 2018 Creating liveable cities in Australia A scorecard and priority recommendations for Brisbane What makes a liveable city? The term liveability is widely used in Australia and across the world,
The Sunshine Coast is part of the global community and generates wealth through export, high-value industries and new investment.
 3.2 Strategic intent 3.2.1 Shaping growth an overview In 2031, the Sunshine Coast is renowned for its vibrant economy, ecological values, unique character and strong sense of community. It is Australia
Interstate 90 and Mercer Island Mobility Study APRIL Commissioned by. Prepared by
 Interstate 90 and Mercer Island Mobility Study APRIL 2017 Commissioned by Prepared by Interstate 90 and Mercer Island Mobility Study Commissioned by: Sound Transit Prepared by: April 2017 Contents Section
CURRENT SHORT-RANGE TRANSIT PLANNING PRACTICE. 1. SRTP -- Definition & Introduction 2. Measures and Standards
 CURRENT SHORT-RANGE TRANSIT PLANNING PRACTICE Outline 1. SRTP -- Definition & Introduction 2. Measures and Standards 3. Current Practice in SRTP & Critique 1 Public Transport Planning A. Long Range (>
Review of Government Secondary School Requirements within the Sunbury South Precinct Structure Plan
 Review of Government Secondary School Requirements within the Sunbury South Precinct Structure Plan Expert Witness Statement August 11 th, 2017 Prepared by Robert Panozzo Director, ASR Research Pty Ltd
CBD Rail Link Business Case
 CBD Rail Link Business Case Executive Summary: CBD Link Business Case (Nov 2010) Background The CBD Rail Link will be the most significant improvement to Auckland s transport network since the opening
Lansdowne Wetton BRT Public Transport Corridor Trunk Route: Planning Analysis
 Lansdowne Wetton BRT Public Transport Corridor Trunk Route: Planning Analysis 1. Introduction The purpose of this report is to detail the planning evaluation for the trunk route alignment alternatives
Memorandum of Understanding with ACT Government
 MEDIA RELEASE 8 April 2015 Memorandum of Understanding with ACT Government The ACT Government and Canberra Airport today entered into a new Memorandum of Understanding (MoU) on key areas of common interest
Stage 2 ION: Light Rail Transit (LRT) from Kitchener to Cambridge
 from Kitchener to Cambridge") Stage 2 ION: Light Rail Transit (LRT) from Kitchener to Cambridge Public Consultation Centre (PCC) No. 3 Please Sign-in Cambridge City Hall November 21, 2017 2:00 to 8:00pm Preston Memorial Auditorium
Stage 2 ION: Light Rail Transit (LRT) from Kitchener to Cambridge Public Consultation Centre (PCC) No. 3 Please Sign-in Cambridge City Hall November 21, 2017 2:00 to 8:00pm Preston Memorial Auditorium
AIRPORT OF THE FUTURE
 AIRPORT OF THE FUTURE Airport of the Future Which airport is ready for the future? IATA has launched a new activity, working with industry partners, to help define the way of the future for airports. There
TfL Planning. 1. Question 1
 TfL Planning TfL response to questions from Zac Goldsmith MP, Chair of the All Party Parliamentary Group on Heathrow and the Wider Economy Heathrow airport expansion proposal - surface access February
TransAction Overview. Introduction. Vision. NVTA Jurisdictions
 Introduction Vision NVTA Jurisdictions In the 21 st century, Northern Virginia will develop and sustain a multimodal transportation system that enhances quality of life and supports economic growth. Investments
PRIMA Open Online Public Consultation
 PRIMA Open Online Public Consultation Short Summary Report Published on 1 June 2016 Research and Introduction Objective of the consultation: to collect views and opinions on the scope, objectives, and
TORONTO TRANSIT COMMISSION REPORT NO.
 Revised: March/13 TORONTO TRANSIT COMMISSION REPORT NO. MEETING DATE: March 26, 2014 SUBJECT: KENNEDY INTERCHANGE STATION: METROLINX EGLINTON CROSSTOWN LIGHT RAIL TRANSIT PROJECT - PRELIMINARY CONCEPT
This report recommends two new TTC transit services in southwest Toronto.
 Report for Action New TTC Services - Southwest Toronto Date: March 20, 2018 To: TTC Board From: Chief Customer Officer Summary This report recommends two new TTC transit services in southwest Toronto.
Reimagining Central Station Precinct
 Reimagining Central Station Precinct Submission by BusNSW 1. Introduction BusNSW members provide bus and coach transport services throughout NSW under various contractual and regulatory environments. This
Preparatory Course in Business (RMIT) SIM Global Education. Bachelor of Applied Science (Aviation) (Top-Up) RMIT University, Australia
 SIM Global Education. Bachelor of Applied Science (Aviation) (Top-Up) RMIT University, Australia") Preparatory Course in Business (RMIT) SIM Global Education Bachelor of Applied Science (Aviation) (Top-Up) RMIT University, Australia Brief Outline of Modules (Updated 18 September 2018) BUS005 MANAGING
Preparatory Course in Business (RMIT) SIM Global Education Bachelor of Applied Science (Aviation) (Top-Up) RMIT University, Australia Brief Outline of Modules (Updated 18 September 2018) BUS005 MANAGING
NATIONAL AIRSPACE POLICY OF NEW ZEALAND
 NATIONAL AIRSPACE POLICY OF NEW ZEALAND APRIL 2012 FOREWORD TO NATIONAL AIRSPACE POLICY STATEMENT When the government issued Connecting New Zealand, its policy direction for transport in August 2011, one
Attachment 1 PARK & RIDE GUIDELINES
 Attachment 1 PARK & RIDE GUIDELINES The City of Edmonton August 2018 Executive Summary Edmonton will soon be a city of a million people - not within 25 years but within the next five years. This growth
TERMINAL DEVELOPMENT PLAN
 5.0 TERMINAL DEVELOPMENT PLAN 5.0 TERMINAL DEVELOPMENT PLAN Key points The development plan in the Master Plan includes the expansion of terminal infrastructure, creating integrated terminals for international,
The Strategic Commercial and Procurement Manager
 Item 3 To: Procurement Sub Committee On: 8 June 2016 Report by: The Strategic Commercial and Procurement Manager Heading: Renfrewshire Council s Community Benefit Strategy 2016 1. Summary 1.1. The purpose
Submission on Draft Ingleburn Structure Plan. Prepared for: Ingleburn Chamber of Commerce & Industry Inc. 6 February 2015
 Submission on Draft Ingleburn Structure Plan Prepared for: Ingleburn Chamber of Commerce & Industry Inc. GLN Planning Pty Ltd ABN 39 585 269 237 Level 10, 66 King Street Sydney NSW 2000 GPO Box 5013 Sydney
Westbrook Station. Transit Oriented Development Opportunity
 DEVELOPM Westbrook Station Transit Oriented Development Opportunity OPPOR Table of Contents Prime Real Estate Development Opportunity page 1 Calgary City of Opportunity page 3 What is Transit Oriented
Launceston City Council. Kings Meadows Traffic Management Report for Public Consultation
 Launceston City Council Kings Meadows Traffic Management Report for Public Consultation November 2013 This report: has been prepared by GHD for Launceston City Council and may only be used and relied on
33 Horseferry Road HP20 1UA London SW1P 4DR. Tuesday 10 th October Dear Sir,
 East Midlands Rail Franchise Programme Office Consultation Co-ordinator c/o Buckinghamshire County Council Zone 2/21 County Hall Department for Transport Walton Street Great Minster House Aylesbury 33