Ryman Healthcare. Full year result - 31 March 2018
|
|
|
- Walter Jones
- 5 years ago
- Views:
Transcription

1 Ryman Healthcare Full year result - 31 March 2018

2 Full year highlights Underlying profit up 14.2% to $203.5 million Reported profit up 8.8% to $388.2 million Full year dividend 20.4 cents per share; up 14.6% $5.8 billion of total assets 16 new villages in the pipeline

3


4 Kevin Hickman
5


6


7
8


9
10 myryman


11 Four year certification 70% 60% 60% 50% 40% 30% 32% 27% 33% 39% 35% 20% 10% 0% 13% 15% Note: Percent of villages with 4 year certification. Includes aged care providers with 15 or more villages. Data as at 23 April 2018


12
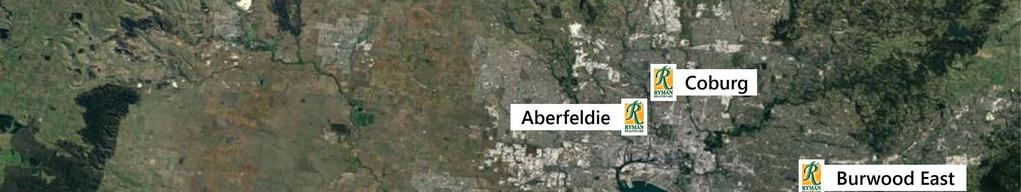
13 Aberfeldie Melbourne


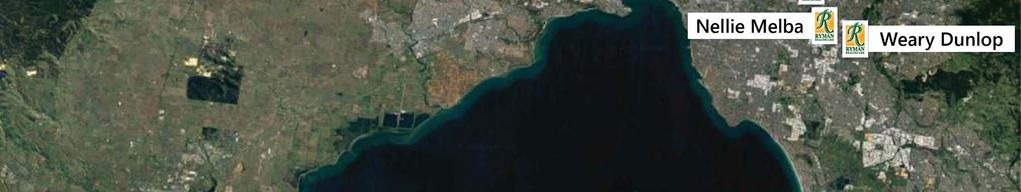
14 Nellie Melba Wheelers Hill, Melbourne

15 Coburg Melbourne
16 Burwood East Melbourne

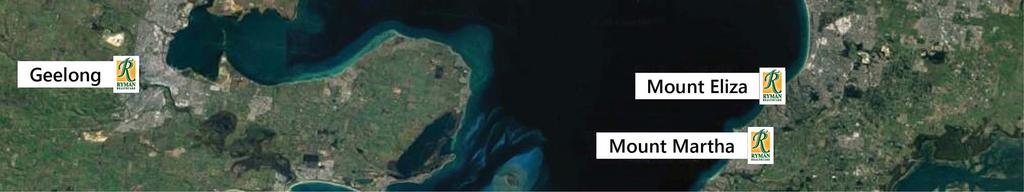
17 Geelong Victoria

18 Mount Eliza Mornington Peninsula, Melbourne


19 Mount Martha Mornington Peninsula, Melbourne
20 Victoria


21 Logan Campbell Greenlane, Auckland

22 Devonport Auckland Lynfield Auckland


23 Karori Wellington, New Zealand Havelock North Hawkes Bay, New Zealand


24


25 16 years of underlying profit growth $250m $200m $150m $100m $50m $0m


26 Reported profit growth $500m $400m $300m $200m $100m $0m


27 FY18 investing cash flows $600m $500m $400m $44 $35 $45 $27 $300m $350 $296 $200m $100m $0m $97 $111 Mar-17 Mar-18 Purchase of land New villages Projects Village upgrades


28 Total assets $7bn $6bn $5bn $4bn $3bn $2bn $1bn $0bn


")


29 Bank facilities $700m $600m $500m $400m $300m $200m $100m $0m 1 Year 2 years 3 years 4 years 5 years * Gearing ratio calculated as net debt / net debt plus equity Gearing Mar-18 Mar-17 (millions) (millions) Net debt $1,060 $838 Net assets $1,941 $1,652 Gearing ratio * 35% 34%

30 Development margin 30% 20% Target range 10% 0% Group development margin Margin excluding Bob Scott Note: 2018 margin restated to exclude Bob Scott.
31 $815 million resales bank $1,000m $800m $600m $400m $200m $0m New Zealand Melbourne Note: The resale bank represents the extent that the current price exceeds the price paid by the current resident for the unit's occupancy rights.


32 Sales price vs median house price $1.6m $1.4m $1.2m $1.0m $0.8m $0.6m $0.4m $0.2m $0.0m Melbourne Auckland Median house price - area Ryman - Independent Ryman - Serviced


33 Long term capital efficiency $25 million raised at IPO in 1999 Invested $3.1 billion in portfolio since 1999 with no fresh capital Dividends of $690 million paid since float* Self-funded growth Strong balance sheet * Includes 2H18 dividend of 10.9 cents per share that has been declared and is payable on 22 June 2018.
34


35 Appendices
36 Appendix 1: Reported profit Underlying profit Unrealised revaluations of retirement village units Deferred tax expense Reported net profit $203.5m +$185.3m -$0.6m $388.2m


37 Appendix 2: Sale of occupation rights Mar-18 Mar-17 Existing units Independent Serviced New units Independent Serviced


38 Appendix 3: Development Mar-18 Mar-17 Units and beds built Retirement village units built Aged care beds built Mar-18 Mar-17 Total retirement village units Independent 4,513 4,131 Serviced 1,901 1,837 6,414 5,968 Total aged care beds 3,367 3,281 Total retirement village units and beds 9,781 9,249
 107,233 77,286 Sale of occupation rights (Key statistics) 414,619 311,348 Gross resales margin 25.9% 24.")
39 Appendix 4: Margins Reference Mar-18 Mar-17 New sales $000s $000s Realised fair value movement (Note 7) 58,955 62,959 Sale of occupation rights (Key statistics) 307, ,282 Gross development margin 19.2% 23.9% Resales Realised fair value movement (Note 7) 107,233 77,286 Sale of occupation rights (Key statistics) 414, ,348 Gross resales margin 25.9% 24.8%
40 Appendix 5: Asset base New Zealand (ex Auckland) Village Location Hospital Dementia Resthome Serviced Independent Total Anthony Wilding Christchurch Bob Owens Tauranga Bob Scott Petone Charles Fleming Waikanae Charles Upham Rangiora Diana Isaac Christchurch Ernest Rutherford Nelson Essie Summers Christchurch Evelyn Page Orewa Frances Hodgkins Dunedin Hilda Ross Hamilton Jane Mander Whangarei Jane Winstone Wanganui Jean Sandel New Plymouth Julia Wallace Palmerston North Kiri Te Kanawa Gisborne Malvina Major Wellington Margaret Stoddart Christchurch Ngaio Marsh Christchurch Princess Alexandra Napier Rita Angus Wellington Rowena Jackson Invercargill Shona McFarlane Lower Hutt Woodcote Christchurch Yvette Williams Dunedin Total units & beds New Zealand (ex Auckland) 1, ,389 3,104 7,038
41 Appendix 5: Asset base Auckland Village Location Hospital Dementia Resthome Serviced Independent Total Bert Sutcliffe Birkenhead Bruce McLaren Howick Edmund Hillary Remuera Grace Joel St Helliers Logan Campbell Greenlane Possum Bourne Pukekohe Total units & beds Auckland ,167 2,368 Total units & beds New Zealand 1, ,048 1,850 4,271 9,406 Victoria Village Location Hospital Dementia Resthome Serviced Independent Total Weary Dunlop Melbourne Nellie Melba Melbourne Total units & beds Victoria New Zealand and Victoria Total units & beds 1, ,080 1,901 4,513 9,781
42 Appendix 6: Land bank (New Zealand) Existing villages Location Hospital Dementia Resthome Serviced Independent Total Jean Sandel New Plymouth Kiri Te Kanawa Gisborne Bob Scott Lower Hutt Bert Sutcliffe Auckland Logan Campbell Auckland Charles Upham Rangiora Total existing villages New sites Location Hospital Dementia Resthome Serviced Independent Total Devonport Auckland Lynfield Auckland River Road Hamilton Lincoln Road Auckland Hobsonville Auckland Karori Wellington Park Terrace Christchurch Newtown Wellington Diana Isaac Christchurch Havelock North Hawkes Bay Total new sites ,691 3,311 Total landbank New Zealand ,948 3,598 The land bank is subject to resource and building consent.
43 Appendix 6: Land bank (Australia) Existing villages Location Hospital Dementia Resthome Serviced Independent Total Nellie Melba Melbourne Total existing villages New sites Location Hospital Dementia Resthome Serviced Independent Total Coburg Melbourne Burwood East Melbourne Mount Eliza Melbourne Geelong Victoria Mount Martha Melbourne Aberfeldie* Melbourne Total new sites ,975 Total landbank Australia ,251 2,554 Total land bank New Zealand & Australia ,153 3,199 6,152 The land bank is subject to resource and building consent. * In May 2018 Ryman entered into an unconditional sale and purchase agreement for the acquisition of land at Aberfeldie.
 (321,631) (270,370) Movement in accrued management fees (51,261) (43,216) Plus:")
 (1,751) Plus: Movement in resident loan Not disclosed 8,999 5,017 Cash management fees")
44 Appendix 7: Cash management fees Reference Mar-18 Mar-17 $000s $000s Accrued management fees opening (Note 12) 270, ,154 Less: Accrued management fees closing (Note 12) (321,631) (270,370) Movement in accrued management fees (51,261) (43,216) Plus: DMF income Income statement 70,087 60,988 Plus: Revenue in advance movement (Note 21) 7,253 7,670 Plus: GST / accommodation credit adjustment Not disclosed (310) (1,751) Plus: Movement in resident loan Not disclosed 8,999 5,017 Cash management fees 34,768 28,708


45 Appendix 8: Investment property summary CBRE unit price inflation assumption Discount As at 31 March 2018 Yr 1 Yr 2 Yr 3 Yr 4 Yr 5+ rate Auckland 0.9% 1.9% 2.4% 3.0% 3.5% 12.51% Rest of New Zealand 0.9% 1.5% 2.0% 2.8% 3.3% 13.42% Melbourne 3.6% 3.6% 3.6% 3.8% 3.9% 14.00%
 3,101 572 Development sales 238,820 246,116 Resales 364,860 285,476 Total receipts from")
 (212,548) Interest paid (14,491) (10,930) Net operating cash per the cash flow statement")
46 Appendix 9: Operating cash flows Mar-18 Mar-17 $000 s $000 s Resident receipts 268, ,665 Refundable accommodation deposits (net) 3, Development sales 238, ,116 Resales 364, ,476 Total receipts from residents 875, ,829 Interest received Payments to suppliers and employees (270,231) (214,028) Payments to residents (241,676) (212,548) Interest paid (14,491) (10,930) Net operating cash per the cash flow statement 349, ,799
47 Appendix 10: Available resale stock Mar-18 Mar % Independent Living Units 26 4 Serviced Apartments Total Resales stock % Total retirement portfolio 6,414 5,968 Uncontracted stock percentage * 0.8% 0.5% 1.5% 1.4% 1.3% 1.0% 1.0% 1.2% 0.8% 0.5% 0.5% 0.0% * Uncontracted resales stock as a percentage of total retirement unit portfolio at balance date
48 Appendix 11: Capital management Use of debt Gearing Mar-18 Mar-17 (millions) (millions) Net debt $1,060 $838 Net assets $1,941 $1,652 $1,200m $1,000m $ 10 m $ 45 m $ 82 m $ 30 m Projects Generators Gearing ratio * 35% 34% $7bn 70% $800m $ 178 m Other village capex $6bn $5bn $4bn $3bn $2bn 60% 50% 40% 30% 20% $600m $400m $ 428 m Village upgrades New Sale debtors $1bn $0bn 10% 0% $200m $ 287 m Development WIP Net debt Total assets Gearing ratio* (RHS) $0m Undeveloped Land * Gearing ratio calculated as net debt / net debt plus equity


49 Appendix 12: Value of contracts not booked $150m $100m $50m $0m
50 Appendix 13: Resident average age and tenure (years) Average age Mar-18 Mar-17 Independent Serviced Care centre Average tenure - vacated residents Mar-18 Mar-17 Independent Serviced Independent Serviced Care centre
51 Petone - NZ Rangiora - NZ Birkenhead - NZ Greenlane - NZ Brandon Park - Victoria Lynfield - NZ Devonport - NZ River Road - NZ Coburg - Victoria Burwood East - Victoria Geelong - Victoria Pipeline of 16 villages Hobsonville - NZ Newtown - NZ Mount Eliza - Victoria Village Design Consenting Construction Village Open Final Stages Lincoln Road - NZ Park Terrace - NZ Mount Martha - Victoria Karori - NZ Aberfeldie - Victoria Havelock North - NZ Appendix 14: 16 villages in the pipeline nine in NZ, seven in Victoria
52 Appendix 15: Population growth 40, m 30, m 20, m 10, m m NZ avg annual increase in population aged 75+ Victoria avg annual increase in population aged 75+ NZ total population aged 75+ (RHS) Victoria total population aged 75+ (RHS) Source: Statistics NZ, Australian Bureau of Statistics
53 Appendix 16: Number of births in New Zealand and Victoria 80,000 60,000 40,000 20, New Zealand Victoria Source: Statistics NZ, ABS. Number of births in New Zealand and Victoria
RYMAN HEALTHCARE FULL YEAR RESULTS 31 March 2017
 RYMAN HEALTHCARE FULL YEAR RESULTS 31 March 2017 FULL YEAR HIGHLIGHTS Underlying profit up 13% to $178 million Reported profit up 17% to $357 million Full year dividend 17.8 cents per share up 13% Record
Flight Centre business hours over Discover Europe weekend of Saturday 5 and Sunday 6 October
 Flight Centre business hours over Discover Europe weekend of Saturday 5 and Sunday 6 October SATURDAY SUNDAY City Store Name Open Hours Close Hours Open Hours Close Hours Address Phone Number Email Alexandra
Travel Expo Saturday 10 and Sunday 11 August. Flight Centre stores business hours over Travel Expo weekend. SATURDAY SUNDAY Open Hours.
 Travel Expo Saturday 10 and Sunday 11 August Flight Centre stores business hours over Travel Expo weekend SATURDAY SUNDAY City Store Name Open Hours Close Hours Open Hours Close Hours Address Alexandra
MAINFREIGHT LIMITED FULL YEAR RESULT TO MARCH 2017
 MAINFREIGHT LIMITED FULL YEAR RESULT TO MARCH 2017 Result Summary NET SURPLUS Net surplus after tax and before abnormal items up 17.0% to $103.2 million REVENUE EBITDA Revenue up 2.1% to $2.33 billion
1Q FY2014/15. Financial Results Presentation. 13 August 2014 S Y D N E Y M E L B O U R N E B R I S B A N E C A I R N S
 1Q FY2014/15 Financial Results Presentation 13 August 2014 S Y D N E Y M E L B O U R N E B R I S B A N E C A I R N S B E I J I N G T O K Y O O S A K A S I N G A P O R E Disclaimer This presentation on
NZ price index relative to peak
 Media release 7 April, 2014 Residential property value growth plateaus The latest monthly property value index shows that nationwide residential values for March have increased 8.8% over the past year,
Jim Syme - Chairman. Welcome to the 27 October 2006 annual meeting of shareholders
 Jim Syme - Chairman Welcome to the 27 October 2006 annual meeting of shareholders Meeting Structure and Agenda Chairman s Address Managing Director s Address Question Time Resolutions as per the notice
IAG results presentation. Quarter One th May 2018
 IAG results presentation Quarter One 2018 4 th May 2018 Highlights Willie Walsh, Chief Executive Officer Highlights Another strong quarter performance with an operating profit of 280m (5.6% margin, +2.3pts)
Mapping and visualizing urban form urban intensification analysis for New Zealand cities
 Mapping and visualizing urban form urban intensification analysis for New Zealand cities Dr Pengjun Zhao Postdoctoral researcher New Zealand Centre for Sustainable Cities The 14 th Public Health Summer
For personal use only HILLS HOLDINGS HALF YEAR RESULTS FY2013
 HILLS HOLDINGS HALF YEAR RESULTS FY2013 TODAY KEY HIGHLIGHTS OUR FY13 FIRST HALF RESULTS GROUP PERFORMANACE FIRST HALF NPAT 1 $8.2M IN LINE WITH NOVEMBER AGM GUIDANCE. STRONG MANAGEMENT OF WORKING CAPITAL
Investor Briefings First-Half FY2016 Financial Results
 Cedar Woods Properties Limited Investor Briefings First-Half FY2016 Financial Results 26 February 2016 Cedar Woods Presentation 2 Snapshot of Achievements in FY2016 Extensive portfolio of residential estates
Netball NZ U17 Champs 2016 Draw Monday 18 th Thursday 21 st July 2016 North Canterbury Netball Centre, Rangiora
 Monday 18 th Thursday 21 st July 2016 North Canterbury Netball Centre, Rangiora Pools Pool A Zone Pool B Zone Pool C Zone Pool D Auckland 1 N Wellington (A) Black C Waitakere 1 N Dunedin S North Canterbury
FIRST QUARTER 2017 RESULTS. 4 May 2017
 FIRST QUARTER 2017 RESULTS 4 May 2017 A resilient start of the year, traffic up 4.2% 20.9 million passengers carried, up 5.2%, traffic (RPK) up 4.2%, capacity (ASK) up 3.3% and load factor up 0.7pts Confirmation
Copa Holdings Reports Net Income of $49.9 million and EPS of $1.18 for the Second Quarter of 2018
 Copa Holdings Reports Net Income of $49.9 million and EPS of $1.18 for the Second Quarter of 2018 Panama City, Panama --- Aug 8, 2018. Copa Holdings, S.A. (NYSE: CPA), today announced financial results
Number of people tested
 Auckland NEW WORLD Birkenhead - - - Auckland NEW WORLD Clendon Manurewa 190 126 78 Auckland NEW WORLD Eastridge Orakei - - - Auckland NEW WORLD Green Bay 90 125 77 Auckland NEW WORLD Milford 133 132 80
M2 Group Ltd 2014 Interim Results
 M2 Group Ltd 2014 Interim Results 24 February 2014 Geoff Horth, CEO Presentation Content Record Financial Performance Strong Organic Growth FY14 Priorities and Guidance Slide 2, 24 February 2014 Record
Forward looking statements
 Forward looking statements This presentation contains forward-looking statements. Forward-looking statements often include words such as anticipate", "expect", "intend", "plan", "believe, continue or similar
1HFY2012 RESULTS PRESENTATION
 1HFY2012 RESULTS PRESENTATION 21st February 2012 AWARD WINNING PROPERTY DEVELOPER Listed 1994, consistently profitable, always paid dividends Strategically located and diverse residential portfolio Urban
S$ million 2Q2012 2Q2011 Change 1H2012 1H2011 Change Revenue % % Gross Profit % % Gross Profit Margin
 Roxy-Pacific Holdings Limited NEWS RELEASE ROXY-PACIFIC ACHIEVES 8% INCREASE IN NET PROFIT TO S$17.7 MILLION IN 2Q2012 - Revenue rises 13% to S$52.7 million - 18% surge in revenue from Property Development
RESULTS PRESENTATION
 RESULTS PRESENTATION YEAR ENDED 30 JUNE 2017 EVENT YEAR END RESULTS - WEBCAST AND DIAL IN DETAILS FRIDAY 25 AUGUST 2017 8:00 AM (AEDT) Access a webcast of the briefing at http://webcast.openbriefing.com/3955/
First Quarter Results August 31 st, 2006
 First Quarter Results 2006-07 August 31 st, 2006 Key features of the First Quarter Market context Sustained global economic growth, and a recovery in Europe Average jet fuel price of 691 $/t, up 25% year-on-year
GROUP FINANCIAL HIGHLIGHTS
 AGENDA FINANCIAL HIGHLIGHTS OPERATIONS HIGHLIGHTS INCOME STATEMENT REVIEW BALANCE SHEET REVIEW KEY PERFORMANCE INDICATORS OPERATIONAL REVIEW AIRLINES COMPARATIVE PERFORMANCE OUTLOOK GROUP FINANCIAL HIGHLIGHTS
new zealand Q TH EDITION AUCKLAND HAMILTON TAURANGA WELLINGTON CHRISTCHURCH QUEENSTOWN DUNEDIN cities Key Sectors
 new zealand AUCKLAND 83 HAMILTON 2 7 TAURANGA 9 WELLINGTON QUEENSTOWN 9 13 CHRISTCHURCH 2 DUNEDIN Q1 2018 RLB Index Highlights A total of 125 long-term cranes have been sighted across New Zealand (83 in
Subnational Population Estimates
 Image description. Hot Off The Press. End of image description. Embargoed until 10:45am 20 October 2006 Subnational Population Estimates At 30 June 2006 Highlights The population growth of both the North
Urban Cycleways Programme Announcement Questions and Answers
 Urban Cycleways Programme Announcement Questions and Answers 1. What is the Urban Cycleways Programme? The Urban Cycleways Programme is a leveraged investment programe made up of $100 million Government
OPERATING AND FINANCIAL HIGHLIGHTS
 Copa Holdings Reports Financial Results for the Fourth Quarter of 2018 Excluding special items, adjusted net profit came in at $44.0 million, or Adjusted EPS of $1.04 Panama City, Panama --- February 13,
Ramsay Health Care Limited Results Briefing Half Year ended 31 December 2018
 Ramsay Health Care Limited Results Briefing Half Year ended 31 December 2018 Craig McNally, Group Managing Director & Bruce Soden, Group Finance Director 28 February 2019 ramsayhealth.com Agenda Group
PRIMED FOR GROWTH ROXY-PACIFIC HOLDINGS LIMITED. Results Announcement Half Year Ended 30 June st July 2018
 PRIMED FOR GROWTH ROXY-PACIFIC HOLDINGS LIMITED Results Announcement Half Year Ended 30 June 2018 31 st July 2018 Agenda 1 Financial Performance 2 Business Review 3 Group Borrowings 4 Outlook Financial
Third Quarter Results
 1 Third Quarter 2010-11 Results Highlights of the Third Quarter Passenger business affected by significant disruptions Dynamic cargo activity Strong improvement in results Decline in ex-fuel unit costs
Highlights from the Annual Results December 2007
 Highlights from the Annual Results December 2007 Disclaimer The information in this document is taken from the BAA 2007 Annual Results ( the Results ) which were published on 11 March 2008 and other public
Copa Holdings Reports Net Income of $136.5 million and EPS of $3.22 for the First Quarter of 2018
 Copa Holdings Reports Net Income of $136.5 million and EPS of $3.22 for the First Quarter of 2018 May 9, 2018 PANAMA CITY, May 9, 2018 /PRNewswire/ -- Copa Holdings, S.A. (NYSE: CPA), today announced financial
Goodman Property Trust. 30 & 31 October 2018 NAB First Look USPP Conference, Sydney
 Goodman Property Trust 30 & 31 October 2018 NAB First Look USPP Conference, Sydney Contents Presented by: Andy Eakin Chief Financial Officer James Spence Director Investment Management GMT overview 3 Auckland
RESULTS PRESENTATION 22 FEBRUARY 2019
 RESULTS PRESENTATION 22 FEBRUARY 2019 H A L F Y E A R E N D E D 3 1 D E C E M B E R 2 0 1 8 EVENT YEAR END RESULTS WEBCAST AND DIAL IN DETAILS FRIDAY 22 FEBRUARY 2019 9:00 AM (AEDT) Access a webcast of
Grid Skills. Learner s Travel & Accommodation Guidelines
 Grid Skills Learner s Travel & Accommodation Guidelines October 2017 Issue Details Version Number: V6 Effective Date: 01 October 2017 Document Owner: Manager Technical Training Revision Authority Manager
Management Presentation. May 2013
 Management Presentation May 2013 Forward looking statements This presentation as well as oral statements made by officers or directors of Allegiant Travel Company, its advisors and affiliates (collectively
UP 9% RESULTS FOR THE YEAR ENDED 30 JUNE 2011 PROFIT AFTER TAX $252.26M VS $231.41M
 30 August 2011 UP 9% RESULTS FOR THE YEAR ENDED 30 JUNE 2011 PROFIT AFTER TAX $252.26M VS $231.41M Harvey Norman Holdings Limited announced today that profit after tax and noncontrolling interests for
Case study: outbound tourism from New Zealand
 66 related crime, less concerned about the stability and certainty offered by booking a package holiday, and may choose to be independent travellers, organizing their travel and itinerary themselves. Tourists
PRIMED FOR GROWTH ROXY-PACIFIC HOLDINGS LIMITED. Results Briefing Full Year Ended 31 December nd February 2019
 PRIMED FOR GROWTH ROXY-PACIFIC HOLDINGS LIMITED Results Briefing Full Year Ended 31 December 2018 22 nd February 2019 Agenda 1 Financial Performance 2 Business Review 3 Group Borrowings 4 Outlook Financial
Management Presentation. March 2016
 Management Presentation March 2016 Forward looking statements This presentation as well as oral statements made by officers or directors of Allegiant Travel Company, its advisors and affiliates (collectively
FIRST QUARTER RESULTS 2017
 FIRST QUARTER RESULTS 2017 KEY RESULTS In the 1Q17 Interjet total revenues added $4,421.5 million pesos that represented an increase of 14.8% over the income generated in the 1Q16. In the 1Q17, operating
Grid Skills. Learner s Travel & Accommodation Guidelines
 Grid Skills Learner s Travel & Accommodation Guidelines May 2015 Issue Details Version Number: V4.0 Effective Date: May 2015 Document Owner: Grid Skills Manager Revision Authority Grid Skills Manager Review
Copa Holdings Reports Record Earnings of US$41.8 Million for 4Q06 and US$134.2 Million for Full Year 2006
 Copa Holdings Reports Record Earnings of US$41.8 Million for 4Q06 and US$134.2 Million for Full Year 2006 Panama City, Panama --- March 7, 2007. Copa Holdings, S.A. (NYSE: CPA), parent company of Copa
Summary of Results for the First Quarter of FY2015/3
 Summary of for the First Quarter of FY2015/3 August 8, 2014 Tokyu Corporation (9005) http://www.tokyu.co.jp/ Contents Ⅰ.Executive Summary 2 Ⅱ.Conditions in Each Business 4 Ⅲ.Details of Financial for the
For personal use only
 Automotive Holdings Group Limited 21 Old Aberdeen Place West Perth, WA 6005 www.ahgir.com.au ABN 35 111 470 038 PRESENTATION TO MACQUARIE CONFERENCE 7 th May 2015 The company advises the attached presentation
MAINFREIGHT LIMITED FULL YEAR RESULT TO MARCH 2015
 MAINFREIGHT LIMITED FULL YEAR RESULT TO MARCH 2015 Result Summary NET SURPLUS Net surplus after tax and before abnormal items up 7.7% to $83.48 million REVENUE EBITDA Revenue up 6.8% to $2.05 billion Excluding
NEW ZEALAND REGIONAL TOURISM FORECASTS
 NEW ZEALAND REGIONAL TOURISM FORECASTS 21-216 QUEENSTOWN RTO AUGUST 21 www.tourismresearch.govt.nz Tourism Strategy Group Ministry of Economic Development Contents Introduction 1 1. Summary for Queenstown
26 August Christopher Luxon Chief Executive Officer. Rob McDonald Chief Financial Officer
 26 August 2016 Christopher Luxon Chief Executive Officer Rob McDonald Chief Financial Officer Forward looking statements This presentation contains forward-looking statements. Forward-looking statements
NZ price index relative to peak
 Media release 10 February Property value growth rate slows The latest monthly property value index shows that nationwide residential values for January have increased 9.6% over the past year, and 2.2 over
Portfolio. income at ANZ income was up. With. first-half. share
 NZX and media announcement 19 February 2013 Precinct announces improvedi result and positive outlook Performance for six months to 31 December 2012 Financial Performance Net profit after tax: $23.6 millionn
Half Year Results to 31 December 2016
 Fletcher Building Half Year Results Presentation 2017 Half Year Results to 31 December 2016 Working with you MARK ADAMSON Chief Executive Officer BEVAN MCKENZIE Chief Financial Officer 22 February 2017
Interim Results- Highlights
 Who is FKP? FKP is a leading diversified property and investment group Core business: construction, development, retirement, and funds management Based in Queensland, but with operations in five states
Crown Resorts Limited
 Crown Resorts Limited Annual General Meeting 20 October 2016 1 Presentation Outline F16 Year in Review 2 Crown Resorts Limited Group Result F16 Normalised $m F15 Normalised $m Variance F/(U) F16 Actual
PRIMED FOR GROWTH ROXY-PACIFIC HOLDINGS LIMITED. Results Announcement First Quarter Ended 31 March th May 2018
 PRIMED FOR GROWTH ROXY-PACIFIC HOLDINGS LIMITED Results Announcement First Quarter Ended 31 March 2018 14 th May 2018 Agenda 1 Financial Performance 2 Business Review 3 Group Borrowings 4 Outlook Financial
MAINFREIGHT LIMITED FULL YEAR RESULT TO 31 MARCH 2018
 MAINFREIGHT LIMITED FULL YEAR RESULT TO 31 MARCH 2018 Result Summary REVENUE EBITDA NET SURPLUS OUTLOOK Revenue up 12.2% to $2.62 billion (excluding FX up 10.6%) An increase of $285.3 million Offshore
For personal use only
 9 October 2015 ASX Announcement Tamawood Investor Presentation Sydney and Melbourne Australia, 12 & 13 October 2015 Tamawood Limited (ASX: TWD) is pleased to release a copy of the presentation that Mr
Peppers Docklands, Melbourne
 Peppers Docklands, Melbourne Contents Mantra Group Overview State of Market 8 3 Australian Market Mantra Group 18 24 Mantra Salt, Kingscliff Peppers Noosa, Noosa Mantra Group* CBD - RevPAR (A$) Largest
PCT delivers strong profit result and launches One Queen Street
 NZX announcement 16 August 2018 PCT delivers strong profit result and launches One Queen Street Performance summary for the 12 months ended 30 June 2018 Delivering strong results Net profit after tax increased
Financial Results 3 rd Quarter MAR/2016 (FY2015)
") Financial Results MAR/2016 (FY2015) January 29 th, 2016 CONTENTS P.1 P.2 P.3 P.4~ Overview of FY MAR/16 Results Operating Revenue Operating Profit 1,030 1,020 1,010 +1.0Bn 1,022.3 1,023.4 (+0.1%) 180 160
Financial Results MAR/2016 (FY2015) January 29 th, 2016 CONTENTS P.1 P.2 P.3 P.4~ Overview of FY MAR/16 Results Operating Revenue Operating Profit 1,030 1,020 1,010 +1.0Bn 1,022.3 1,023.4 (+0.1%) 180 160
Copa Holdings Reports Net Income of $57.7 million and EPS of $1.36 for the Third Quarter of 2018
 Copa Holdings Reports Net Income of $57.7 million and EPS of $1.36 for the Third Quarter of 2018 November 14, 2018 PANAMA CITY, Nov. 14, 2018 /PRNewswire/ -- Copa Holdings, S.A. (NYSE: CPA), today announced
FY RESULTS ROADSHOW PRESENTATION
 1 FY RESULTS 2014 ROADSHOW PRESENTATION FY 2014 HIGHLIGHTS FOCUS ON EXECUTION 2 Strong financial performance Revenues: 61 bn, +5% vs. 2013 EBIT* before one off: 4.1 bn, +15% vs. 2013 EPS: 2.99, +61% vs.
JAPAN AIRLINES Co., Ltd. Financial Results 1 st Quarter Mar/2017(FY2016) July 29, 2016
 July 29, 2016") JAPAN AIRLINES Co., Ltd. Financial Results Mar/2017(FY2016) July 29, 2016 Today s Topics P.1 P.2 P.13 From the first quarter of this fiscal year, figures for Revenue Passengers Carried, ASK, RPK and Load
JAPAN AIRLINES Co., Ltd. Financial Results Mar/2017(FY2016) July 29, 2016 Today s Topics P.1 P.2 P.13 From the first quarter of this fiscal year, figures for Revenue Passengers Carried, ASK, RPK and Load
NZ price index relative to peak
 Media release 13 th March 2012 Nationwide values continue to increase Nationwide residential property values have continued to gradually increase according to the QV index for February. Values are up 1.1%
NEW ZEALAND REGIONAL TOURISM FORECASTS
 NEW ZEALAND REGIONAL TOURISM FORECASTS 21-216 NELSON RTO AUGUST 21 www.tourismresearch.govt.nz Tourism Strategy Group Ministry of Economic Development Contents Introduction 1 1. Summary for Nelson RTO
THIRD QUARTER RESULTS 2017
 THIRD QUARTER RESULTS 2017 KEY RESULTS In the 3Q17 Interjet total revenues added $5,835.1 million pesos that represented an increase of 22.0% over the revenue generated in the 3Q16. In the 3Q17, operating
NEW ZEALAND REGIONAL TOURISM FORECASTS
 NEW ZEALAND REGIONAL TOURISM FORECASTS 21-216 LAKE TAUPO RTO AUGUST 21 www.tourismresearch.govt.nz Tourism Strategy Group Ministry of Economic Development Contents Introduction 1 1. Summary for Lake Taupo
NEW ZEALAND REGIONAL TOURISM FORECASTS
 NEW ZEALAND REGIONAL TOURISM FORECASTS 21-216 ROTORUA RTO AUGUST 21 www.tourismresearch.govt.nz Tourism Strategy Group Ministry of Economic Development Contents Introduction 1 1. Summary for Rotorua RTO
Centurion Corporation Limited
 Centurion Corporation Limited Corporate Presentation 6 January 2014 Disclaimer This presentation and the accompanying presentation materials (if any) ("Presentation") are made for informational purposes,
Management Presentation. November 2011
 Management Presentation November 2011 Forward looking statements This presentation as well as oral statements made by officers or directors of Allegiant Travel Company, its advisors and affiliates (collectively
PROFIT OF $1.24b ON STRONG REVENUE GAINS BUT FUEL COSTS REMAIN GREATEST CHALLENGE
 PROFIT OF $1.24b ON STRONG REVENUE GAINS BUT FUEL COSTS REMAIN GREATEST CHALLENGE HIGHLIGHTS OF THE GROUP S PERFORMANCE Financial Year 2005-06 4th Quarter 2005-06 Apr 2005 Mar 2006 Year-on-Year % Change
Summary of Results for the First Three Quarters FY2015/3
 Summary of Results for the First Three Quarters FY2015/3 February 10, 2015 Tokyu Corporation (9005) http://www.tokyu.co.jp/ Contents Ⅰ.Executive Summary 2 Ⅱ.Conditions in Each Business 5 Ⅲ.Details of Financial
23 February The Manager Market Announcements Australian Securities Exchange Limited 20 Bridge Street SYDNEY NSW 2000.
 Level 1 157 Grenfell Street Adelaide SA 5000 GPO Box 2155 Adelaide SA 5001 Adelaide Brighton Ltd ACN 007 596 018 Telephone (08) 8223 8000 International +618 8223 8000 Facsimile (08) 8215 0030 www.adbri.com.au
Auckland Median Price. Auckland Region Sales Volumes Past 5 Years. REINZ Auckland Region Analysis for March Past 5 Years.
 39202 39202 REINZ Auckland Region Analysis for March 2012 Commentary Sales volume in the Auckland region increased by more than 37% compared with February 2012, with North Shore City and Auckland City
ARSN Interim Report Responsible Entity Brookfield Capital Management Limited ACN AFSL
 Brookfield Prime Property Fund ARSN 110 096 663 Interim Report 2015 Responsible Entity Brookfield Capital Management Limited ACN 094 936 866 AFSL 223809 1 Message from the Chairman 2 Half Year Review 5
44th Consecutive Profitable Quarter Fourth Quarter Fully Diluted Earnings per Share of $0.94 Full Year Fully Diluted Earnings per Share of $4.
 Allegiant Travel Company Fourth Quarter and Full Year 2013 Financial Results January 29, 2014 1:00 PM PT 44th Consecutive Profitable Quarter Fourth Quarter Fully Diluted Earnings per Share of $0.94 Full
Management Presentation. November 2018
 Management Presentation November 2018 Forward looking statements This presentation as well as oral statements made by officers or directors of Allegiant Travel Company, its advisors and affiliates (collectively
FY17 Full Year Results Management Call, 13 December Robinson Club Noonu, Maldives
 Full Year Results Management Call, 3 December 207 Robinson Club Noonu, Maldives TUI Group TUI continues its strong performance track record in Third consecutive year of strong top line and earnings growth
Transport and RWC 2011
 Transport and RWC 2011 Matt Barnes, Transport Planning Manager, NZTA 7 October 2010 Rugby World Cup. New Zealand 2011 September 9 th to October 23 rd 2011 (45 days). Third largest sporting event in the
Full Year 2017 RESULTS 16 th of February 2018
 Full Year 2017 RESULTS 16 th of February 2018 2017 FULL YEAR 2017 MAIN ACHIEVEMENTS Robust traffic statistics Strong Full Year results +5.6% +2.0% 42% +101% 1,049 1,488 347 696 FY 2016 FY 2017 Passengers
2012 Full Year Results Briefing. 28 February 2013
 2012 Full Year Results Briefing 28 February 2013 1 KEY FINANCIALS & STRATEGY BUSINESS REVIEW OUTLOOK Q&A 2 UOL GROUP LIMITED KEY FINANCIALS & STRATEGY GWEE LIAN KHENG GROUP CHIEF EXECUTIVE 3 S$m FY 2012
Interim results. 11 May 2010
 Interim results 11 May 2010 Introduction Andy Harrison Chief Executive Officer Strong performance despite disruption Improvement in revenue, margins and cash Continued network improvement has driven better
United Continental Holdings, Inc (NYSE: UAL) ONE YEAR PRICE RANGE : $ LAST PRICE: $ ANALYST RATING: Sell
 ONE YEAR PRICE RANGE : $ LAST PRICE: $ ANALYST RATING: Sell") United Continental Holdings, Inc (NYSE: UAL) ONE YEAR PRICE RANGE : $61.91 68.76 LAST PRICE: $68.39 ANALYST RATING: Sell VALUATION DATE: August 3, 2017 NEXT EARNINGS DATE: October 17, 2017 Investment Thesis:
United Continental Holdings, Inc (NYSE: UAL) ONE YEAR PRICE RANGE : $61.91 68.76 LAST PRICE: $68.39 ANALYST RATING: Sell VALUATION DATE: August 3, 2017 NEXT EARNINGS DATE: October 17, 2017 Investment Thesis:
American Airlines Group Inc.
 American Airlines Group Inc. Bank of America Merrill Lynch 2018 Transportation Conference Derek Kerr Chief Financial Officer Cautionary Statement Regarding Forward-Looking Statements and Information This
1.3% millionn euros. Net debt of 5.4 improvement. euros to. Financial Year. the Air. operating. equipped. ness and. also focus on.
 25 th July 2014 Financial Year 2014: First Half results SECOND QUARTER Revenues of 6.45 billion euros, upp 1.7% like-for-like; passenger unit revenue up 1.3% at constant currency thanks to strict capacity
Investor Meeting Presentation. 4 June 2014
 Investor Meeting Presentation 4 June 2014 COMPANY OVERVIEW 1Q2014 RESULTS OVERVIEW OPERATION HIGHLIGHTS Q&A 2 Founded in 1963, listed on the Singapore Exchange in 1964 Three core businesses: - Property
Financial Results 1 st Quarter Mar/2016 (FY2015) 30 July, 2015
 30 July, 2015") Financial Results Mar/2016 (FY2015) 30 July, 2015 Today s Topics P.2 P.3 P.15 1 Overview of FY Mar/2016 Financial Results Operating Revenue Operating Profit 320 307.0 +4.9Bn (+1.6%) 312.0 50 +17.6Bn (+94.6%)
Financial Results Mar/2016 (FY2015) 30 July, 2015 Today s Topics P.2 P.3 P.15 1 Overview of FY Mar/2016 Financial Results Operating Revenue Operating Profit 320 307.0 +4.9Bn (+1.6%) 312.0 50 +17.6Bn (+94.6%)
Preliminary Figures FY 2016
 February 14, 2017 Preliminary Figures FY 2016 Capital Markets Day 2017 Tom Blades (CEO) Disclaimer This presentation has been produced for support of oral information purposes only and contains forwardlooking
VietJet Aviation Joint Stock Company Key Highlights Q1/2017 Business result. Apr 2017
 VietJet Aviation Joint Stock Company Key Highlights Q1/2017 Business result Apr 2017 Disclaimer INFORMATION CONTAINED IN OUR PRESENTATION IS INTENDED SOLELY FOR YOUR REFERENCE. SUCH INFORMATION IS SUBJECT
Southwest Airlines Co. (NYSE: LUV) ONE YEAR PRICE RANGE : $ $73.62 LAST PRICE: $ ANALYST RATING: Long. VALUATION DATE: July 13, 2017
 ONE YEAR PRICE RANGE : $ $73.62 LAST PRICE: $ ANALYST RATING: Long. VALUATION DATE: July 13, 2017") Southwest Airlines Co. (NYSE: LUV) ONE YEAR PRICE RANGE : $69.66 - $73.62 LAST PRICE: $62.08 ANALYST RATING: Long VALUATION DATE: July 13, 2017 NEXT EARNINGS DATE: July 27, 2017 Investment Thesis: Dominant
Southwest Airlines Co. (NYSE: LUV) ONE YEAR PRICE RANGE : $69.66 - $73.62 LAST PRICE: $62.08 ANALYST RATING: Long VALUATION DATE: July 13, 2017 NEXT EARNINGS DATE: July 27, 2017 Investment Thesis: Dominant
Management Presentation. September 2011
 Management Presentation September 2011 Forward looking statements This presentation as well as oral statements made by officers or directors of Allegiant Travel Company, its advisors and affiliates (collectively
INVESTOR PRESENTATION. Imperial Capital Global Opportunities Conference September 2015
 INVESTOR PRESENTATION Imperial Capital Global Opportunities Conference September 2015 Forward-looking Statements This presentation contains forward-looking statements within the meaning of the Private
PAN PACIFIC HOTELS GROUP LIMITED 2010 FULL YEAR RESULTS BRIEFING 22 FEB 2011
 PAN PACIFIC HOTELS GROUP LIMITED 2010 FULL YEAR RESULTS BRIEFING 22 FEB 2011 2010 RESULTS OVERVIEW STRATEGIC & OPERATIONS HIGHLIGHTS NEO SOON HUP CHIEF FINANCIAL OFFICER 2 CONTENTS Focus and Highlights
STAYING TRUE. BofAML Global Transportation Conference. May
 STAYING TRUE BofAML Global Transportation Conference May 19 2011 FORWARD-LOOKING STATEMENT Certain information in this presentation and statements made during this presentation, including any question
QANTAS AIRWAYS LIMITED AND CONTROLLED ENTITIES FINANCIAL REPORT FOR THE HALF-YEAR ENDED 31 DECEMBER 2003 ABN ASX CODE: QAN
 AND CONTROLLED ENTITIES FINANCIAL REPORT FOR THE HALF-YEAR ENDED 31 DECEMBER 2003 ABN 16 009 661 901 ASX CODE: QAN ABN 16 009 661 901 TABLE OF CONTENTS Appendix 4D Results for Announcement to the Market
Analyst and Investor Conference Call Q Ulrik Svensson, CFO and Member of the Executive Board
 Analyst and Investor Conference Call Q2 2017 Ulrik Svensson, CFO and Member of the Executive Board Frankfurt, 2 August 2017 Disclaimer The information herein is based on publicly available information.
Annual Results. Year ended 30 April June 2014
 1 Annual Results Year ended 30 April 2014 25 June 2014 Cautionary statement 2 This document is solely for use in connection with a briefing on the group headed by Stagecoach Group plc ( the Group ). This
Tasty way to reduce cholesterol Analyst Gathering
 Tasty way to reduce cholesterol Analyst Gathering February 2014 Table of Contents BUSINESS OVERVIEW 3 INDICATIVE 2013 RESULTS & 2014 OUTLOOK 12 2 SECTION 1 Business Overview Tasty way to reduce cholesterol
Executive Directors Review
 Financial Summary Turnover for the year ended 31 December 2011 amounted to HK$571.4 million ( 47.6 million) (2010: HK$706.8 million ( 58.7 million)). The turnover was principally attributable to the recognition
Historical Statistics
 Historical Statistics FedEx Corporation Financial and Operating Statistics FY 2005 FY 2014 This report is a statistical supplement to FedEx s interim financial reports and is prepared quarterly. Additional
Q4 & FULL YEAR FY15 RESULTS UPDATE MAY 2015
 Q4 & FULL YEAR FY15 RESULTS UPDATE MAY 2015 DISCUSSION SUMMARY Q4 & FY15 RESULTS HIGHLIGHTS OUR PORTFOLIO UPDATE AMUSEMENT PARK, BANGALORE RESORT, BANGALORE AMUSEMENT PARK, KOCHI AMUSEMENT PARK, HYDERABAD
Helloworld Travel Limited results announcement Half year ended 31 December 2017
 Helloworld Travel Limited results announcement Half year ended 31 December 2017 HIGHLIGHTS FOR THE HALF YEAR ENDED 31 DECEMBER 2017 Total Transaction Value (TTV) growth of 2.7% to $2.968 billion. Earnings