PEI Tourism Performance
|
|
|
- Earl York
- 6 years ago
- Views:
Transcription

1 PEI Tourism Performance Chris Jones Director of Strategic Initiatives Department of Economic Development and Tourism November 27, 2015


2 Presentation Outline Tourism Performance and Trends Main Results of the 2014 Exit Survey 2015 Outlook


3 Tourism Performance and Trends
4 Number of Arrivals (billion) World Tourism Inbound tourism International Tourist Arrivals and Growth Rate during the Period from 2010 to (+6.5%) 997 (+5.1%) 1,038 (+4.1%) 1,087 (+4.7%) 1,138 (+4.7%) Fifth consecutive year of robust growth International tourist arrivals (overnight visitors) hit a record billion worldwide in 2014, up from billion in Demand continued to be strong in most source markets and destinations, despite ongoing geopolitical, economic and health challenges in some parts of the world. Source: UNWTO, World Tourism Barometer, Volume 13, January 2015.
5 Rebounding Consumer Confidence Low Fuel Prices Favourable exchange rate Geopolitical uncertainty Canada s Reputation Economic Impact of Tourism 2014 Factors Influencing Tourism
6 Consumer Confidence Aug 15 Sep 15 Oct 15 CANADA Atlantic QC ON SK/MB AB Prairies (SK/MB/AB) BC Index of Consumer Confidence by Region, All Respondents (index, 2014 = 100) Source: The Conference Board of Canada
7 Consumer Confidence Improving but still not back to pre-recession levels Index of Consumer Confidence by Region, All Respondents (index, 2014 = 100) Source: The Conference Board of Canada
8 Low Prices Fueling Tourism That s about $1,500 per family, or almost enough for three Timmy s coffees per day for a year, BMO senior economist Sal Guatieri on decreased fuel prices in Source: Gas Buddy
9 Exchange Rate Influence YTD September US Trips to Canada (inbound) up 8.2% YTD September Canadian Trips to US (outbound) down 15.4% Source: Bank of Canada
10 Canada #1 Country to Visit The 2015 Country RepTrak report* ranked Canada as the country with the No. 1 best overall reputation in the world! Canada s top ranking in the 2015 Country RepTrak report is a testament to the global desire to come and visit our country and we re honoured by the recognition - Jon Mamela, CMO, Destination Canada 2015 Country Rank 1 Canada 2 Norway 3 Sweden 4 Switzerland 5 Australia 6 Finland 7 New Zealand 8 Denmark 9 Netherlands 10 Belgium *The 2015 Country RepTrak report is based on the online answers from 26,000 consumers in the G8 countries and focuses on the 55 countries around the world with the highest GDP.
11 Tourism Fuels Prosperity Tourism is a Trillion $ global business* 3 Billion dollars per day 2 Million dollars every minute 1 in 12 jobs worldwide $86 billion in 2013 in Canada, representing 618K jobs** Overseas travelers aged 24 and under surged 24% to represent 20% of all travelers to Canada Sources: * UNWTO Annual Report 2014 ** Destination Canada

12 Canada YTD to September 2015 Overall trips from all non-residents up 7.7% Overall trips from the U.S. up 8.2% Overall trips from Europe up 3.9% Overall trips from Asia up 7.2% Overall trips from China up 9.6% Overall trips from Japan up 5.5% Source: Statistics Canada Service Bulletin International Travel: Advance Information Note: The above numbers include both same day and overnight trips.
13 Number of Visitors (million) In 2014, Canada received approximately 25.6 million international visitors, up 1.6% over Of 25.6 million international visitors to Canada, million were overnight visitors, up to 3.2% over During the period from 2010 to 2014, two years (2010 and 2013), international visitors slightly declined, -0.1% and -0.4% respectively (-0.1%) 25.1 (+1.0%) 25.3 (+1.0%) Canada International Visitor Arrivals and Growth Rate during the Period from 2010 to (-0.4%) 25.6 (+1.6%) Source: Statistics Canada, International Travel: Advance Information ( )


14 Atlantic Canada Tourism
15 Nova Scotia YTD to September 2015 Visitor entries up 6% Visitor entries by road up 9% Overall room-nights sold up 2% Overall site-nights sold up 1% Airport activity up 2% Source: Nova Scotia Department of Economic and Rural Development and Tourism


16 New Brunswick YTD to September 2015 Overall room nights sold down 1% Room nights sold to New Brunswick residents down 2% Room nights sold to U.S. and International visitors up 6% Room nights sold to Canadian non-resident visitors down 1% Provincial Park campsites sold up 6% Source: New Brunswick Department of Tourism and Parks
17 Newfoundland and Labrador YTD to September 2015 Non-resident auto visitors up 4.5% Air visitors up 1.8% Fixed-roof occupancy rate down 0.3% point (YTD to August) Marine Atlantic passenger traffic up 4.8% (both directions) Source: Newfoundland & Labrador Department of Tourism, Culture and Recreation

18 Prince Edward Island Performance Non-Resident Visitors Traffic Accommodations Key Markets Key Segments 2014 Economic Impact
19 The BUILDING BLOCKS of our Research (External Sources) Traffic Attendance, etc. Surveys / Research STRAIT CROSSING LTD NORTHUMBERLAND FERRIES TRAFFIC CHARLOTTETOWN HARBOUR AUTHORITY CHARLOTTETOWN AIRPORT AUTHORITY SABRE DATA (AIR PASSENGERS) PARKS CANADA MEETINGS AND CONVENTIONS PEI GOLF PEI DESTINATION CENTRES TRAVEL INTENTIONS SURVEYS (ACTP) TRAVEL CONVERSION SURVEYS (ACTP) STATISTICS CANADA CONFERENCE BOARD OF CANADA OTHER SECONDARY RESEARCH Self-Serve Statistics Passengers Statistics Meetings on from from Lanes Enplanements and Passengers Green Ticketing Conventions, Statistics Gables, and System and Crew Province # Deplanements of Delegate Manual Air # Parties Sailings Non-Member Passenger Counselled Vehicles / # Cancellations, Origins Rounds, / Passengers Statistics # Member #Passengers Statistics Rounds at Attended Lanes License Capacity House, Upcoming Cruise Campground Passenger Plate Ships Statistics Meetings Origins Recognition / # Cancellations and Conventions Park s Statistics (Camera) Entry Statistics Points
20 The Building Blocks of our Research (Internal Sources) Occupancy Attendance / Calls Surveys OPERATORS OCCUPANCY Online PUBLICATION REQUESTS enewsletter SUBSCRIPTIONS GOOGLE ANALYTICS VISITORS INFO CENTRES CALL CENTRES HERITAGE SITES TRAVEL INTENTIONS SURVEYS TRAVEL CONVERSION SURVEYS PEI EXIT SURVEYS ROOM RATE SURVEY ECONOMIC IMPACT SOCIAL MEDIA CRM - CUSTOMER RELATIONSHIP MGT AD HOC RESEACH Room Statistics Online Nights Statistics on Subscriptions Sold, (e.g. Site Sessions Nights and Sold, & Users, Automation Acquisition, Number Engagement Parties Number Counselled of Visitors Statistics of on Publications Calls Facebook, Each Sent TPEI Twitter, and Phone Place Origin Activities Behavior, Customer of Party, (Open Conversion, Relationship Motorcoach Rates, Geo Clickthrough Management Location, Room Rates, Keyword Bounce of YouTube, Number, Residence Queues, Pinterest Duration Nights, Rates, Searches, Unsubscribes) Unit etc) Nights Available
21 Non-Resident Visitors
22 Number of Non-resident Visitors Trends in Visitation during Shoulder Season 268,265 (-2.1%) 261,133 (-2.7%) 257,595 (-1.4%) 258,941 (+0.5%) 252,221 (-2.6%) 269,500 (+6.9%) Avg. growth rate for fall shoulder season: +1.4% Avg. growth rate for spring shoulder season: +2.5% 178,943 (-1.5%) 180,993 (+1.1%) 170,186 (-6.0%) 189,353 (+11.3%) 202,596 (+7.0%) 205,928 (+6.9%) Sep-Oct Fall Shoulder Season May-Jun Spring Shoulder Season Source: Centre for Tourism Research, PEI Tourism Volume Estimation
23 Performance of Traffic Bridge. Air. Ferry. Cruise. Motorcoach.
 +8.6% +19.")
24 Overview - YTD to October Significant increase in Motorcoach ONS, Bridge and Ferry traffic as compared to Positive growth compared to the last 5 years average. YTD to October 2015 vs vs. Last 5 Years Average Bridge +6.0% +5.0% Air -1.9% +5.2% Ferry +9.1% +3.9% Cruise -2.5% +8.1% Motorcoach Overnight Stays (YTD to Sept) +8.6% +19.4% Strait Crossing Ltd (Bridge), Charlottetown Airport Authority (Air), Northumberland Ferries Ltd (Ferry), Charlottetown Harbour Authority (Cruise), Tourism PEI ITS (Motorcoach)
25 Performance of Accommodations Fixed Roof. Campground.
26 Fixed Roof Room Nights Sold 2015 Occupancy Highlights (YTD to Sep) Two (2) consecutive years of growth. +0.5% growth this year compared to last year. +5.8% growth since Campground Site nights Market Four (4) consecutive years of growth. +4.7% growth this year compared to last year. 50% growth since Growth in ONS. Quebec (+6.2%), Ontario (+2.7%), and New England (+4.3%). Source: Tourism PEI (ITS) (Occupancy) September occupancy at compliance rate of 99.9%.
27 Occupancy (Yearly Trends) +1.5% -1.6% -0.2% +1.2% +6.4% +1.0% -0.9% -1.9% -0.8% +5.5% +2.7% -3.5% +4.2% +6.1% +8.4% Fixed Roof 570, , , , ,882 Campsite 230, , , , ,218 Total 800, , , , ,100 Source: Tourism PEI (ITS) (Occupancy) September occupancy at compliance rate of 99.9%.
28 Occupancy - Overall YTD to September Occupancy (1) Fixed Roof RNS Campground SNS Overnight Stays 2015 vs 2014 % Change (Variance) +0.5% (+2,758) +4.7% (+12,363) +2.0% (+15,121) 2015 vs Last 5 Years Avg. +3.5% +16.2% +7.6% Source: Tourism PEI (ITS) (Occupancy) (1) September occupancy at compliance rate of 99.9%.
29 60% 50% 40% 30% 20% 10% Occupancy Rate (YTD) by Star Rating (All Accommodation Types) Higher Occupancy Upward Trend Lower Occupancy Downward Trend 51% to 53% 44% to 47% 33% to 30% Star Star 5 Star Star Star 0% 10 year avg ( ) 2015 Source: Tourism PEI (ITS) (Occupancy)
30 Performance of Key Markets Nova Scotia. New Brunswick. Ontario. Quebec. United States (New England & Mid-Atlantic)
31 2015 vs Occupancy by Market YTD to September Fix Roof RNS Campground SNS Overnight Stays Quebec +3.9% +10.3% +6.2% Ontario +1.2% +10.3% +2.7% US - New England +4.6% +2.8% +4.3% Nova Scotia -3.0% -1.3% -2.5% New Brunswick +0.8% -4.7% -0.8% US - Mid-Atlantic -6.8% +16.5% -3.4% Source: Tourism PEI (ITS) (Occupancy) September occupancy at compliance rate of 99.9%.

32 2015 vs Bridge Traffic by Market YTD to October Traffic Source: Strait Crossing Ltd. Ontario +17.8% Quebec +4.8% Other Canada +49.1% US - New England +6.8% Other US +17.0% Nova Scotia -9.3% New Brunswick -6.3%
33 Performance of Key Segments

34 Millenials Who are they? Born between % OF CANADA S WORKING POPULATION
35 Millenials How are they quantified? M Canadians age group (23% of all Canadians) $165B in global tourism receipts 187M international trips 20% of global travel Number of international trips forecast to double by 2020 Millennials value travel as a life experience more than any other travel segment Tech Savvy and heavy users of social media 9/10 have Facebook (8/10 Gen Xers & 7/10 Baby Boomers) Source: CTC, Canada Millennial Domestic Travel Summary Report, March 2015
36 Millenials How are they quantified? Average 3.7 Out-of-province pleasure trips of 3 or more night over a three year period (1.7 trips within Canada, and 2.5 trips abroad). July is the most popular month to travel. Cost conscious, but travel for longer periods. Average spend per trip within Canada is $1,500 Incidence of travel varies by province. Ontario and Atlantic Canadian Millennials take more trips than the rest of Canada. Quebec takes the least. Source: CTC, Canada Millennial Domestic Travel Summary Report, March 2015
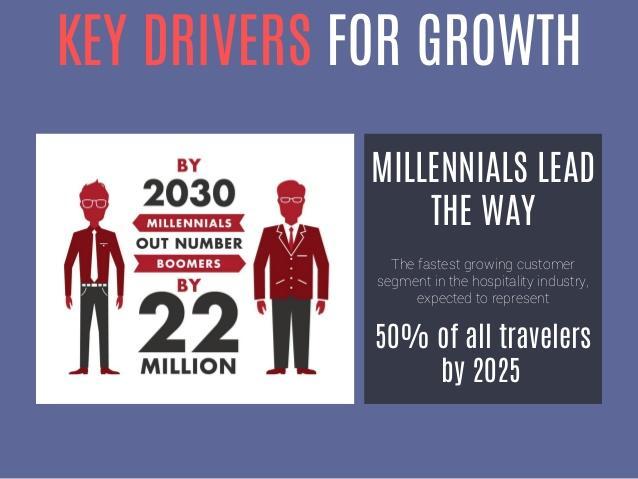

37 Millenials Driver for Future Growth
38 Millenials Travel Preferences Main Trip Drivers (Canada) (1) Outdoors Culture Spectator Sports Theme Parks Historic Sites Culinary Shopping Preferred Travel Activities (Canada) (1) Eat & drink local food Visit popular attractions Visit cultural attractions Relax on the beach Meet local people Visiting friends and relatives Attend festivals & events Get off the beaten path Hiking Top Travel Activities in PEI (2) Sightseeing/driving tour Sampling local culinary products Shopping for local crafts/souvenirs/antiques Going to a beach Visiting friends and/or relatives Visiting historical and cultural attractions Visiting a national or provincial park Sources: (1) CTC, Canada Millennial Domestic Travel Summary Report, March 2015 (2) Centre for Tourism Research. Exit Survey 2014

39 Millenials Travel Advocates Source: comscore Mobile Metrix, June 2014

40 2014 Economic Impact
41 2014 Economic Impact $401.5 Million - Direct Expenditures (1) $418.2 Million Indirect & Induced Expenditures (2) $98.9 Million in Direct Wages and Salaries (2) 7,741 Full Time Equivalent Jobs (2) $59 Million in Provincial Taxes (2) $2.6 Million in Local Taxes (2) 6.4% contribution to Provincial GDP (2) Sources: (1) Centre for Tourism Research (2) Econometric Research Ltd. Economic Impact of Tourism Expenditures in PEI

42 Main Results of the 2014 Exit Survey

43 Overview of Markets Same-Day vs. Overnight Overnight 90.5% 91.4% 93.1% Same Day 9.5% 8.6% 6.9% Significant change Source: Centre for Tourism Research. Exit Surveys 2007/08, 2012 and 2014

44 Overview of Markets First Time vs. Repeat Visitors Repeat 78.8% 80.6% 80.7% First Time 21.2% 19.4% 19.3% Significant change Source: Centre for Tourism Research. Exit Surveys 2007/08, 2012 and 2014

45 Primary Feature that Attracted Repeat Overnight Pleasure Visitor Parties to PEI 63.1% 61.3% 58.2% % 18.4% 14.1% n/a 2.6% n/a 5.0% 4.2% 4.8% 2.2% 3.6% 2.0% 1.4% 1.9% 2.2% 17.3% 9.7% 9.1% Natural beauty/ Culture Festival/Event Culinary Golf Outdoor Other Pastoral Settings/ Beaches Source: Centre for Tourism Research. Exit Surveys 2012 and 2014 Note: Results were based on a 5-point Likert type scale.

46 Party Composition Families 29.8% 28.2% 24.1% 3 or more Adults 10.9% 15.0% 15.4% 2 Adults 49.5% 46.0% 51.0% Adults travelling alone 9.8% 10.8% 9.5% Significant change Source: Centre for Tourism Research. Exit Surveys 2007/08, 2012 and 2014

47 Overall Evaluation and Satisfaction Overall Evaluation of the Trip Significant change Overall Satisfaction Source: Centre for Tourism Research. Exit Surveys 2012 and 2014 Note: Results were based on a 5-point Likert type scale.


48 Increase in Average Travel Expenditures Average Spending per Party per Visit $1, $1, Average Spending per Person per Night $72.26 $76.16 $83.51 $ Significant change Source: Centre for Tourism Research. Exit Surveys 2007/08, 2012, 2014

49 2015 Outlook
50 Canada Tourism Forecast Forecast 2016f 2017f 2018f Overnight Visits Canada 2% 2.8% 1.9% PEI 2.2% 3.2% 1.6% NS 2.3% 1.9% 1.4% NB 2.1% 1.9% 1.5% Expenditures Canada 4.7% 5.6% 4.5% PEI 4.7% 6.8% 4% NS 5.0% 4.5% 3.9% NB 4.6% 4.4% 3.9% Source: Conference Board of Canada, Travel Markets Outlook. National Focus: Tourism Insights for Canada, the Provinces, and Yukon
51 Trend in Travel Expenditures +5.1% +1.0% +5.4% +0.8% -0.3% +0.3% $379M $382M $380M $382M $401M $405M f Note: Include tourism-related spending from both non-residents and residents Source: Total expenditure: Centre for Tourism Research at TIAPEI
52 Trend in Visitation (Million) +4.3% +1.4% +5.7% +2.7% -5.4% -0.2% f Note: Include both same-day and overnight non-resident visitation Source: Total visitation: Centre for Tourism Research at TIAPEI


53 Comments & Questions?
PEI Tourism Performance
 PEI Tourism Performance Brian Dunn Manager - Evaluation, Measurements & Business Intelligence Department of Economic Development and Tourism November 25, 2016 Presentation Outline 1. Global Performance
Chris Jones. Director - Strategic Initiatives Department of Economic Development and Tourism October 25, 2018
 Chris Jones Director - Strategic Initiatives Department of Economic Development and Tourism October 25, 2018 World Tourism Economy - 2017 1.33 Billion Intl Tourist Arrivals (+7%) highest increase since
Tourism Indicators. March % Change 2017/2018. ~ = Not open / operating N/A = Not available ** = Data not comparable. Traffic
 Tourism Indicators ch 2018 ~ = Not open / operating N/A = Not available ** = Data not comparable Traffic Bridge 1.7% -3.7% 8.8% 0.7% Air -3.0% -5.3% 5.1% -7.2% Ferry Cruise Ships (Charlottetown) Motorcoach
Tourism Snapshot. June 2015 Volume 11, Issue 6. A focus on the markets in which Destination Canada (DC) and its partners are active.
 and its partners are active.") Tourism Snapshot Tourism PEI / Paul Baglole A focus on the markets in which Destination Canada (DC) and its partners are active. www.destinationcanada.com June Volume 11, Issue 6 Key highlights Over the
Tourism Snapshot Tourism PEI / Paul Baglole A focus on the markets in which Destination Canada (DC) and its partners are active. www.destinationcanada.com June Volume 11, Issue 6 Key highlights Over the
Tourism Snapshot A focus on the markets that the CTC and its partners are active in Ontario June 2011 Volume 7, Issue 6
 Tourism Snapshot Ontario A focus on the markets that the CTC and its partners are active in www.canada.travel/corporate June 2011 Volume 7, Issue 6 Key highlights In June 2011, overnight travel to Canada
Tourism Snapshot. A focus on the markets that the CTC and its partners are active in. July 2011 Volume 7, Issue 7.
 Tourism Snapshot Echo Valley Ranch and Spa, British Columbia A focus on the markets that the CTC and its partners are active in www.canada.travel/corporate July 2011 Volume 7, Issue 7 Key highlights In
Tourism Snapshot A focus on the markets that the CTC and its partners are active in
 Tourism Snapshot A focus on the markets that the CTC and its partners are active in Newfoundland and Labrador www.canada.travel/corporate October 2011 Volume 7, Issue 10 Key highlights In October 2011,
Tourism Snapshot A focus on the markets in which the CTC and its partners are active
 Tourism Snapshot A focus on the markets in which the CTC and its partners are active www.canada.travel/corporate June Volume 1, Issue 6 Key highlights CTC s overseas markets leaped 1% over the same month
Tourism Snapshot A focus on the markets in which the CTC and its partners are active
 Tourism Snapshot A focus on the markets in which the CTC and its partners are active www.canada.travel/corporate April Volume 1, Issue 4 Key highlights Total arrivals from CTC s international markets improved
Tourism Snapshot. A focus on the markets in which the CTC and its partners are active. February 2015 Volume 11, Issue 2.
 Tourism Snapshot Tourism Whistler/Mike Crane A focus on the markets in which the CTC and its partners are active www.canada.travel/corporate February Volume 11, Issue 2 Key highlights The strong beginning
Tourism Snapshot A focus on the markets in which the CTC and its partners are active
 Tourism Snapshot A focus on the markets in which the CTC and its partners are active www.canada.travel/corporate May Volume 1, Issue 5 Key highlights Total arrivals from CTC s international markets improved
Tourism Snapshot. A focus on the markets in which the CTC and its partners are active. October 2012 Volume 8, Issue 10.
 Tourism Snapshot Niagara Helicopters Tour A focus on the markets in which the CTC and its partners are active www.canada.travel/corporate October 2012 Volume 8, Issue 10 Total arrivals from CTC s international
Tourism snapshot Canadian Tourism Commission
 Canadian Tourism Commission Commission canadienne du tourisme Tourism snapshot www.canada.travel A focus on the markets that the CTC and its partners are active in Volume 5, Issue 04 Key highlights Following
Tourism Snapshot A focus on the markets that the CTC and its partners are active in
 Tourism Snapshot A focus on the markets that the CTC and its partners are active in www.canada.travel/corporate February 2011 Volume 7, Issue 2 Key highlights In the first two months of 2011 overnight
Tourism Snapshot A focus on the markets in which the CTC and its partners are active
 Tourism Snapshot A focus on the markets in which the CTC and its partners are active www.canada.travel/corporate January 214 Volume 1, Issue 1 Key highlights Total arrivals from CTC s international markets
Tourism Snapshot Year-in-review. Facts & Figures 5th edition.
 Tourism Snapshot 2010 Year-in-review Facts & Figures 5th edition www.canada.travel/corporate Tourism highlights In 2010, international visitors made15.9 million overnight trips to Canada, up 1.8% compared
Tourism Snapshot A Monthly Monitor of the Performance of Canada s Tourism Industry
 Tourism Snapshot A Monthly Monitor of the Performance of Canada s Tourism Industry December 2015 Volume 11, Issue 12 www.destinationcanada.com Tourism Snapshot December 2015 1 2 Tourism Snapshot December
Tourism Snapshot A Monthly Monitor of the Performance of Canada s Tourism Industry
 Tourism Snapshot A Monthly Monitor of the Performance of Canada s Tourism Industry December Volume 12, Issue 12 Michelle Valberg www.destinationcanada.com Tourism Snapshot December 1 KEY HIGHLIGHTS With
Tourism Snapshot A focus on the markets that the CTC and its partners are active in
 Tourism Snapshot A focus on the markets that the CTC and its partners are active in Nahanni National Park, NWT www.canada.travel/corporate February 2012 Volume 8, Issue 2 Key highlights Following through
Yukon Tourism Indicators Year-End Report Yukon Tourism Indicators Year-End Report 2015
 Yukon Tourism Indicators Overview The Yukon Tourism Indicators is published by the Department of Tourism and Culture as a companion to the monthly Yukon Tourism Visitation Report. This document is intended
Tourism Snapshot A Monthly Monitor of the Performance of Canada s Tourism Industry
 Tourism Snapshot A Monthly Monitor of the Performance of Canada s Tourism Industry July 2018 Volume 14, Issue 6 www.destinationcanada.com Tourism Snapshot July 2018 1 KEY HIGHLIGHTS IMPORTANT: The July
Tourism Snapshot A Monthly Monitor of the Performance of Canada s Tourism Industry
 Tourism Snapshot A Monthly Monitor of the Performance of Canada s Tourism Industry September Volume 14, Issue 8 Tourism Toronto www.destinationcanada.com Tourism Snapshot September 1 KEY HIGHLIGHTS IMPORTANT
Tourism Statistics RTO 1
 Tourism Statistics RTO 1 Tourism Research Unit Spring 2012 1 1 Ontario Tourism 2 2 Ontario Tourism Indicators 2011* Visits increased by 1.3% to 104.4 million. Visits from Ontario and overseas countries
Tourism Snapshot A Monthly Monitor of the Performance of Canada s Tourism Sector
 Tourism Snapshot A Monthly Monitor of the Performance of Canada s Tourism Sector December Volume 14, Issue 12 www.destinationcanada.com Tourism Snapshot December 1 Newfoundland and Labrador Tourism KEY
Tourism Snapshot A Monthly Monitor of the Performance of Canada s Tourism Industry
 Tourism Snapshot A Monthly Monitor of the Performance of Canada s Tourism Industry October 2018 Volume 14, Issue 9 Brian Caissie www.destinationcanada.com Tourism Snapshot October 2018 1 KEY HIGHLIGHTS
Tourism Snapshot A Monthly Monitor of the Performance of Canada s Tourism Industry
 Tourism Snapshot A Monthly Monitor of the Performance of Canada s Tourism Industry Volume 14, Issue 5 www.destinationcanada.com Tourism Snapshot 1 KEY HIGHLIGHTS IMPORTANT: The frontier counts released
Tourism Snapshot. A focus on the markets in which the CTC and its partners are active. January 2013 Volume 9, Issue 1.
 Tourism Snapshot Nathan Phillips Square Skating Rink at City Hall Francisco Pardo A focus on the markets in which the CTC and its partners are active www.canada.travel/corporate January 2013 Volume 9,
BRANSON 2 nd QUARTER 2014 MARKETING REPORT
 BRANSON 2 nd QUARTER 2014 MARKETING REPORT October 14, 2014 Branson Convention & Visitors Bureau PRESENTATION OVERVIEW Economic Overview Travel Industry Update Branson 2Q 2014 Update ECONOMIC OUTLOOK Consumer
Tourism Snapshot A Monthly Monitor of the Performance of Canada s Tourism Industry
 Tourism Snapshot A Monthly Monitor of the Performance of Canada s Tourism Industry May 2018 Volume 14, Issue 4 Greg Funnell www.destinationcanada.com Tourism Snapshot May 2018 1 KEY HIGHLIGHTS Note: This
Tourism Snapshot A Monthly Monitor of the Performance of Canada s Tourism Industry
 Tourism Snapshot A Monthly Monitor of the Performance of Canada s Tourism Industry January 2017 Volume 13, Issue 1 Edmonton Tourism www.destinationcanada.com Tourism Snapshot January 2017 1 KEY HIGHLIGHTS
Tourism Statistics RTO 11
 Tourism Statistics RTO 11 Tourism Research Unit Spring 2012 1 1 Tourism 2 2 Tourism Indicators 2011* Visits increased by 1.3% to 104.4 million. Visits from and overseas countries increased, while visits
Key Tourism Indicators January to September 2017
 Department of Tourism, Culture, Industry and Innovation (TCII) Year-To-Date (YTD) Tourism Highlights September 2017* (*Data presented is subject to change, reporting period may vary by indicator) The number
Tourism Snapshot A Monthly Monitor of the Performance of Canada s Tourism Industry
 Tourism Snapshot A Monthly Monitor of the Performance of Canada s Tourism Industry February 2017 Volume 13, Issue 2 www.destinationcanada.com Tourism Snapshot February 2017 1 KEY HIGHLIGHTS Canada welcomed
BC JOBS PLAN ECONOMY BACKGROUNDER. Current statistics show that the BC Jobs Plan is working: The economy is growing and creating jobs.
 We know that uncertainty continues to remain in the global economy and we expect to see some monthly fluctuations in jobs numbers. That is why we will continue to create an environment that is welcoming
The Economic Impacts of Cultural and Sport Tourism in Canada 2007
 The Economic Impacts of Cultural and Sport Tourism in Canada 2007 The Outspan Group Inc. The Economic Impacts of Cultural and Sport Tourism in Canada 2007 March 2009 ISBN: 978-1-100-13917-3 Catalogue number:
Jan-18. Dec-17. Travel is expected to grow over the coming 6 months; at a slower rate
 Analysis provided by TRAVEL TRENDS INDEX DECEMBER 2018 CTI reading of 51.8 in December 2018 indicates that travel to or within the U.S. grew 3.6% in December 2018 compared to December 2017. LTI predicts
Oct-17 Nov-17. Sep-17. Travel is expected to grow over the coming 6 months; at a slightly faster rate
 Analysis provided by TRAVEL TRENDS INDEX SEPTEMBER 2018 CTI reading of.8 in September 2018 indicates that travel to or within the U.S. grew 1.6% in September 2018 compared to September 2017. LTI predicts
BUSINESS BAROMETER December 2018
 Credit: Chris Orange BUSINESS BAROMETER December Credit: Nigel Moore 1 Contents Summary of findings 3 Annual monthly performance: visitor attractions..4 Visit Herts Team update 5 National context.8 Visitor
THE GROWTH OF THE HOSPITALITY INDUSTRY IN DUBAI
 THE GROWTH OF THE HOSPITALITY INDUSTRY IN DUBAI THE DEFINITION OF TOURISM Tourism is travel for recreational, leisure or business purposes. The World Tourism Organization defines tourists as people "traveling
Oct-17 Nov-17. Travel is expected to grow over the coming 6 months; at a slower rate
 Analysis provided by TRAVEL TRENDS INDEX OCTOBER 2018 CTI reading of 51.6 in October 2018 indicates that travel to or within the U.S. grew 3.2% in October 2018 compared to October 2017. LTI predicts travel
Tourism Snapshot A Monthly Monitor of the Performance of Canada s Tourism Industry
 Tourism Snapshot A Monthly Monitor of the Performance of Canada s Tourism Industry February Volume 14, Issue 1 www.destinationcanada.com Tourism Snapshot February 1 KEY HIGHLIGHTS After a slow start in
Yukon Tourism Indicators Year-End Report 2013
 Yukon Tourism Indicators Yukon Tourism Indicators Overview This document is intended to provide a snapshot of tourism indicators for Yukon for 2013 (January to December). Contents 2013 Tourism Review 3
Tourism Snapshot A Monthly Monitor of the Performance of Canada s Tourism Industry
 Tourism Snapshot A Monthly Monitor of the Performance of Canada s Tourism Industry April 2018 Volume 14, Issue 3 www.destinationcanada.com Tourism Snapshot April 2018 1 KEY HIGHLIGHTS Following an exceptionally
2017 NOVA SCOTIA VISITOR EXIT SURVEY. Overall Results
 2017 NOVA SCOTIA VISITOR EXIT SURVEY Overall Results TABLE OF CONTENTS Introduction... 1 Visitor Profile... 3 Visitor Expenditures... 28 Accommodations... 37 Visitor Activities... 49 Satisfaction... 60
Ontario Tourism Facts & Figures
 Winter 2006 Vol. 5, No. 4 Ontario Tourism Facts & Figures In This Issue Economic Outlook Canada and Ontario Tourism Statistics International Travel Account International Border Crossings Accommodations
Russia 12% Russia 24% Foreign overnight stays 31% Domestic overnight stays 69% 8.3 MILLION FOREIGN VISITORS IN FINLAND IN 2017
 TOURISM IS A GROWING SOURCE OF EXPORT REVENUE AND A SIGNIFICANT EMPLOYMENT PROVIDER IN FINLAND TOURISM HAS A MULTIPLIER EFFECT ON OTHER SECTORS. 1 EURO IN TOURISM ADDS 56 CENTS VALUE TO THE OTHER SECTORS.
Tourism Snapshot Year-in-review. Facts & Figures 6th edition.
 Tourism Snapshot 2011 Year-in-review www.canada.travel/corporate Facts & Figures 6th edition Tourism in the Canadian Economy Tourism Demand (2011) $ billions 11/10 % Total demand 78.8 7.5 Domestic 63.7
Economic Impact of Tourism in Hillsborough County September 2016
 Economic Impact of Tourism in Hillsborough County - 2015 September 2016 Key findings for 2015 Almost 22 million people visited Hillsborough County in 2015. Visits to Hillsborough County increased 4.5%
Japan 3% Foreign overnight stays 31% Domestic overnight stays 69% 8.3 MILLION FOREIGN VISITORS IN FINLAND IN 2017
 TOURISM IS A GROWING SOURCE OF EXPORT REVENUE AND A SIGNIFICANT EMPLOYMENT PROVIDER IN FINLAND TOURISM HAS A MULTIPLIER EFFECT ON OTHER SECTORS. 1 EURO IN TOURISM ADDS 56 CENTS VALUE TO THE OTHER SECTORS.
2014 Tourism Statistics Region 12
 2014 Tourism Statistics Region 12 Tourism Research Unit Fall 2016 Economic Indicators Source: Oxford Economics; Ontario Ministry of Tourism, Culture and Sport 2 2014 Notable Events February 7 23 The XXII
America 6% Russia 12%
 TOURISM IS A GROWING SOURCE OF EXPORT REVENUE AND A SIGNIFICANT EMPLOYMENT PROVIDER IN FINLAND TOURISM HAS A MULTIPLIER EFFECT ON OTHER SECTORS. 1 EURO IN TOURISM ADDS 56 CENTS VALUE TO THE OTHER SECTORS.
49 May-17. Jun-17. Travel is expected to grow over the coming 6 months; at a slower rate
 Analysis provided by TRAVEL TRENDS INDEX MAY 2018 CTI reading of 51.7 in May 2018 shows that travel to or within the U.S. grew 3.4% in May 2018 compared to May 2017. LTI predicts moderating travel growth
Ontario Tourism Facts & Figures
 IN THIS ISSUE Economic Outlook Ontario and Canada Tourism Statistics International Border Crossings International Travel Account Accommodations Tourism Related Employment Visitor Inquiries Travel Price
2010 Nova Scotia Visitor Exit Survey Regional Report
 2010 Nova Scotia Visitor Exit Survey Regional Report A Look at Visitors Who Included Yarmouth and Acadian Shores in their Trip to Nova Scotia Reproduction in whole or in part is not permitted without the
Tourism Statistics Region 1
 Tourism Statistics Region 1 Tourism Research Unit Winter 2011 1 Summary In 2008, there were 101.0 million visits in and visitors spent $17.6 billion residents account for the majority of visits and spending
China 17% Foreign overnight stays 31% Domestic overnight stays 69% 8.3 MILLION FOREIGN VISITORS IN FINLAND IN 2017
 TOURISM IS A GROWING SOURCE OF EXPORT REVENUE AND A SIGNIFICANT EMPLOYMENT PROVIDER IN FINLAND TOURISM HAS A MULTIPLIER EFFECT ON OTHER SECTORS. 1 EURO IN TOURISM ADDS 56 CENTS VALUE TO THE OTHER SECTORS.
BRAZIL INTERNATIONAL INBOUND TRAVEL MARKET PROFILE (2011) Copyright 2012 by the U.S. Travel Association. All Rights Reserved.
 Copyright 2012 by the U.S. Travel Association. All Rights Reserved.") BRAZIL INTERNATIONAL INBOUND TRAVEL MARKET PROFILE (211) Copyright 212 by the U.S. Travel Association. All Rights Reserved. EXECUTIVE SUMMARY With a population of nearly 2 million and a GDP exceeding $2
BRAZIL INTERNATIONAL INBOUND TRAVEL MARKET PROFILE (211) Copyright 212 by the U.S. Travel Association. All Rights Reserved. EXECUTIVE SUMMARY With a population of nearly 2 million and a GDP exceeding $2
Outlook for International Inbound Travel to North America - The International Marketplace: What's Happening?
 University of Massachusetts Amherst ScholarWorks@UMass Amherst Tourism Travel and Research Association: Advancing Tourism Research Globally 2014 Marketing Outlook Forum - Outlook for 2015 Outlook for International
Tourism in Alberta. A Summary Of Visitor Numbers, Revenue & Characteristics Research Resolutions & Consulting Ltd.
 Tourism in Alberta A Summary Of Visitor Numbers, Revenue & Characteristics 2001 Alberta North Canadian Rockies Edmonton & Area Alberta Central Calgary & Area Policy & Economic Analysis Alberta South March
2010 Nova Scotia Visitor Exit Survey Regional Report
 2010 Nova Scotia Visitor Exit Survey Regional Report A Look at Visitors Who Included Cape Breton in their Trip to Nova Scotia Reproduction in whole or in part is not permitted without the express permission
Norway MARKET REVIEW Norwegian Visitors in Finland Statistical Trends and Profile
 Norway MARKET REVIEW 2015 Norwegian Visitors in Finland Statistical Trends and Profile 24.11.2016 STATISTICS ON NORWEGIAN TOURISM IN FINLAND STATISTICAL TRENDS 3 Registered overnights 4 Number of visitors
Belgium. Belgian Visitors in Finland Statistical Trends and Profile
 Belgium M A R K E T R E V I E W 2 0 1 5 Belgian Visitors in Finland Statistical Trends and Profile 24.10.2016 STATISTICS ON BELGIAN TOURISM IN FINLAND STATISTICAL TRENDS 3 Registered overnights 4 Number
Tourism Snapshot A Monthly Monitor of the Performance of Canada s Tourism Industry
 Tourism Snapshot A Monthly Monitor of the Performance of Canada s Tourism Industry March Volume 14, Issue 2 Tourism Saskatoon / Carey Shaw www.destinationcanada.com Tourism Snapshot March 1 KEY HIGHLIGHTS
2012 Canadian Visitation to North Carolina
 2012 Canadian Visitation to North Carolina July 2013 North Carolina Division of Tourism, Film and Sports Development Volume & Spending ($millions) +29.7% +3.6% +0.1% +4.6% +12.0% -0.1% +17.0% -6.7% $78,523
Ontario Tourism Facts & Figures
 IN THIS ISSUE Economic Outlook Ontario and Canada Tourism Statistics International Travel Account International Border Crossings Accommodations Travel Price Index Tourism-Related Employment Food Service
48 Oct-15. Nov-15. Travel is expected to grow over the coming 6 months; at a slower rate
 Analysis provided by TRAVEL TRENDS INDE OCTOBER 2016 CTI shows travel grew in October 2016. LTI predicts easing travel growth through the first four months of 2017, with some momentum sustained by domestic
Western Cape Destination Performance Report: April-June 2016
 Number of arrivals (millions) Western Cape Destination Performance Report: April-June 2016 Global Tourism Performance According to the United Nations World Tourism Organisation, international tourist arrivals
Ontario Sport Tourism Statistics 2014
 Ontario Sport Tourism Statistics 2014 Tourism Research Unit Winter 2017 This report summarizes key characteristics of visitors and visitor spending of trips in Ontario which included: Attend a sports event
AUCKLAND DESTINATION OVERVIEW
 AUCKLAND DESTINATION OVERVIEW October 218 An in-depth overview of Auckland s visitor economy from the latest arrival, accommodation, spend, cruise and event data through to past five- commentary. Prepared
United Kingdom: Tourism Market Insights 2017
 United Kingdom: Tourism Market Insights 2017 Overview This tourism report provides an outlook on key market insights on a global, national and provincial scale for the United Kingdom (UK). In addition,
Mar-16. Apr-16. Travel is expected to grow over the coming 6 months; at a slower rate
 Analysis provided by TRAVEL TRENDS INDE MARCH 2017 CTI reading of.8 in March 2017 shows that travel to and within the U.S. grew by 3.6% from March 2016 to March 2017. LTI predicts overall positive travel
DCBA Industry Update October 2018
 DCBA Industry Update October 2018 Product Innovation Product Product Innovation Innovation Objective: Enhance the Facilitate industry the partnership expansion of the tourism program season for the in
LITERACY IN NOVA SCOTIA Implications of Findings from IALSS 2003
 LITERACY IN NOVA SCOTIA Implications of Findings from IALSS 03 Presented by Satya Brink, Ph.D. Director, National Learning Policy Research Learning Policy Directorate, HRSDC January 06 1 Key Questions
France. French Visitors in Finland Statistical Trends and Profile
 France M A R K E T R E V I E W 2 0 1 5 French Visitors in Finland Statistical Trends and Profile 14.10.2016 STATISTICS ON FRENCH TOURISM IN FINLAND STATISTICAL TRENDS 3 Registered overnights 4 Number of
The Economic Impact of Tourism in Hillsborough County, June 2018
 The Economic Impact of Tourism in Hillsborough County, 2017 June 2018 Table of contents 1) Key Findings for 2017 3 2) Local Tourism Trends 7 3) Trends in Visits and Spending 12 4) The Domestic Market 19
Tourism in Alberta. A Summary Of Visitor Numbers, Revenue & Characteristics 2004
 Tourism in Alberta A Summary Of Visitor Numbers, Revenue & Characteristics 2004 Alberta North Based on the 2004 Canadian & International Travel Surveys (Statistics Canada) Canadian Rockies Edmonton & Area
WHAT ARE THE TRENDS TO LOOK OUT FOR?
 WHAT ARE THE TO LOOK OUT FOR? Prepared by IPK International on behalf of ITB Berlin, The World s Leading Travel Trade Show INTRODUCTION The global tourism industry continues its success story with another
Statistical Overview of the Canadian Honey Industry 2013
 Statistical Overview of the Canadian Honey Industry 2013 Prepared by: Market Analysis and Information Section Horticulture and Cross Sectoral Division Agriculture and Agri-Food Canada September 2014 Her
Maine Office of Tourism Visitor Tracking Research 2015 Calendar Year Annual Report Canadian Visitors
 Maine Office of Tourism Visitor Tracking Research 2015 Calendar Year Annual Report Prepared by May 2016 1 1 Table of Contents Research Objectives and Methodology 4 Canadian Overnight Visitors: Traveler
Global Tourism Watch China - Summary Report
 Global Tourism Watch 2010 China - Summary Report Table of Contents 1. Research Objectives... 1 2. Methodology... 1 3. Market Health & Outlook... 1 4. Unaided Destination Awareness... 2 5. Canada s Value
2012 Coach & Charter Seminar. 21 February 2012 Presented by Amanda Coghlan Strategic Insights Analyst
 2012 Coach & Charter Seminar 21 February 2012 Presented by Amanda Coghlan Strategic Insights Analyst Destination NSW Lead Government agency for the NSW tourism and events sectors Established as a statutory
Latest Tourism Trends. Humphrey Walwyn Head of VisitEngland Research
 Latest Tourism Trends Humphrey Walwyn Head of VisitEngland Research 1 Inbound Tourism 2 2003 2004 2005 2006 2007 2008 2009 2010 2011 2012 2013 2014 2015 2016 2017 UK inbound long term trend Spend per visit
2014 Tourism Statistics Region 8
 2014 Tourism Statistics Region 8 Tourism Research Unit Fall 2016 Economic Indicators Source: Oxford Economics; Ministry of Tourism, Culture and Sport 2 2014 Notable Events February 7 23 The XXII Olympic
Prospects for international tourism
 Prospects for international tourism Project LINK UN DESA Expert Group Meeting on the World Economy, NYC, USA 24-26 October 211 John G.C. Kester Programme Manager, Tourism Trends and Marketing Strategies
Ontario Arts and Culture Tourism Profile Executive Summary
 Ontario Arts and Culture Tourism Profile Executive Summary Prepared by for Ontario Arts Council November 2012 ONTARIO ARTS AND CULTURE TOURISM PROFILE EXECUTIVE SUMMARY The Ontario Arts Council (OAC) commissioned
Spain. Spanish Visitors in Finland Statistical Trends and Profile
 Spain M A R K E T R E V I E W 2 0 1 5 Spanish Visitors in Finland Statistical Trends and Profile 25.10.2016 STATISTICS ON SPANISH TOURISM IN FINLAND STATISTICAL TRENDS 3 Registered overnights 4 Number
AUCKLAND DESTINATION OVERVIEW
 AUCKLAND DESTINATION OVERVIEW September 218 An in-depth overview of Auckland s visitor economy from the latest arrival, accommodation, spend, cruise and event data through to past five- commentary. Prepared
Tourism Trends, Outlook and Issues. John G.C. Kester. 6th UNWTO/PATA Forum on Tourism Trends and Outlook. Guilin, China October 2012 day 1
 Tourism Trends, Outlook and Issues 6th UNWTO/PATA Forum on Tourism Trends and Outlook Guilin, China 11-13 October 212 day 1 John G.C. Kester Programme Manager, Tourism Trends and Marketing Strategies World
TOURISM NOVA SCOTIA INFORMATION & OPPORTUNITIES. October 11, Presented by Tourism Nova Scotia To South Shore Tourism Industry Stakeholders
 TOURISM NOVA SCOTIA INFORMATION & OPPORTUNITIES October 11, 2018 Presented by Tourism Nova Scotia To South Shore Tourism Industry Stakeholders 1 TODAY S DISCUSSION Tourism Nova Scotia Overview Marketing
Sweden. Swedish Visitors in Finland Statistical Trends and Profile
 Sweden M A R K E T R E V I E W 2 0 1 5 Swedish Visitors in Finland Statistical Trends and Profile 26.10.2016 STATISTICS ON SWEDISH TOURISM IN FINLAND STATISTICAL TRENDS 3 Registered overnights 4 Number
National Market Report
 National Market Report November 2015 In November 2015, the national hotel sample experienced a 2.8 point decrease in occupancy from November 2014 to 57.8%. The November 2015 average daily room rate for
Foreign overnight stays 31% Domestic overnight stays 69% 8.3 MILLION FOREIGN VISITORS IN FINLAND IN 2017
 TOURISM IS A GROWING SOURCE OF EXPORT REVENUE AND A SIGNIFICANT EMPLOYMENT PROVIDER IN FINLAND TOURISM HAS A MULTIPLIER EFFECT ON OTHER SECTORS. 1 EURO IN TOURISM ADDS 56 CENTS VALUE TO THE OTHER SECTORS.
Canadian Travel Survey
 Catalogue no. 87-212-XIE Canadian Travel Survey Domestic Travel, 2002 How to obtain more information Specific inquiries about this product and related statistics or services should be directed to: Client
South Australian Tourism Industry Council SA Tourism Barometer March Quarter 2015
 South Australian Tourism Industry Council SA Tourism Barometer March Quarter 2015 Headline: Events Season Provides a Lift In the March quarter 2015 survey the business activity index increased by 6% -
The Millennial Traveller 2018
 The Millennial Traveller 2018 Counter Intelligence Retail Counter Intelligence Retail is the travel retail industry s leading agency, with services covering areas including research, category development
Tourism in Alberta. A Summary of 2012 Visitor Numbers and Characteristics. June 2014
 Tourism in Alberta 2012 A Summary of 2012 Visitor Numbers and Characteristics June 2014 Introduction Whether to see their friends and relatives, for business, or for pleasure, 33.1 million total visits
Tourism Statistics Parry Sound District
 Tourism Statistics Parry Sound District Tourism Research Unit Spring 2014 Note: due to changes in Statistics Canada s survey methodology, 2011 domestic data is not comparable to prior years 2 Ontario Tourism
ALBERTA ACCOMMODATION OUTLOOK 2018
 ALBERTA ACCOMMODATION OUTLOOK 2018 ALBERTA HOTEL & LODGING ASSOCIATION APRIL 17, 2018 PRESENTATION OUTLINE National Western Canada Alberta Calgary & Edmonton Investment Trends Key Takeaways Questions NATIONAL
visitor insights 2016
 visitor insights 2016 table of contents Purpose of Report 3 Surf Coast Data Regions 3 Maps 3 Executive Summary 4 Summary of Total Visitation to Surf Coast 5 Total Visitation and Visitor Nights 5 Total
Nova Scotia Tourism Indicators August 2017
 Nova Scotia Tourism Indicators August 2017 Data as of September 28, 2017 2017 Tourism Visitation YTD Jan Feb Mar Apr May Jun Jul Aug Sep Oct Nov Dec Visitor Entries ('000s) Road Visits by Entry Point*