TAMIL NADU A Socio-Economic Snapshot 2015
|
|
|
- Miles Abner Owen
- 6 years ago
- Views:
Transcription


1 TAMIL NADU A Socio-Economic Snapshot 2015
2
3 TITLE Tamil Nadu: A Socio-Economic Snapshot 2015 YEAR September, 2015 AUTHORS COPYRIGHT Strategic Government Advisory (SGA), YES BANK No part of this publication may be reproduced in any form by photo, photoprint, microfilm or any other means without the written permission of YES BANK Ltd. This report is the publication of YES BANK Limited ( YES BANK ) and so YES BANK has editorial control over the content, including opinions, advice, statements, services, offers etc. that is represented in this report. However, YES BANK will not be liable for any loss or damage caused by the reader s reliance on information obtained through this report. This report may contain third party contents and third-party resources. YES BANK takes no responsibility for third party content, advertisements or third party applications that are printed on or through this report, nor does it take any responsibility for the goods or services provided by its advertisers or for any error, omission, deletion, defect, theft or destruction or unauthorized access to, or alteration of, any user communication. Further, YES BANK does not assume any responsibility or liability for any loss or damage, including personal injury or death, resulting from use of this report or from any content for communications or materials available on this report. The contents are provided for your reference only. DISCLAIMER The reader/ buyer understands that except for the information, products and services clearly identified as being supplied by YES BANK, it does not operate, control or endorse any information, products, or services appearing in the report in any way. All other information, products and services offered through the report are offered by third parties, which are not affiliated in any manner to YES BANK. The reader/ buyer hereby disclaims and waives any right and/ or claim, they may have against YES BANK with respect to third party products and services. All materials provided in the report is provided on As is basis and YES BANK makes no representation or warranty, express or implied, including, but not limited to, warranties of merchantability, fitness for a particular purpose, title or non infringement. As to documents, content, graphics published in the report, YES BANK makes no representation or warranty that the contents of such documents, articles are free from error or suitable for any purpose; nor that the implementation of such contents will not infringe any third party patents, copyrights, trademarks or other rights. In no event shall YES BANK or its content providers be liable for any damages whatsoever, whether direct, indirect, special, consequential and/or incidental, including without limitation, damages arising from loss of data or information, loss of profits, business interruption, or arising from the access and/or use or inability to access and/or use content and/or any service available in this report, even if YES BANK is advised of the possibility of such loss.maps depicted in the report are graphical representation for general representation only. YES BANK Ltd. Nikhil Sahni Senior President Government Relationship Management & Strategic Government Advisory Registered and Head Office CONTACTS 9 th Floor, Nehru Centre, Dr. Annie Besant Road, Worli, Mumbai Tel : Fax : Northern Regional Office 48, Nyaya Marg, Chanakyapuri New Delhi Tel : Nikhil.Sahni@yesbank.in Website :
4

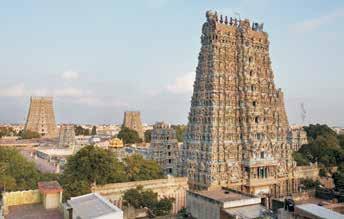
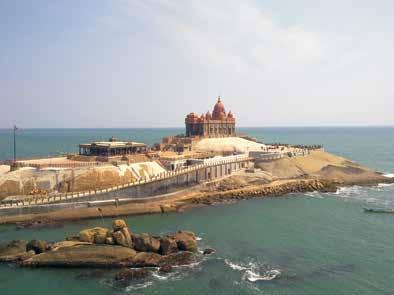
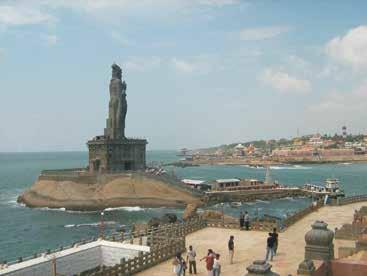
5 FOREWORD TAMIL NADU The Land of Abundant Opportunities is the second largest state economy in India, contributing about 8.5% of the country s Gross Domestic Product (GDP) in FY14. The state is one of the most Urban and Industrialized states and has emerged as the foremost manufacturing and technology hub. Leading companies in major sectors like Automobiles, Auto-components, Engineering, Textiles & Garments, Leather & Leather products, Chemicals & Plastics among others have chosen Tamil Nadu for their operation. Chennai, the Detroit of India has positioned itself as the economic hub for South India. The rate of growth of services sector in Tamil Nadu is also commendable with a contribution of 65% to the state economy. Tourism has been a key sector with Tamil Nadu achieving the numero uno status in both domestic & foreign tourist footfalls for This reflects the dynamic development of the state across sectors. In terms of infrastructure, Tamil Nadu has an excellent road and rail network, three major ports and 23 minor ports, and seven airports across the state ensuring excellent connectivity. The backbone to this focused development is highly responsive and efficient governance making Tamil Nadu an investment destination of choice. The Government of Tamil Nadu has framed numerous policies that promote industrial development. The Vision 2023 Tamil Nadu launched by Hon ble Chief Minister Selvi J. Jayalalithaa envisages an investment of Rs 15,00,000 Crores by 2023, consolidating the state s position as the Number One state in the country. I congratulate the State Government for organizing the Tamil Nadu Global Investors Meet (TN GIM) 2015 which, I believe will significantly benefit the state and the country. I am sure the competitive policies of the state, coupled with efficient governance would form a strong foundation for investors to thrive. As a proud partner of TN GIM 2015, I am pleased to present the YES Bank Knowledge Report Tamil Nadu A Socio Economic Snapshot 2015 which highlights the socio-economic profile of Tamil Nadu, the current state of its infrastructure & resources and provides snapshots of certain key sectors in the state. The report spells out the competitive advantage enjoyed by the state and helps position it as one of the most preferred investment destinations in India. I am confident that the report will be a useful reference for the investor community and shall provide impetus to the growing economy in TAMIL NADU. Thank You, Sincerely, Rana Kapoor Managing Director & CEO
6
7 Contents 1. Introduction...12 Tamil Nadu An Overview...12 Demographic Profile...12 Institutional Setup in Tamil Nadu Economy of Tamil Nadu...16 Gross State Domestic Product (GSDP) Analysis...16 Fundamental Analysis of GSDP of Tamil Nadu...18 Fiscal Indicators...20 Investment Flows Infrastructure & Related Resources in Tamil Nadu...24 New Initiatives for Infrastructure Project...24 Roadways...25 Railways...26 Port...27 Airports...28 Urban Infrastructure...30 Power...30 Telecommunications...32 Human Resources Sector Snapshot in Tamil Nadu...36 Agriculture...36 Industrialization in Tamil Nadu...37 Automobile & Auto Components Industry...37 Biotechnology Industry...38 Electronics & IT Industry...39 Textile Industry...40 Cement Industry Annexure...42 Annexure 1: District Map of Tamil Nadu...42 Annexure 2: Road Network Map of Tamil Nadu...43 Annexure 3: Rail Network Map of Tamil Nadu...44 Annexure 4: Industrial Map of Tamil Nadu...45
8 List of Figures Figure 1: District-wise population of Tamil Nadu in Figure 2: Trends in GSDP of Tamil Nadu (Unit: INR Crore) Figure 3: Trends in Contribution of Various Sectors to TN GSDP Figure 4: Trends in Growth Rates of Various Sectors of TN GSDP Figure 5: District-wise Distribution of GSDP for Tamil Nadu Figure 6: Trends in Primary Sector output of Tamil Nadu (Units: INR Crore) Figure 7: Trends in Industrial Sector output of Tamil Nadu Figure 8: Trends in Industrial Sector output of Tamil Nadu Figure 9: Revenue and Fiscal Deficit of Tamil Nadu as a Percentage of GSDP Figure 10: Ranking of states in India based on Cumulative FDI inflows from April 2000 to March 2015 (Units: INR Crore) Figure 11: Classification of Road in Tamil Nadu for the year Figure 12: Break-up of National Highways in Tamil Nadu for the year Figure 13: Trends in Traffic Handled at Major Ports in South India for the year to (Million Tonnes) Figure 14: Share of Top 10 Indian Airports by Passenger Traffic in the year Figure 15: Share of Top 10 Indian Airports by freight movement (in tons) in the year Figure 16: Trends in Total Passenger Traffic (million)at Chennai Airport for the year to Figure 17: Trends in Total Freight Movement at Chennai Airport for the year to Figure 18: Break up of installed power capacity in Tamil Nadu based on source of generation and the ownership Figure 19: Category wise consumers of power as on March 2014 (in Lakh) Figure 20: Trends in Demand-Supply of Peak (MW) in Tamil Nadu for the year to Figure 21: Comparative Analysis of Tele-density in South India Figure 22: Comparative Analysis of Literacy rate in Tamil Nadu Figure 23: Incremental HR Availability for the period for Tamil Nadu (Units: Million Persons) Figure 24: Trends of Industrialization in Tamil Nadu to Figure 25: IT Exports from Tamil Nadu (Units: INR Crore) Figure 26: Cement Capacity and Production in Tamil Nadu (Units: Million Tonnes)... 40
9 List of Tables Table 1: Socio-Economic Profile of the State 12 Table 2: Institutional Profile of Tamil Nadu 13 Table 3: Fiscal Indicators of Tamil Nadu 21 Table 4: Proposed Investment for each sector as per Vision Table 5: Comparison of road length, road density and growth rate of road length of 25 various states in India Table 6: Comparative Analysis of Rail Tracks among Southern States as on Table 7: Major Port-wise capacity utilization during (million tonnes) 28 Table 8: Peak Power demand & supply trend - South India and UT to Table 9: Comparative Analysis of Trends Aggregate Technical and Commercial (AT&C) 32 Losses - Southern India (%) Table 10: Data on Cultivation Area And Production in Tamil Nadu 36
10
11 Introduction 01
12 Introduction Tamil Nadu An Overview Tamil Nadu is the eleventh largest state in India with 32 districts encompassing an area of 130,058 Sq. Km. In Tamil Nadu emerged as the second largest state economy in India with a Gross State Domestic Product of INR 5,15,458 Crore ( Constant Prices). Automotive, Manufacturing, IT, Agri-business and Textiles are few of the crucial sectors in the state. Table 1: Socio-Economic Profile of the State Area 130,058 Sq. Km 11 th largest in India Capital City Chennai 4 th largest metro in India Population Million 6 th largest by population Population Density 555 Sq. Km 6 th most populous in India GSDP in (Const Prices) INR 515,458 Crore 2 nd largest economy of India Per Capita Income ( ) (Const Prices) INR 66,635 In , it was 6th highest state in India and above India s average of Rs 39,904 in Urbanization 48.45% Ranked 1st among the states in India Human Development Index 0.57 Ranked 6th in India Literacy rate 80.33% Above the National average of % Poverty 11.28% Below the National Average of 21.92% Source: MOSPI, Govt of India Demographic Profile The population of Tamil Nadu has increased from 62.4 million in 2001 to 72.1 million in 2011, a CAGR of 16% in the decade. Chennai district tops the population chart with 4.68 million, followed by Kancheepuram and Vellore. 12 Tamil Nadu State Report, 2015
13 Figure 1: District-wise population of Tamil Nadu in 2011 Perambalur The Nilgirirs Ariyalur Karur Theni Tiruvarur Ramanathapuram Sivagangai Dharmapuri Nagapattinam Pudukottai Namakkal Thootukudi Kanyakumari Krishnagiri Virudunagar Dindugal Erode Thanjavur Tiruvannamalai Tirupur Cuddalore Trichy Madurai Tirunelveli Villupuram Coimbatore Salem Thiruvallur Vellore Kancheepuram Chennai Districts 564, , ,481 Source: Census Population, 2011, YES Bank Analysis Institutional Setup in Tamil Nadu Tamil Nadu has 39 Lok Sabha seats at the Parliament and 234 Legislative assembly constituencies. The Government of Tamil Nadu operates through 37 departments and 82 governmental agencies i.e. public service organizations, statutory corporations and co-operative societies. The institutional profile of the State is shown in the below table. Table 2: Institutional Profile of Tamil Nadu Source: Tamil Nadu State Profile, YES Bank Analysis 1,076,588 1,243,684 1,268,094 1,337,560 1,341,250 1,502,900 1,614,069 1,618,725 1,721,179 1,738,376 1,863,174 1,883,731 1,943,309 2,161,367 2,259,608 2,402,781 2,468,965 2,471,222 2,600,880 2,713,858 3,041,038 3,072,880 3,463,284 3,472,578 3,480,008 3,725,697 3,928,106 3,0,897 Districts 32 Revenue Divisions 79 Taluks 254 Firkas 1,177 Revenue Villages 16,710 Municipal Corporations 12 Municipalities 124 Panchayat Unions (Blocks) 385 Town Panchayats 528 Village Panchayats 12,524 Lok Sabha Constituencies 39 Assembly Constituencies 234 Population 4,681, ,000 1,000,000 1,500,000 2,000,000 2,500,000 3,000,000 3,500,000 4,000,000 4,500,000 5,000,000 Urban Local Bodies: Tamil Nadu has 12 Corporations, 124 Municipalities and 528 Town Panchayats Rural Local Bodies: Tamil Nadu has about 12,524 Village Panchayats and 385 Panchayat Unions. Tamil Nadu State Report,
14
15 Economy of Tamil Nadu 02
16 Economy of Tamil Nadu Gross State Domestic Product (GSDP) Analysis Tamil Nadu was the second largest State Economy in India with a GSDP of Rs 5,15,458 Crore ( constant prices) in , grown by over 7.2% over from INR 4,80,618 Crore. (Refer Figure 2) Tamil Nadu has contributed an average of about 8.37% to India s economy with a compounded annual growth rate (CAGR) of 8.94% for the period to As of Agriculture & Allied Sector contributed about 7.1%, Industrial sector 28.0% and Services sector 64.8%, compared to 11.1%, 31.6% and 57.2% respectively in The services sector has been forming the major sector contribution in the state throughout the year from to as shown in Figure 3. Figure 2: Trends in GSDP of Tamil Nadu (Unit: INR Crore) Growth Rate 16.00% 14.00% 12.00% 10.00% 8.00% 6.00% 4.00% 2.00% 0.00% 219, , % 15.21% 287, , , % 5.45% 13.12% 356, , , , % 7.39% 3.39% 480, % 515, , , , , % 200, ,000 - At constant prices of ( ) Rs crores GSDP in INR Crores Growth over previous period Source: Ministry of Statistics and Program Implementation (MOSPI), Govt. of India; YES BANK Analysis 16 Tamil Nadu State Report, 2015
17 Figure 3: Trends in Contribution of Various Sectors to TN GSDP % 28.04% 64.84% % 29.02% 63.70% % 30.19% 62.53% % 30.57% 60.96% % 31.54% 60.19% % 30.94% 60.36% % 28.35% 62.58% % 30.53% 59.68% % 31.20% 57.94% % 31.68% 57.26% % 31.65% 57.23% 0% 10% 20% 30% 40% 50% 60% 70% 80% 90% 100% Primary Sector Industrial Sector Services Sector Source: Ministry of Statistics and Program Implementation (MOSPI), Govt. of India; YES BANK Analysis Figure 4: Trends in Growth Rates of Various Sectors of TN GSDP 25.00% 20.00% 15.00% 10.00% 5.00% 0.00% -5.00% % % 20.93% 16.57% 14.02% 12.80% 15.32% 14.08% 13.44% 10.56% 9.33% 13.26% 13.24% 8.77% 6.90% 6.05% 9.95% 9.31% 9.16% 7.47% 3.86% 6.35% 4.09% 7.33% 2.12% 3.11% 3.64% 4.94% -2.06% % -2.29% % Primary Secondary Tertiary Source: Ministry of Statistics and Program Implementation (MOSPI), Govt. of India; YES BANK Analysis The regional distribution of GSDP (based on 2011 prices) depicts that the capital city Chennai, has the major share of state GSDP at over 18%. The top 6 districts contributing about 51% to Tamil Nadu s GSDP are Chennai (18.39%), Kancheepuram (9.3%), Thiruvallur (8.00%), Coimbatore (7.10%), Tiruppur (4.37%) and Tiruchirappalli (4.29%) as shown in Figure 5. Of the 32 districts, contribution of 14 districts is below 2%, indicating the concentration of major economic activity in only a few districts of the state Imbalanced growth triggers rural population to migrate to growing urban centers for livelihood opportunities. Tamil Nadu State Report,
18 Figure 5: District-wise Distribution of GSDP for Tamil Nadu Perambalur Ariyalur Sivaganga Ramanathapuram Dharmapuri Nilgris Theni Karur Krishagiri Thiruvarur Pudukkottai Thoothukudi Virudhunagar Nagapattinam Dindigul Tiruvannnamalai Viluppuram Namakkal Cuddalore Kanniyakumari Tirunelveli Erode Thanjavur Madurai Salem Vellore Tiruchirappalli Tiruppur Coimbatore Thiruvallur Kancheepuram Chennai 0.43% 0.56% 0.96% 0.98% 1.01% 1.03% 1.04% 1.19% 1.33% 1.33% 1.45% 1.53% 1.56% 1.64% 1.79% 1.92% 2.02% 2.07% 2.18% 2.28% 2.68% 2.84% 2.87% 3.67% 3.90% 4.29% 4.29% 4.37% 7.10% 8.00% 9.30% 18.39% 0.00% 2.00% 4.00% 6.00% 8.00% 10.00% 12.00% 14.00% 16.00% 18.00% 20.00% Source: NSDC Report on Tamil Nadu; Indicus Analytics Market Skyline of India (2011); YES BANK Analysis; the above figures are estimates Fundamental Analysis of GSDP of Tamil Nadu Primary Sector The main constituents of the primary sector include agriculture, forestry & logging and fishing. Agriculture contributes about 92% of the primary sector. TN is principally dependent on torrential rainfall for irrigation purposes. 9 9 Tamil Nadu is one of the key fishing coastlines in the Bay of Bengal and contributes about 10-12% of India s marine fish production 1 i.e. about 1-2% of TN s GSDP Tamil Nadu State Report, 2015
19 Figure 6: Trends in Primary Sector output of Tamil Nadu (Units: INR Crore) 40, % 11.06% 10.87% 12.00% 35,000 30, % 9.07% 8.70% 8.27% 8.46% 10.00% 25, % 7.28% 7.12% 8.00% 20,000 15,000 10,000 24,362 27,592 31,244 29,867 29,183 31,036 33,353 36,672 32,600 34,988 36, % 4.00% 5, % % Primary Sector Growth Rate Source: Ministry of Statistics and Program Implementation (MOSPI), Govt. of India; YES BANK Analysis Secondary Sector The principal constituents of the secondary (industrial) sector include manufacturing, construction, electricity, gas & water supply and mining & quarrying. Manufacturing constitutes about 60-65% of the Secondary sector. The manufacturing sector in Tamil Nadu consists principally of automotives, engineering products, cement and textiles. Manufacturing GSDP in Tamil Nadu has increased more than twice in the past 10 years from INR 43,433 crore in to INR 94,073 crore in , a CAGR of 8.04%. Figure 7: Trends in Industrial Sector output of Tamil Nadu 100% 90% 80% 7% 6% 5% 4% 1% 1% 1% 1% 3% 3% 3% 28% 29% 27% 30% 33% 28% 30% 32% 30% 30% 30% 70% 60% 50% 25% 23% 22% 22% 23% 20% 19% 19% 19% 19% 19% 40% 30% 20% 10% 38% 41% 44% 42% 42% 49% 48% 47% 46% 47% 46% 0% 2% 2% 2% 2% 2% 2% 1% 2% 2% 2% 2% Mining & Quarrying Manufacturing - Registered Manufacturing - Unregistered Construction Electricity, Gas and Water supply Source: Ministry of Statistics and Program Implementation (MOSPI), Planning Commission, Govt. of India; YES BANK Analysis Tamil Nadu State Report,
20 Tertiary Sector The principal constituents of the Services Sector include railways, storage, communication, trade, hotels and restaurants, banking & insurance, real estate, ownership & dwellings, business services, public administration and other services. This sector has a strong CAGR of 10.31% from INR 1,25,329 Crore to INR 3,34,200 Crore in the period to Tamil Nadu has 54 Notified SEZs 2 in the state. 3rd highest in India. Karnataka (59) & Maharashtra (61). Figure 8: Trends in Industrial Sector output of Tamil Nadu % % % 1.0% 1.3% 1.4% 1.4% 1.3% 1.2% 1.4% 1.5% 8.7% 9.1% 9.2% 9.5% 9.3% 9.6% 9.5% 9.8% 10.0% 10.5% 10.8% 6.5% 6.7% 6.8% 6.8% 6.9% 6.2% 5.3% 4.4% 4.3% 4.1% 3.9% 25.6% 26.0% 26.5% 27.3% 27.6% 27.5% 28.1% 30.0% 31.4% 30.4% 29.8% 15.2% 15.4% 14.9% 14.1% 13.9% 13.7% 14.2% 14.3% 13.3% 13.0% 12.7% 24.8% 23.2% 22.1% 20.7% 19.8% 20.3% 20.3% 19.8% 18.5% 18.5% 18.3% 4.7% 4.9% 5.1% 5.7% 6.1% 6.3% 6.7% 6.0% 6.5% 6.7% 7.4% 13.6% 13.8% 14.4% 14.9% 15.1% 14.9% 14.4% 14.4% 14.7% 15.3% 15.6% 0% 10% 20% 30% 40% 50% 60% 70% 80% 90% 100% Railways Storage Trade, Hotels and restaurants Real estate, Ownership of dwellings and Business services Other services Transport by other means Communication Banking & Insurance Public Administration Source: Ministry of Statistics and Program Implementation (MOSPI), Planning Commission, Govt. of India; YES BANK Analysis Fiscal Indicators Tamil Nadu has been successful in maintaining fiscal dynamics. Since TN has seen revenue surplus meeting the Fiscal Responsibility and Budget Management Act (FRBMA) targets. Tamil Nadu was one of the first states to enact this legislation even before the recommendation of the Finance Commission. Since TN revenue account has shown a surplus except in FY10 and FY11 mainly because of the world wide economic down turn. However, even in these two years the revenue deficit was less than 1% of the state s GSDP. The table below depicts TN s state finance from to Tamil Nadu State Report, 2015
21 Table 3: Fiscal Indicators of Tamil Nadu Fiscal Indicators (Rs crores) Own Tax Revenue Own Non- Tax Revenue State s Own Revenue Total Central Transfers Share in Taxes and Duties * * 19,357 23,326 27,771 29,619 33,684 36,547 47,782 59,517 71,254 73,718 85,773 96,083 2,208 2,601 3,423 3,304 5,712 5,027 4,651 5,684 6,554 9,343 8,867 9,071 21,565 25,927 31,194 32,923 39,396 41,574 52,433 65,201 77,808 83,061 94, ,154 6,886 8,033 9,720 14,597 15,646 14,270 17,754 20,001 21,019 24,975 38,548 37,527 4,236 5,013 6,394 8,065 8,511 8,756 10,914 12,715 14,520 15,853 16,824 21,150 Grants 2,650 3,020 3,326 6,532 7,135 5,514 6,840 7,286 6,4 9,122 21,724 16,377 Total Revenue Receipts Total Revenue Expenditure Revenue Surplus/ Deficit Fiscal Surplus/ Deficit Capital Outlay 28,452 33,960 40,913 47,521 55,042 55,844 70,188 85,202 98, , , ,681 29,155 32,009 38,265 42,975 53,590 59,375 72,916 83,838 97, , , ,297 (703) 1,951 2,648 4,546 1,452 (3,531) (2,728) 1,364 1,761 (1,789) (3,537) (4,616) (5,570) (2,251) (3,956) (3,686) (8,548) (11,807) (16,647) (17,274) (16,519) (21,643) (27,345) (31,829) 4,564 4,055 5,952 7,462 9,104 8,573 12,436 16,336 14,568 17,173 20,341 24,313 Outstanding 49,819 57,457 60,170 64,655 74,858 88, , , , , , ,882 Liabilities GSDP (current prices) Revenue Surplus/ (Deficit) as a % of GSDP Fiscal Surplus/ (Deficit) as a % of GSDP 219, , , , , , , , , , ,703 NA -0.32% 0.76% 0.85% 1.30% 0.36% -0.74% -0.47% 0.20% 0.24% -0.21% -0.36% NA -2.54% -0.87% -1.27% -1.05% -2.13% -2.46% -2.85% -2.59% -2.22% -2.53% -2.80% NA Source: State Budget Documents of TN and CSO Tamil Nadu State Report,
22 Figure 9: Revenue and Fiscal Deficit of Tamil Nadu as a Percentage of GSDP 2.00% 1.50% 1.00% 0.50% 0.00% -0.50% -1.00% -1.50% -2.00% -2.50% -3.00% -3.50% 1.30% 0.76% 0.85% 0.36% 0.20% 0.24% -0.32% -0.21% -0.47% -0.36% % * * -0.87% -1.05% -1.27% -2.13% -2.22% -2.54% -2.46% -2.59% -2.53% -2.85% -2.80% Revenue Surplus/ (Deficit) as a % of GSDP Fiscal Surplus/ (Deficit) as a % of GSDP Source: YES Bank Analysis Investment Flows 9 9 The total FDI from April 2000 to March 2015 in Tamil Nadu stands at INR 88,766 Crore in terms of Total Foreign Direct Investments (FDI). Third highest in India, after Maharashtra and New Delhi as shown in Figure 10, making it the most attractive investment destination in the state. Figure 10: Ranking of states in India based on Cumulative FDI inflows from April 2000 to March 2015 (Units: INR Crore) Maharashtra 353,022 New Delhi 249,023 Tamil Nadu Karnataka 88,766 82,121 Gujarat Andhra Pradesh 53,797 49,240 West Bengal 14,627-50, , , , , , , ,000 Source: Department of Industrial Policy and Promotion, Government of India; YES BANK Analysis 22 Tamil Nadu State Report, 2015
23 Infrastructure & Related Resources in Tamil Nadu 03 Tamil Nadu State Report,
24 Infrastructure & Related Resources in Tamil Nadu New Initiatives for Infrastructure Project With the recent budget announcement and new policy initiatives, it is evident that large scale infrastructure projects are proposed across sectors like highways, ports, airports & power among others. In order to identify the projects that will aid the economic development and make Tamil Nadu the most prosperous and progressive state in the country, the Vision Tamil Nadu 2023 document was launched in two phases Phase 1 in March 2012 and Phase 2 in February The document outlined the outcomes that are targeted to be achieved by 2023 and has envisaged an investment of Rs.15,00,000 crore to be made over the next 10 years. The summary of the proposed investment for each sector is outlined below: Table 4: Proposed Investment for each sector as per Vision 2023 Source: Vision 2023 Phase 2 Energy 389,335 Transport 368,123 Industrial and Commercial infrastructure 171,285 Urban Infrastructure 263,350 Agriculture 121,400 Human development (Health & Education) 59,140 Sub-Total 13,72,633 General and Social infrastructure projects 75,000 Capital improvements to existing projects 52,367 Sub-Total 127,367 Grand Total 15,00,000 In order to develop the infrastructure project in a seamless, efficient and transparent manner, the State Government has constituted the Tamil Nadu Infrastructure Development Board (TNIDB) in 2013 under the Chairmanship of Hon. Chief Minister. This board acts as an institutional framework 24 Tamil Nadu State Report, 2015
25 for conceptualization, prioritisation, sanction and speedy implementation of critical infrastructure projects. This applies to the projects which are either implemented by the public procurement or public private partnership (PPP). TNIDB approves such projects projects which exeeds Rs 500 Crore through public procurement and Rs 10 Crore through PPP. This applies to 21 sectors and shall includes agriculture infrastructure, education related infrastructure, fisheries, health infrastructure, inland waterways, ports, power, roads, bridges, tourism and urban infrastructure. The Government has also notified the Tamil Nadu Infrastructure Development Rules, 2012 Tamil Nadu Infrastructure Development Regulations 2013 and Tamil Nadu Transparency in Tenders (PPP Procurement) Rules, 2012 to facilitate project preparation, structuring, financing and efficient procurement. The Government has established the Tamil Nadu Infrastructure Development Fund (TNIDF) to financially support the design, development, working, administration and management of projects. The Government has also established the Project Preparation Fund (PPF) to conduct studies, hire experts / consultants, prepare feasibility studies, capacity building, undertake research and training, etc. Roadways The Total Road Length in Tamil Nadu as of 2013 is 238,004 Km 3. CAGR of about 6.07% for the period 2009 to 2013 is the second highest next to Mahararshtra in progressive states in India. TN Road density 4 (per 100 Sq Km of area) is 176. Kms as of Table 5: Comparison of road length, road density and growth rate of road length of various states in India State Geographical Area Road Length CAGR Road Density (Km / 100 sq.km) Tamil Nadu 1,30, , , , , , % 176. Andhra Pradesh* 2,75, , , , , , % Karnataka 1,91, , , , , , % Gujarat 1,96, , , , , , % Maharashtra 3,07,713 3, , , , , % Source: Ministry of Road Transport &Highways (MORTH) *Erstwhile AP Out of the total 2.38 lakhs road length in Tamil Nadu, the Highway Department maintains 62,017 km. Other district roads form the major share in the classification of the roads (by Highway Dept) contributing 34,160 km (55% of the total road length of Tamil Nadu) for the year Major District Roads, State Highways & National Highway contribute 18%, 19% & 8%respectively. Out of the total length of the National Highway, two lane and the four lane contributes 2637 km (53%) and 2246 km (46%) respectively Tamil Nadu State Report,
26 Figure 11: Classification of Road in Tamil Nadu for the year % 55% 19% 18% National Highways State Highways Major District Roads Other District Roads Source: Policy Note on Highways & Minor Ports, , Govt of TN The state Govt. has implemented the Comprehensive Road Infrastructure Development Program (CRIDP) based on the Comprehensive Road Improvement Policy The CRIDP covers major road development initiatives. For the year the Govt. of TN has allotted about INR 3,623 Crore for implementation of plan works and INR Crore for non-plan works. State Government plans to enhance 2000 km of roads into six or eight lane expressways corridors between Chennai and major towns. It also plans to modernize State Highways covering 5,000 km of four lane highways and conversion of other State Highways and other Highways of 16,000 km length to two lane roads. The Chennai Peripheral Ring Road is major project envisioned by the Government. Railways Figure 12: Break-up of National Highways in Tamil Nadu for the year % 1% 53% Single Lane Two Lane Four Lane Source: Ministry of Road Transport and Highways, Govt. of India; YES BANK Analysis The Southern Railway Network of the Indian Railways is headquartered in Chennai. The Total Rail track Length in Tamil Nadu as of March 2014 is 4848 Km 6. The Southern Railway Network is divided into Six Divisions each headquartered at Madurai, Salem, Chennai, Tiruchirappalli, Thiruvanathapuram and Palakkad respectively. There are a total of 730 stations 7. The state could also study the feasibility of a dedicated rail freight corridor to boost the Manufacturing, Mining & Construction sectors. The proposed Chennai Bengaluru industrial Tamil Nadu State Report, 2015
27 corridor offers a tremendous opportunity for a dedicated freight corridor on the lines of DFC project between Mumbai & New Delhi. Tamil Nadu tops the rail density (km of rail length / 1000 sq.km of area) among all the southern states. Table 6: Comparative Analysis of Rail Tracks among Southern States as on 2014 State Area(Sq. Km) Route Km Rail Density (Km/1000sq.km) Andhra Pradesh 275,045 5, Tamil Nadu 130,058 3, Karnataka 191,791 3, Kerala 38,363 1, Source: Indian Railways Statistics; YES BANK Analysis Port Tamil Nadu has 3 major ports namely Chennai, Ennore and Tutricorin, in addition to 24 minor ports of which 7 are government ports and 16 are captive ports 8. The present capacity of Chennai port is Million Tonnes (MT). Comparatively, New Mangalore Port is MT, Cochin is MT and Visakhapatnam is MT. Chennai is has a capacity utilization of 61.06%. The capacity utilization of Ennore port is highest in among the major ports in South India Figure 13: Trends in Traffic Handled at Major Ports in South India for the year to (Million Tonnes) 80 Vaizag Ennore Chennai Tuticorn Cochin New Mangalore Port Trust Source: Ministry of Shipping, Govt. of India; YES BANK Analysis 8 Tamil Nadu State Report,

28 Table 7: Major Port-wise capacity utilization during (million tonnes) Port Capacity Traffic Capacity Utilization (%) Chennai Vishakapatanam Tuticorin New Mangalore Ennore Cochin ALL PORTS Source: Ministry of Shipping, Govt. of India; YES BANK Analysis The container traffic is projected to grow from 39 million tonnes in 2012 to 188 million tonnes by the year 2023, while the coal traffic is projected to grow from 20 million tonnes in 2012 to 80 million tonnes by the year The overall traffic growth is projected to grow at the rate of 13% from the present cargo volumes of 100 million tonnes thereby nearly quadrupling by the end of Airports Tamil Nadu has a total of seven airports which also includes three international airports at Chennai, Coimbatore and Tiruchirapalli and the other domestic airports include Madurai, Vellore, Salem and Tutcorin. Chennai handles 4 th highest traffic in India, in terms of total passenger (both domestic & international) and 3 rd highest in total freight traffic (both domestic & international) Figure 14 & 15 shows the share of top 10 Indian airports in the year in terms of total passenger movement and total freight movement respectively 9. Figure 14: Share of Top 10 Indian Airports by Passenger Traffic in the year % 3% 3% 8% 11% 7% 10% 26% 29% Delhi Mumbai Chennai Bangalore Kolkata Hyderabad Ahemdabad Goa Pune Source: Airports Authority of India; YES BANK Analysis 9 pibmumbai.gov.in/scripts/detail.asp?releaseid=e20131s1 28 Tamil Nadu State Report, 2015

29 Figure 15: Share of Top 10 Indian Airports by freight movement (in tons) in the year % 13% 6% 4% 3% 0% 1% 30% 30% Airport Delhi Mumbai Chennai Bangalore Kolkata Hyderabad Ahemdabad Goa Source: Airports Authority of India; YES BANK Analysis However, in , Chennai ranked 3 rd among all Indian airports for the total passenger movement. Figure 16: Trends in Total Passenger Traffic (million)at Chennai Airport for the year to Traffic in millions Domestic International Total Source: Airports Authority of India; YES BANK Analysis Figure 17: Trends in Total Freight Movement at Chennai Airport for the year to Domestic International Total Source: Airports Authority of India; YES BANK Analysis The State Government proposes to improve the airport infrastructure making the proposed total investment of Rs 25,000 Crore. This include development of Greenfield airport at Sriperumbudur, expansion of Madurai and Coimbatore airport, development of airport facilities at Trichy and Thoothukudi and development of aerospace park at Vellore. Tamil Nadu State Report,
30 Urban Infrastructure Power Tamil Nadu has about 48.45% of total population living in urbanized areas. The state accounts for 9.6% of India s urban population. The urban bodies of Tamil Nadu has about 12 city municipal corporations, 124 municipalities and 528 town panchayats. The municipal corporations of Tamil Nadu include the cities such as Chennai, Vellore, Salem, Erode, Tirupur, Coimbatore, Tiruchirappalli, Thanjavur, Madurai, Dindigul, Tirunelveli and Thoothukudi. All 12 Corporations had been shortlisted for the Smart Cities scheme. Twenty-nine cities and towns with a population of over 1 lakh in Tamil Nadu, were likely to be included in the Atal Mission for Rejuvenation and Urban Transformation program towns have been covered under the Jawaharlal Nehru National Urban Renewal Mission (JNNURM) and it includes the town panchayats that fall within Chennai Metropolitan Development Authority (CMDA) and urban agglomeration area of Madurai and Coimbatore. As of August 2014, a total of 24 out of 65 sanctioned projects under UIG (Urban Infrastructure & Governance) of JNNURM were completed in the state. These projects were related to roads and flyovers, water supply and solid waste management 11,12. Similarly, as of March 2014, under the Urban Infrastructure Development Scheme for Small and Medium Towns (UIDSSMT) of JNNURM, 102 projects were completed out of 136 sanctioned projects allocated for 122 towns. These projects were for development of water supply, sewerage, storm drainage systems, solid waste management and road development in the state 13. Recently, World Bank has approved a $ 400-million loan for a sustainable urban development project (TNSUDP) to strengthen the financial and administrative capacity of urban local bodies (ULBs), benefitting over 20 lakh residents 14. Tamil Nadu Vision 2023 envisages an investment of Rs 2.63 lakhs Crore for urban infrastructure development. As per the vision document, it aims to provide 135 LPCD piped water supply across in all parts of Chennai Corporation and urban areas of the rest of the state. The total installed power capacity in Tamil Nadu is MW 15,16 as of June Coal and renewable energy form the bulk of the installed capacity with share of around 43% and 37% respectively Private sector owns the bulk of the generation assets at 45% of the total installed capacity Tamil Nadu State Report, 2015
 5% 4% 2% 8% 13% 68% Domestic Commercial Industries Agriculture")

31 Figure 18: Break up of installed power capacity in Tamil Nadu based on source of generation and the ownership 37% 43% 22% 33% 10% 4% 4% Power Coal Gas Diesel Nuclear Hydro MNRE 2% 45% State Private Central Source: Central Electricity Authority; YES BANK Analysis Figure 19: Category wise consumers of power as on March 2014 (in Lakh) 5% 4% 2% 8% 13% 68% Domestic Commercial Industries Agriculture Huts Others Source: Policy Note, , Energy Department, Government of Tamil Nadu Power deficit has been a major issue historically for Tamil Nadu, however the state has witnessed significant improvement in the current year by drastic reduction in power deficit from 1,030 MW in to 209 MW in Figure 20: Trends in Demand-Supply of Peak (MW) in Tamil Nadu for the year to Power in MW 16,000 14,000 12,000 10,000 8,000 6,000 4,000 2,000-2, , Demand 10,334 9,7 11,125 11,728 12,813 12,736 13,522 13,707 Supply 8,690 9,211 9,813 10,436 10,566 11,053 12,492 13,498 Deficit -1, ,312-1,292-2,247-1,683-1, Source: Central Electricity Authority; YES BANK Analysis Tamil Nadu State Report,
32 Table 8: Peak Power demand & supply trend - South India and UT to State Andhra Pradesh Source: Central Electricity Authority; YES BANK Analysis Table 9: Comparative Analysis of Trends Aggregate Technical and Commercial (AT&C) Losses - Southern India (%) Source: CRISIL Research; YES BANK Analysis Demand Supply Surplus (Deficit) Demand Supply Surplus (Deficit) Demand Supply Surplus (Deficit) Demand Supply Surplus (Deficit) 14,054 11,972-2,082 14,582 11,630-2,952 14,072 13, ,028 13,539-1,489 Karnataka 10,545 8,549-1,6 10,124 8,761-1,363 9,940 9, ,001 9, Kerala 3,516 3, ,578 3, ,671 3, ,760 3, Tamil Nadu 12,813 10,566-2,247 12,736 11,053-1,683 13,522 12,492-1,030 13,707 13, State Andhra Pradesh Karnataka Kerala Tamil Nadu As per the Tamil Nadu Vision 2023, it is proposed to invest Rs 3,90,000 Crore in the energy sector and the major share of the investments amounting to Rs 2,15,000 Crore shall be utilized to augment the power generation capacity. In October 2012 Tamil Nadu Solar Energy Policy was announced to develop Tamil Nadu as a world leader in the Solar Energy. The policy envisages establishing 3000 MW solar plants within the State and shall be achieved through Utility Scale Projects, Rooftops, and under REC mechanism. TANTRANSCO has proposed Green Energy Corridors for the evacuation of wind power with an outlay of Rs.1,593 Crore, with financial assistance from KfW, the German Funding Agency. Telecommunications India has a total subscriber base of million, with wireless subscriber base forming the major share of million and wireline subscriber base of million, as on January Tamil Nadu (including Chennai Circle) has a total subscription of million, forming 8% of the total share in all Indian Circles. The State has a Wireless Subscriber base of Million (second highest share of 8%, next to UP (E) circle) and Wireline subscriber base of 2.73 Million (next to Delhi and Mumbai Circle) Telecom%20Subscription%20Data%20 as%20on%2031st%20january,% pdf 32 Tamil Nadu State Report, 2015
33 Tele-Density (no of connections per 100 people) in Tamil Nadu is second highest in India, next to New Delhi and highest among Southern states, while the overall tele-density in India is Figure 21: Comparative Analysis of Tele-density in South India Teledensity Andhra Pradesh Karnataka Kerala Tamil Nadu Tele-density (no. of connections per 100 people) Source: TRAI Press Release No. 28/2015, dated 10 th July 2015 Human Resources As per 2011 census, Tamil Nadu ranks 14th with the overall literacy rate of 80.33%% having improved from 73.45% in The male & female literacy rates were 86.81% and 73.86% respectively Figure 22: Comparative Analysis of Literacy rate in Tamil Nadu Females Males Persons 73.86% 64.43% 86.81% 82.42% 80.33% 73.45% 0.00% 10.00% 20.00% 30.00% 40.00% 50.00% 60.00% 70.00% 80.00% 90.00% % Literacy Rate Source: Census.gov.in; YES BANK Analysis According to the National Skill Development Corporation the incremental Human Resource requirement for the period for Tamil Nadu was about 5.1 Million vis-à-vis availability of about 3.5 Million, indicating a skill gap of around 1.6 Million. Further a steep skill gap exists in the semi skilled and skilled category. Tamil Nadu State Report,
34 Figure 23: Incremental HR Availability for the period for Tamil Nadu (Units: Million Persons) Skilled Incremental Human Resource Availability 1065 Semi-skilled 258 Unskilled Source: National Skills Development Corporation; YES BANK Analysis 34 Tamil Nadu State Report, 2015
35 Sector Snapshot in Tamil Nadu 04 Tamil Nadu State Report,
36 Sector Snapshot in Tamil Nadu Agriculture Tamil Nadu contributes about 7% of the total sugar production in the country. Agricultural production in (FE) was impacted due to lower monsoons & Cyclone. Table 10: Data on Cultivation Area And Production in Tamil Nadu Crop Cultivation Area(L.ha) Production(L.MT) * * Rice Millets Pulses Total Food Grains Oilseeds Cottons (L.Bales) Sugarcane (Cane) Total Source: Agriculture Policy Note & Performance Budget for , & * Fourth Advance Estimate During , an amount of Rs.100 Crore will be set apart for further promoting farm mechanization. Tamil Nadu Cotton Cultivation Mission will be launched in the State with an initial outlay of Rs. 50 Crore, to focus on higher productivity and production Tamil Nadu State Report, 2015
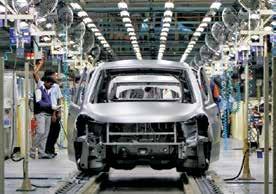
37 Industrialization in Tamil Nadu Tamil Nadu has created a forte in the field of fields of engineering, automobiles, textiles, leather, information technology, electronic hardware and hi-technology industries. Tamil Nadu has always been a preferred destination for the investors due to a favorable business climate, excellent infrastructure for trade and investment, better law and order maintenance, industrial relations and healthy socio-economic reforms. The State is now ranked first in the number of factories and in the number of workers employed in the factories sector. It is third in gross industrial output. The industrial GSDP of Tamil Nadu grew at a CAGR of 7.63% from the year to ( constant prices). In the period to , the number of factories has increased by 49%, while the capital infusion has grown at the compounded annual growth rate (CAGR) of 17.63% and the value of output has grown at CAGR of 19.80%. Coimbatore has the maximum number of industries registering about 4500 industries followed by Thiruvallur, while Kanchipuram tops the chart in terms of capital infusion investing about Rs 10,000 Crore Figure 24: Trends of Industrialization in Tamil Nadu to ,000,000 60,000,000 50,000,000 40,000,000 30,000,000 20,000,000 10,000,000-30,080,195 37,578,406 13,289,5 14,796,543 16,145,171 18,724,233 9,778,762 1,774,019 1,890,149 1,943,319 1,940,819 1,965,020 26,122 26,790 36,848 36,6 38, Automobile & Auto Components Industry 47,231,872 60,693,540 61,952,533 No. of factories (nos) No.of employees (nos) Fixed Capital (Rs lakhs) Value of output (Rs lakhs) Source: Results of Annual Survey of Industries, Central Statistical Organization; YES BANK Analysis Tamil Nadu has more than 100 companies in the automotive and auto ancillary industry located within the state. Chennai is one of the major auto hubs in India for production of LCVs and HCVs while Coimbatore and Erode is known for automotive body and frame building. The State can boast of attracting seven automobile giants including Ford, Hyundai, Mitsubishi, Daimler, Renault and BMW. It has installed capacity to produce Lakh cars and 3.50 Lakh commercial vehicles per year Tamil Nadu Automobile and Auto Components Policy 2014 Tamil Nadu State Report,
38 Tamil Nadu has the largest auto components industry base and accounts for majority share contributing 35% of India s auto components production. The commissioning of three new large tyre manufacturing projects in addition to the existing tyre manufacturing facility has made the State particularly Chennai one of the largest hubs in the world for tyre manufacturing. The auto industry is encouraged by excellent port logistics, abundant availability of skilled manpower, reliable auto infrastructure, excellent government base and cost effective manufacturing base. The Ultra Mega Auto Policy, launched in 2007 encouraged ultra mega auto projects. To further strengthen its position in the Auto & Auto Components industry, on 21 st Feb 2014, the TN Government unveiled, Tamil Nadu Automobile and Auto Components Policy, It aims to generate 5 Lakh jobs and make Chennai one of the World s top 5 auto clusters. The Chennai Peripheral Road connect Mamallapuram with Ennore Port neighbouring Tiruvallur via Singaperumalkoil, Sriperumbudur, Tiruvallur, Thamaraipakkam, Periyapalayam and Puduvayal till Kattupalli is expected to further encourage the growth of this industry in the state. Chennai Port is also proposing to develop Ro-Ro cum Multipurpose Berth and Multi-Level Car Parking at the port which is expected to boost and improve the car exports Automobile manufacturers such as Hyundai, Ashok Leyland, Nissan, and Ford are also likely to be benefitted with this augmented port infrastructure. The State is also proposing the industrial corridor projects which shall be implemented by State Industries Promotion Corporation of Tamil Nadu (SIPCOT) thereby further benefitting the automobile and ancillary units. The key industrial corridor projects are Madurai- Thoothukudi Industrial Corridor and Chennai-Ranipet Industrial Corridor. Biotechnology Industry India is among the top 12 biotechnology destinations in the world and the Indian biotechnology sector is the second largest in Asia (after China). Tamil Nadu is one of the first states to have launched a bio-technology policy to boost growth in this sector. Tamil Nadu has established its first biotechnology (BT) incubation park, the TIDCO Centre for Life Sciences (TICEL) Biotechnology Park I in Chennai with technical collaboration from Cornell University, USA which became operational in November, 2004 and TICEL II is set for completion soon. To reinforce its position in the BT sector & encourage new investments, the state has launched Tamil Nadu Biotechnology Policy 2014 in Feb The broad objectives of the new Biotech Policy are: o To take up the detailed inventory of the bio-resources in the State 38 Tamil Nadu State Report, 2015
39 o To attract R&D institutions and manufacturing firms to Tamil Nadu by developing high quality infrastructure with the required support services, providing special incentives to the biotech industry. The Vision 2023 document has planned the development of eleven important and special signature projects for the development of world class institutions of research and knowledge in the Biotechnology sector. Electronics & IT Industry The Government of Tamil Nadu through Tamil Nadu Industrial Development Corporation (TIDCO) and State Industries Promotion Corporation (SIPCOT) has promoted numerous SEZs and Information Technology Parks in Tamil Nadu. The Software and Electronics industry is one of the largest contributors to exports in Tamil Nadu. According to Software Technology Parks of India, in FY12 the software exports from Tamil Nadu were about INR 75,000 Crore 20 and Electronic Hardware exports were about INR 312 Crore. The IT sector in Tamil Nadu is estimated to provide employment to around 4 to 5 Lakh personnel. Figure 25: IT Exports from Tamil Nadu (Units: INR Crore) 80,000 75,000 70,000 60,000 50,000 40,000 30,000 28,426 36,680 36,766 42,211 46,791 60,000 20,000 10, Source: Software Technology Parks of India; YES BANK Analysis As per the policy note for for the IT Department, the State Government has introduced the following new schemes as below: Establishing a new Tamil Software Incubation Centre, to promote research, experiment & develop new Tamil softwares. Setting up of Mobile Service Delivery Platform (MSDP), which will function as the official SMS gateway for all government to citizen communications Tamil Nadu State Report,
40 Setting up of Project Information Management System (PMIS), which will facilitate State level planning and reporting to the State and Centre. The TN Vision 2023 (phase 2) proposes to develop Information Technology Investment Region (ITIR) in Chengalpattu, Thirukkalukundram, Kanchipuram and Sriperumbudur Talukas of Kanchipuram District. This project is proposed to be implemented by TIDCO and shall focus on investments in IT/ITES and electronics hardware manufacturing (EHM), which is expected to generate 10 Lakh employment in two phases. Textile Industry Coimbatore and Tirupur are the major textile centres in Tamil Nadu. Tirupur is known as knitting city. Tamil Nadu is one of the top producers of Spun Yarn in the country accounting for about 35-40% of the overall production 21 in India. Of the total 2049 large and medium textile mills 22 in India, 893 mills are in Tamil Nadu - 18 Cooperative Spinning Mills, 17 National Textile Corporation Mills and 23 Composite Mills. The spinning capacity in Tamil Nadu is around million spindles with a labor force of about 2.17 Lakh. Cement Industry According to Cement Manufacturers Association, Tamil Nadu is the 3rd largest producer of Cement in India 23. The total Installed Capacity of Cement Plants as of in Tamil Nadu is about Million Tonnes (MT) or 12% of the all India capacity with a production of about MT or 12% of the total cement production in India. Figure 26: Cement Capacity and Production in Tamil Nadu (Units: Million Tonnes) Million Tonnes Capacity Production Source: Cement Manufacturers Association; YES BANK Analysis * Industry Profile in Tamil Nadu Tamil Nadu State Report, 2015

41 Annexure 05 Tamil Nadu State Report,

42 Annexure 1: District Map of Tamil Nadu Source: MapsofIndia.com 42 Tamil Nadu State Report, 2015

43 Annexure 2: Road Network Map of Tamil Nadu Source: MapsofIndia.com Tamil Nadu State Report,

44 Annexure 3: Rail Network Map of Tamil Nadu Source: MapsofIndia.com 44 Tamil Nadu State Report, 2015

45 Annexure 4: Industrial Map of Tamil Nadu Source: MapsofIndia.com Tamil Nadu State Report,
SOCIO ECONOMIC SNAPSHOT
 SOCIO ECONOMIC SNAPSHOT TITLE Socio Economic Snapshot YEAR February, 2016 AUTHORS COPYRIGHT Strategic Government Advisory (SGA), YES BANK No part of this publication may be reproduced in any form by photo,
TAMIL NADU GLOBAL INVESTORS MEET 2015 I N V E S T O R S P A R A D I S E
 TAMIL NADU GLOBAL INVESTORS MEET 2015 I N V E S T O R S P A R A D I S E TAMIL NADU - INDIA S ECONOMIC POWERHOUSE 15% India s major port capacity #2 Foreign tourist arrivals in India 42000 acres Additional
Tamil Nadu's New Paradigm in Industrial Infrastructure: Industrial Corridors, Parks and Investment Regions
 Tamil Nadu's New Paradigm in Industrial Infrastructure: Industrial s, Parks and Investment Regions 1 Event Background Tamil Nadu is one of India's most industrialized and urbanized economies. It is among
INDIA CALLING 2009 RAHUL ASTHANA MUMBAI PORT TRUST, CHAIRMAN, BRUSSELS, 1st OCTOBER 2009 PORT LOGISTICS AND INFRASTRUCTURE DEVELOPMENT IN INDIA
 INDIA CALLING 2009 PORT LOGISTICS AND INFRASTRUCTURE DEVELOPMENT IN INDIA By RAHUL ASTHANA CHAIRMAN, MUMBAI PORT TRUST, BRUSSELS, 1st OCTOBER 2009 India Giant Strides Sustained high GDP growth 9% in 2007-08.
TOURISM AND THE ECONOMY. ABSTRACT This article deals with the pattern of tourism seen in the state of Tamil Nadu and its implications on the economy
 TOURISM AND THE ECONOMY CASE STUDY: TAMIL NADU S. SAUMYA B.A. Social Sciences, Tata Institute of Social Sciences, Hyderabad ABSTRACT This article deals with the pattern of tourism seen in the state of
PPP Days 2010 PPPs Lessons from the Last 18 Months
 PPP Days 2010 PPPs Lessons from the Last 18 Months Rajiv B Lall March 22, 2010 1 Private Sector Participation (PSP) in India Works & Services Contracts Management Contracts Operation Concessions Build
Outline. (1) JICA and India. (2) Infrastructure Development. (3) Cross-Border Connectivity
 JICA and India. (2) Infrastructure Development. (3) Cross-Border Connectivity") 1 Outline (1) JICA and India (2) Infrastructure Development (3) Cross-Border Connectivity 2 Outline (1) JICA and India (2) Infrastructure Development (3) Cross-Border Connectivity 3 About JICA JICA is
1 Outline (1) JICA and India (2) Infrastructure Development (3) Cross-Border Connectivity 2 Outline (1) JICA and India (2) Infrastructure Development (3) Cross-Border Connectivity 3 About JICA JICA is
Railways in India 2012
 NOW AVAILABLE Report on Railways in India 2012 RAILWAYS IN INDIA 2012 Table of Contents SECTION I: MACRO ANALYSIS 1. Executive Summary.................................... 2. Sector Overview.......................................
Now Available. Urban Rail Transport. in India Urban Bus Transport. in India India Infrastructure Research.
 Now Available Two New Research Reports on Urban Rail Transport in India 2011 & Urban Bus Transport in India 2011 India Infrastructure Research www.indiainfrastructure.com Table of Contents URBAN RAIL TRANSPORT
Airports NOVEMBER For updated information, please visit
 Airports NOVEMBER 1 Contents Advantage India Market overview and trends Growth drivers Success stories: Delhi, Mumbai Opportunities Useful information 2 Airports NOVEMBER Advantage India 2000 No of operational
PHD Aviation Summit: Indian Civil Aviation Benefit Beyond Borders. February 18 th, Presented To:
 KNOWLEDGE PARTNER PHD Aviation Summit: Indian Civil Aviation Benefit Beyond Borders February 18 th, 2016 Presented To: Shri Ashok Gajapathi Raju Pusapati Hon ble Minister of Civil Aviation Indian aviation
PRESENTATION ON INDIA JAPAN BILATERAL RELATION
 PRESENTATION ON INDIA JAPAN BILATERAL RELATION 1 India and Japan Strategic and Global Partnership - Background The investment partnership between India and Japan is an essential pillar for the future architecture
PORTS. November 2010
 PORTS November 2010 PORTS November 2010 Contents Advantage India Market overview Industry infrastructure Investments Policy and regulatory framework Opportunities Industry associations 2 ADVANTAGE INDIA
AIRPORTS. November 2010
 AIRPORTS November 2010 AIRPORTS November 2010 Contents Advantage India Market overview Investments Policy and regulatory framework Opportunities Industry associations 2 ADVANTAGE INDIA Advantage India
AIRPORT MODERNISATION IN INDIA By K Roy Paul Secretary, Ministry of Civil Aviation, India and Chairman, Air-India Limited
 - 1 - AIRPORT MODERNISATION IN INDIA By K Roy Paul Secretary, Ministry of Civil Aviation, India and Chairman, Air-India Limited With phenomenal growth in air traffic, the importance of air transport in
Pradhan Mantri Awas Yojana (PMAY-U)
") Pradhan Mantri Awas Yojana (PMAY-U) Proposal for 92 projects under Vertical III & IV Presented to 35 th CSMC meeting on 25.06.2018 Government of Tamil Nadu SLNA Tamil Nadu Slum Clearance Board PROFILE
Pradhan Mantri Awas Yojana (PMAY-U) Proposal for 92 projects under Vertical III & IV Presented to 35 th CSMC meeting on 25.06.2018 Government of Tamil Nadu SLNA Tamil Nadu Slum Clearance Board PROFILE
Session with Hon ble Members of Parliament from Kerala. 4 August 2014, New Delhi. Confederation of Indian Industry
 Session with Hon ble Members of Parliament from Kerala 4 August 2014, New Delhi The growth vision 6,00,000 Crores by 2020 at a CAGR of 9.4 % This should come from growth rates of: Sector Growth rate in
Madurai 15 Theni 5 Virudhunagar 11 Ramanathapuram 8 Thoothukudi 11 Total 50 7 kwp Salem 19 Sivaganga 6 Total 25
 List of Empanelled Installers for 7 kwp/ 10 kwp Sl. Empanelled Installer 1 M/s. Parshanya Power Solutions 141A, 1st Floor, Visakan Complex TPK Road, Madurai - 625 001 2 M/s. Ind-Aussie Solar Pvt. 10/1,
Ports in India 2014 Dredging in India 2014
 Two New Reports Ports in India 2014 Dredging in India 2014 Sector Analyses and Market Opportunities These reports are published by, a sister division of Indian Infrastructure magazine. publishes reports
MINISTRY OF URBAN DEVELOPMENT DEMAND NO. 95 Ministry of Urban Development
 Notes on Demands for Grants, 2016-2017 449 A. The allocations, net of recoveries, are given below: MINISTRY OF URBAN DEVELOPMENT DEMAND NO. 95 Ministry of Urban Development Revenue 3438.47 2423.89 5862.36
From: OECD Tourism Trends and Policies Access the complete publication at: Chile
 From: OECD Tourism Trends and Policies 2014 Access the complete publication at: http://dx.doi.org/10.1787/tour-2014-en Chile Please cite this chapter as: OECD (2014), Chile, in OECD Tourism Trends and
Investment Opportunities DMIC UP Region
 Investment Opportunities DMIC UP Region PRESENTATION TO Japanese Business Mission BY Government of Uttar Pradesh (GoUP) Monday, February 04, 2008 1 The Region comprises of Greater Noida City & Taj Expressway
2. Industry and Business
 72 Statistical Yearbook of Abu Dhabi 2016 2. Industry and Business Business Enviroment Manufacturing Oil and Gas Petrochemicals Electricity and Water Construction Transport Information and Communication
The Next International Cruise Tourism Hub
 The Next International Cruise Tourism Hub Contents Market Scenario and Projections Demand & Supply Factors Current Scenario in India Vision & Formulation of Task Force Standard Operating Procedures Ministry
Japan India Cooperation on Railway Sector
 Japan India Cooperation on Railway Sector 14 th October, 2015 IREE 2015 Takema Sakamoto Chief Representative India Office Japan International Cooperation Agency (JICA) 1 Contents 1. Overview and Strategy
AMATA VN Public Company Limited
 AMATA VN Public Company Limited Welcome to Opportunity Day Financial Results for the period ended December 31, 2017 1 Disclaimer This document was prepared by Amata VN Public Company Limited in good faith
The Government s Aviation Strategy Transport for the North (TfN) response
 response") The Government s Aviation Strategy Transport for the North (TfN) response Transport for the North Background Good transport links are a crucial part of a strong economy supporting labour markets and delivering
The Government s Aviation Strategy Transport for the North (TfN) response Transport for the North Background Good transport links are a crucial part of a strong economy supporting labour markets and delivering
Why Namibia. Abundant Resources. Striking Opportunities. Competitive Economy. Top Quality Exports. Gateway to SADC
 Why Namibia Abundant Resources Striking Opportunities Competitive Economy Top Quality Exports Gateway to SADC Land of Contrast Sweeping Scenery Abundant Wildlife Hospitable People Modern Infrastructure
AIR TRAVEL AND ITS POTENTIAL FOR DEVELOPMENT OF THE SAARC REGION
 AIR TRAVEL AND ITS POTENTIAL FOR DEVELOPMENT OF THE SAARC REGION Amal S. Kumarage Professor of Civil Engineering, University of Moratuwa Chairman, National Transport Commission Sri Lanka Seminar, University
Safe, Timely & Comfortable Move for Better Future ~Japan-India Cooperation on Railway Sector ~
 Safe, Timely & Comfortable Move for Better Future ~Japan-India Cooperation on Railway Sector ~ IRC (Int l Rail Conference) 2017 @Pragati Maidan, Oct. 11 th, 2017 Takema SAKAMOTO Chief Representative Japan
Introducing. CODISSIA Trade Fair Complex, Coimbatore, India. 9 th 11 th April 2010, CODISSIA Trade Fair Complex, Coimbatore, India
 Introducing 9 th 11 th April 2010, CODISSIA Trade Fair Complex, Coimbatore, India Organisers Organised by: Orbitz Exhibitions Pvt Ltd: A leading Trade Fair Solution Company in India SIEMA: Founded with
Connectivity continues to remain one of the biggest concerns for north Chennai residents with thousands of commuters struggling every day
 Employment North Chennai is primarily an industrial area and is governed by business and trader community, locomotive workshops, government offices and port related activities. Chennai Port and Ennore
ARGENTINA: A Strategic Investment and Business Destination
 ARGENTINA: A Strategic Investment and Business Destination Undersecretariat for Investment Development and Trade Promotion Secretariat of International Economic Relations Ministry of Foreign Affairs and
Maharashtra Automotive Sector. Knowledge Partner
 Maharashtra Automotive Sector Knowledge Partner Maharashtra The enduring leader Macro Economic Pro le The State attracts the highest FDI Investment 70.108 Billion USD (April 00 October 14) GSDP contribution
Investment Opportunities in ZAMBIA
 Investment Opportunities in ZAMBIA ZAMBIA BULGARIA INVESTMENT FORUM SOFIA, BULGARIA Presentation Outline Location of Zambia Economy at a glance Priority Sectors and Investment Opportunities Why Invest
东莞市人民政府 The People s Government of Dongguan. Appendix 2 Charming Dongguan with Endless Business Opportunities
 Charming Dongguan with Endless Business Opportunities About Dongguan ---Geographic Location: Neighboring Hong Kong and Macau, Dongguan sits at the centre of Guangzhou- Shenzhen Golden Economic Corridor.
Economic Impact Analysis. Tourism on Tasmania s King Island
 Economic Impact Analysis Tourism on Tasmania s King Island i Economic Impact Analysis Tourism on Tasmania s King Island This project has been conducted by REMPLAN Project Team Matthew Nichol Principal
Number 1 Gross Regional Product per capita in Queensland
 Number 1 Gross Regional Product per capita in Queensland Whitsunday Region is the nation building region of Australia providing over $22 billion of economic value to the Australian economy. Our region
Infrastructure sector profile India scenario
 Infrastructure sector profile India scenario Overview USD 777.73 billion USD 37.97 billion India s investment requirement in infrastructure sector by 2022 FDI inflow into Construction Development and Construction
RAILWAYS. November 2010
 RAILWAYS November 2010 RAILWAYS November 2010 Contents Advantage India Market overview Industry infrastructure Investments Policy and regulatory framework Opportunities Industry associations 2 ADVANTAGE
Estimation of Tourism Employment through Tourism Satellite Account Indian Experience
 Estimation of Tourism Employment through Tourism Satellite Account Indian Experience Dr. R. N. Pandey Additional Director General Ministry of Tourism Govt. of India E-Mail: rajnath56.pandey@gmail.com Importance
WHYDUBAI. Your Partners in Success, Growth & Expansion
 WHYDUBAI Your Partners in Success, Growth & Expansion ABOUT DUBAI FDI Dubai Investment Development Agency (DUBAI FDI), is an agency of the Department of Economic Development (DED) Government of Dubai.
GMR Infrastructure Limited, Q1-FY 11 Performance Highlights. Financial Highlights for Q (Rs. Cr.)
") Press release Bangalore, 08 th Aug, 2010 GMR Infrastructure Limited, Q1-FY 11 Performance Highlights Financial Highlights for Q1 2010-11 (Rs. Cr.) Particulars 30th June 10 30th June 09 % change 31st March
Press release Bangalore, 08 th Aug, 2010 GMR Infrastructure Limited, Q1-FY 11 Performance Highlights Financial Highlights for Q1 2010-11 (Rs. Cr.) Particulars 30th June 10 30th June 09 % change 31st March
Indonesia. Market overview. Opportunities and challenges. Jakarta. Austrade in Indonesia
 INDONESIA Indonesia Market overview Indonesia is an emerging economic force. After India and China, Indonesia is the world s fastest growing consumer market. GDP reached US$1.2 trillion in 2012 and is
Nicco Parks & Resorts Ltd BSE Scrip Code:
 Nicco Parks & Resorts Ltd BSE Scrip Code: 526721 Other Leisure Facilities September 14, 2012 Equity Statistics Current Market Price Rs. 15.9 52 Week High / Low Rs. 24.4/15.2 Market Capitalisation Rs. crores
TAMIL NADU BLEND OF TRADITION AND TECHNOLOGY
 BLEND OF TRADITION AND TECHNOLOGY July 2017 Table of Content Executive Summary...3 Advantage Tamil Nadu......5 Vision 2030.....6 Tamil Nadu An Introduction..8 Annual Budget 2016-17... 19 Infrastructure
Sub. Rev Eng. Ad. Rev Hin. Ad. Rev Ver. Ad. Rev.
 June 2015 1 2 Print Industry Revenues (Rs bn) Media Spend as % of GDP 243 224 209 193 51 46 42 36 50 45 37 41 53 57 59 62 263 57 54 65 67 69 75 81 87 2010 2011 2012 2013 2014 Sub. Rev Eng. Ad. Rev Hin.
4 th largest state in terms of GDP size. Strong investment climate. Diversified industrial base
 4 th largest state in terms of GDP size Tamil Nadu is the fourth largest state of India, and contributed 8.1 per cent to India s GDP in 2013-14. Gross State Domestic Product (GSDP) of Tamil Nadu grew at
Copyright(C) 2014 JETRO, All rights reserved. 禁無断転載. Content. Who We Are Economic Situation Dynamic Economy Foreign Direct Investment in Egypt
 2014 JETRO, All rights reserved. 禁無断転載. Content. Who We Are Economic Situation Dynamic Economy Foreign Direct Investment in Egypt") Content Who We Are Economic Situation Dynamic Economy Foreign Direct Investment in Egypt Asian Investments in Egypt Japanese Investment in Egypt The Way Forward Mega Projects Suez Canal Project North Coast
Content Who We Are Economic Situation Dynamic Economy Foreign Direct Investment in Egypt Asian Investments in Egypt Japanese Investment in Egypt The Way Forward Mega Projects Suez Canal Project North Coast
An Overview of Airport Infrastructure in India. By V.P.Agrawal, Chairman, Airports Authority of India
 An Overview of Airport Infrastructure in India By V.P.Agrawal, Chairman, Airports Authority of India Global Economic Scenario Global economies now seeing recovery. Asia Pacific economies GDP levels to
Government of India Ministry of Road Transport & Highways Transport Research Wing New Delhi
 Government of India Ministry of Road Transport & Highways Transport Research Wing New Delhi October 2011 Review of the Performance of State Road Transport Undertakings (2010-11) CONTENTS Highlights i
Indiabulls Real Estate Limited (CIN : L45101DL2006PLC148314)
") Indiabulls Real Estate Limited (CIN : L45101DL2006PLC148314) Earnings Update Audited Financial Results FY 2013-14 April 23, 2014 Safe Harbor Statement This document contains certain forward looking statements
Indiabulls Real Estate Limited (CIN : L45101DL2006PLC148314) Earnings Update Audited Financial Results FY 2013-14 April 23, 2014 Safe Harbor Statement This document contains certain forward looking statements
TAMIL NADU BLEND OF TRADITION AND TECHNOLOGY
 MEENAKSHI TEMPLE IN MADURAI, BLEND OF TRADITION AND TECHNOLOGY March 2018 Table of Content Executive Summary...3 Advantage Tamil Nadu......5 Vision 2030.....6 Tamil Nadu An Introduction..8 Annual Budget
Percentage Share Total Workers Main Workers 29.5 Marginal Workers 2.22 Non-Workers Source: Census of India, 2001.
 4.0 LOCAL ECONOMY 4.1 WORKFORCE Working population of Udaipur comprises about 32% of total population (UMC) of city, of this 93% population constitutes main workers whereas rest 7% fall under marginal
THE 2006 ECONOMIC IMPACT OF TRAVEL & TOURISM IN INDIANA
 THE 2006 ECONOMIC IMPACT OF TRAVEL & TOURISM IN INDIANA A Comprehensive Analysis Prepared by: In Partnership with: PREPARED FOR: Carrie Lambert Marketing Director Indiana Office of Tourism Development
Agenda. 1. About Tamil Nadu. 2. Competitive advantages of Tamil Nadu. 3. Sectoral Opportunities in Tamil Nadu. 4. Government support to investors
 Agenda 1. About Tamil Nadu 2. Competitive advantages of Tamil Nadu 3. Sectoral Opportunities in Tamil Nadu 4. Government support to investors Advantage Tamil Nadu 2 nd largest State Economy in India. In
An Analysis of Intra-Regional Air Travel in SAARC Region
 An Analysis of Intra-Regional Air Travel in SAARC Region Prof. Amal S Kumarage, Ms D Piyathilaka, Ms K C S Ekanayake Department of Transport & Logistics Management University of Moratuwa Annual Sessions
Property at Devanahalli 25 Acres Suited for upscale Leisure resorts
 Property at Devanahalli 25 Acres Suited for upscale Leisure resorts Bangalore City Overview Bangalore City is the capital of the state of Karnataka. Founded in the 16th century, it is the principal administrative,
Magnitude of Tourism
 Magnitude of Tourism 63 Index of Tables Sr.No. Table No. Page No. 1 Table 1 Total Tourist arrivals to Gujarat (2002-2011) 68 2 Table 2 Contribution of Tourism in Gujarat to State GDP 71 3 Table 3 Domestic
Hamburg Market Report
 Market Report Hamburg Hotel 2014/2015 Hamburg Market Report Accelerating success. Overall information The Hanseatic City of Hamburg has a population of about 1.75 million, making it the second largest
Investor Presentation
 Investor Presentation ICR XChange January 17, 2008 Forward-Looking Statements Some of the statements in this presentation constitute forward-looking statements. Forward-looking statements relate to expectations,
DLF Ltd. Q1 Analyst Presentation
 DLF Ltd. Q1 Analyst Presentation 1 Results at a Glance Q1 Sl.No. Consolidated Financials 1Q FY08 Rs. In Crores A) 1 Sales and Other Receipts 3074 2 Other Income 47 Percentage of Total Revenue Margins(%)
Monitorable Targets & Milestones for INFRASTRUCTURE SECTOR : Planning Commission, Government of India
 Page 1 of 1 S.No. Name of the Scheme Actual 2009-10 Expenditure in 2010-11 (Cumulative) (Rs. In Crores) Grand Total 2010-11 1st Qtr 2nd Qtr 3rd Qtr 4th Qtr 1 CSI Airport Mumbai Target 570.00 982.00 1645.00
III. TRADE IN COMMERCIAL SERVICES BY CATEGORY
 . TRADE IN COMMERCIAL SERVICES BY CATEGORY The Highlights Transportation services Rising seaborne trade and air traffic contribute to the increase of transportation services trade In a context of rising
Transforming Urban Landscapes By Creating Sustainable Communities
 Transforming Urban Landscapes By Creating Sustainable Communities About Mahindra Group The Mahindra Group focuses on enabling people to rise through solutions that power mobility, drive rural prosperity
The winning states in each of the three award categories were as follows:
 WTTCII-HVS Tourism for Tomorrow Awards India, 5 December 2013 The World Travel & Tourism Council India Initiative (WTTCII) and HVS, the world s leading hospitality consulting and services organization,
Realty Decoded - Q4 FY 18 April 2018
 Realty Decoded - FY 18 April 2018 Executive Summary Indian real estate has finally come out of bottom of down- cycle in FY 18 with sales growing by more than 35% over FY 17 Sales increase is not limited
POYSHA INDUSTRIAL ESTATE. N.I.T. Faridabad
 N.I.T. Faridabad Welcome to Haryana Take a closer look at this vibrant, fast-growing State where you will nd the perfect infrastructure for a perfect location for an enduring and pro table investment.
11 th Annual Conference Road Development in India Telangana State Initiatives
 11 th Annual Conference Road Development in India Telangana State Initiatives 24 th August 2016 New Delhi Bikshapathi Kondai Engineer in Chief R&B, Telangana State New Telangana State - Infrastructure
Economic Report. Tasmania December Savills Research. Tasmania - Key Economic Indicators. Highlights
 Savills Research Economic Report Tasmania December 2018 Highlights Tasmania s economic growth for the current annual period has been notably above trend, with the strongest growth rate, on GSP numbers,
From: OECD Tourism Trends and Policies Access the complete publication at: Mexico
 From: OECD Tourism Trends and Policies 2014 Access the complete publication at: http://dx.doi.org/10.1787/tour-2014-en Mexico Please cite this chapter as: OECD (2014), Mexico, in OECD Tourism Trends and
Status of Compilation of Tourism Satellite Accounts for India
 Status of Compilation of Tourism Satellite Accounts for India S V Ramana Murthy Deputy Director General Ministry of Statistics & Programme Implementation Email: svr.murthy@nic.in What are Satellite Accounts?
No /2003-VAS Dated the 11th Nov., SUB: GUIDELINES FOR UNIFIED ACCESS(BASIC & CELLULAR) SERVICES LICENCE.
 SERVICES LICENCE.") Government of India Ministry of Communications and Information Technology Department of Telecommunications Sanchar Bhawan, 20 Ashoka Road, New Delhi-110 001. No.808-26/2003-VAS Dated the 11th Nov., 2003.
Government of India Ministry of Communications and Information Technology Department of Telecommunications Sanchar Bhawan, 20 Ashoka Road, New Delhi-110 001. No.808-26/2003-VAS Dated the 11th Nov., 2003.
Pedro B. Ortiz MEGA-MUMBAI / MAHARASHTRA SOUTH ASIA S CAPITAL REGION
 150525 Pedro B. Ortiz MEGA-MUMBAI / MAHARASHTRA SOUTH ASIA S CAPITAL REGION Next 20 years: From 3.5 to 5.5 b. = 2.000 m. in 20 years 300.000 every day (India: 50.000 China 30.000) 200% X 2 100% 5 % 5 10
DISTRICT PROFILE ARWAL
 DISTRICT PROFILE ARWAL INTRODUCTION Arwal district is one of the thirty-eight districts of Bihar. Arwal town is situated on the right side bank of the river Son, which is a tributary to the river Ganges.
Subnational Reform in the Business Regulatory Framework Experiences and Challenges in Select Indian States
 Subnational Reform in the Business Regulatory Framework Experiences and Challenges in Select Indian States Paramita Dasgupta The World Bank June 21, 2005 Structure of the paper Linkages between investment
TOWNSVILLE NORTH QUEENSLAND IN FOCUS LIVEABLE THE LARGEST CITY IN NORTHERN AUSTRALIA
 TOWNSVILLE NORTH QUEENSLAND IN FOCUS THE LARGEST CITY IN NORTHERN AUSTRALIA LIVEABLE 190,000 >40% Townsville is the largest city in Northern Australia with a population of approximately 190,000 and an
JAL Group Announces its FY Medium-Term Business Plan
 JAL Group Announces its FY2006-2010 Medium-Term Business Plan -Mobilize the Group s Strengths to Regain Trust - Tokyo, Thursday March 2, 2006: The JAL Group today announced its medium-term business plan
Concrete Visions for a Multi-Level Governance, 7-8 December Paper for the Workshop Local Governance in a Global Era In Search of
 Paper for the Workshop Local Governance in a Global Era In Search of Concrete Visions for a Multi-Level Governance, 7-8 December 2001 None of these papers should be cited without the author s permission.
BUSINESS OPPORTUNITIES IN TANZANIA
 BUSINESS OPPORTUNITIES IN TANZANIA FACT PACK June 2015 Business Sweden in Nairobi TANZANIA BRIEF FACTS BASIC FACTS Population: 49,639,138 (2014) Area: 947,300* sq. km Capital: Dar es Salaam Languages:
Multimodal Logistics Professionals
 Multimodal Logistics Professionals 1 CONCOR - THE COMPANY INCORPORATED - MARCH 1988 OPERATIONAL - NOVEMBER 1989 AUTHORISED CAPITAL - Rs.400 CRORE SHARE CAPITAL - Rs.64.99 CRORE (RECEIVED DURING 1988-89
Remarks by Ambassador Hiramatsu at Global Investors Meet on Wednesday, 23th January
 Remarks by Ambassador Hiramatsu at Global Investors Meet 2019 on Wednesday, 23th January 1. Introduction H. E. Mr. Edappadi K. Palaniswami, Honorable Chief Minister of Tamil Nadu, H.E. Mrs. Nirmala Sitharaman,
Czech Republic. Tourism in the economy. Tourism governance and funding
 Czech Republic Tourism in the economy Tourism s share of GDP in the Czech Republic has been increasing over the last two years from 2.7% in 2012 to 2.9 % in 2013. The number of people employed in tourism
HEALTH SECTOR ECONOMIC INDICATORS REPORT
 HEALTH SECTOR ECONOMIC INDICATORS REPORT For: Mid North Coast Local Health District Report prepared by: April 2013 Table of Contents Introduction 3 Executive Summary 4 Output 5 Value-Added 7 Workforce
Policy PL Date Issued February 10, 2014
 Subject RENEWABLE ENERGY ON CROWN LAND Compiled by Renewable Energy Program, Biodiversity Branch Replaces Policy Directives Waterpower Site Release Crown Land Onshore Windpower Development - Crown Land
DaHar Danube Inland Harbour Development
 The European Union's Southeast Europe programme supporting DaHar Danube Inland Harbour Development DaHar WP 4 A4: Local Action Plan of the Port of Novi Sad Final version: 30 th of December 2013 This project
National Conference on
 National Conference on Rural Roads th 26 August 2014 Ashok Hotel, Chanakyapuri, New Delhi Ministry of Rural Development Conference on Rural Roads Indian Construction Equipment Manufacturers Association
WORLD TRADE ORGANIZATION
 WORLD TRADE ORGANIZATION Trade Policy Review Body RESTRICTED 1 October 2007 (07-3988) Original: English TRADE POLICY REVIEW Report by SAINT KITTS AND NEVIS Pursuant to the Agreement Establishing the Trade
Construction of Sardar Mandir at Surat. Urban development. Government of Gujarat
 Construction of Sardar Mandir at Surat Urban development Government of Gujarat Contents Project Concept Market Potential Growth Drivers Gujarat Competitive Advantage Project Information - Location/ Size
15-18 May 2018 Proposal for Government of Bihar to participate in GES 2018
 15-18 May 2018 Proposal for Government of Bihar to participate in GES 2018 Bombay Exhibition Centre - NSE complex, Goregaon (E) Mumbai Global platform for increased trade in services Table of Contents
Presented by: Ms. Kanageswary Ramasamy Department of Statistics, Malaysia February 2017
 Presented by: Ms. Kanageswary Ramasamy Department of Statistics, Malaysia 14-16 February 2017 1 INTRODUCTION 2 HISTORICAL DEVELOPMENT OF TOURISM SATELLITE ACCOUNT 3 THE IMPORTANCE OF TOURISM SATELLITE
Land area 1.73 million km 2 Queensland population (as at 31 December 2017) Brisbane population* (preliminary estimate as at 30 June 2017)
 Brisbane population* (preliminary estimate as at 30 June 2017)") Queensland - 11 Queensland OVERVIEW Queensland is nearly five times the size of Japan, seven times the size of Great Britain, and two and a half times the size of Texas. Queensland is Australia s second
Queensland - 11 Queensland OVERVIEW Queensland is nearly five times the size of Japan, seven times the size of Great Britain, and two and a half times the size of Texas. Queensland is Australia s second
Table-1.1 SEASONS, SOWING & HARVESTING PERIOD AND PRODUCTION. Five year Average Production ( to Harvesting Period.
 1 1. PRODUCTION: The major potato producing States are Uttar Pradesh, West Bengal, Bihar, Gujarat, Madhya Pradesh, Punjab, Haryana and Assam. (Table-1.3). The details regarding seasonality, harvesting
SEQ Catalyst Projects
 m3property Update SEQ Catalyst Projects Winter 2018 Since our Autumn Catalyst Projects report, several projects in South East Queensland s pipeline of major projects have progressed and several new projects
OPERATOR OF NEW INDUSTRY CITIES
 OPERATOR OF NEW INDUSTRY CITIES A LEADING NEW INDUSTRY CITY OPERATOR CFLD ONE New Industry City An INFINITE Future CFLD (Stock Code 600340.SH), founded in 1998, focuses on industry upgrading and the development
Sagarmala Development Company (SDC)
") Sagarmala Development Company (SDC) Sagarmala Programme moving from planning to implementation stage Projects under Sagarmala will be implemented by Central Ministries, State Governments, Ports / Agencies
Sagarmala Development Company (SDC) Sagarmala Programme moving from planning to implementation stage Projects under Sagarmala will be implemented by Central Ministries, State Governments, Ports / Agencies
ELECTRONIC MANUFACTURING CLUSTER - II
 ELECTRONIC MANUFACTURING CLUSTER - II at Vikruthamala (V), Yerpedu (M), Chittoor (D) APIIC Limited - Implementing Agency Babu A, IAS Vice Chairman & Managing Director T: 0866-2428301 E: vcmd.ap.apiic@nic.in
EXHIBITION & CONFERENCE ALUMINIUM DIE CASTING 1-3 DECEMBER 2016 BIEC, BENGALURU, INDIA.
 EXHIBITION & CONFERENCE ALUMINIUM DIE CASTING 1-3 DECEMBER 2016 BIEC, BENGALURU, INDIA www.alucast2016.com Organizer: Event Producer: India s biggest exhibition for the Aluminium Die Casting Industry,
Doing Business in the State of West Bengal. U.S. Department of Commerce International Trade Administration
 Doing Business in the State of West Bengal U.S. Department of Commerce International Trade Administration Doing Business in the State of West Bengal LINDA ABBRUZZESE Senior International Trade Specialist
Aero Expo 2016 Civil Aviation Convention & Exhibition Enhancing Regional & Remote Connectivity. November 18 th, 2016.
 KNOWLEDGE PARTNER Aero Expo 2016 Civil Aviation Convention & Exhibition Enhancing Regional & Remote Connectivity November 18 th, 2016 Presented To: Shri Ashok Gajapathi Raju Pusapati Hon ble Minister of