Escape to the cities for best quality of life
|
|
|
- Camilla Wilcox
- 6 years ago
- Views:
Transcription
1 MEDIA RELEASE Embargoed until 12:01am Wednesday August Escape to the cities for best quality of life Kingborough in southern Hobart has the best quality of life in Tasmania The lowest quality of life in Tasmania is in the central Highlands. Ku-ring-gai in Sydney has the best quality of life in Australia Today s obsession with moving to the coast or country to escape the stress of modern living has proven to be a myth, with groundbreaking research showing the best quality of life is in our cities. The inaugural BankWest Quality of Life Index shows 21 of Australia s 25 most liveable communities are in our urban suburbs, rather than coastal towns, dispelling the sea-change and tree-change dream. Five hundred and ninety local government areas (LGAs) across Australia, including 29 in Tasmania, were ranked against 10 key criteria including employment levels, crime rates, internet access, health, education levels, earnings, home ownership rates, house size, proportion of empty homes and community involvement. Residents of Kingborough in southern Hobart have the best quality of life in Tasmania, followed by West Tamar and Meander Valley in northern Tasmania. Ku-ring-gai in Sydney s northern suburbs has the best quality of life in Australia. Halls Creek in Western Australia has the lowest quality of life in Australia. In Tasmania the lowest quality of life is in the Central Highlands. Although many Australians dream of living on the coast or in the country, in reality the best quality of life in Australia is found in the suburbs, including suburban Hobart, BankWest Retail Chief Executive Ian Corfield said. In Hobart s suburbs, residents often have the best of all worlds with access to good schools, modern hospitals and reliable jobs but also large houses, fast internet connections and low crime rates. King Island offers the best value for money area in Tasmania, with a high quality of life and lower than average house prices. To derive the rankings in the BankWest Quality of Life Index each LGA was systemically scored out of 10 for each of the 10 variables contained in the index. These scores were then summed to create an overall quality of life score and ranking by LGA. Data used in the BankWest Quality of Life Index has been gathered from official government sources including the National Census, Australian Bureau of Statistics, the Australian Tax Office and the Public Health Information Development Unit. 1
2 Top rating communities in Tasmania against 10 quality of life criteria: Home ownership rates are highest in Kentish (83%). Health rates are highest for Kingborough residents (84.1%). Property related crime rates are lowest in the Northern region with only 1.3% of the local population impacted last year. Volunteering rates are highest in Flinders (41%). High school enrolment rates are highest in King Island (82%). The best jobs market is in King Island (97.8%). Broadband internet connection rates are highest in Hobart (41%). The lowest proportion of vacant homes in the country is in Brighton (3.5%). This is recognised as an important disincentive against crime. The greatest proportion of detached houses is in South Midlands (97.2%). The highest average taxable income is in King Island ($54,878). Table 1 Quality of Life Rankings Top 10 LGAs in Tasmania LGA Region Tasmania Quality of Life ranking Australian Quality of Life ranking Kingborough Greater Hobart West Tamar Northern Meander Valley Northern King Island Mersey-Lyell Northern Midlands Northern Clarence Greater Hobart Hobart Greater Hobart Central Coast Mersey-Lyell Circular Head Mersey-Lyell Dorset Northern Table 2 Quality of Life Rankings Bottom 10 LGAs in Tasmania LGA Region Tasmania Quality of Life ranking Australian Quality of Life ranking Central Highlands Southern Tasman Southern Derwent Valley Greater Hobart Glamorgan/Spring Bay Southern Brighton Greater Hobart Break O'Day Northern West Coast Mersey-Lyell Glenorchy Greater Hobart George Town Northern Huon Valley Southern
3 Table 3 Quality of Life Rankings Top 25 LGAs in Australia LGA Region State Quality of Life Ranking Ku-ring-gai Sydney NSW 1 Hunter's Hill Sydney NSW 2 Nillumbik Melbourne VIC 3 Peppermint Grove Perth WA 4 Mosman Sydney NSW 5 Nedlands Perth WA 6 Manningham Melbourne VIC 7 Bayside Melbourne VIC 8 Boroondara Melbourne VIC 9 Adelaide Hills Adelaide SA 10 Cottesloe Perth WA 11 Baulkham Hills Sydney NSW 12 Macedon Ranges Loddon VIC 13 Pittwater Sydney NSW 14 Indigo Ovens-Murray VIC 15 Weston Creek ACT ACT 16 Lane Cove Sydney NSW 17 Hornsby Sydney NSW 18 Golden Plains Barwon VIC 19 Cambridge Perth WA 20 Woollahra Sydney NSW 21 Walkerville Adelaide SA 22 Cambooya Darling Downs QLD 23 Whitehorse Melbourne VIC 24 Yarra Ranges Melbourne VIC 25 3
4 Table 4 Quality of Life Rankings Bottom 25 LGAs in Australia LGA Region State Quality of Life Ranking Halls Creek Kimberley WA 590 Woorabinda Fitzroy QLD 589 Meekatharra Central WA 588 Brewarrina North Western NSW 587 Tennant Creek Northern Territory NT 586 Lockhart River Far North QLD 585 Doomadgee North West QLD 584 Borroloola Northern Territory NT 583 Laverton South Eastern WA 582 Walgett North Western NSW 581 Mount Magnet Central WA 580 Central Highlands Southern TAS 579 Wiluna Central WA 578 Tasman Southern TAS 577 Pormpuraaw Far North QLD 576 Central Darling Far West NSW 575 Melbourne Melbourne VIC 574 Sydney Sydney NSW 573 Bourke North Western NSW 572 Cue Central WA 571 Coober Pedy Northern SA 570 Jabiru Northern Territory NT 569 Leonora South Eastern WA 568 Derby-West Kimberley Kimberley WA 567 Moree Plains Northern NSW 566 Table 5 Quality of Life Rankings Best Performer by category in Tasmania Quality of Life Variable LGA Result Average annual Taxable Income $ King Island 54,878 Employment rate % of labour force King Island 97.8% Owner Occupation rate % Kentish 83% % of dwelling stock which are detached houses Southern Midlands 97.2% Crimes against property per 100,000 population Northern region 1,305 % of 16yr olds enrolled in secondary school King Island 82% % of households with broadband internet connection Hobart 41% % in good health Kingborough 84.1% % of Dwelling stock vacant Brighton 3.5% % of over 15 yrs who volunteer Flinders 40.8% 4
5 KEY FINDINGS FOR THE QUALITY OF LIFE SURVEY Twenty one of the top 25 Local Government Areas (LGA) for quality of life are located in capital cities. Eight are in Sydney with six in Melbourne, four in Perth, two in Adelaide and one in Canberra. The best quality of life ranking n Tasmania is in Kingborough (118 th ) in Hobart, followed by West Tamar (120 th ) and Meander Valley (140 th ) in the northern region. Of the top 10% of LGAs (59) nationwide, 36% are located in Victoria, 24% in NSW, 14% in Western Australia and 12% in South Australia. The best value area in Tasmania is King Island in the Mersey Lyell region. It is fourth highest ranked LGA in Tasmania and has a median house price of $192,000, $77,045 or 29% less than the median Tasmanian house price. BEST PERFORMANCE BY QUALITY OF LIFE VARIABLE Home ownership Home ownership rates are highest in Kentish with 83% of households owner occupiers, followed by West Tamar (82%), Tasman (82%) and Southern Midlands (82%). Eight LGAs in Tasmania have home ownership rates exceeding 80%, 10 percentage points more than the national average of 70%. Detached housing Ninety seven percent of dwellings are detached houses in Southern Midlands and Central Midlands, the highest percentage in the state, followed by Dorset (96%) and Kentish (96%). Across Australia 74% of dwellings are detached houses. Detached housing is seen as desirable because they are generally larger than apartments. Employment King Island has the highest employment rate measured with 98% of the local labour force employed, followed by Flinders (96%). Six LGAs in Tasmania have at least 95% of the labour force employed. The national average employment rate is 94.8%. Income Levels Across Tasmania the average taxable income in was $40,446. By LGA taxable incomes range from $32,232 to $54,878. King Island ($54,878) has the highest average taxable income, followed by Hobart ($49,678) and West Coast ($44,245). 5
6 Broadband Internet Access 41% of households in Hobart have a broadband internet connection, the highest proportion in Tasmania. This was followed by Kingborough (36%) and West Tamar (35%). 40% of household across Australia have a broadband internet connection. Proportion of Empty Homes in an area Brighton (3.5%) has the lowest proportion of vacant homes in Tasmania and also Australia, followed by Glenorchy (6.2%). Across Australia 10% of dwellings were vacant during the census. Volunteering Rates The greatest proportion of volunteers in Tasmania is in Flinders (41%), followed by King Island (34%) and Break O Day (30%). Across Australia 20% of adults volunteer in the community. School enrolments for sixteen year olds 82% of 16 year olds attend secondary school in King Island, the highest proportion in Tasmania Across Australia 75% of 16 year olds attend secondary school. Proportion of the Population in Good Health Residents of Kingborough are the healthiest in Australia with 84% in good health. This was followed by 83% in good health in Hobart and Meander Valley. Across Australia 81.6% of households indicate they are in good health. Property related crime rates Property related crime rates are lowest in the Northern region of Tasmania with only 1.3% of the local population impacted in 2003/04. Across Tasmania 1.6% of households were impacted by property related crime in 2003/04. 6


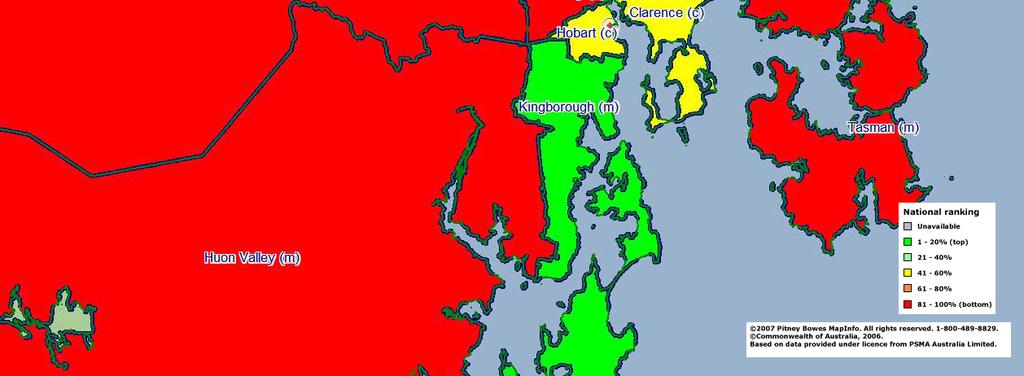
7 Quality of Life across Australia Quality of Life in Hobart 7
8 EDITORS NOTES The BankWest Quality of Life Survey tracks where living standards are highest in Australia by ranking local performance across key indicators of the labour market, the housing market, the environment, education and health. The index examines data at a local authority level (LGA) for 590 LGAs across Australia. Data has been gathered from sources including the Australian Bureau of Statistics, the Australian Tax Office, the Public Health Information Development Unit and various state police departments. Each local government area (LGA) is given a score out of 10 for each variable contained in the index. Scores for each variable are summed to create an overall quality of life score. Scoring process The following formulae have been used to derive individual quality of life scores. S a = 5*V a / [(V max - V min )/2 + V min ] S i = S a + (V i - V a )/ s.d.(v n ) Max = 10, Min = 0 Q i = ΣS i S a = average score, V a = average value, V max = highest reading, V min = lowest reading S i = individual score, V i = individual value, V n = all values, s.d. = standard deviation n = number of values, Q i = Quality of Life score Statistical sub-divisions have been used in the ACT in place of LGAs. House prices are sourced from Residex and refer to calendar years 2002 and See more detailed BankWest Quality of Life Report 2008 for more information on methodology and data sources, available at A list of quality of life rankings by LGA is also available at Composition of the Quality of Life Index Variable Period covered Average Taxable Income 2005/06 Employment rate % for labour force 2006 Census Owner Occupation rate % 2006 Census % of dwelling stock which are detached houses 2006 Census Crimes against property per 100,000 population % of 16yr olds enrolled in secondary school 2006 Census % of households with broadband internet connection 2006 Census % in good health 2001 % of Dwelling stock vacant 2006 Census % of over 15 yrs who volunteer 2006 Census 8
9 Media Inquiries: Adam Connolly, Head of Corporate Affairs HBOS Australia, Bridget Tombleson, Media Relations Manager HBOS Australia, About BankWest BankWest is a wholly owned subsidiary of HBOS plc, one of the world s largest financial services groups, with assets of about AUD$800 billion ( 380 billion). BankWest is a full service bank which originated in Western Australia in 1895 and services more than 860,000 customers. Nationally, BankWest promotes a range of products using cost-effective direct and third party distribution channels, including 24-hour telephone and internet services and mortgage brokers. In WA, BankWest is a market leader with about one quarter of all bank advances and deposits and an extensive network of branches. Standard & Poors short-term credit rating for BankWest is A-1+ and AA- for the long term, providing customers with investment grade security. 9
Bankwest First Time Buyer Deposit Report 2016
 Bankwest First Time Buyer Deposit Report 2016 December 2016 The eighth annual Bankwest First Time Buyer Deposit Report tracks the time it would take for first time buyers to save a in 465 local government
September Quarter 2018
 Tasmanian Rents September Quarter 2018 from data collected by statistics compiled by Tenants Union of Tasmania HEADLINE data collected FIGURES: by the Weighted Rental Deposit Median Authority Rent Index
MEDIA RELEASE Embargoed 12:01am Tuesday July 6, 2010
 MEDIA RELEASE Embargoed 12:01am Tuesday July 6, 2010 QLD first home buyers save 4.5yrs for a deposit Housing affordability has continued to worsen over the past year, with first home buyers in Queensland
MAP: June Quarter 3 Bedroom Median Rent $270
 Tasmanian Rents June Quarter 2018 Amended from data collected by statistics compiled by Tenants Union of Tasmania HEADLINE data collected FIGURES: by the Weighted Rental Deposit Median Authority Rent Index
Australian Accommodation Monitor Summary. Financial-year performance:
 Australian Accommodation Monitor Summary Financial-year performance: 2016-17 Australian Accommodation Monitor (AAM) Northern Territory Click on each territory to view detailed report. 68.3 143.10-2.5 Queensland
State of the States October 2017 State & territory economic performance report. Executive Summary
 State of the States October 2017 State & territory economic performance report. Executive Summary NSW ON TOP; VICTORIA CLOSES IN How are Australia s states and territories performing? Each quarter CommSec
DOMESTIC TOURISM REPORT: OVERVIEW OF ACCOMMODATION PERFORMANCE
 22 June 2017 DOMESTIC TOURISM REPORT: OVERVIEW OF ACCOMMODATION PERFORMANCE 1. Key markets and trends 1.1 Overview Domestic Overnight Visitors 91,682,567 3.1% Domestic Visitor Nights 335,480,784 3.8% Domestic
MAPPING YOUTH UNEMPLOYMENT HOTSPOTS
 AN UNFAIR AUSTRALIA? MAPPING YOUTH UNEMPLOYMENT HOTSPOTS MARCH 2018 Australians all let us rejoice, For we are young and free; We ve golden soil and wealth for toil The first lines of the national anthem,
PUBLIC HOLIDAYS 2017 NATIONAL SUMMARY
 PUBLIC HOLIDAYS 2017 NATIONAL SUMMARY AS AT DECEMBER 2016 This fact sheet provides information about the gazetted public holidays in each State and Territory. AUSTRALIAN CAPITAL TERRITORY Public holidays
PUBLIC HOLIDAYS 2016 NATIONAL SUMMARY
 PUBLIC HOLIDAYS 2016 NATIONAL SUMMARY AS AT APRIL 2016 This fact sheet provides information about the gazetted public holidays in each State and Territory. AUSTRALIAN CAPITAL TERRITORY Public holidays
Is uneven economic growth dividing Australian society? 14 March 2017
 Is uneven economic growth dividing Australian society? 14 March 2017 Outline Growing national economy hides a concerning spatial distribution. The big cities and mineral production are driving the national
TRANSPORT AFFORDABILITY INDEX
 TRANSPORT AFFORDABILITY INDEX Report - March 2018 AAA 1 AAA 2 Table of contents Foreword 4 Section One Overview 6 Section Two Summary of Results 8 Section Three Detailed Results 14 Section Four State by
The Residential Outlook for South Australia
 The Residential Outlook for South Australia Matthew King Economist HOUSING INDUSTRY ASSOCIATION February 2011 Overview Economic backdrop Other important matters Interest rates & bank lending Renovations
Statistical Picture of Aboriginal and Torres Strait Islander School Students in Australia
 Chapter 2 Statistical Picture of Aboriginal and Torres Strait Islander School Students in Australia Statistical Picture The Australian Bureau of Statistics (ABS) reported that the estimated resident Aboriginal
10.2 % Tasmania. 9.3 % Flinders 2.1 % 4.8 % Tasmania AVERAGE ANNUAL MEDIAN PRICE GROWTH % 5 years years 3.9% 20 years 7.
 Tasmania King Island Tasmania 1.2 % Average annual growth over 5 years AVERAGE ANNUAL MEDIAN PRICE GROWTH 217 19.3% 5 years 1.2 1 years 3.9% 2 years 7.7% 9.3 % Flinders Island 2.1 % North West 4.8 % Northern
Housing in Hobart: an overview of the data. Richard Eccleston, Lisa Denny, Julia Verdouw & Kathleen Flanagan University of Tasmania May 2018
 Housing in Hobart: an overview of the data Richard Eccleston, Lisa Denny, Julia Verdouw & Kathleen Flanagan University of Tasmania May 2018 Informing the Housing Debate Tasmania is facing significant housing
GTO SCENariOS TO 2020
 D 10. The market for apprentices by region 1998 to 2020 92 10.1 The base case projections 92 11. Regional apprentice markets: The risks to growth 101 12. GTO industry scenarios: Constant market share 104
INTERNATIONAL TOURISM REPORT: OVERVIEW OF ACCOMMODATION PERFORMANCE
 1. Key markets and trends INTERNATIONAL TOURISM REPORT: OVERVIEW OF ACCOMMODATION PERFORMANCE 1.1 Overview International Visitors 8,362,774 6.15% International Visitor Nights 269,676,096 1.39% International
SAMPLE REPORT. Pain and Gain March Quarter, 2016
 Pain and Gain March Quarter, 2016 A quarterly assessment of realised gross profit and loss based on dwelling re-sales over the March Quarter of 2016 Contents Headline results for December quarter 2015
South Australian Centre for Economic Studies June 2016 Economic Briefing Report 28 June, 2016
 Steve Whetton, Executive Director, SA Centre for Economic Studies South Australian Centre for Economic Studies June 216 Economic Briefing Report 28 June, 216 Per cent Global GDP Growth 1 8 Developing Countries
Property Flipping Report. Prepared by CoreLogic
 Property Flipping Report Prepared by CoreLogic About CoreLogic About CoreLogic CoreLogic Australia is a wholly owned subsidiary of CoreLogic (NYSE: CLGX), which is the largest property data and analytics
Economic Performance of Australia s Cities and Regions Embargoed until Tuesday 5 December 2017
 Economic Performance of Australia s Cities and Regions Embargoed until Tuesday 5 December 2017 Media Release Tuesday 5 December 2017: New research released today by SGS Economics & Planning (SGS) reveals
Pain and Gain. September Quarter, 2016
 Pain and Gain September Quarter, 2016 A quarterly assessment of realised gross profit and loss based on dwelling re- over the September Quarter of 2016 Contents Headline results for September quarter 2016
State Budget Breakfast
 Welcome to Master Builders SA s State Budget Breakfast July 8, 2016 Ian Markos Chief Executive Officer, Master Builders SA Associate Professor Michael O Neil Executive Director, South Australian Centre
DOMESTIC TOURISM REPORT: OVERVIEW OF ACCOMMODATION PERFORMANCE
 31 March 2017 DOMESTIC TOURISM REPORT: OVERVIEW OF ACCOMMODATION PERFORMANCE 1. Key markets and trends 1.1 Overview Domestic Visitors 90,741,716 4.2% Domestic Visitor Nights 334,764,472 4.0% Domestic Trip
Expenditure Share of Visitors Visitor Expenditure expenditure nights per visitor
 Table 23 Modelled domestic overnight visitor expenditure (a) in the top 20 regions ranked by expenditure, including airfares and long distance transport costs Year ended 31 March 2010 (a) (b) Expenditure
PUBLIC HOLIDAYS 2019 NATIONAL SUMMARY
 PUBLIC HOLIDAYS 2019 NATIONAL SUMMARY AS AT 11 OCTOBER 2018 This fact sheet provides information about the gazetted public holidays recognised in each State and Territory for 2019. All public holiday dates
Australian Climate Change Adaptation Plan Database. Lisette B Collins CONTACT: Lisette Collins
 Lisette B Collins CONTACT: Lisette Collins lisette.collins@environment.nsw.gov.au Adelaide Hills SA Group 2012 Eastern Regional Alliance South ACY 38,628 Albany WA Group 2006 South West Western Australia
Aboriginal and Torres Strait Islander suicide data 2016
 Aboriginal and Torres Strait Islander suicide data 2016 Aboriginal and Torres Strait Islander suicide data 2016 Preliminary 2016 statistics indicated that: 162 (119 male, 43 female) Aboriginal and Torres
Australian Apprentices in training - Dec quarter
 Annual Australian Apprenticeships Summary Statistics 12 months to December 217 Highlights of the NCVER December Quarter 217 - Australian Apprenticeships Statistics for Australia: In the 12 months to 31
CoreLogic Property Market Indicator Summary All data to week ending 18 February 2018
 As auction volumes return to more normal levels after the festive period slowdown, auction clearance rates are holding higher than late 2017 A preliminary auction clearance rate of 69.1 per cent was recorded
Annual overnight visitor numbers to the region
 x TOURISM NT REGIONAL PROFILE Greater Darwin Report Period: Year Ending June 2018 Annual overnight visitor numbers to the region Sunset at Mindil Beach, Darwin Credit: Aude Mayans/Tourism NT REGION DEFINITION
NOT FOR BROADCAST OR PUBLICATION BEFORE 00:01, TUESDAY 1 MARCH 2016
 PRESS RELEASE NOT FOR BROADCAST OR PUBLICATION BEFORE 00:01, TUESDAY 1 MARCH 2016 The Bank of Scotland Rural Quality of Life Survey tracks where living standards are highest in Great Britain by ranking
WRIGHT DENMAN PROSPECT AREA PROFILE MACRO PLAN DIMASO
 WRIGHT DENMAN PROSPECT AREA PROFILE CONTENTS WHY CANBERRA? PG 04 INVEST IN THE MOLONGLO VALLEY PG 06 3 PROPERTY GROUP PG 08 DETAILED INVESTMENT ANALYSIS PG 11 Population Growth Demographics Tenure & Typology
CoreLogic Property Market Indicator Summary All data to week ending 25 March 2018
 Auction activity reaches its highest level not only over the year-to-date, but the highest volume of auctions ever recorded across the combined capital cities and Melbourne individually The pre-easter
market-view Australian housing markets report Residential construction on the rise - higher and higher?
 Australian housing markets report Residential construction on the rise - higher and higher? Dr Andrew Wilson Chief Economist Domain Group October 2016 Copyright 2016 Dr Andrew Wilson all rights reserved
Australia s Building Industry current conditions and future prospects
 Australia s Building Industry current conditions and future prospects Dr Harley Dale HIA Chief Economist Alpine Nurseries Business Seminar Tuesday 26th August 2014, Sydney What is driving housing activity?
The Outlook for the Residential Construction Industry Hunter and the Central Coast
 The Outlook for the Residential Construction Industry Hunter and the Central Coast Graham Wolfe HIA Chief Executive Industry Policy and Media HIA Industry Outlook Breakfast Newcastle February 2013 Backdrop:
TRANSPORT AFFORDABILITY INDEX
 TRANSPORT AFFORDABILITY INDEX Report - December 2016 AAA 1 AAA 2 Table of contents Foreword 4 Section One Overview 6 Section Two Summary of Results 7 Section Three Detailed Results 9 Section Four City
CoreLogic Property Market Indicator Summary All data to week ending 3 December 2017
 Auction volumes lower slightly, while the preliminary clearance rate rises to 63.5 per cent There were 3,276 held across the combined capital cities this week, returning a preliminary auction clearance
Housing Outlook. Mr Sam White, Ray White Group Mr Harley Dale, Housing Industry Association. 29 October 2007
 Housing Outlook Mr Sam White, Ray White Group Mr Harley Dale, Housing Industry Association 29 October 2007 Australian Business Economists October 2007 Presented by Sam White Average Prices 700,000 600,000
CoreLogic Property Market Indicator Summary All data to week ending 21 May 2017
 Preliminary figures show 77.2 per cent of auctions were successful across the combined capital cities, while auction activity rises week-on-week Auction activity across the combined capital cities increased
NOT FOR BROADCAST OR PUBLICATION BEFORE HRS ON 16 DECEMBER
 NOT FOR BROADCAST OR PUBLICATION BEFORE 00.01 HRS ON 16 DECEMBER 2017 ORKNEY RETAINS ITS SPOT AS THE SECOND BEST PLACE TO LIVE IN THE UK Orkney second most desirable place to live with no other Scottish
Economic Contribution of Tourism to NSW
 Economic Contribution of Tourism to NSW 2013-14 Tourism is a significant part of the NSW economy. In 2013-14, tourism contributed $34.9 billion (Tourism Consumption) to the NSW economy and employed 272,000
GOING PLACES MACARTHURCOOK OFFICE PROPERTY TRUST
 GOING PLACES MACARTHURCOOK OFFICE PROPERTY TRUST ANNUAL REPORT 2006 1 2 3 4 1 2 181 Miller Street, North Sydney, NSW 150 170 Leichhardt Street, Spring Hill, Brisbane, QLD 3 4 38 Akuna Street, Canberra,
The Outlook for the Economy & Housing
 The Outlook for the Economy & Housing Matthew King HIA Economist Bulky Goods Retailers Assoc VIC Forum August 2010 Where are we heading? The Economic Backdrop Additional Factors Retail Trade Housing Outlook
HEPATITIS B MAPPING PROJECT HEPATITIS B MAPPING PROJECT. Estimates of chronic hepatitis B diagnosis,
 HEPATITIS B MAPPING PROJECT HEPATITIS B MAPPING PROJECT Estimates of chronic hepatitis B diagnosis, monitoring and treatment by Medicare Local Estimates of CHB prevalence and cultural AUSTRALASIAN SOCIETY
Australian Cities Accounts Estimates. December 2011
 Australian Cities Accounts 2010-11 Estimates December 2011 This report has been prepared by: SGS Economics and Planning Pty Ltd ACN 007 437 729 Level 5 171 Latrobe Street MELBOURNE VIC 3000 P: + 61 3 8616
Why Invest in Australia?
 Great Barrier Reef Northern Territory Queensland Western Australia South Australia Gold Coast New South Wales Victoria Australian Capital Territory Tasmania Australia is the biggest island in the world;
Australian Casino Association ECONOMIC REPORT. Prepared for. Australian Casino Association. June Finance and Economics
 Australian Casino Association ECONOMIC REPORT Prepared for Australian Casino Association June 2004 Finance and Economics Contents Executive Summary--------------------------------------------------------------------------------------------
RANZCOG CALENDAR 2019
 RANZCOG CALENDAR 2019 January 2019 Tuesday 1 January Wednesday 2 January Thursday 3 January Friday 4 January Thursday 10 January Tuesday 22 January Monday 28 January Monday 28 January Tuesday 29 January
STRATA DATA. Residential Strata in NSW A summary analysis. Issue 3, March City Futures Research Centre
 Governing the compact city STRATA DATA Residential Strata in NSW A summary analysis Issue 3, March 2011 City Futures Research Centre Cover photograph: Bruce Judd, 2010 Governing the Compact City Strata
CoreLogic Property Market Indicator Summary All data to week ending 24 June 2018
 Preliminary clearance rate improves across the combined capital cities over the week The preliminary clearance rate increased to 58.7 per cent this week, after last week saw the final clearance rate revise
INTERIM REVIEW OF AUSTRALIAN CONSTRUCTION MARKET CONDITIONS JULY 2015
 INTERIM REVIEW OF AUSTRALIAN CONSTRUCTION MARKET CONDITIONS JULY 2015 2 Review of Australian Construction Market Conditions July 2015 Trade bottlenecks continue in New South Wales, Victoria and Queensland
Contents Manningham at a Glance... 6 Location and Area... 6 Manningham Activity Centres... 6 Manningham Suburbs... 6 Population... 8 Forecast... 9 For
 Contents Manningham at a Glance... 6 Location and Area... 6 Manningham Activity Centres... 6 Manningham Suburbs... 6 Population... 8 Forecast... 9 Forecast 2011 2036... 9 Population Forecast... 9 Gross
AUSTRALIAN YOUTH UNEMPLOYMENT: SNAPSHOT - March 2014 COUNTING THE COSTS BROTHERHOOD OF ST LAURENCE
 AUSTRALIAN YOUTH UNEMPLOYMENT: SNAPSHOT - March 2014 COUNTING THE COSTS BROTHERHOOD OF ST LAURENCE AUSTRALIAN YOUTH UNEMPLOYMENT : March 2014 SNAPSHOT - COUNTING THE COSTS 1. INTRODUCTION Rising youth
CoreLogic Property Market Indicator Summary All data to week ending 11 November 2018
 As the number of held continues the seasonal rise, clearance rates are consistently trending lower, with the weighted average clearance rate recording seven weeks in a row below There were 2,384 held across
Location Date Times Capacity Address AUSTRALIAN CAPITAL TERRITORY 80 8:00 am 10:25 am June :00 am 12:25 pm 10.
 Canberra MMI Information Location Date Times Capacity Address AUSTRALIAN CAPITAL TERRITORY 80 8:00 am :25 am :00 am :25 pm :30 pm 2:40 pm 2:30 pm 5:00 pm 8:00 am :25 am :00 am :25 pm :30 pm 2:40 pm 2:30
Embargoed until 30/03/2012
 The Halifax Rural Areas Quality of Life Survey tracks where living standards are highest in Great Britain by ranking local performance across key indicators covering the labour market, the housing market,
RP Data Buy vs. Rent Report. An assessment of the difference between the cost associated with purchasing or renting a home across Australian suburbs
 RP Data Buy vs. Rent Report An assessment of the difference between the cost associated with purchasing or renting a home across Australian suburbs Released August 2012 Executive summary and methodology
New Year s Day (Public Holiday Australia and New Zealand) Australian Open Tennis Tournament, Melbourne. Anniversary Day (Public Holiday New Zealand)
 Australian Open Tennis Tournament, Melbourne. Anniversary Day (Public Holiday New Zealand)") January 2016 Friday 1 Monday 4 Monday 18 Sunday 31 Friday 22 Friday 22 Tuesday 26 Tuesday 26 Wednesday 27 Thursday 28 Friday 29 Friday 29 Saturday 30 New Year s Day (Public Holiday Australia and New College
January 2016 Friday 1 Monday 4 Monday 18 Sunday 31 Friday 22 Friday 22 Tuesday 26 Tuesday 26 Wednesday 27 Thursday 28 Friday 29 Friday 29 Saturday 30 New Year s Day (Public Holiday Australia and New College
Sharpe Performance by Australian Property
 Pacific Rim Property Society Conference Sydney 2009 Sharpe Performance by Australian Property Presented by: Stephen Lee CASS Business School City University, London, England David M. Higgins School of
Victoria s International Tourism Performance
 Victoria s International Tourism Performance Results from International Visitor Survey (IVS) for the year ending December 2018 Data Source: Tourism Research Australia, released March 2019 To note: This
Stayz VIC Melbourne city VIC ocean grove
 Property ID SA NSW VIC ACT QLD TAS NT WA Region Stayz 32828 NSW Illawarra Bundeena Stayz 100761 QLD Sunshine Coast Stayz 29061 NSW Cremorne Point Stayz 101249 TAS East Coast Tasmania Stayz 5396 QLD Fraser
Institute of Transport and Logistics Studies Interfleet Transport Opinion Survey (TOPS) Quarter 3, September 2011
 Quarter 3, September 2011") Institute of Transport and Logistics Studies Interfleet Transport Opinion Survey (TOPS) Quarter 3, September 2011 Transport stable as highest priority issue Highlights In the September 2011 quarter, 8%
Institute of Transport and Logistics Studies Interfleet Transport Opinion Survey (TOPS) Quarter 3, September 2011 Transport stable as highest priority issue Highlights In the September 2011 quarter, 8%
BENCHMARKING THE PERFORMANCE OF THE NATIONAL ROAD SAFETY STRATEGY
 BENCHMARKING THE PERFORMANCE OF THE NATIONAL ROAD SAFETY STRATEGY December 2017 Table of contents Key Changes Key Changes Since September 2017 Report 4 Foreword Australia s Road Toll: December 2017 5
Economic Report. Tasmania December Savills Research. Tasmania - Key Economic Indicators. Highlights
 Savills Research Economic Report Tasmania December 2018 Highlights Tasmania s economic growth for the current annual period has been notably above trend, with the strongest growth rate, on GSP numbers,
Infrastructure Priority List. Infrastructure Priority List Printed as at 28 April
 Infrastructure Priority List Infrastructure Priority List Printed as at 28 April 2018 1 High Priority Projects High Priority Projects are potential infrastructure solutions for which a full business case
Brisbane motorists face some of Australia s slowest commutes
 Brisbane motorists face some of Australia s slowest commutes 24-month review of country s busiest routes show state of traffic congestion in major cities August 2, 2011 - Motorists heading to the city
NAPA VALLEY VISITOR INDUSTRY 2014 Economic Impact Report
 NAPA VALLEY VISITOR INDUSTRY 2014 Economic Impact Report Research prepared for Visit Napa Valley by Destination Analysts, Inc. Table of Contents SECTION 1 Introduction 2 SECTION 2 Executive Summary 5 SECTION
Economic Contribution of Tourism to NSW
 Economic Contribution of Tourism to NSW 2015-16 Tourism is a significant part of the NSW economy. In 2015-16, tourism contributed $38.1 billion (Tourism Consumption) to the NSW economy and employed 261,100
WAVERLEY TOPS ANNUAL RURAL AREAS QUALITY OF LIFE SURVEY
 NOT FOR BROADCAST OR PUBLICATION BEFORE 00.01HRS 29 TH MARCH 2013 The Halifax Rural Areas Quality of Life Survey tracks where living standards are highest in Great Britain by ranking local performance
The Economic Impact of Tourism Brighton & Hove Prepared by: Tourism South East Research Unit 40 Chamberlayne Road Eastleigh Hampshire SO50 5JH
 The Economic Impact of Tourism Brighton & Hove 2013 Prepared by: Tourism South East Research Unit 40 Chamberlayne Road Eastleigh Hampshire SO50 5JH CONTENTS 1. Summary of Results 1 1.1 Introduction 1 1.2
Institute of Transport and Logistics Studies (ITLS) Transport Opinion Survey (TOPS) Quarter 1, March 2017
 Transport Opinion Survey (TOPS) Quarter 1, March 2017") Institute of Transport and Logistics Studies (ITLS) Transport Opinion Survey (TOPS) Quarter 1, March 2017 Highlights Infrastructure remains the same while transport decreases as the highest priority national
Institute of Transport and Logistics Studies (ITLS) Transport Opinion Survey (TOPS) Quarter 1, March 2017 Highlights Infrastructure remains the same while transport decreases as the highest priority national
Calendar 2018 (Australia) Special Dates: 2018 (Australia) Clipart. Activities:
 Special Dates: 2018 (Australia) Clipart. Activities:") Calendar 208 (Australia) Activities:. Find and enter public holidays, school holidays and commemorative dates. 2. Find and enter your own birthday. 3. Figure out the number of days between two dates: a)
Calendar 208 (Australia) Activities:. Find and enter public holidays, school holidays and commemorative dates. 2. Find and enter your own birthday. 3. Figure out the number of days between two dates: a)
Queensland Economic Update
 Queensland Economic Update Chamber of Commerce & Industry March 2018 cciq.com.au Queensland Economic Update: Summary National Accounts GDP expanded 2.3% during calendar year 2017. QLD state final demand
Australian Statistical Geography Standard (ASGS): Volume 5 - Remoteness Structure
: Volume 5 - Remoteness Structure") 1270.0.55.005 Australian Statistical Geography Standard (ASGS): Volume 5 - Remoteness Structure Maps Australia July 2011 Remoteness Area Boundaries 0 500 1000 New South Wales Remoteness Area boundaries
1270.0.55.005 Australian Statistical Geography Standard (ASGS): Volume 5 - Remoteness Structure Maps Australia July 2011 Remoteness Area Boundaries 0 500 1000 New South Wales Remoteness Area boundaries
ASCOT SUBURB PROFILE
 ASCOT SUBURB PROFILE CONTENTS SUBURB HIGHLIGHTS 2 3 4 4 5 5 ASCOT & SURROUNDS LOCATION & LIFESTYLE DEMOGRAPHICS EMPLOYMENT FUTURE INFRASTRUCTURE WA MARKET TRENDS ACCESSIBILITY ENTERTAINMENT & RECREATION
Not for broadcast or publication before 00:01 Hrs on Monday 18th April 2011
 Press Release Embargoed until: 00:01 18.04.11 Not for broadcast or publication before 00:01 Hrs on Monday 18th April 2011 The Halifax Rural Areas Quality of Life Survey tracks where living standards are
MINING IN TASMANIA: DINOSAUR OR DELIVERER?
 MINING IN TASMANIA: DINOSAUR OR DELIVERER? PRESENTATION TO A FORUM HOSTED BY THE ACADEMY OF TECHNOLOGICAL SCIENCES AND ENGINEERING (ATSE) FOR NATIONAL SCIENCE WEEK RACV APARTMENT HOTEL, HOBART 3 RD AUGUST
National Touring Survey Report
 Touring Survey NATIONAL TOURING SURVEY REPORT CONTENTS GO TO INTRODUCTION OVERVIEW... 3... 4 METHODOLOGY KEY FINDINGS... 4... 5 GALLERY DEMOGRAPHICS... 7... 9... 14... 15 EXHIBITION ACTIVITY ATTENDANCE
Life expectancy and potentially avoidable deaths in
 Life expectancy and potentially avoidable deaths in Published 30th November 2017 This report presents information on life expectancy at birth and potentially avoidable deaths in nationally and across Primary
Economic, social, and political geography. John Daley, CEO, Grattan Institute SGS Planning 8 September 2016
 Economic, social, and political geography John Daley, CEO, Grattan Institute SGS Planning 8 September 2016 People are consuming more services Share of total nominal household expenditure 80 60 Goods 40
Sunshine Coast Residential Market
 Sunshine Coast Residential Market Warwick Temby HIA Executive Director, QLD HOUSING INDUSTRY ASSOCIATION April 2010 Overview Look at international, national and local events that are shaping the outlook
Targa Tasmania 2018 Summary of road closures LEG ONE - MONDAY 16TH APRIL MUNICIPALITY OF WEST TAMAR
 Stage Name: HOLWELL Road closure time: 9:59-14:29 LEG ONE - MONDAY 16TH APRIL MUNICIPALITY OF WEST TAMAR Holwell Road Frankford Highway and Quigleys Road Stage Name: KAYENA Road closure time: 10:31-15:01
North Melbourne motorists face some of Australia s slowest commutes
 North Melbourne motorists face some of Australia s slowest commutes 24-month review of country s busiest routes show state of traffic congestion in major cities 2 August, 2011 - Motorists from the North
UNIVERSITY EDUCATION. A Comparative Analysis IN CAIRNS CUMMINGS ECONOMICS. 38 Grafton Street (PO Box 2148) CAIRNS QLD 4870
 CAIRNS QLD 4870") UNIVERSITY EDUCATION IN CAIRNS A Comparative Analysis CUMMINGS ECONOMICS 38 Grafton Street (PO Box 2148) CAIRNS QLD 4870 Contact: W S (Bill) Cummings B Econ T: 07 4031 2888 E: cummings@cummings.net.au
UNIVERSITY EDUCATION IN CAIRNS A Comparative Analysis CUMMINGS ECONOMICS 38 Grafton Street (PO Box 2148) CAIRNS QLD 4870 Contact: W S (Bill) Cummings B Econ T: 07 4031 2888 E: cummings@cummings.net.au
Nation-wide roll out of Energy Efficient Street Lighting. South West Group/WALGA Climate Change Forum September 2016
 Nation-wide roll out of Energy Efficient Street Lighting South West Group/WALGA Climate Change Forum September 2016 This is Ironbark Councils only Real Action only The Ironbark mission is to facilitate
RANZCOG CALENDAR 2018
 RANZCOG CALENDAR 2018 January 2018 Monday 1 January Tuesday 2 January Wednesday 3 January Wednesday 10 January Monday 15 January Monday 22 January Tuesday 23 January Friday 26 January Monday 29 January
Measuring the changing face of Global Sydney
 Measuring the changing face of Global Sydney Contents Global Migration Index P.1 Key findings P.2 Trends P.5 Future releases P.8 A Global Sydney Globalisation has brought society more closely together
Historical Disaster Statistics
 Historical Disaster Statistics Event NSW & VIC Flooding CAT 122 SW QLD Border Flooding CAT 121 24/2/12-16/03/12 24/01/12-15/02/12 NSW Riverina, NSW Central West and northern Victoria Cost NSW & VIC 108,212,000
CONNECTING OUR GREAT SMALL CITIES COVER PAGE. Intro paragraph SEPTEMBER 2017
 CONNECTING OUR GREAT SMALL CITIES COVER PAGE Intro paragraph SEPTEMBER 2017 UNDER STRICT EMBARGO UNTIL 5PM THURSDAY 1 SEPTEMBER 2017 3 REGIONAL CITIES DARWIN NT GEELONG VIC HOBART TAS The Regional Australia
Manly motorists face Australia s slowest commute
 Manly motorists face Australia s slowest commute Two year study finds Northern Beaches cars travel at just 18kph during peak times August 2, 2011 - Motorists from Manly face Australia s most arduous trip
CoreLogic Quarterly Rental Review
 CoreLogic Quarterly Rental Review December Quarter 2017 Rental rates are increasing as yield flatten out On a national basis, weekly rents increased by 0.1% in December 2017 to be 0.3% higher over the
Rebuilding NSW. Joint Community Consultation Submission
 Rebuilding NSW Joint Community Consultation Submission Content Introduction... 3 Background Information... 4 Consultation Major Themes... 4 Making Space for Larger & Growing Businesses... 4 Connectivity...
Medicare Local Offices at July 2013 Listed by State/Territory
 ACT ACT Medicare Local Unit 20, 41 Liardet Street Weston ACT PO Box 3571 Weston ACT 2611 Phone: 02 6287 8099 reception@actml.com.au www.actml.com.au NEW SOUTH WALES Central Coast NSW Medicare Local Suite
The Economic Impact of Tourism Brighton & Hove Prepared by: Tourism South East Research Unit 40 Chamberlayne Road Eastleigh Hampshire SO50 5JH
 The Economic Impact of Tourism Brighton & Hove 2014 Prepared by: Tourism South East Research Unit 40 Chamberlayne Road Eastleigh Hampshire SO50 5JH CONTENTS 1. Summary of Results 1 1.1 Introduction 1 1.2
November Creating liveable cities in Australia A scorecard and priority recommendations for Brisbane
 November 2018 Creating liveable cities in Australia A scorecard and priority recommendations for Brisbane What makes a liveable city? The term liveability is widely used in Australia and across the world,
DAVID SHELDON Chair Australian Regional Tourism Network (ARTN inc 2001)
") Collaboration between the Local Government s & the Australian Regional Tourism Network (ARTN) Local Government Spend on Tourism DAVID SHELDON Chair Australian Regional Tourism Network (ARTN inc 2001) The
Collaboration between the Local Government s & the Australian Regional Tourism Network (ARTN) Local Government Spend on Tourism DAVID SHELDON Chair Australian Regional Tourism Network (ARTN inc 2001) The
Queensland Economic Update. Are there more pots of gold ahead?
 Queensland Economic Update Are there more pots of gold ahead? Katie Dean Economist ANZ Bank 4 November 24 Australian economic growth has been strong and Queensland has been a star performer Economic growth