Ministry of Transportation Republic of Indonesia
|
|
|
- Martin Walton
- 6 years ago
- Views:
Transcription

 By")


1 Ministry of Transportation Republic of Indonesia IMPROVEMENT OF URBAN TRANSPORT SYSTEM IN GREATER JAKARTA INDONESIA (Planning and Development LRT and MRT) By Muiz Thohir Deputy Director for Program Evaluation, Greater Jakarta Transport Authority Presented at: Capacity Building Workshop on Sustainable Urban Transport Index Colombo, Srilanka October 2017

2 1 EXISTING CONDITION Greater Jakarta Transport Authority 2

3 GREATER JAKARTA (JABODETABEK) CHALLENGE : SPRAWL! Greater Jakarta includes 3 provinces and 8 municipalities Population: 31 million Greater Jakarta Transport Authority


 Private car: 5.")
 Buses : 512 thousand")


4 Proportion of Commuting Trip Number of Vehicle : 24.9 million 31,1% ,3% Motorcycle: 18.5 million units ( 74 % ) Private car: 5.9 million units ( 24 % ) Buses : 512 thousand units ( 2 % ) Trip = 47.5 million / day 30,6% Badan Greater Pengelola Jakarta Transportasi Authority Jabodetabek 4

5 O/D MATRIX 2015 ZONA Total ,514,137 36, , , , , , , , , , ,415 30,450 36,254 29,099 34,076 23,176 6,953, , ,004 10,158 52,377 4,540 3, ,153 4,408 3,078 5,821 18,862 2,087 2,040 8,320 2,089 2,269 2,118 1,078, ,636 10, ,522 29,263 4,713 3,481 15,666 54,366 4,871 5,091 7,397 2,437 3,496 1,990 1,284 1, , ,566 54,131 28, ,203 14,029 12, ,540 9,536 5,763 12,553 35,088 4,952 2,350 9,988 1,634 3,011 3,344 1,284, ,448 5,012 4,587 14,544 1,888,969 47,238 35,208 57, , ,605 35, ,936 5,811 8,880 9,639 15,830 10,490 2,897, ,253 4,263 4,251 13,192 40,561 1,459,584 42,972 10,361 9,992 68,088 64,726 6,450 3,099 11,244 3,983 9,939 10,847 1,950, , ,368 14, ,564 35,477 39,512 2,785,760 17,175 15,250 28, ,476 12,576 5,659 43,695 4,372 5,120 8,861 3,874, ,313 4,690 56,872 9,955 55,349 10,826 19,290 2,251, ,466 16,230 16,781 16,480 27,411 5,382 2,234 2,999 2,406 2,875, ,807 3,133 4,922 6, ,318 10,057 15, ,888 3,183,221 16,201 21,149 68, ,878 5,611 2,576 3,214 1,849 3,880, ,300 5,871 4,626 13, ,442 67,918 29,047 16,235 18,546 2,505,458 26,420 25,413 2,920 6,071 16,730 46,736 56,393 3,135, ,972 18,342 7,289 36,006 31,279 64, ,466 17,517 21,277 25,225 3,967,599 7,456 3, ,845 3,254 4,807 17,756 4,860, ,042 2,523 2,731 4, ,883 9,360 12,196 17,429 65,698 25,749 9,379 1,299,005 20,557 1,731 2,912 10,954 1,759 1,703, ,125 2,420 3,383 2,240 6,124 3,034 5,755 29, ,445 2,939 3,410 20,382 2,471,282 2,346 1,574 27,886 1,846 2,797, ,490 7,810 2,205 10,184 9,352 10,862 44,863 5,455 6,060 6, ,786 1, ,804, ,101 3,141, ,902 1,941 1,345 1,745 9,608 3,825 4,426 2,476 2,406 16,643 2,605 3, , , , ,981 1,337, ,901 2,488 1,408 2,818 15,453 10,512 4,784 3,368 3,776 47,482 4,985 11,058 28,083 1, ,946 1,885,981 73,508 2,302, ,827 2, ,852 10,160 10,709 8,054 2,183 2,062 54,642 17,844 1, , ,991 72,808 2,476,402 2,817,042 Total ,888,088 1,091, ,687 1,301,821 2,890,477 1,956,906 3,883,556 2,892,973 3,877,237 3,134,529 4,877,276 1,701,799 2,787,281 3,145,639 1,347,993 2,289,695 2,821,559 47,553,609 Total Trip in Jabodetabek 2015 : 47.5 million / day Greater Jakarta Transport Authority 5

, and predicted to be USD 6.")
6 Current Major Problems of Transport in Greater Jakarta (Jabodetabek) Worsening Traffic Jam Significantly decreased vehicle speed since 10 years ago In Jakarta, average speed at peak hour 10km/hour Volume Capacity Ratio (VCR) in metropolitan area exceeded 1 Economic losses due to traffic congestion up to USD 1.3 billion (2010), and predicted to be USD 6.5 billion in 2020; 6


7 2 KEY PERFORMANCE INDICATORS Greater Jakarta Transport Authority 7

8 KEY PERFORMANCE INDICATORS 1. Public transport share is 60 % 2. Maximum travel time from origin to destination is 1.5 hours at peak hours. 3. Minimum average speed is 30 km / h at peak hours. 4. Coverage of public transport services in urban areas is 80 % of the length of the road. 5. Maximum walking distance to public transport is 500 m. 6. Each region must have feeder line connected to the trunk line in transit point. 7. The transit must have facilities for pedestrians and car park and ride, with the maximum tranfer distance between mode is 500 m. Greater Jakarta Transport Authority 8


9 MAIN TARGET : INCREASE PUBLIC TRANSPORT SHARE + 16% + 10% + 10% Existing % 40% 50% 60% 3 years 5 years 5 years Greater Jakarta Transport Authority 9
10 3 THE WAY FORWARD Greater Jakarta Transport Authority 10
 R I T J 9 PILARS Greater Jakarta Transport Authority 11 SAFETY &")


11 MASTER PLAN OF GREATER JAKARTA TRANSPORTATION (RENCANA INDUK TRANSPORTASI JABODETABEK) R I T J 9 PILARS Greater Jakarta Transport Authority 11 SAFETY & SECURITY TRANSPORTATION GREEN NETWORK INFRASTRUCTURE TRANSPORTATION ROAD TRANSPORTATION SYSTEM RAIL TRANSPORTATION SYSTEM INTEGRATED TRANSPORTATION SYSTEM ENHANCING TRAFFIC PERFORMANCE FINANCING THE INTEGRATION OF TRANSPORTATION & LAND USE GREEN TRANSPORTATION PILAR 1 PILAR 2 PILAR 3 PILAR 4 PILAR 5 PILAR 6 PILAR 7 PILAR 8 PILAR 9

12

13 23/11/2017
14 23/11/2017 Existing Public Transport in GJTA Transport Mode Service Area Route Network Price Headway KRL (Commuter Line) Jabodetabek Six loop lines Subsidized-distance based fare 5-15 min Transjakarta (Bus Rapid Transit) Inner Jakarta 14 trunk corridors Subsidized-íntegrated price and network 5-20 min APTB (Feeder Transjakarta) Jabodetabek 24 main route Highly regulated market price 15 min- 1 hour Intermediate bus Inner Jakarta More than 20 Low regulated market price Random Angkot (mini bus) Jabodetabek More than 20 Low regulated market price Random Taxi Jabodetabek - Distance based fare - Jabodebatek Ressidence Connexion Jabodetabek Airport Connexion Jabodetabek More than 10 Market Price 15 min Jabodetabek More than 10 Markat Price 15 min
15 DEVELOPMENT OF PUBLIC TRANSPORT IN JABODETABEK 1. Commuter Line (CL), PT. KCJ (operated) 2. Bus Rapid Transit (BRT), PT. Transjakarta (operated) 3. Automatic People Mover system (APMS), Soekarno-Hatta Airport (operated) 4. LRT JABODEBEK, Ministry of Transportation /Adhi Karya 5. LRT JAKPRO, Jakarta Government / JAKPRO 6. Mass Rapid Transit (MRT), PT. MRT 7. Airport Railway (CL dan Ekspress), PT. KAI 8. Jakarta Bandung High-Speed Train (KCIC) 9. Light Rail Transit (LRT), Jababeka Greater Jakarta Transport Authority
 MOT/ PT.")

16 4 LIGHT RAPID TRANSIT (LRT) MOT/ PT. ADHI KARYA Greater Jakarta Transport Authority 16
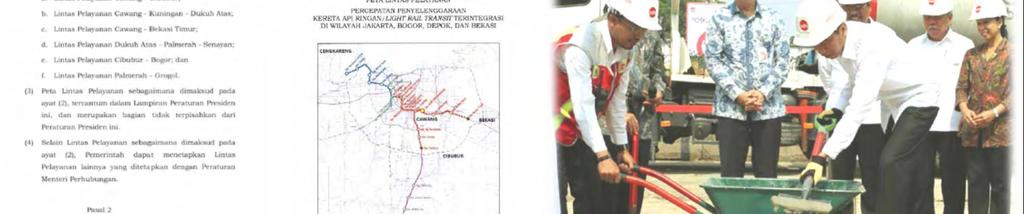
17 23/11/2017 PROJECT PROFILE BASED ON PRESIDENTIAL DECREE NO. 98/2015 PT. ADHI KARYA & PT. KERETA API INDONESIA ASSIGNED TO BUILD TOTAL COST 27 TRILYUN IDR 24 TRILIUN FOR INFRASTRUKTUR IDR 3 TRILIUN FOR TRAIN PT ADHI KARYA & PT. KAI BEAR BUDGET REQUIREMENT OF 9 TRILYUN AND THE REMAINING 18 TRILYUN BY THE BANKING SYNDICATION

18 23/11/2017

19 23/11/2017
20 23/11/2017


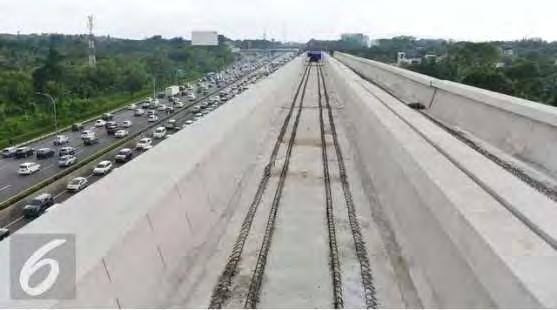
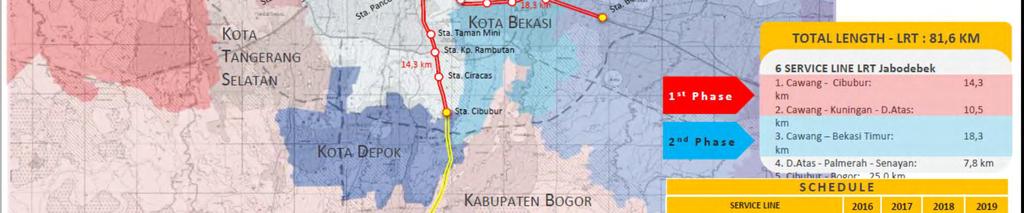
21 LENGTH OF TRACK 14,3 KM PROGRES ON AUSGUST % 23/11/2017
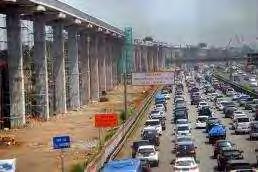
22 23/11/2017 LENGTH OF TRACK 18,3 KM PROGRES ON AUSGUST %


23 23/11/2017 LENGTH OF TRACK 10,5 KM PROGRES ON AUSGUST % Stasiun Cawang Pulau Intan PROSES PENGERJAAN AREA PEKERJAAN DEWI SARTIKA - KASN
24 Video Progres LRT MOT/ADHI KARYA 23/11/2017

25 5 LIGHT RAPID TRANSIT (LRT) JAKPRO Greater Jakarta Transport Authority 25
26 23/11/2017 PROJECT PROFILE BASED ON PRESIDENTIAL DECREE NO. 99/2015, JAKARTA GOVERNMENT TO ASSIGNED REGIONAL OWNED ENTERPRISES TO BUILD AND OPEARATE RAILWAY GOVERNOR DECREE NO. 213/2015 AND 211/2016 ASSIGN PT. JAKPRO TO DEVELOP LRT TOTAL COST 6,8 TRILYUN FROM LOCAL BUDGET (GOVERNMENT JAKARTA)

27 27 LEGAL BASIS LRT JAKARTA PerGub DKI Jakarta No. 213 Tahun 2015 sudah direvisi menjadi PerGub DKI Jakarta No. 211 Tahun 2016

")

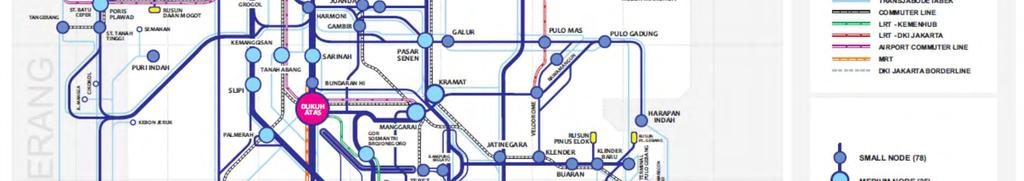
28 7 CORRIDOR LRT NETWORK IN JAKARTA Total length of track for Asian Games 2018: ± 5,8 km (including Depo) Number of station LRT: 6 Elevated Station Koridor 1 (Fase 1)


29 CORIDOR 1 (FASE 1) Kelapa Gading Mall Station Depot LRT Gading Nias Kelapa Gading Boulevard Station Pulomas Station Equestrian Station Velodrome Station

30 Penugasan PT JakPro 11 Sep '15 Launching Konstruksi 22 Jun '16 Konstruksi Skala Besar 15 Jan '17 Purchase Order (PO) Sarana 1 Feb '17 Today Asian Games Aug ' Pengadaan Konsultan 14 Sep - 2 Dec Pengawas 2.6 months Feasibility 3 Dec - 29 Feb Study 2.9 months Preliminary Design 5 months Pengadaan Kontraktor P101 Pelaksanaan P101 (Persiapan Konstruksi) Pengadaan Kontraktor P102 Pelaksanaan P102 (Konstruksi Prasarana) Pengadaan Kontraktor P103 Pelaksanaan P103 (Pabrikasi Sarana) Pre-Operational Plan dan Pembentukan Badan Usaha Sarana Prasarana Operational Plan 1 Mar - 31 Jul 5 Apr - 20 Jun 2.5 months 5.8 months Plan : 23,25% Actual : 23,67% Deviasi : +0,42% 4.2 months 20 Jun - 11 Dec 16 Aug - 20 Dec 23% 20.1 months 15 Dec - 1 Feb 1.5 months 16% 21 months 1 May '18 13 Aug '18 Soft Operation Delivery Sarana Pertama dan Testing & Commissioning 1 Nov '17 Pendirian PT LRT Jakarta dan Rekrutmen SDM Operasional 5 months 1 Jun - 31 Oct 9.5 months 20 Dec - 21 Aug 1 Nov - 13 Aug 1 Feb - 30 Oct
31 PROGRESS IMPLENTATION LRT JAKARTA Progress Summary : Plan Progress : 23.25% Actual Progress : 23.67% Deviation : +0.42% Update per tanggal 26 Mei 2017


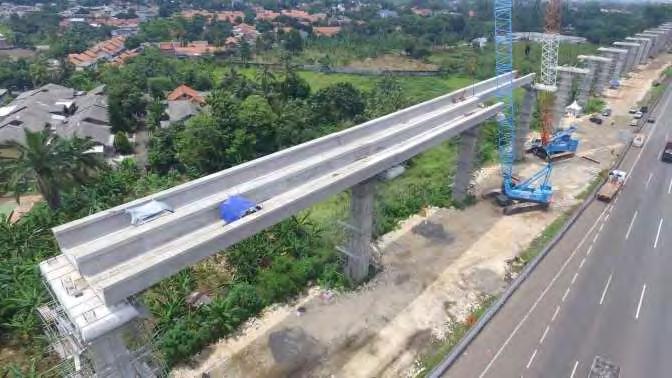
32 FOTO PERKEMBANGAN LAPANGAN LRT JAKARTA Progress Pembangunan Depo LRT Pekerjaan Konstruksi Pondasi Viaduct di Section 5B Pekerjaan Konstruksi Pondasi Viaduct di Section 5A Pekerjaan Konstruksi Pondasi Rencana Stasiun Mall Kelapa Gading 32


33 FOTO PERKEMBANGAN LAPANGAN LRT JAKARTA Viaduct Section 4 Viaduct Section 3 Stasiun Kelapa Gading Boulevard Stasiun Pulomas


34 FOTO PERKEMBANGAN LAPANGAN LRT JAKARTA Viaduct Section 2 Stasiun Pacuan Kuda Viaduct Section 1 Stasiun Velodrome


35 FOTO PERKEMBANGAN LAPANGAN LRT JAKARTA Pembesian Pier Head di pier 140 di section 5A Proses pembesian pilecap di P153L Pembuatan Lantai kerja di Ramp P12 area Depo Pembesian Box Pilecap di RPSS Di Depo


36 FOTO PERKEMBANGAN LAPANGAN LRT JAKARTA Seremoni Erection Box Girder at P68 Box Girder Erection di P68 Section 3 Girder Launcher di P68 Section 3 Loading Test Segment Box Girder at P68 Section 3

")


37 5 MASS RAPID TRANSIT (MRT) Greater Jakarta Transport Authority 37


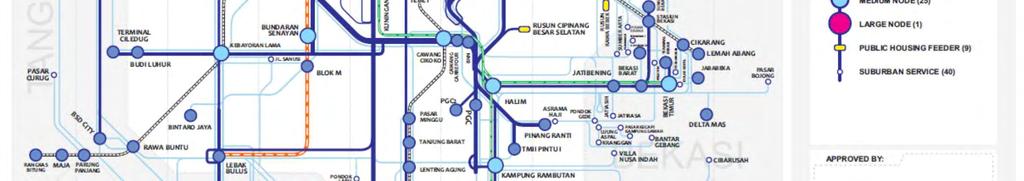
38 MRT NETWORK 23/11/2017
 1 set = 6 cars 1.")
 Communication- Based Train Control (CBTC) 123,368 juta = ± Rp 14,187 triliun Elevated Lane L : ± 10 KM")
39 Travel Time Lenght of track Distance between station ± 30 menit ± 16 km 0,8 2,2 km Headway 5 minutes (2019) Target Passenger Train Width track Electricity 173,400 pass/day 16 train set (96 cars) 1 set = 6 cars mm 60 MVA INFORMASI FITUR MRT JAKARTA FASE I SOUTH-NORTH CORRIODR (LEBAK BULUS BUNDARAN HI) Operation System Signailing System Total Cost Project (Fase I) Operational 2019 Automatic Train Operation (ATO) Communication- Based Train Control (CBTC) 123,368 juta = ± Rp 14,187 triliun Elevated Lane L : ± 10 KM Underground Lane L : ± 6 KM Jakarta Outer Ring Road (JORR) 13 Stasiun 7 Eleveted Station 6 Underground Station 39


40 FITUR MRT JAKARTA PHASE II SOUTH-NORTH (FASE II) & EAST - WEST Banten Kembangan Ancol Timur Ujung Menteng West Java South-North (Fase II) Corridor: Bundaran HI Ancol Timur Length of track: ± 13.5 Km Construction Method: Underground Number of Stations: 12 (including 1 Depo) (Start in 2018) Bundaran HI East West CoRridor: Cikarang Balaraja Length of track : ± 87 Km Number of Stations : 41 Lebak Bulus Fase I: Ujung Menteng Kembangan Length of track : ± 27 Km Construction Method : Underground and Eleveted Number of Stations : 22 (including 2 Depo) (Target konstruksi pada 2020) 40
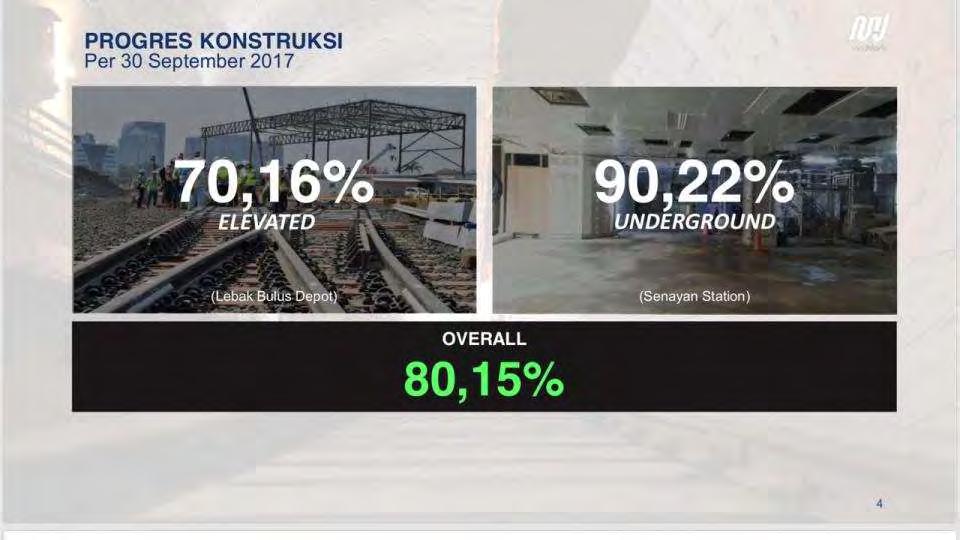
41 PROGRES CONSTRUCTION
42 VIDEO PROGRES MRT 23/11/2017

43 Thank You Terima kasih Greater Jakarta Transport Authority 43
IMPROVEMENT OF URBAN TRANSPORT SYSTEM IN GREATER JAKARTA (LRT and MRT Progress)
") IMPROVEMENT OF URBAN TRANSPORT SYSTEM IN GREATER JAKARTA (LRT and MRT Progress) Capacity Building Workshop on Sustainable Urban Transport Index Dhaka, Bangladesh September 12 13th 2018 GREATER JAKARTA
IMPROVEMENT OF URBAN TRANSPORT SYSTEM IN GREATER JAKARTA (LRT and MRT Progress) Capacity Building Workshop on Sustainable Urban Transport Index Dhaka, Bangladesh September 12 13th 2018 GREATER JAKARTA
January 2018 Air Traffic Activity Summary
 January 2018 Air Traffic Activity Summary Jan-2018 Jan-2017 CY-2018 CY-2017 Passengers 528,947 505,421 4.7% 528,947 505,421 4.7% Passengers 537,332 515,787 4.2% 537,332 515,787 4.2% Passengers 1,066,279
JAKARTA TRANSPORTATION
 Toward A Better TRANSPORTATION AGENCY DKI JAKARTA PROVINCIAL GOVERNMENT (INDONESIA) FERDINAND GINTING JAKARTA TRANSPORTATION Jakarta a Capital City, and many more roles! Capital City of Indonesia and Centre
Sustainable Urban Transport Development in Indonesia
 Sustainable Urban Transport Development in Indonesia Climate Action in Transport Conference 27 September 2018 Berlin 1 Indonesia Urban Potential Potential of Urban Comparison of World Urban Population
Transport and Climate Change Week: SUSTAINABLE URBAN TRANSPORT DEVELOPMENT IN INDONESIA
 Transport and Climate Change Week: SUSTAINABLE URBAN TRANSPORT DEVELOPMENT IN Ikhwan Hakim Director of Transportation Ministry of National Development Planning Indonesia Presented at Transport and Climate
An insider s look at the world s best infrastructure project: An interview with Mr. Dono Boestami, President Director of PT MRT Jakarta
 專題報導SPECIAL REPORT An insider s look at the world s best infrastructure project: An interview with Mr. Dono Boestami, President Director of PT MRT Jakarta Keywords: RAPID transit system, MRT Jakarta 台灣世曦工程顧問股份有限公司
Sound Transit Operations January 2017 Service Performance Report. Ridership. Total Boardings by Mode
 January 217 Service Performance Report Ridership ST Express Sounder Tacoma Link Link Paratransit Jan-16 Jan-17 % 1,433,7 1,3,33 4.9% 331,27 7,121 98,411 3,633 Total Boardings by Mode 363,6 74,823 1,76,914
Sound Transit Operations June 2016 Service Performance Report. Ridership
 Ridership Total Boardings by Mode Mode Jun-15 Jun-16 % YTD-15 YTD-16 % ST Express 1,622,222 1,617,420-0.3% 9,159,934 9,228,211 0.7% Sounder 323,747 361,919 11.8% 1,843,914 2,099,824 13.9% Tacoma Link 75,396
Sound Transit Operations August 2015 Service Performance Report. Ridership
 Ridership Total Boardings by Mode Mode Aug-14 Aug-15 % YTD-14 YTD-15 % ST Express 1,534,241 1,553,492 1.3% 11,742,839 12,354,957 5.2% Sounder 275,403 326,015 18.4% 2,139,086 2,463,422 15.2% Tacoma Link
Sound Transit Operations February 2018 Service Performance Report. Ridership
 February 218 Service Performance Report Ridership Total Boardings by Mode Feb-17 Feb-18 % YTD-17 YTD-18 % ST Express 1,373,96 1,372,88 -.1% 2,877,294 2,88,719.1% Sounder 314,96 32,187 11.9% 681,923 768,69
2017/ Q1 Performance Measures Report
 2017/2018 - Q1 Performance Measures Report Contents Ridership & Revenue... 1 Historical Revenue & Ridership... 1 Revenue Actual vs. Planned... 3 Mean Distance Between Failures... 5 Maintenance Cost Quarter
Sound Transit Operations March 2018 Service Performance Report. Ridership
 March 218 Service Performance Report Ridership Total Boardings by Mode Mar-17 Mar-18 % YTD-17 YTD-18 % ST Express 1,622,116 1,47,79-4.6% 4,499,798 4,428,14-1.6% Sounder 393,33 39,6.% 1,74,96 1,163,76 8.3%
Jakarta Investment Project Digest
 Jakarta Investment Digest 2017-2018 Table of Contents Jakarta Citizen Basic Needs (Primary) 1 3 4 5 JAKTOUR Hotel, Convention Center & Office Building (mix use) Pasar Jaya Distribution Channel (market)
Sound Transit Operations March 2017 Service Performance Report. Ridership. Total Boardings by Mode
 March 217 Service Performance Report Ridership ST Express Sounder Tacoma Link Link Paratransit Mar-16 Mar-17 % 1,83,4 1,621,49 2.4% 37,496 82,631 1,264,47 3,821 Total Boardings by Mode 389,98 87,39 1,89,43,297
Sound Transit Operations December 2014 Service Performance Report. Ridership
 Ridership Total Boardings by Mode Mode Dec-13 Dec-14 % YTD-13 YTD-14 % ST Express 1,266,130 1,396,787 10.3% 16,605,299 17,661,976 6.4% Sounder 248,710 285,016 14.6% 3,035,735 3,361,317 10.7% Tacoma Link
Sound Transit Operations January 2018 Service Performance Report. Ridership
 January 218 Service Performance Report Ridership Total Boardings by Mode Jan-17 Jan-18 % YTD-17 YTD-18 % ST Express 1,3,33 1,7,91.3% 1,3,33 1,7,91.3% Sounder 367,33 416,8 13.3% 367,33 416,8 13.3% Tacoma
Civil and Enviromental Engineering, Gadjah Mada University. PUBLIC TRANSPORT PLANNING (Frequency, Headway, and Number of Bus)
") Civil and Enviromental Engineering, Gadjah Mada University PUBLIC TRANSPORT PLANNING (Frequency, Headway, and Number of Bus) Introduction of Transport Planning Dr.Eng. Muhammad Zudhy Irawan, S.T., M.T.
Civil and Enviromental Engineering, Gadjah Mada University PUBLIC TRANSPORT PLANNING (Frequency, Headway, and Number of Bus) Introduction of Transport Planning Dr.Eng. Muhammad Zudhy Irawan, S.T., M.T.
KARAWANG NEW INDUSTRY CITY
 KARAWANG NEW INDUSTRY CITY INDONESIA, A REMARKABLE FUTURE INVESTMENT Indonesia is the place-to-be for domestic and international investors and companies as it offers vast opportunities for business and
Urban Transport in Metropolitan Areas (P095485)
") Public Disclosure Authorized LATIN AMERICA AND CARIBBEAN Argentina Transport & ICT Global Practice IBRD/IDA Adaptable Program Loan FY 2010 Seq No: 12 ARCHIVED on 09-May-2016 ISR22958 Implementing Agencies:
Public Disclosure Authorized LATIN AMERICA AND CARIBBEAN Argentina Transport & ICT Global Practice IBRD/IDA Adaptable Program Loan FY 2010 Seq No: 12 ARCHIVED on 09-May-2016 ISR22958 Implementing Agencies:
Auckland Transport Quarterly Indicators Report 2018/19
 Attachment 1 Auckland Transport ly Indicators Report 218/19 September 218 Table of Contents Page 2. 1. Executive summary 2. External indicators 3. Performance by Key Priority 3.1 Deliver an efficient and
Welcome. Green Line in Your Community
 Welcome Green Line in Your Community Today s session will provide you with information on options The City is exploring for connecting the Green Line in the Beltline to the future Inglewood/Ramsay station.
Manual vs. Automatic Operation and Operational Restrictions
 Customer Services, Operations, and Safety Committee Board Information Item IV-B March 11, 2010 Manual vs. Automatic Operation and Operational Restrictions Page 81 of 91 Washington Metropolitan Area Transit
Sound Transit Operations January 2014 Service Performance Report. Ridership
 Ridership Total Boardings by Mode Mode Jan-13 Jan-14 % YTD-13 YTD-14 % ST Express 1,343,290 1,426,928 6.2% 1,343,290 1,426,928 6.2% Sounder 245,135 256,775 4.7% 245,135 256,775 4.7% Tacoma Link 86,229
From personal to mass transit
 From personal to mass transit Prof. em. Ingmar Andreasson ingmar@logistikcentrum.se 40 years in transportation Transit network planning - VIPS Taxi fleet management - Taxi80 Multi-discipline PRT research
DISTRICT EXPRESS LANES ANNUAL REPORT FISCAL YEAR 2017 JULY 1, 2016 JUNE 30, FloridaExpressLanes.com
 DISTRICT EXPRESS LANES ANNUAL REPORT FISCAL YEAR 2017 JULY 1, 2016 JUNE 30, 2017 FloridaExpressLanes.com This page intentionally left blank. TABLE OF CONTENTS List of Figures... ii List of Tables.... ii
DTTAS Quarterly Aviation Statistics Snapshot Quarter Report
 Contents DTTAS Quarterly Aviation Statistics Snapshot Quarter 4 2015 Report 1.1 Dublin Airport Key Statistics... 1 1.2 Cork Airport Key Statistics... 3 1.3 Shannon Airport Key Statistics... 5 1.4 Total
DTTAS Quarterly Aviation Statistics Snapshot Quarter Report
 Contents DTTAS Quarterly Aviation Statistics Snapshot Quarter 1 2018 Report 1.1 Dublin Airport Key Statistics... 1 1.2 Cork Airport Key Statistics... 3 1.3 Shannon Airport Key Statistics... 5 1.4 Total
Khon Kaen Light Rail Transit
 Khon Kaen Light Rail Transit Key information Key players Parameters Service area Population Network Annual ridership Rolling stock Fare system Signalling technology Track and power Details Khon Kaen 1.8
Implementation Status & Results Colombia CO Integrated Mass Transit Systems (P082466)
") Public Disclosure Authorized Public Disclosure Authorized The World Bank Implementation Status & Results Colombia CO Integrated Mass Transit Systems (P082466) Operation Name: CO Integrated Mass Transit
Public Disclosure Authorized Public Disclosure Authorized The World Bank Implementation Status & Results Colombia CO Integrated Mass Transit Systems (P082466) Operation Name: CO Integrated Mass Transit
Managing And Understand The Impact Of Of The Air Air Traffic System: United Airline s Perspective
 Managing And Understand The Impact Of Of The Air Air Traffic System: United Airline s Perspective NEXTOR NEXTOR Moving Moving Metrics: Metrics: A Performance-Oriented View View of of the the Aviation Aviation
Board Box. October Item # Item Staff Page 1. Key Performance Indicators Sep 2018 M. Mungia Financial Report Aug 2018 H.
 Board Box October 2018 Item # Item Staff Page 1. Key Performance Indicators Sep 2018 M. Mungia 2-10 2. Financial Report Aug 2018 H. Rodriguez 11-15 ITEM 1 October 31, 2018 TO: FROM: RE: BOARD OF DIRECTORS
Hampton Roads Express Lane Network
 More Choices For Travelers Hampton Roads Express Lane Network James Utterback, PMP Hampton Roads District Administrator Presented to HRTPO Board July 20, 2017 Regional Express Lane Network 2 History of
Jeneberang River. Serial No. : Indonesia-10 Location: South Sulawesi Area: 727 km 2 Origin: Mt. Bawakaraeng (2,833 MSL) Outlet: Makassar Strait
 Outlet: Makassar Strait") Jeneberang River Map of River Table of Basic Data Name: Jeneberang River Serial No. : Indonesia-10 Location: South Sulawesi S 5 10' 00" - 5 26' 00" E 119 23' 50" - 119 56' 10" Area: 727 km 2 Origin: Mt.
Jeneberang River Map of River Table of Basic Data Name: Jeneberang River Serial No. : Indonesia-10 Location: South Sulawesi S 5 10' 00" - 5 26' 00" E 119 23' 50" - 119 56' 10" Area: 727 km 2 Origin: Mt.
Implementation Status & Results Colombia CO Integrated Mass Transit Systems (P082466)
") Public Disclosure Authorized Public Disclosure Authorized The World Bank Implementation Status & Results Colombia CO Integrated Mass Transit Systems (P082466) Operation Name: CO Integrated Mass Transit
Public Disclosure Authorized Public Disclosure Authorized The World Bank Implementation Status & Results Colombia CO Integrated Mass Transit Systems (P082466) Operation Name: CO Integrated Mass Transit
Monthly SunPass Transponder Sales Inception to June 2012
 Monthly SunPass Transponder Sales Inception to June 2012 This graph shows the monthly SunPass transponder sales since inception. The significant increase in transponder sales during March 2004 is attributed
Implementation Status & Results Colombia CO Integrated Mass Transit Systems (P082466)
") Public Disclosure Authorized Public Disclosure Authorized The World Bank Implementation Status & Results Colombia CO Integrated Mass Transit Systems (P082466) Operation Name: CO Integrated Mass Transit
Public Disclosure Authorized Public Disclosure Authorized The World Bank Implementation Status & Results Colombia CO Integrated Mass Transit Systems (P082466) Operation Name: CO Integrated Mass Transit
Analysts Briefing. 27 November Cathay Pacific Airways Limited
 Analysts Briefing 27 November 2015 Cathay Pacific Airways Limited Operating performance - overview Passenger load factors are high, driven by strong back-end demand. Passenger front-end yield and load
Statistics Report. April Page 1
 Statistics Report April 214 Page 1 TABLE OF CONTENTS PUBLIC TRANSPORT... 3 1. HIGHLIGHTS... 3 2. PUBLIC TRANSPORT PATRONAGE... 4 3. PUBLIC TRANSPORT SERVICE PERFORMANCE... 14 4. SPECIAL EVENT PUBLIC TRANSPORT
Network integration modelling of feeder and BRT(bus rapid transit) to reduce the usage of private vehicles in Palembang s suburban area
 to reduce the usage of private vehicles in Palembang s suburban area") IOP Conference Series: Earth and Environmental Science PAPER OPEN ACCESS Network integration modelling of feeder and BRT(bus rapid transit) to reduce the usage of private vehicles in Palembang s suburban
IOP Conference Series: Earth and Environmental Science PAPER OPEN ACCESS Network integration modelling of feeder and BRT(bus rapid transit) to reduce the usage of private vehicles in Palembang s suburban
2017/2018 Q3 Performance Measures Report. Revised March 22, 2018 Average Daily Boardings Comparison Chart, Page 11 Q3 Boardings figures revised
 2017/2018 Q3 Performance Measures Report Revised March 22, 2018 Average Daily Boardings Comparison Chart, Page 11 Q3 Boardings figures revised Contents Ridership & Revenue... 1 Historical Revenue & Ridership...
SYSTEM BRIEF DAILY SUMMARY
 SYSTEM BRIEF SUMMARY * ANNUAL (PEAK HOURS 7:00 AM TO 10:00 PM MON-SAT) MaxTemp NEL (MWH) Hr Ending Hr Ending LOAD ENERGY (MWH) INCREMENTAL COST DAY DATE Civic TOTAL MAXIMUM @Max MINIMUM @Min FACTOR ON
HOTEL INDUSTRY OVERVIEW. Texas
 HOTEL INDUSTRY OVERVIEW Texas DEMAND GROWTH STRONG BALANCED OCC & ADR GROWTH % Change Room Supply* 149M 1.3% Room Demand* 92M 5.6% Occupancy 61.6% 4.3% A.D.R. $90 4.4% RevPAR $55 8.9% Room Revenue* $8.3B
December 2013 Passenger and Cargo Traffic Statistics Reno-Tahoe International Airport
 December 2013 Passenger and Cargo Traffic Statistics Reno-Tahoe International Airport January 24, 2014 U.S. DOMESTIC INDUSTRY OVERVIEW FOR DECEMBER 2013 All RNO Carriers Domestic Systemwide year over year
Air China Limited Annual Results. March Under IFRS
 Air China Limited 21 Annual Results Under IFRS March 211 Agenda Part 1 Highlights Part 2 Business Overview Part 3 Financial Overview Part 4 Outlook 2 Part 1 Highlights Steady Economic Growth; Asia Pacific
Colindale Gardens Site Visit
 Colindale Gardens Site Visit 04 April 2017 Agenda Introduction John Tutte Group Chief Executive Colindale Gardens Overview Mark Parker Managing Director Tour of marketing suite Site visit 2 Introduction
Union Station Queens Quay Transit Link Study
 Welcome Union Station in 1899. Image: City of Toronto Archives Union Station today. Image: Camil Rosiak Activity along Queens Quay. Image: Waterfront Toronto For more information or to comment, visit toronto.ca/waterfronttransit
DTTAS Quarterly Aviation Statistics Snapshot Quarter Report
 Contents DTTAS Quarterly Aviation Statistics Snapshot Quarter 3 2018 Report 1.1 Dublin Airport Key Statistics... 1 1.2 Cork Airport Key Statistics... 3 1.3 Shannon Airport Key Statistics... 5 1.4 Total
INDONESIA TOURISM INVESTMENT INVITATION
 INDONESIA TOURISM INVESTMENT INVITATION An Invitation to Invest in Tourism Development in Jakarta Old Town, Special Capital Region of Jakarta, Republic of Indonesia Welcome to the Republic of Indonesia
Statistics of Air, Water, and Land Transport Statistics of Air, Water, and Land. Transport Released Date: August 2015
 Statistics of Air, Water, and Land Transport 2014 2013 1 Released Date: August 2015 Table of Contents Introduction... 4 Key Points... 5 1. Air Transport... 6 1.1 Aircraft movements... 6 1.2 Number of passengers...
RIDERSHIP TRENDS. October 2017
 RIDERSHIP TRENDS October 2017 Prepared by the Division of Strategic Capital Planning December 2017 Table of Contents Executive Summary...1 Ridership...3 Estimated Passenger Trips by Line...3 Estimated
Cathay Pacific Airways Analyst Briefing. 21 November 2014
 Cathay Pacific Airways Analyst Briefing 21 November 2014 Operating Performance Passenger demand remains strong, although growth in North America is significantly short of increase in capacity. Demand for
Analysts Briefing. 24 June Cathay Pacific Airways Limited
 Analysts Briefing 24 June 2016 Cathay Pacific Airways Limited Operating performance - overview Challenging business environment. Load factor lower than expectations on weakening passenger demand. Strong
Tourism Snapshot A focus on the markets in which the CTC and its partners are active
 Tourism Snapshot A focus on the markets in which the CTC and its partners are active www.canada.travel/corporate January 214 Volume 1, Issue 1 Key highlights Total arrivals from CTC s international markets
RIDERSHIP TRENDS. January 2018
 RIDERSHIP TRENDS January 2018 Prepared by the Division of Strategic Capital Planning March 2018 Table of Contents Executive Summary...1 Ridership...3 Estimated Passenger Trips by Line...3 Estimated Passenger
FLL Master Plan Update BOARD OF COUNTY COMMISSIONERS BRIEFING
 (PRELIMINARY DRAFT) WORK IN PROGRESS - FOR DISCUSSION PURPOSES ONLY FLL Master Plan Update BOARD OF COUNTY COMMISSIONERS BRIEFING May 15, 2018 Master Plan Schedule Overview Progress Since Last Master Plan
#1. Why is the City doing this project?
 Community Workshop #2 January 2016 #1. Why is the City doing this project? Broadway and Lincoln are in constant change Broadway and Lincoln are in constant change Broadway and Lincoln are in constant change
Air China Limited 2014 Annual Results Under IFRS
 Air China Limited 2014 Annual Results Under IFRS March 2015 Agenda Part 1 Results Highlights Part 2 Business Overview Part 3 Financial Overview Part 4 Outlook Part 1 Results Highlights Gradual Global Economic
PERFORMANCE REPORT NOVEMBER 2017
 PERFORMANCE REPORT NOVEMBER 2017 Note: New FY2018 Goal/Target/Min or Max incorporated in the Fixed Route and Connection Dashboards. Keith A. Clinkscale Performance Manager INTRODUCTION/BACKGROUND In June
Domestic Visitation to the Northern Territory
 \ YEAR ENDING SEPTEMBER Domestic Visitation to the Northern Territory 20 Year ending September 20 YEAR ENDING SEPTEMBER 20 DOMESTIC OVERNIGHT VISITORS IN THE NORTHERN TERRITORY VISITORS 1.55 MILLION NIGHTS
Post tsunami Recovery of Port and Harbor areas in Japan from the 2011 Great East Japan Earthquake Tsunami
 Date : 18 Nov., 2015 Venue : Furama Ballroom 1 SESSION 1 : A Decade of Partnerships in Sustainable Development of the Seas of East Asia: Synergies and Achievements WORKSHOP 1.1 : Managing Risks in Climate
PERFORMANCE REPORT DECEMBER Performance Management Office
 PERFORMANCE REPORT DECEMBER 2018 Performance Management Office INTRODUCTION/BACKGROUND Performance Management Office FIXED ROUTE DASHBOARD FY 2019 Safety Max Target Goal Preventable Collisions per 100k
With the completion of this project, we would like to follow-up on the projections as well as highlight a few other items:
 TO: FROM: Mayor and Council Interim City Manager Rebecca Underhill, Director of Finance DATE: February 28, 2014 SUBJECT: Water Meter Project Analysis On March 28, 2012, Acting City Manager Mike Loftin
Statistics Report. May Page 1
 Statistics Report May 214 Page 1 TABLE OF CONTENTS PUBLIC TRANSPORT... 3 1. HIGHLIGHTS... 3 2. PUBLIC TRANSPORT PATRONAGE... 4 3. PUBLIC TRANSPORT SERVICE PERFORMANCE... 14 4. SPECIAL EVENT PUBLIC TRANSPORT
SIA GROUP FINANCIAL RESULTS
 FINANCIAL RESULTS For Ended 30 June 2018 197200078R Operating Result Q1 Q1 Better/ FY18/19 FY17/18 R1 (Worse) ($M) ($M) (%) Total Revenue 3,844 3,864 (0.5) Q1 Better/ FY17/18 R2 (Worse) ($M) (%) 3,689
The number of passengers using city transport increases 2.2% in December as compared with the same month of the previous year
 9 February 2009 Passenger Transport Statistics December 2008. Provisional data The number of passengers using city transport increases 2.2% in December as compared with the same month of the previous year
METRO OPERATIONS COMMITTEE
 Los Angeles County Metropolitan Transportation Authority Item 1 CHIEF OPERATIONS OFFICER S S REPORT METRO OPERATIONS COMMITTEE Lonnie Mitchell Chief Operations Officer May 19, 20 1 Employee Recognition
December 2011 Passenger and Cargo Traffic Statistics Reno-Tahoe International Airport
 December 2011 Passenger and Cargo Traffic Statistics Reno-Tahoe International Airport January 27, 2012 U.S. DOMESTIC INDUSTRY OVERVIEW FOR DECEMBER 2011 All RNO Carriers Systemwide year over year comparison
Keflavik International Airport Passenger forecast 2018
 Keflavik International Airport Passenger forecast 2018 2 Keflavik International Airport Passenger forecast Keflavik International Airport 2018 3 Passenger Forecast 2018 Forecast 2018 6,409,312 3,971,969
Bus Reliability and Punctuality Performance
 Bus Reliability and Punctuality Performance Recommendation(s) That the Board: Board Meeting 26 August 2014 i. Notes the changes to the reporting of bus reliability and punctuality. As at July 2014 the
PERFORMANCE REPORT DECEMBER 2017
 PERFORMANCE REPORT DECEMBER 2017 Note: New FY2018 Goal/Target/Min or Max incorporated in the Fixed Route and Connection Dashboards. Keith A. Clinkscale Performance Manager INTRODUCTION/BACKGROUND Keith
VCTC Transit Ridership and Performance Measures Quarterly Report
 VCTC Transit Ridership and Performance Measures Quarterly Report Overview Quarter 2 Fiscal Year 2018-2019 This report provides performance measures for VCTC Intercity Bus Service covering the FY 2018-19
UN ESCAP. Regional Meeting on Cooperation of International Railway Transport. Bangkok, October Laos Country Paper
 UN ESCAP Regional Meeting on Cooperation of International Railway Transport Bangkok, 13-15 October 2014 Laos Country Paper Ministry of Public Works and Transport Department of Railways 1 1. Introduction
METRO Orange Line Update Metro Transit, BRT/Small Starts Projects Christina Morrison & Natalie Westberg Transportation Committee July 10, 2017
 METRO Orange Line Update Metro Transit, BRT/Small Starts Projects Christina Morrison & Natalie Westberg Transportation Committee July 10, 2017 Orange Line BRT Project What is the Orange Line project? 17-mile
PLAN MAESTRO DE TRANSPORTE SOSTENIBLE EN GUATEMALA
 PLAN MAESTRO DE TRANSPORTE SOSTENIBLE EN GUATEMALA 18 de Octubre, Club Alemánd Dr. Niklas Sieber Transport Economist Regional Planner www.niklas-sieber.de Plan Maestro de Transporte 2 Agenda 1. Transport
Implementation Status & Results Mexico MX Urban Transport Transformation Progr (P107159)
") losure Authorized Public Disclosure Authorized Public Disclosure Authorized Public Disclosure Authorized Implementation Status & Results Mexico MX Urban Transport Transformation Progr (P107159) Operation
losure Authorized Public Disclosure Authorized Public Disclosure Authorized Public Disclosure Authorized Implementation Status & Results Mexico MX Urban Transport Transformation Progr (P107159) Operation
Date: 11/6/15. Total Passengers
 Total San Diego Metropolitan Transit System POLICY 42 PERFORMANCE MONITORING REPORT Page 1 of 6 OBJECTIVE Develop a Customer-Focused and Competitive System The following measures of productivity and service
March 2014 Passenger and Cargo Traffic Statistics Reno-Tahoe International Airport
 March 2014 Passenger and Cargo Traffic Statistics Reno-Tahoe International Airport April 25, 2014 U.S. DOMESTIC INDUSTRY OVERVIEW FOR MARCH 2014 All RNO Carriers Domestic Systemwide year over year comparison
Urban Transport in Metropolitan Areas (P095485)
") Public Disclosure Authorized LATIN AMERICA AND CARIBBEAN Argentina Transport & Digital Development Global Practice IBRD/IDA Investment Project Financing FY 2010 Seq No: 15 ARCHIVED on 26-Jan-2018 ISR31117
Public Disclosure Authorized LATIN AMERICA AND CARIBBEAN Argentina Transport & Digital Development Global Practice IBRD/IDA Investment Project Financing FY 2010 Seq No: 15 ARCHIVED on 26-Jan-2018 ISR31117
CITY OF VAUGHAN EXTRACT FROM COUNCIL MEETING MINUTES OF JANUARY 25, 2011
 Item 1, Report No. 1, of the Priorities and Key Initiatives Committee, which was adopted without amendment by the Council of the City of Vaughan on January 25,. 1 RAPID TRANSIT UPDATE TORONTO-YORK SPADINA
Passenger and Cargo Statistics Report
 Passenger and Cargo Statistics Report Reno-Tahoe International Airport December 2014 U.S. DOMESTIC INDUSTRY OVERVIEW FOR DECEMBER 2014 All RNO Carriers Domestic Systemwide year over year comparison Average
Appendix 4.1 J. May 17, 2010 Memorandum from CTPS to the Inter Agency Coordinating Group
 Appendix 4.1 J May 17, 2010 Memorandum from CTPS to the Inter Agency Coordinating Group CTPS CENTRAL TRANSPORTATION PLANNING STAFF Staff to the Boston Region Metropolitan Planning Organization MEMORANDUM
Public transport strategy
 Public transport strategy Public and private sector bus efficiency in Delhi Measure DTC Private Peak period fleet utilisation (%) 83% 93% Km/bus/day 216 246 Pax/bus/day 751 1584 Staff/bus 9.6 4.6 Forms
January 2014 Passenger and Cargo Traffic Statistics Reno-Tahoe International Airport
 January 2014 Passenger and Cargo Traffic Statistics Reno-Tahoe International Airport March 12, 2014 U.S. DOMESTIC INDUSTRY OVERVIEW FOR DECEMBER 2013 All RNO Carriers Domestic Systemwide year over year
FY2015 2nd Quarter Business Results
 FY2015 2nd Quarter Business Results Project AH A MAY products Yamaha Corporation and Yamaha Motor Co., Ltd. make products by exchanging the design divisions and their design fields, and present a joint
InterContinental Brand Simon Scoot -Vice President InterContinental Brand Management. June 2010
 InterContinental Brand Simon Scoot -Vice President InterContinental Brand Management June 2010 1 Video Brand History 2 InterContinental: leading global network Americas: System = 55 hotels Pipeline = 6
Statistics Report. June Page 1
 Statistics Report June 214 Page 1 TABLE OF CONTENTS PUBLIC TRANSPORT... 3 1. HIGHLIGHTS... 3 2. PUBLIC TRANSPORT PATRONAGE... 4 3. PUBLIC TRANSPORT SERVICE PERFORMANCE... 14 4. SPECIAL EVENT PUBLIC TRANSPORT
Third Quarter Marketing Report B R A N SON/LAKES A R EA C VB N OVEMBER, 2013
 Third Quarter Marketing Report B R A N SON/LAKES A R EA C VB N OVEMBER, 2013 Economic Outlook +5.1% from July 2011 Consumer Confidence is Up 7% This Year Increasing from 66.7 in Dec to 71.2 Today +6.7%
Corporate Presentation
 Jakarta, 2 November 2018 Corporate Presentation Q3/2018 - Corporate Performance Shares Information 6,800 GIAA IJ Equity - Last Price (R1) JCI Index - Last Price (L1) 206 5,976.553 450 6,600 6,400 400 6,200
Rotorua. newzealand.com. argentina. Market information about our Visitors and our Active Considerers
 Rotorua argentina Market information about our Visitors and our Active Considerers newzealand.com PAST VISITORS HISTORIC VIEW TOTAL ARRIVALS YE MARCH 2018 AUS 1,495K 39% INDIA 63K 2% USA 340K 9% GERMAN
Tourism Snapshot A focus on the markets in which the CTC and its partners are active
 Tourism Snapshot A focus on the markets in which the CTC and its partners are active www.canada.travel/corporate June Volume 1, Issue 6 Key highlights CTC s overseas markets leaped 1% over the same month
Planning for RAV: Lon LaClaire, Transportation Engineer Anita Molaro, Development Planner CITY OF VANCOUVER
 Planning for RAV: Achieving Public Objectives in the Context of a PPP Project Lon LaClaire, Transportation Engineer Anita Molaro, Development Planner Presentation Outline Vancouver and the Region The RAV
Indonesia Priority Sector: Tourism
 Indonesia Priority Sector: Tourism Yogyakarta, 14 March 2018 Dr. Ir. Arief Yahya, M.Sc. Tourism Minister, Republic of Indonesia 2 Why you should invest in tourism sector? Indonesia is in top-20 fastest
August 2014 Passenger and Cargo Traffic Statistics Reno-Tahoe International Airport
 August 2014 Passenger and Cargo Traffic Statistics Reno-Tahoe International Airport October 8, 2014 U.S. DOMESTIC INDUSTRY OVERVIEW FOR AUGUST 2014 All RNO Carriers Domestic Systemwide year over year comparison
PRELIMINARY ACCOUNTS FOR 2012
 INTERIM REPORT FOR Q4 2012 AND INTERIM REPORT FOR Q4 2012 AND PRELIMINARY ACCOUNTS FOR 2012 HIGHLIGHTS Q4 with growth in volume and improved normalized EBITDA MNOK 261 improvement in normalized EBITDA
December 2012 Passenger and Cargo Traffic Statistics Reno-Tahoe International Airport
 December 2012 Passenger and Cargo Traffic Statistics Reno-Tahoe International Airport January 29, 2013 U.S. DOMESTIC INDUSTRY OVERVIEW FOR DECEMBER 2012 All RNO Carriers Systemwide year over year comparison
Existing Services, Ridership, and Standards Report. June 2018
 Existing Services, Ridership, and Standards Report June 2018 Prepared for: Prepared by: Contents Overview of Existing Conditions... 1 Fixed Route Service... 1 Mobility Bus... 34 Market Analysis... 41 Identification/Description
Att. A, AI 46, 11/9/17
 Total s San Diego Metropolitan Transit System POLICY 42 PERFORMANCE MONITORING REPORT Page 1 of 6 Date: 11/8/17 OBJECTIVE Develop a Customer-Focused and Competitive System The following measures of productivity
Tourism Snapshot. June 2015 Volume 11, Issue 6. A focus on the markets in which Destination Canada (DC) and its partners are active.
 and its partners are active.") Tourism Snapshot Tourism PEI / Paul Baglole A focus on the markets in which Destination Canada (DC) and its partners are active. www.destinationcanada.com June Volume 11, Issue 6 Key highlights Over the
Tourism Snapshot Tourism PEI / Paul Baglole A focus on the markets in which Destination Canada (DC) and its partners are active. www.destinationcanada.com June Volume 11, Issue 6 Key highlights Over the
Resume Of Mr. Hendrikus Eko Yulianto
 02 May 2018 Resume Of Mr. Hendrikus Eko Yulianto Personal Details Gender: Male Age : 48 Date of Birth : 14 July 1969 Nationality : Indonesian Ethnicity : Javanese Marital Status : Married Religion : Rome
Hotel Sector JAKARTA HOTEL. Hotel Supply. Colliers Quarterly Q October Forecast at a glance. Star-rated Hotel
 Colliers Quarterly Q3 3 October JAKARTA HOTEL Accelerating success Hotel Sector Ferry Salanto Senior Associate Director Research Hotel occupancy performance in the third quarter of the year was the best