Regional Land Transport Plan JUNE 2016
|
|
|
- Katherine Casey
- 6 years ago
- Views:
Transcription


1 Regional Land Transport Plan JUNE 2016

2 FOREWORD Canterbury s transport network has been built over generations. Today it provides us with access to economic and social opportunities; however, change is constant and economic growth and our changing population demand ongoing investment to meet the future transport needs of the region. Safety, resilience and the long-term sustainability of our transport choices must also be addressed. These issues are and will remain a key part of providing for the future. This Plan, prepared by the Regional Transport Committee (RTC), outlines the current state of our regional transport network and the challenges we face now and in the future. The priorities reflect the context of regional, national and international events and trends. The programmes and projects in it are the regional responses to these challenges and include actions for Canterbury s regional and district councils and the New Zealand Transport Agency (NZTA). Rex Williams Chairman, Canterbury Regional Transport Committee 2 Canterbury Regional Land Transport Plan
3 CONTENTS FOREWORD IC INTRODUCTION 2 STRATEGIC CONTEXT 4 ISSUES AND CHALLENGES 14 STRATEGIC RESPONSE 22 OBJECTIVES AND POLICIES 23 STATEMENT OF PRIORITIES FOR 2015 TO EXPENDITURE AND REVENUE FORECASTS 37 MONITORING AND PERFORMANCE INDICATORS 41 APPENDICES 43 Appendix 1: Regional programme details 43 Appendix 2: Significance policy 50 Appendix 3: Assessment of compliance with LTMA section Appendix 4: Assessment of the relationship of Police activities to the RLTP 51 Appendix 5: Summary of consultation 52 Appendix 6: Legislative requirements 52 Appendix 7: Glossary 66 FIGURES AND TABLES Figure 1: The Canterbury region and key transport routes 7 Figure 2: Population age structure, Canterbury regional council area 11 Table 1: Priority 1 expenditure 27 Figure 3: Christchurch RONS programme 30 Table 2: Priority 2 expenditure 31 Table 3: Priority 3 projects 33 Figure 4: Expenditure by approved organisation 37 Figure 5: Expenditure by activity class 37 Table 5: Ten-year expenditure by organisation and activity 38 Table 6: Ten-year expenditure from National Land Transport Fund 39 Table 7: Outcomes and performance measures 41 Table 8: Project information by approved authority 43 Canterbury Regional Land Transport Plan
4 INTRODUCTION This Regional Land Transport Plan, known as the RLTP, has been prepared by the Canterbury Regional Transport Committee (RTC), a joint committee of the region s councils as well as the New Zealand Transport Agency (NZTA)1. The Committee is convened every three years by the regional council following local body elections, and has a membership and role prescribed by the Land Transport Management Act Developing the RLTP is the primary role of the Committee and is a requirement of each region of New Zealand. It is part of the nationwide process in which local and regional councils work together to apply for, and receive, government investment in their land transport activities2 for the coming three year period. RLTP s also include planned expenditure by the NZTA on any State Highways that run through a region. The Committee s membership represents only a fraction of all the transport providers that collectively deliver transport. Road hauliers, KiwiRail, maritime operators, the ports and airports all move significant volumes of people and freight every day yet they have no role in the Committee. There is also a broader group of associated providers, such as public transport operators, taxi companies and parking building providers that also play a significant role in transport provision. Therefore, improving communication and collaboration across the sector to enhance co-ordination and integrated decision-making will be a key focus for the Committee in the coming years. Section 2 of this document presents the strategic context for the Canterbury transport system. This sets out the trends and drivers in the transport sector now and into the future. Section 3 then presents current and future issues that are anticipated as a result of the strategic drivers, and the associated challenges these raise for transport providers. Section 4 sets out the response the Committee plans to make, in response to these drivers, issues and challenges. The strategic response is not a detailed list of all the activities planned, but rather a description of the overall response the Committee feel is necessary to meet the region s needs into the future. Sections 2 to 4 represent a variation made to the RLTP in May 2016 to align it with the Canterbury Regional Economic Development Strategy3 published in August 2015, as well as broader sector consensus on the need to plan in a more holistic and coordinated way that best serves the wellbeing of Canterbury and its broader contribution to the nation. It is intended that the objectives and policies section, and the rest of the Plan, will be reviewed through 2016 and 2017 so that any changes to activities can be made as part of the formal review required during the six months prior to the end of the 2017/18 financial year4. Prior to a recent change in legislation, the Canterbury Regional Land Transport Strategy set out a vision for the Canterbury transport system. The strategy involved extensive public consultation across the region over an 18 month period and was re-tested in the post-earthquake environment to ensure it remained valid. Accordingly, the Regional Transport Committee remains committed to the vision that: Canterbury has an accessible, affordable, integrated, safe, resilient and sustainable transport system. This vision remains the over-arching goal for the Committee and will guide future relationships across the sector, as well as future planning and investment. To help achieve this vision, the RLTP sets the direction for the Canterbury transport system for the next 30 years. Accordingly, this plan: y outlines the economic, social and spatial context in which the transport system operates; y identifies regional transport issues and challenges anticipated over time; y describes how these challenges will be met; achieving the vision and objectives through policies, measures and investment priorities over time; y includes a regional programme of proposed land transport activities for the next 6 years (2015/ /21) and prioritises significant new improvement activities; and y provides a ten year financial forecast of anticipated investment and revenue for the region s land transport activities. 1 The Canterbury Regional Transport Committee has also co-opted specialist advisors to represent public health, economic development, safety and environmental sustainability interests. 2 These activities can include the planning and delivery of new roads, road maintenance, cycle facilities, public transport facilities and services and so on. Typically government meets 50% - 60% of the total cost of agreed council land transport activities, depending on the council, and using an agreed methodology to establish a Funding Assistance Rate (FAR). The FAR for State Highway activities is 100%. 3 See 4 See section 18CA of the Land Transport Management Act Canterbury Regional Land Transport Plan

5 This RLTP will enable a more comprehensive and integrated approach to meeting regional transport challenges by laying the foundations for a more collaborative planning and investment environment that involves all transport providers. It also supports moves to advocate for legislative and policy change where the Committee feel it is needed, as well as secure investment for the region s transport system to ensure Canterbury maximises its potential and contribution to national wellbeing. Canterbury Regional Land Transport Plan

6 STRATEGIC CONTEXT This section describes the key features of the Canterbury situation relevant to the future planning of our transport system. It includes an explanation of our diverse rural and urban populations and economic structure, and our current transport system. This section also describes our relationships to the rest of New Zealand and to the rest of the world. OUR REGION Our people The Canterbury region is New Zealand s largest by area, second largest by population, home to 562,900 people5 and the most populous in the south island. Christchurch is located centrally in the region and at the 2013 census was New Zealand s second largest city. The greater Christchurch area is the main population centre. The Canterbury region is composed of nine territorial local authorities6: y Kaikōura District (population 3,640, 0.6% of Canterbury) y Hurunui District (12,000, 2.1%) y Waimakariri District (52,300, 9.3%) y Christchurch City (356,700, 63.6%) y Selwyn District (46,700, 8.3%) y Ashburton District (32,300, 5.8%) y Timaru District (45,400, 8.1%) y Mackenzie District (4,300, 0.8%) y Waimate District (7,810, 1.4%) The total population of the Canterbury regional council area is projected to grow, on average, by 0.9 % a year between 2013 and 2043, slightly higher than the average national growth rate of 0.8 % a year. But only three territorial authorities within the region will meet or exceed the national growth rate: Selwyn district (2.2 %), Waimakariri district (1.3 %) and Ashburton district (0.9 %). In the remaining six areas, average annual population growth rates are projected to be between zero and 0.7 %. On this projection, Canterbury s population will increase from around 560,000 to 730,000 between 2013 and 2043, with nearly half of that growth occurring between 2013 and Canterbury s population growth contributes 14 per cent of the national growth rate. Canterbury is projected to continue to be New Zealand s second most populous region (after Auckland), hosting 13 per cent of New Zealand s total population. Our economy MACKENZIE DISTRICT 4,300 (0.8%) ASHBURTON DISTRICT 32,300 (5.8%) SELWYN DISTRICT 46,700 (8.3%) HURUNUI DISTRICT 12,000 (2.1%) WAIMATE DISTRICT 7,810 (1.4%) TIMARU DISTRICT 45,400 (8.1%) KAIKŌURA DISTRICT 3,640 (0.6%) WAIMAKARIRI DISTRICT 52,300 (9.3%) CHRISTCHURCH CITY 356,700 (63.6%) Canterbury s economy expanded more than any other region (30.9%) between 2009 and This was partially due to strong construction and recovery activity following a series of major earthquakes in 2010 and This compares to 22.4% growth over the same period for New Zealand as a whole. In 2014, Canterbury contributed 13.1% of national Gross Domestic Product (GDP) and had the second-largest GDP increase by region after Auckland (10.6%, compared to 6.7% for New Zealand overall). In per capita terms, GDP is currently $53,054 per year in Canterbury, compared to $48,944 per year for the rest of New Zealand7. The earthquake rebuild is currently a major driver of economic activity in Canterbury. However the underlying economy, which is not temporary in nature, has been growing, with some sectors outside of construction performing well despite the earthquake disruptions. 5 Statistics New Zealand 30 June 2013 population estimate. 6 Whilst the portion of Waitaki District north of the Waitaki River lies in Canterbury, for the purposes of transport planning, Waitaki District is considered part of the Otago region. 7 Source: Statistics New Zealand, 2014 figures. 4 Canterbury Regional Land Transport Plan
7 Between 2008 and 2012 the surrounding area s agricultural economy s real GDP grew by 30% (from $758m to $983m) driven by increased contributions from Ashburton, Selwyn, Hurunui, Timaru and Waimate districts. Dairy volume expansion over the decade to 2010 was worth $590 per person in the Canterbury region compared to $270 in Waikato. The estimated net farm gate contribution of irrigation on Canterbury s GDP increased from $335m in 2003 to $1,394m in 2012, driven by expansion in areas with access to irrigation from 287,000 to 444,777 hectares and an increase from gross margins per hectare associated with access to irrigation. Manufacturing is also a key component of the Canterbury economy, particularly transport and machinery equipment, food and beverage. Christchurch is the manufacturing hub, with particular strengths in machinery and equipment manufacturing and chemical, minerals and metal manufacturing. Tourism is another key aspect of the Canterbury economy and provides a pivotal role in the wider tourism offering of the south island. Airfares and international tourist spend now outstrips dairying as New Zealand s prime source of export earnings, quoted in Statistics New Zealand data as $13.5 billion8. In Canterbury, whilst the Christchurch industry continues to rebuild following the earthquakes, the remainder of the region has performed strongly and emphasises the need for good transport links between Christchurch and other key tourism destinations across Canterbury and in neighbouring regions. Transport plays a key role as enabler for each sector of the regional economy. Efficient and effective transport for the movement of inputs and outputs of these sectors, as well as for service industries and employees, plays a critical role in economic productivity, keeping costs down and contributing to international competitiveness. This is crucial for New Zealand as a trading nation some distance from our main markets. OUR TRANSPORT SYSTEM Land Canterbury is well serviced by 14,220 km of council owned and operated local roads established over generations by local authorities to provide access to rural land, visitor destinations and small and large settlements. These networks are a mix of unsealed and sealed roads, mainly with two lanes but in busier urban centres like Christchurch, Ashburton and Timaru, four lane roads to manage volumes efficiently and safely. AREA GDP % SHARE OF REGIONAL POPULATION 2008 $758 M 2012 $983 M The area s agricultural economy s real GDP grew by 30% driven by increased contributions from Ashburton, Selwyn, Hurunui, Timaru and Waimate districts % SHARE OF REGIONAL ROAD NETWORK BY LENGTH Kaikōura % 0.10 Hurunui % 0.17 Waimakariri % 0.70 Christchurch % 1.66 Selwyn % 0.39 Ashburton % 0.43 Timaru % 0.63 Mackenzie % 0.10 Waimate % 0.38 State Highways - 8.4% - DAIRY VOLUME EXPANSION over the decade to 2010 WAIKATO 2010 per person $270 CANTERBURY 2010 per person $590 ROAD DENSITY (LENGTH / LAND AREA) 8 Source: Tourism Industry Association and Statistics New Zealand, Tourism Satellite Account Canterbury Regional Land Transport Plan
8 Canterbury has 1,330 km of State Highways (owned and operated by the NZTA) that provide access between points of national significance, as well as providing inter-regional connections to Otago, West Coast and Marlborough. State Highway 1 runs north south linking Picton to Bluff and in places north and south of Kaikōura is nestled between steep hillsides and the Pacific Ocean. The Christchurch motorways Roads of National Significance (RoNS) programme is underway in Christchurch and scheduled for completion by They will introduce significant journey time reliability improvements on State Highway 1, State Highway 74 and State Highway 76. Public transport networks are provided in Greater Christchurch and Timaru. The greater Christchurch network was severely impacted by the earthquakes of 2011 and continues to be disrupted by road repairs. The network has been re-designed to operate in a more efficient way and better serve the changes in land use that have merged since 2011, however land use change and workplace dislocations are ongoing, and this has impacted on public transport patronage, with numbers yet to recover to pre-earthquake levels. Outside of Greater Christchurch and Timaru, rural public transport in the form of community vehicle trusts have emerged where scheduled buses services and taxi services are not sustainable. These community led initiatives make available a vehicle for booking and are partially supported, alongside fares, by the regional council through a local rate agreed annually by the community. Thirteen such trusts now exist across Canterbury and more are in various stages of development. In most urban areas taxi companies provide on-demand private transport services. These offer an effective private transport option for people who enjoy the convenience of a private vehicle but do not wish to use, or do not have, their own. Aside from these point to point journeys, taxis can also form part of a multi-modal journey, for example as the final leg of a trip made primarily by plane, bus or coach. The region also has a Total Mobility scheme, which assists eligible people with impairments to access appropriate transport to enhance their community participation. This assistance is provided in the form of subsidised door-to-door transport services wherever scheme transport providers operate. Within Canterbury, Total Mobility services are available in Greater Christchurch, Ashburton, Timaru and Waimate. In each of these areas, a subsidy is currently set at 50 per cent of the fare up to a maximum of $35 per trip. A significant amount of urban roads have bicycle facilities within the same corridor, either beside traffic lanes or separated from them, alongside footways. In Christchurch, separated cycle paths are significant in places, with a further 13 under development through a $200m programme of investment in Major Cycle Routes. Rail The rail network plays an important role in transporting people and freight around the region, and from plant to port. Rail plays a significant part in moving large volumes of export products for key commodities within the south island. There is 650 km of rail network across the region, with links north to Picton and south to Dunedin and beyond. The midland line provides a rail link through the main divide to Greymouth and points in between. These lines are primarily used to move freight in the form of coal from the West Coast to the port of Lyttelton, as well as a range of other containerised products and logs. Passenger services operating primarily as scenic visitor experiences also operate daily year round between Greymouth and Christchurch; and seasonally between Picton and Christchurch. These form an important part of the tourism landscape in the region. Air Christchurch International Airport Limited (CIAL) is the tourism gateway to the South Island and provides a significant contribution to both the Canterbury region and the South Island as a whole, with the total airport operation employing more than 5,500 employees across a diverse range of companies. An economic assessment in 2012 identified that Christchurch Airport contributed to the generation of $1.8 billion in regional GDP, representing 7.1% of the total GDP in the Canterbury region and supported employment for 9.7% of the region s workforce. CIAL is seeking to grow the economic development of both the region and the South Island, by pursuing growth in airlines visiting Christchurch and international passengers holidaying in the South Island and through being a catalyst to growing the wider South Island visitor economy. There is also a commercial airport in Timaru located 12.6km north of the city. It is the main airport in South Canterbury, with daily flights between Timaru and Wellington. Timaru airport has the capacity to take more flights and larger aircraft, including for freight. 6 Canterbury Regional Land Transport Plan
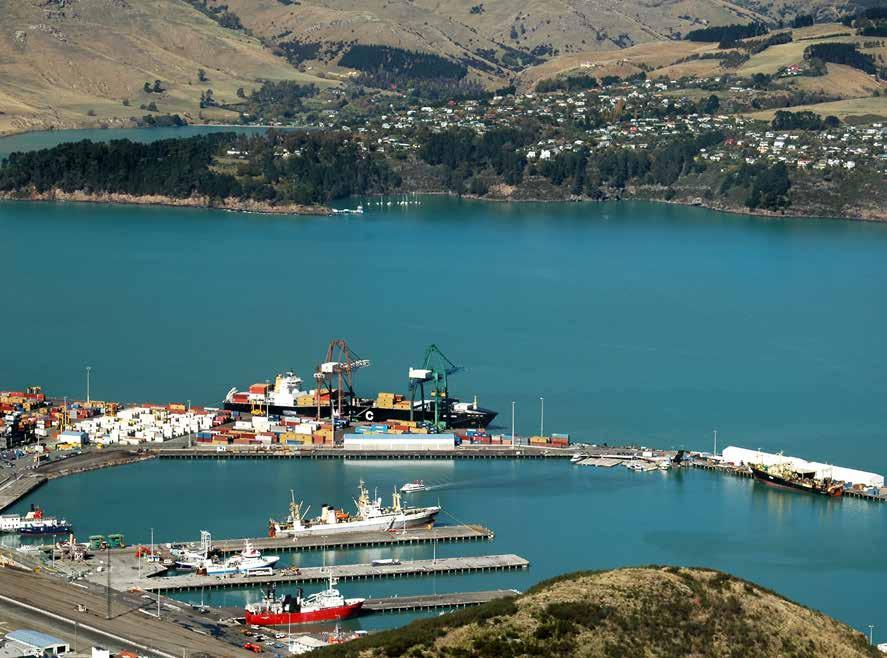
9 Sea Lyttelton Port of Christchurch (LPC) provides handling and stevedoring services for containers and bulk cargoes. The container trade has grown significantly in recent years and the port handles a large proportion of the South Island s imports, with Christchurch being a major distribution centre. The port is also equipped for bulk cargoes and is the biggest coal export port in New Zealand. The port is also a key part of the CIAL s supply chain receiving and storing jet fuel that is trucked to the airport. LPC operates two inland port sites in Christchurch at Woolston and Rolleston. The port itself is undergoing a significant rebuild following extensive damage as a result of the earthquakes. Reconfiguration and expansion forms part of this rebuild, including consideration of the potential future return of cruise ships which are a key component of the regional tourism offering. Port of Timaru (PrimePort) also has significant port infrastructure including large areas and particularly cold stores. Container handling facilities and services in partnership with the Port of Tauranga are available. Port of Tauranga offers a feeder service to the extensive global services operated from Tauranga. The Port of Tauranga also operates an inland port at Rolleston that provides a container feeder service to the Port of Timaru. PrimePort also handles dry bulk and break bulk cargo, and is a key import and export gateway for bulk liquids including fuel and inputs to food processing. PrimePort also handles logs and timber products, as well as large volumes of exports, including ocean fish, meat, dairy fruit and vegetables. N FIGURE 1: THE CANTERBURY REGION AND KEY TRANSPORT ROUTES Hanmer Kaikoura Rangiora Aoraki/Mount Cook Fairlie Methven Rolleston Lincoln Ashburton Christchurch Akaroa Clandeboye Dairy Factory Timaru Strategic Roads Strategic Railways Tourist destination Canterbury Regional Land Transport Plan
10 INTER-REGIONAL CONNECTIONS Links to neighbouring South Island regions and the North Island are of major importance to South Islanders, and for the flow of road freight and domestic and international visitors. State Highway 1 provides links north to the Marlborough District and Picton; and south into the Otago region. State Highways 7 and 73 link Canterbury to the West Coast. State Highway 8 is also a key route linking visitors to central Otago and Queenstown. These routes are characterised by two lane highways with occasional passing lanes through a range of challenging geography that exposes them to natural and weather hazards. Rest and scenic lookout areas are provided in some places, recognising the role these routes play linking visitors to destinations across the region and beyond. There are some concerns around the movement of pedestrians in these areas adjacent to high speed roads, and measures such as signage, layout design and the NZTA-led Visiting Drivers Project are aimed at mitigating these risks to the extent possible. Rail transport in Christchurch consists of two main railway lines carrying largely long-haul freight, as well as two long-distance passenger trains. The Main North Line runs from Christchurch along the east coast and through Kaikōura and Blenheim to Picton, connecting with ferries from Picton to Wellington. The Main South Line runs from Lyttelton through Christchurch and along the east coast of the South Island to Invercargill via Dunedin. The ports and airports also play an important role in connecting Canterbury to other regions. LPC is a significant destination for rail freight and handles a large proportion of the South Island s imports. PrimePort partners with the Port of Tauranga, making it part of an inter-regional integrated network that extends from Whangarei to Timaru. CIAL provides a gateway to the South Island for visitors and Timaru Airport provides a direct connection between South Canterbury and Wellington. INTERNATIONAL LINKS New Zealand s economy is heavily reliant on international exports, however given our distant markets, shipping costs form a large proportion of the total cost of export products. Our distance also introduces a time factor that is important for certain products, such as perishable foods, so each link in the export logistics chain needs to be efficient and effective to keep costs down, as well as be reliable. Christchurch s airport provides the South Island s only direct access to long haul destinations, with links to Singapore, China, Australia and Fiji. Increasing the number of carriers flying direct to Christchurch boosts the regional economy, as well as that of the rest of the South Island. Achieving this offers the dual benefit of opening up new long haul air cargo destinations for high value low volume time sensitive export products such as seafood, meat, fruit and flowers. To promote this, transport providers have a role in making the transport system a safe and attractive component of the overall South Island offering, and by supporting the airport to remain an attractive proposition for international carriers. More than 15% of international visitors hire a vehicle at some stage during their stay in New Zealand9, with increasing numbers from China and Japan in particular. This figure is likely to be higher in Canterbury due to the distances between South Island destinations. Catering for all overseas visitors by ensuring routes are safe and well sign posted, and supported by information, education, and appropriate infrastructure (such as public toilets and appropriate places to stop and take photos or look at scenery), is an essential part of delivering a world class south island experience and maintaining the safety of the road network. Christchurch and Timaru ports both have facilities to cater for international ships, however currently Lyttelton provides the main gateway to international ports of call. As part of the Lyttelton Port Recovery Plan, plans are underway to rebuild the port after much of its infrastructure was extensively damaged after the Canterbury earthquakes. Ultimately the Port will cater for increased land side handling and storage facilities and the capacity to handle larger ships, as is the trend internationally towards ships capable of carrying in excess of 15,000 TEU 10. Channels to the berths will also be widened and deepened to accommodate larger ships. The Port of Timaru exports a large proportion of Canterbury s exports goods via the Port of Tauranga. This is set to grow as the Port of Tauranga, New Zealand s largest port, uses Timaru as a feeder service for its large container ships. Whilst smaller than Lyttelton, Timaru Port is also a major exporting contributor particularly in recent times with log exports and containers. 9 International Visitor Survey: Transport. YE September TEU is the unit of measurement of the capacity of a container ship and stands for twenty foot equivalent unit, i.e. a forty foot container equals 2 TEU s. 8 Canterbury Regional Land Transport Plan
11 STRATEGIC DRIVERS OF THE TRANSPORT SYSTEM International and domestic economy Economic activity is a driver of demand in the Canterbury transport system, whether it be for the local, regional, interregional, inter-island or international movement of people and goods. People moving to, from or between workplaces, and the movement of commodities and products are important components of the regional economy and the way in which these needs are met has implications for productivity and community wellbeing. An attractive, effective transport system can also be a key factor in attracting skilled labour to the region, both in terms of the overall amenity of public spaces but also the ease with which people can get around for leisure, education and work purposes. Canterbury s ageing demographic profile suggests the attraction and retention of skilled labour to support economic growth will be an important component of the overall strategy to secure the future wellbeing of the region. Journeys to workplaces by private vehicle, often combined with delivering children to school, are a key driver of peak demand. Where demands become concentrated, such as along key corridors, longer journey times result, safety issues emerge, environmental impacts worsen and traveller frustration grows. The most common means of travel to work on the 2013 census day for people in Canterbury was driving a car, truck or van (79.8 % of people who travelled to work used this form of transport). More than 19 % of households in Canterbury have access to three or more motor vehicles, compared with a little over 16 % of all households in New Zealand 11. The supply of inputs to businesses in the region and the delivery of their products for domestic and international consumption is also a key function supported by the transport system. Whilst the number of freight journeys is smaller than the number of trips made by people, they are an important function supporting a strong economy, which contributes positively to broader community wellbeing. New Zealand relies on trade with distant markets, with the cost of freight added to the price of our exports and imports. Canterbury is central to this, with around 13% 12 of New Zealand s commodity export earnings passing through CIAL and Lyttelton Port. Ensuring key journeys to and from these points are efficient, effective and responsive to changing circumstances is therefore important. The affordability of our own domestic consumption of fast moving consumer goods, durable goods and major appliances, whether produced domestically or overseas are also supported by an efficient and effective freight transport system. According to analysis completed as part of the South Island Freight Plan, overall freight activity in Canterbury is forecast to increase by 85% 13 by 2042, with most growth occurring by 2027, driven by increases in liquid milk, manufactured dairy, general freight, aggregates, concrete and limestone, cement and fertiliser. Most movements (88% of tonnage) will begin and end within the region, which means 940,000 more 44 tonne truck trips per year based on current patterns of use. Currently 92% of all freight is moved by road and this is set to remain under current trends. Whilst this represents forecasts using best available information, international and domestic conditions will continue to shape the types, proportions and quantities of products the region imports and exports to and from the rest of New Zealand and internationally. Whilst the international demand for New Zealand dairy products in recent years has shaped Canterbury rural land use and created new transport demands on the network, such international trends can shift over time and see new land uses emerge along with new transport demands. A responsive and flexible transport system, enabled by appropriate and timely monitoring and planning is therefore important to ensure economic development and growth is supported. The strategic response section of this RLTP discusses further the need for collaboration across the sector to enable a responsive planning and investment framework. High Productivity Motor Vehicles (HPMV) and an associated permit system make available a way for higher freight volumes to be transported without the need for an equivalent increase in truck trips, making road transport more efficient, effective and productive. This initiative allows for the movement of trucks over 44 tonnes on certain parts of the network under a permit system, so that vehicles, roads and structures can be assessed prior to their use, ensuring safety is maintained and strength and maintenance implications for roads and structures are understood and addressed. There has been a dramatic jump in the uptake of high productivity motor vehicles across the country. As HPMV s provide average productivity gains of between 14-20%, it is estimated that this level of high productivity travel has avoided around million kilometres of standard heavy truck trips per quarter, providing commercial savings of between $20 - $30 million. So while HPMV trips are increasing, standard heavy truck trips show a corresponding decline Source: Stats NZ : Exports for Overseas Cargo (fob NZ$): New Zealand Port by Country of Destination, Commodity (HS2) and Period 13 Draft South Island Freight Plan, July million tonnes in 2012 to 61.2 million tonnes in Canterbury Regional Land Transport Plan

12 Key bridges on the strategic road network are of particular concern with regard to increased truck numbers and weights. Whilst the HPMV system will accommodate some of the forecast growth in freight volumes, increasing heavy vehicle numbers over time on the road network are an inevitability. Combined with the age of some of the region s key structures, and a heightened awareness of our need for resilience to natural disasters; bridge renewal, strengthening and improvement are a key strategic issue for the region. In a similar way, factors outside the transport system can drive urban land use change; such as the need for new housing, educational precincts, or industrial developments. However, it is important the transport implications of location choices are well understood and factored into decision making. In the greater Christchurch area, the Greater Christchurch Urban Development Strategy provides a forward view of land use change over time and enables a long term transport planning approach to be followed, potentially itself driving land use change by allowing for long term infrastructure developments to take place that achieve the multi-modal objectives sought in this Plan. 10 Canterbury Regional Land Transport Plan
13 Population change The Canterbury population is projected to grow by 166,300 people by Most growth will take place in the Greater Christchurch area (Waimakariri, Christchurch and Selwyn districts), with also some significant growth in the Ashburton District. In the remainder of the region, population growth will be very flat or in some districts marginally declining by Such growth will place demands on all aspects of service provision, and not least the transport system in terms of domestic freight growth and people movement. However, evolving technology, information provision and people s changing attitudes to how they meet their travel needs will mean current approaches to meeting these needs must change. There is emerging evidence internationally, such as in the USA 15, supported by recent trends in New Zealand around the age young drivers complete their journey through the graduated driver licensing system, that young people today, especially in urban areas, are making less use of private vehicles and instead make use of technology to access transport services, or even replace the need to travel. The emergence of innovative shared vehicle ownership models, ride sharing, hire schemes and mobile technology that enables on-demand transport services may also improve the efficiency of the network and ultimately slow the growth in peak period journeys. Increasingly these market led solutions will compete with the markets local and central government serve through public transport provision and change the way publicly provided infrastructure is used by the public and commercial operators. It will be important that public agencies are enablers of positive change, as well as provide appropriate regulation where public funds, and safety and security of the travelling public are at stake. A key feature of the changing age profile will be the increasing numbers of people aged 65 years and over. By 2031, one in four of Canterbury s residents is projected to be aged 65 and older. In eight of ten districts, the percentage is projected to be higher than this, with around a third of the resident population over 65+ in the Waimate, Timaru, Mackenzie and Kaikōura districts. Whilst these numbers are not large, they represent a challenge for local councils in terms of funding, but also a broader issue of ensuring communities remain connected and able to use the transport system to access their daily needs. Older people in the future will not be the same as the older people of today. Trends suggest they will on the whole, be healthier for longer into old age and still able to enjoy physical activities and be out and about. Many may also continue to work past the age of 65. Active travel, public transport and increased inter-peak traffic movements may all become important issues as we see a growing older generation, perhaps less inclined or able to continue driving but nevertheless assertive of their need to have independent mobility and access to all of the opportunities the rest of society enjoys. FIGURE 2: POPULATION AGE STRUCTURE, CANTERBURY REGIONAL COUNCIL AREA MEDIUM PROJECTION, (2013-BASE) Number of people 800, , , , , , , , yrs yrs yrs 65+ yrs 14 Statistics New Zealand 30 June 2013 medium population projection. 15 Transportation and the New Generation Why Young People Are Driving Less and What It Means for Transportation Policy. Benjamin Davis and Tony Dutzik, Frontier Group Phineas Baxandall, U.S. PIRG Education Fund. April Canterbury Regional Land Transport Plan
14 International and domestic visitors Visitors to Canterbury declined in the immediate aftermath of the Canterbury earthquakes, but visitor numbers are recovering and very recently exceeded pre-earthquake levels, due mainly to an increase in domestic visitors. Visitor numbers are projected to increase as the rebuild of the Christchurch central city continues, including the provision of more visitor accommodation and attractions. There were 3.09 million international visitors to New Zealand in the year to November 2015, the highest ever annual total. The number of both domestic and international visitors is forecast to increase by over 30% to 5.72m guest nights by Tourism is an important part of the New Zealand economy, its direct contribution to GDP is 3.7%. The biggest changes in international visitors by country of residence between the years ended November 2014 and 2015 were in arrivals from: China (up 87,400 to 344,900), Australia (up 71,300 to 1.32million) and the United States (up 21,100 to 240,000). Australia, China, the United States and the United Kingdom were New Zealand s biggest visitor sources, contributing more than two thirds of all arrivals in the November 2015 year. Within this there has been an increase in the number of Free Independent Travellers (FITs) touring New Zealand. Traditionally domestic tourists made up the bulk of FITs, however there has been a marked increase in the amount of international FITs who hire campervans and rental cars and drive. Based on the 2014 international Visitor Survey, driving in New Zealand is part of the visitor experience for 68% of visitors. CIAL is the international gateway to the South Island for many of these visitors. Christchurch is an international gateway to the South Island, providing direct access to and from major cities in Australia, China and Singapore. As well as Christchurch attractions, visitors use the city as a stepping stone to other parts of the region and the South Island. Ensuring safe and efficient links between Christchurch and the tourism offerings of the South Island is important. Meeting the self-drive and other travel needs of domestic and international tourists visiting Canterbury is an important contribution the transport sector makes to the regional economy by providing safe access to key attractions and supporting a positive overall visitor experience. As such, efforts to improve the visitor experience and increase the actual number of visitors is of strategic significance to the Canterbury economy. The Increasing number of visitors flying direct from overseas cities increases the number of wide bodied jets flying into and out of Christchurc. This, in turn, provides capacity to export long haul, high value, time sensitive goods, such as seafood, fresh meat, flowers and other perishables. The NZ Transport Agency s Visiting Drivers project aims to improve road safety for domestic and international visitors, while maintaining New Zealand s reputation as an attractive and safe tourist destination. The project has a focus on Otago, Southland and the West Coast regions where visiting drivers make up a significantly large proportion of the traffic in these major tourist destinations. However, many of the project initiatives especially in information provision will benefit visitors across the country, including in Canterbury. Where possible, the lessons learned from the Project can be used in other areas as part of the usual Transport Agency and local council road safety initiatives. 16 Christchurch and Canterbury Tourism Visitor Forecasts 2014/15 to 2019/ Canterbury Regional Land Transport Plan
15 Technological change Advances in technology are having a significant impact on the movement of people and goods.this can change the cost of travel and impact on transport networks, road safety and the environment. Vehicle technology is developing at an extremely rapid rate, through both passive and active safety features and user assist technology. History shows that these changes can be positive and negative, and emerge gradually over a long period of time or be disruptive, making existing technology redundant over a very short timeframe. Whilst transport providers and the Regional Transport Committee have little or no control over these emerging technologies, it is important their implications are understood and planned for so that local, regional and national policy is amended appropriately and investment is properly directed where necessary to realise the benefits. Technological change is largely driven by consumer demand for cheaper, new and improved products and services. National, regional and local bodies have a role in enabling these benefits, whilst protecting the public through regulation and enforcement. The following table captures most of the current emerging technological trends in general terms and outlines how these may drive changes in our transport system. It indicates the types of responses that will likely be needed by public bodies and other transport providers. TECHNOLOGY IMPACT OF RESULTING CHANGE IMPLICATION FOR TRANSPORT PROVIDERS Vehicle automation (e.g. takes control of vehicle in certain situations, to varying degrees) Fuel efficient engines Alternative fuel vehicles On-demand transport services Smart Motorways Traveller information systems Enhanced road safety Enhanced network capacity If fully autonomous changes the way mobility is achieved fundamentally Reduced consumer costs Reduced emissions Reduced fuel excise revenue Reduced consumer costs Reduced emissions Reduced fuel excise revenue Lower cost private transport Reduced vehicle ownership Reduced fuel excise revenue Consistent journey times Reduce congestion Information changes consumer behavior Less investment required in road safety over time Transport-related industries and infrastructure needs (e.g. parking replaced with drop-off) Less revenue into the National Land Transport Fund Role in EV charging / alternative fuel infrastructure Less revenue into the National Land Transport Fund Potentially less investment required in road network improvements over time Less revenue into the National Land Transport Fund Delayed or avoided investment in capacity increases Better incident management Potentially less investment required in transport improvements over time Vulnerability to hazards Cantabrians have a new understanding of the region s exposure to natural hazards since the earthquake sequence of 2010/11. Whilst the transport network proved to be resilient through the earthquakes in greater Christchurch, potential future earthquakes, floods, tsunami and land slide are all hazards that can be expected to have serious impacts on transport infrastructure across the region. In rural areas, where route choices are fewer, their impact may be felt more keenly thereby restricting the movement of people and goods to support communities more so than in the urban areas of the region. Network outages of weeks, months and even years are possible, making the need for long-term alternative arrangements a realistic possibility. The Canterbury Lifeline Utilities Group, in association with transport providers, undertakes investigations to reduce infrastructure vulnerability and improve resilience. This work can lead to physical improvements to infrastructure, scheduled with other work, as well as response plans in the event of natural disasters. Weather hazards, such as fire, snow and flood can also interrupt the normal operation of the transport system and result in outages for days and possibly weeks. Having response plans in place, and the ability to respond quickly, can effectively minimise impacts upon the community and economic wellbeing. Canterbury Regional Land Transport Plan

16 ISSUES AND CHALLENGES When considering transport drivers in the current regional, national and international context, a number of issues emerge; and with them transport challenges. These are outlined below and enable short, medium and long term priorities to emerge that inform the strategic response described in section 4 that follows. Canterbury is a diverse region with varying geography and a unique economic and demographic mix. Whilst town and country rely on one another for ongoing wellbeing and prosperity there are unique challenges in each that require an appropriate transport response at the local level. The following issues and challenges capture the key strategic factors facing the region into the future and where appropriate note particular urban or rural factors. 14 Canterbury Regional Land Transport Plan
17 ISSUE - MAINTAINING AND ENHANCING ACCESSIBILITY The primary purpose of transport is to provide opportunities for the movement of people and goods. Accessibility refers to the potential to reach destinations and mobility represents the ability to travel freely to and from destinations. Most people living in Canterbury enjoy a high level of mobility, which is largely met by high levels of car ownership and use. This mobility enables key social and economic benefits including access to work, education and recreational opportunities. Market research confirms most people living in the region place a high value on their level of mobility and expect their future mobility needs to continue to be largely based around the motor vehicle. In urban areas, some people choose to access the places they need to by means other than private car, such as by walking, cycling, using public transport and catching a taxi. This can lead to conflicts between modes that can have profound implications for safety, travel time and the further uptake of these beneficial transport options. There is also the potential for conflicts to also arise in rural areas, for example where cyclists make use of state highways. The separation of these modes from private vehicles is increasingly seen as a way to support their growth and complement capacity upgrades to the roading system. Integration problems and conflicts can also occur between traffic in urban areas when catering for access to local destinations on strategic roads, such as motorways and expressways, showing that whilst access to destinations in itself is a positive outcome, it can have adverse implications for other road users. Key challenge Maintaining current levels of accessibility and mobility for most Cantabrians and enhancing accessibility for those who are currently disadvantaged because of poor levels of mobility. ISSUE - PROVIDING TRANSPORT OPTIONS The use of private vehicles currently dominates the way that most people meet their transport needs. As vehicle numbers grow in line with population and demographic changes, current travel time delays and congestion will rise overall, despite targeted infrastructure investment at key locations that unlock access to new development and ease chronic localised congestion. For the future wellbeing of the region, it is important that a range of transport options are available enabling people and businesses to access what they need in the way of goods, services and activities. Many regard improving public transport, better use of rail and increased provision of cycling and walking infrastructure as significant issues facing the region. For many people, especially those in rural areas, including rural towns, these options are not always readily available. Low density and dispersed population centres make providing attractive and affordable public transport services extremely difficult, requiring innovative approaches to be explored, such as community vehicle trusts that provide on-demand shared transport options delivered within, and by, the community. Ageing communities and the need to access centralised health care facilities may open up opportunities for collaboration between public agencies in recognition of where the costs and benefits of travel fall. Some sectors of the community are transport disadvantaged in that they are faced with a lack of choices because they have limited access to a car or other transport options. Access to some goods and services can be enhanced through integrated land use measures, changes to the way services are provided or through the use of communications technology. Such initiatives can play a significant role in determining overall levels of accessibility. Providing for accessibility is considered more important than providing for mobility. Key challenge Supporting, and in some cases supplying, a range of transport and non-transport options to ensure the accessibility needs of all people and businesses can be met. Canterbury Regional Land Transport Plan
18 ISSUE - SUPPORTING FREIGHT GROWTH The efficient movement of goods and people is essential to support the region s economic wellbeing. Although the region s economy is expected to continue to diversify over time, industries such as agriculture and forestry that have significant freight requirements will continue to play major roles. Over the next 25 or more years, freight volumes to, through and from Canterbury are expected to almost double. Without intervention, the majority of freight (92%) will continue to be moved on the state highway and local roading network, with only 6% moving by rail and only 1.6% moving by coastal shipping. However, through this Plan multi-modal options will be sought where these make sense. Investigation is necessary to understand what the opportunity is for these other modes, whether it be for the movement of international or domestic freight within the region. Just increasing the number of trucks is not a sustainable option for meeting the forecast growth in freight volumes and managing its effects. Aside from the network impacts, driver shortages and road maintenance costs are a significant issue. At a system level there is the potential to consolidate freight volumes moved from rural areas by truck at strategic points in the network. Transporting them onward by rail or coastal shipping is then made possible so long as travel time, volume and distances are such that these options are financially advantageous for producers. Currently, the growth is partially being met by increased heavy vehicle mass and dimension limits through the new High Productivity Motor Vehicle (HPMV) rule. The proportion of heavy vehicles operating on HPMV permits is high and growing. The mass is increasing with vehicles operating at mass between 55 and 60 tonne now common place and this is likely to continue to increase. A resilient road network that has the capacity to cope with these HPMV mass limits and an overall increase in heavy vehicles is a challenge. Much of the Canterbury transport network is not designed for this increase in heavy vehicles and increasing failures or restrictions are resulting. There is a lack of integration between the road, rail and shipping sectors which can make it difficult to effectively plan in a multi-modal way for the region s future transport needs, particularly in light of the forecast increase in freight movements. Without intervention the majority (92%) of freight will continue to be moved on road networks, with the rail share predicted to drop from 6% currently to 5% in the next 20 years. A key focus of the RTC will be to bridge the gap between sectors by bringing their views and knowledge together to enable joined up planning and investment decisions. Key challenge Ensuring the region s transport system effectively supports economic development and growth in freight volumes by taking a multi-modal and integrated approach. ISSUE SUPPORTING DOMESTIC AND INTERNATIONAL VISITOR GROWTH Canterbury and the wider South Island offer wonderful visitor experiences that present the region, and our neighbouring regions, with economic growth opportunities. Ensuring visitors have an enjoyable, value for money and safe experience on transport networks is paramount to the region s reputation and ongoing growth in visitor numbers. Airport and cruise ship links, information, education and facilities provided in a seamless way are each important features of the visitor experience. An additional 1.3 million domestic and international visitor guest nights in Canterbury are forecast by Many of these will be self-drive visitors travelling in and around urban and rural parts of the region and into neighbouring regions. Fifteen per cent of international visitors are known to self-drive during their visit to New Zealand. Key challenge Developing the transport system to support domestic and international visitor growth and ensure the safety of visitors and other road users. 17 Visitor Forecasts Christchurch and Canterbury Tourism. 16 Canterbury Regional Land Transport Plan
19 ISSUE - FUNDING AND AFFORDABILITY Investment is essential for maintaining existing transport infrastructure and delivering improvements to the region s transport system. The ongoing implementation of the One Network Road Classification (ONRC) system provides a basis for prioritising such investment. The increase in freight growth and subsequent increase in heavy vehicles is resulting in an increasing rate of road asset consumption with many roads failing prior to their design lives. Bridge capacity and age is also becoming an emerging issue. This increases the demands on limited funding to ensure a network that is both fit for purpose and resilient. The increase in vehicle fuel efficiency, electric vehicles and smarter recording of Road User charges has made transport more affordable for users, but has almost flat-lined Government road tax revenue. This is not sustainable in the long term so alternative funding mechanisms need to be developed. In light of these, and other factors, the Government has highlighted the need for non-asset solutions, demand management and intelligent transport systems (ITS) to ensure future demands can affordably be met18. However, some of the region s transport plans have not been fully realised because of funding constraints. Additionally, some parts of the region have relatively small populations that find it difficult to raise sufficient revenue to afford the levels of transport investment desired by the community. A particular issue exists on rural council-owned roads where heavy vehicle damage is not adequately covered by revenue. Key challenge Delivering high quality transport options that meet the needs of all Cantabrians in an affordable manner within the funding available. ISSUE - MANAGING PRIVATE HOUSEHOLD VEHICLE TRAFFIC GROWTH Projected increases in household numbers, coupled with the current trend of high household car ownership, is contributing to an increase in the demand for travel and the use of private cars, particularly in urban areas, and especially across Greater Christchurch. While traffic congestion can cause delays - which impose an economic cost to the region - it can also help manage travel demand by influencing trip timing, land use decisions and encouraging the use of a mix of transport modes, such as public transport, car-sharing, cycling and walking. Key challenge Effectively managing traffic growth to ensure that accessibility is maintained and that the region s economic performance is not adversely affected. 18 New Zealand Infrastructure Plan Canterbury Regional Land Transport Plan
20 ISSUE - IMPROVING ROAD SAFETY FOR ALL ROAD USERS Approximately 40 people die on Canterbury roads and nearly 300 people are seriously injured on average every year in Canterbury. Although the number of fatalities arising from road crashes has generally decreased since the 1970s, in recent times crashes resulting in fatalities, hospitalisation and injury have increased. Improvements in vehicle safety over recent years has had a significant effect on reducing the fatality rate in crashes although this technology is slow to impact the safety of the transport system due to the high average age of Canterbury light vehicle fleet (with lower safety star ratings). These contrasting trends suggest that whilst improving vehicle technology has the capability to significantly reduce fatalities and injury severity (data demonstrates that the survivability of a crash in a higher safety star vehicle almost doubles compared to a lower one), high numbers of accidents are still occurring. Crashes impose a considerable social and economic cost on the region, our health system and the economic sustainability of a community. New Zealand has a national road safety strategy known as Safer Journeys Safer Journeys adopts the internationally endorsed safe system approach to road safety. The current trend of increasing levels of motorbike ownership is also likely to increase overall exposure to risk. Accident numbers may also increase as the population ages. Canterbury s highest risk factor is intersections. The region faces particular issues with high numbers of casualties associated with: y Intersection crashes (47% of all fatal and injury crashes) y Loss of vehicle control or head on crashes (33% of all fatal and injury crashes) y High and growing numbers of cycle crashes, (9% of all fatal and injury crashes) In some cases, measures that have improved safety for motorists have had unintended consequences by reducing the safety of people using other transport options, such as walking and cycling. Antisocial use of motor vehicles is also an issue that has received much media attention and requires a cultural change in attitude toward responsible driving behaviour and a shared responsibility for road safety. A multi-agency approach is essential to achieving this culture change, with education and enforcement by the Police an essential complement to engineering for safer roads and roadsides by Road Controlling Authorities. Key challenge Improving safety outcomes for all transport users. ISSUE - USE OF THE TRANSPORT SYSTEM HAS IMPLICATIONS FOR THE POPULATION S HEALTH While high levels of car ownership and mobility provide people with some health benefits, such as access to medical services, motor vehicle dependence has been linked to increased levels of physical inactivity and obesity. Air and noise pollution from vehicles can also have significant health impacts on people that are exposed to them for long periods. Although there are demonstrable health benefits of active modes of transport, such as cycling and walking, market research indicates most people do not see a strong link between transport policies and public health issues. Key challenge Ensuring transport makes a positive contribution to the health of Cantabrians. 18 Canterbury Regional Land Transport Plan
21 ISSUE - MANAGING THE ENVIRONMENTAL IMPACTS OF TRANSPORT The use of motor vehicles and development of transport infrastructure has significant impacts on the environment including air pollution, dust, greenhouse gas emissions, visual intrusion, storm water run-off, noise and vibration. Transport is responsible for approximately 20% of New Zealand s greenhouse gas emissions and is one of the sectors that has seen ongoing growth, increasing by 69% between 1990 and As a consequence of the close links between population increase, economic growth and transport demand, Canterbury has experienced an increase in transportrelated carbon dioxide emissions from motorised transport. The government s policy direction for transport over the next decade is set out in Connecting New Zealand. Connecting New Zealand summarises a number of direction-setting documents for the transport sector, including the National Infrastructure Plan, the Government Policy Statement on Land Transport Funding, and the New Zealand Energy Efficiency and Conservation Strategy. In turn, these policy documents also drive regional and local transport policy. Incentives and research are underway in the areas of new fuels and technology, vehicle fuel economy labelling, improved efficiency of commercial fleets and encouraging forms of transport that are less carbon intensive. The Ministry of Transport has begun investigating the potential role for Government to encourage increased use of electric vehicles in New Zealand and in the meantime has extended the exemption for light electric motor vehicles from the requirement to pay road user charges from 2013 to Local Government also has a leadership role in promoting electric motor vehicles. In 2015, the Christchurch City Council commenced a feasibility study into the replacement of its 350 vehicle fleet with electric vehicles. Environment Canterbury also runs four hybrid-electric vehicles as part of its 190 vehicle fleet. Key challenge Maintaining and improving levels of access and mobility in an environmentally sustainable manner. ISSUE - NETWORK SECURITY The ability of the region to withstand a hazard, such as flooding or a seismic event is an important consideration for maintaining the integrity of the region s transport system. A number of transport links in Canterbury face extremely challenging construction and maintenance issues particularly along the Kaikoura Coast, through the alpine passes and across some of the major rivers. Many of these links provide lifelines to neighbouring regions and are of national social and economic importance. Canterbury has a high number of ageing bridges which are susceptible to damage and will require upgrades during the next 30 years. Furthermore, the increasing size, and frequency of heavy vehicles are exacerbating road maintenance issues on the region s extensive local road network. Climate change is expected to have impacts on the region s transport infrastructure, particularly by generating more severe weather events such as flooding. In the long term, sea level rise could impact on land use and transport infrastructure, particularly in low-lying coastal areas. There will be a major impact on the rail network because much of the South Island s main trunk line is located in low-lying coastal areas. Increasing levels of interconnectivity between transport infrastructure and other infrastructure sectors, for example the communications sector supporting new transport technologies, makes the network security challenge more complex than it has been in the past. A greater level of collaboration and understanding of cross-sector risks is required to manage network security. Key challenge Minimising the risk of disruption on key regional and inter-regional transport routes. Canterbury Regional Land Transport Plan
22 ISSUE - MEETING THE TRANSPORT NEEDS OF DISPERSED COMMUNITIES The type and form of land use development that has taken place in the region has significant impacts on the transport system. Dispersed land use patterns are typically linked with high levels of motor vehicle ownership, use, and dependence since factors, such as the lack of availability of other transport options, affordability and distance to neighbouring towns and services make motor vehicle use the only realistic transport option. Conversely, concentrated land use is more commonly linked with lower levels of car ownership and use and higher levels of active transport and public transport patronage. The Canterbury region, particularly outside Christchurch, is characterised by a relatively dispersed population with low density communities that are often more reliant on motor vehicles to travel. Key challenge Future land use development occurs in a manner that social and economic needs can be met most efficiently and affordably. ISSUE - OIL SUPPLY SECURITY AND FUEL PRICE VOLATILITY The transport sector is highly reliant on imported oil supplies. During the next 30 years it is expected that oil prices will rise (subject to the highs and lows of economic cycles) as access to relatively cheap oil supplies diminishes. The resulting fuel price increases and volatility are likely to have significant social and economic impacts. Key export generating industries in the New Zealand economy, including tourism and timber, dairy and meat exports, are vulnerable to such impacts given most freight movement takes place by road. Although an increase in oil prices is expected to accelerate change from petroleum-based vehicles to alternative fuels and engine types, the transition is expected to take decades. The price and supply of oil also affects road maintenance costs because bitumen is derived from crude oil. Alternatives for road surfacing such as concrete are not currently affordable. Key challenge In the short term, ensuring the region is resilient to energy supply and fuel price volatility. In the longer term, moving toward a transportation system that is less reliant on oil. ISSUE - MANAGING THE TRANSPORT IMPACTS OF ANTICIPATED POPULATION CHANGE By 2043, the region s population is expected to grow from approximately 563,000 to more than 729, Most of this population growth is expected to occur within Greater Christchurch. This growth will create additional demands on the transport system. However, some parts of the region that already have relatively low populations are not experiencing population growth, such as parts of South Canterbury. 19 Statistics New Zealand medium project using estimated resident population at 30 June 2013 as a base. 20 Canterbury Regional Land Transport Plan
23 The proportion of people aged 65 and over is expected to increase significantly towards 2031, with one in four people in urban areas and one in three people in some rural areas aged 65 or older. An ageing population is expected to lead to increasing personal mobility issues, demand for public transport services and raises some road safety issues, as older people have a higher risk of being injured in road crashes. Social isolation is also of real concern for older people who might lose their personal mobility for a range of reasons, including the affordability of transport options. Key challenge Predicting and meeting the needs of a changing population and providing transport that enables access to these. ISSUE - UNCERTAINTIES ABOUT INTERNATIONAL TECHNOLOGY TRENDS Technological innovations have the potential to change transport demand and the way that people travel. Examples that may emerge during the next 30 years, include wider availability of electric vehicles, alternative fuels, improvements in vehicle safety, telecommunications and traveller information. Further development of electric vehicles or alternative fuels could help reduce the country s dependence on imported oil supplies. However, the mass adoption of electric vehicles is dependent upon the car industry supplying affordable technology comparable with conventional vehicles in sufficient numbers and a change in purchasing habits by New Zealand motorists. Increasing automation of vehicles and in particular driverless vehicle technology (e.g. driverless cars, unmanned aerial vehicles) has the potential to disrupt industries in the same way that the internal combustion engine did at the start of last century, with significant benefits to society. Key challenge Positioning the region to take advantage of iterative technological advances and being aware of the possibility and likelihood of more disruptive technological advances so that strategy and investment plans can be amended appropriately. ISSUE - EARTHQUAKE RECOVERY Earthquake impacts present an additional and ongoing challenge for the region, placing demands on the Greater Christchurch transport system which the system was not designed to meet. This includes the repair of physical damage to roads and pipes, the relocation of residential dwellings and businesses, and related land use change. Key challenge Managing traffic issues as a result of short to medium term land use change whilst targeting major investment on long term strategic network priorities arising from permanent land use changes. Canterbury Regional Land Transport Plan
24 STRATEGIC RESPONSE The Canterbury Regional Transport Committee aspires to an integrated multi-modal transport system for the region. Given the observed trends and the current emerging issues the Committee believes a multi-modal, integrated system will best support economic growth, as well as the social and environmental wellbeing of the region into the future. Delivering multi-modal freight solutions will support the cost-effective movement of goods to and from the region, supporting economic growth, employment and managing the community impacts of freight movement. Supporting the take up of multi-modal people movement options will also support freight efficiency, whilst also managing network congestion, improving productivity, public health and lowering the public and private costs of transport. Monitoring and reacting to changes in trends will be important for ensuring solutions are timely, affordable and fit for purpose. Whilst the Committee only represents road controlling authorities across the region, it is the only publicly accountable organisation with a regional perspective that represents the interests of the wider community in transport. Accordingly, the Committee envisages taking a leadership role in creating a more collaborative environment across the whole transport sector, so that strategy, planning and investment in every transport mode, whether for freight or people, is more cohesive and aligned to the long term vision of the region. The Committee will also work more closely with neighbouring Regional Transport Committees than previously. In addition to sharing many common issues and leveraging local expertise for the good of the wider South Island, this collaboration is necessary given the movement of people, especially as visitors, and freight, do not recognise the boundaries between local government areas. The Committee will continue to work closely with the New Zealand Transport Agency to deliver the roading system but will also work more closely with other central government agencies essential to delivering the vision such as the Ministry of Transport and KiwiRail. Others, such as the Ministry of Education and the Ministry of Health, as well as District Health Boards, will also have a key role to play and the Committee will engage with them too on relevant issues of joint interest. In the short term the Committee will focus on establishing the structures necessary for collaboration across the sector, ensuring they provide a meaningful way for all transport entities to come together, communicate and share knowledge. Alongside this, knowledge sharing will enable a greater understanding of the flow of people and goods across the region into the future, as well as nationally and internationally, opening up avenues for detailed investigation and potentially new investment opportunities. The opportunity also exists through this approach to align business as usual programmes of work, where they can be integrated to leverage better outcomes for public and private sector investment and the continued growth of the region. Whilst these actions sit outside of the formal role of Regional Transport Committees prescribed by the Land Transport Management Act, the Committee believes these actions will ultimately deliver better value to local communities, national transport investment and private sector productivity and growth. The Committee will also maintain its role and formal responsibilities under the Act for prioritising land transport investment in the regional roading system. Using the One Network Road Classification system, developed jointly with the NZTA, local authorities will continue to maintain and improve the roading system to support the vision of this Regional Land Transport Plan. In this respect the Committee continues to support a strategic response for the roading system that: y Looks after what we have through cost-effective road maintenance and renewals y Finishes what we started, like the RoNS programme y Focuses investment on strategic priorities while enabling local priorities y Provides more travel choice for people over time, and y Does things smarter, by making efficient use of existing infrastructure. 22 Canterbury Regional Land Transport Plan
25 OBJECTIVES AND POLICIES OBJECTIVE 1: A LAND TRANSPORT NETWORK THAT ADDRESSES CURRENT AND FUTURE TRANSPORT DEMAND Increases in demand are expected across all modes and all districts during the next ten years. In general, the existing network outside of Christchurch has adequate throughput capacity for expected traffic volumes, however, increasing agricultural production is increasing maintenance, renewal and improvement needs for rural roads. Funding these activities is a key issue for the region. For freight, improvements to increase efficiency on key routes are a priority. This includes completion of the RONS, improvement of the Brougham Street corridor to the Port of Lyttelton, strengthening structures for HPMVs and addressing access to freight hubs. Within the greater Christchurch area, completion of the RONS will provide additional capacity on those strategic routes; however, focussing on increasing the use of other modes and optimising the use of the existing network will be the primary strategy in the future. Greater investment in active travel modes such as walking, cycling and public transport is critical to providing for future travel demand and enhanced sustainability. Key outcomes for current and future demand to 2025: y roads are maintained to a level that is fit for purpose y travel times and travel time reliability for freight and passenger trips are maintained at current levels outside of greater Christchurch y the number of strategic freight routes suitable for HPMVs is expanded y access to local freight transport hubs is improved. Within greater Christchurch: y the percentage of peak trips made on foot, cycle and bus are increased y average travel time reliability is maintained at 15 per cent or better during peak travel times. OBJECTIVE 2: A LAND TRANSPORT SYSTEM THAT IS INCREASINGLY FREE FROM DEATH AND SERIOUS INJURY Improving safety is both a national and regional priority. Regional level actions to improve safety include safer infrastructure and improved road user behaviour. A reduction in crashes is sought, with a particular emphasis on reducing the number of deaths and serious injuries. The ultimate aim of transport safety programmes is zero harm. While the Swedish Vision Zero has not been formally adopted in New Zealand, the underlying philosophy is equally applicable. This requires recognition of human error. It seeks not only to reduce the incidence of human error but to reduce the consequences of human error in all aspects of our transport system. Key outcomes for safety to 2025: y fewer than 30 deaths and 250 serious injuries annually by 2021 y a reduction in total crashes by Canterbury Regional Land Transport Plan
26 OBJECTIVE 3: THE CANTERBURY EARTHQUAKES RECOVERY IS SUPPORTED Recovery from the Canterbury earthquakes is a national and regional priority with substantial economic and social benefits. Funding availability and resources continue to be a challenge for the recovery of transport infrastructure and services. The regional priorities for funding are reflected in the key outcomes listed below. y Repair of horizontal infrastructure is delivered in accordance with timetables and standards contained in infrastructure recovery plans and the cost sharing agreements between councils and Government. y Transport infrastructure supports the redevelopment of central Christchurch. y The provision of transport infrastructure and services support the objectives and policies of Canterbury earthquake recovery plans. OBJECTIVE 4: THE LAND TRANSPORT NETWORK IS RESILIENT AND SUPPORTS LONG-TERM SUSTAINABILITY Resilience and long-term sustainability is about reducing the risks associated with both known and unanticipated threats. While some long-term transport sustainability issues reflect national and international trends, local responses are supported where appropriate. The key outcomes listed below reflect the regional responses to these issues. y Infrastructure and services are more resilient to disruption from acute events such as natural hazards or crashes. y Long-term sustainability issues, such as the effects of climate change, public health, demographic changes, and the reliance on fossil fuels are fully incorporated into transport planning decisions. y The environmental effects of transport infrastructure and services are fully incorporated in decision-making and are avoided, remedied or mitigated as required. y Transport infrastructure and services are integrated with and support land use and development patterns contained in the RPS and district plans. OBJECTIVE 5: INVESTMENT IN LAND TRANSPORT INFRASTRUCTURE AND SERVICES IS EFFICIENT During the next ten years, around $4B of public money will be spent on transport infrastructure and services in Canterbury. Ensuring these funds are used efficiently is good public management and is recognised in the value for money priority of the GPS. The GPS also recognises the Ministry of Transport s expectation of the role the NZ Transport Agency has in monitoring and reporting on investment efficiency. Key outcomes: y All agencies involved in the provision of infrastructure and services will ensure expenditure is efficient and strive for productivity improvements. y The NZ Transport Agency will monitor and report on the efficiency of NLTF expenditure in Canterbury. 24 Canterbury Regional Land Transport Plan
27 STATEMENT OF PRIORITIES FOR 2015 TO 2025 This section outlines the Canterbury regional priorities for expenditure during the next ten years. Priority 1 is focussed on looking after what we have, and includes maintenance, renewal and minor improvement programmes and existing public transport services. These are regarded as essential to avoid going backwards. All improvement projects are included in priorities 2-4. Priority 2 projects are existing commitments within the NLTF. No further prioritisation was undertaken for these projects as they are already well-advanced and funding is assured. All priority 3 projects are of regional significance and strongly aligned to the challenges and objectives outlined in this Plan. The selection of priority 3 projects was based on an assessment of each project against the following criteria: 1. Benefits for the movement of freight. 2. Increasing transport choice for the movement of people. 3. Earthquake recovery. 4. Safety. 5. Long-term sustainability and resilience. The assessment was undertaken with all five of the criteria being equally weighted. A subsequent moderation process resulted in intersection safety projects being promoted to a level higher than the initial assessment, reflecting a view that the criteria did not give sufficient emphasis to safety. The final grouping shows the results after this moderation process. Priority 4 projects include improvements of lower regional priority. Only regionally significant projects are shown in this section. Priority projects that cost less than $5M and are of local rather than regional significance are shown in Appendix 1. Although not regionally significant, most of these projects remain an efficient use of NLTF due to the significant local benefits and the relatively low cost involved. The projects and programmes of regional significance include all priority 1, 2 and 3 activities, and priority 4 projects or programmes over $5M. Improving access to the Port of Timaru is also regarded as being of regional significance due to the importance of access to the Port for the regional economy. Improving the efficiency of spending was not explicitly part of the regional prioritisation process but is part of the ongoing process of improvement for the NZ Transport Agency and all approved organisations seeking NLTF funding. Priority 1: Looking after what we have For most trips in Canterbury the existing transport network and services provide effective and efficient access. The first priority for the region is keeping the existing network fit for purpose. In addition to maintaining existing infrastructure and services, it includes related activities such as road safety promotion and enforcement. This is the core business for road controlling authorities, the Regional Council and other agencies such as the New Zealand Police. In greater Christchurch, this includes the repair and reinstatement of earthquake-damaged roads in accordance with infrastructure recovery plans. The priority 1 programmes are: y infrastructure maintenance and renewals y existing public transport services y safety enforcement and promotion y minor improvements and optimisation of the existing transport network and assets y repair of earthquake-damaged roads. Table 1 shows the expenditure on these activities by approved authority. The post-earthquake transport rebuild programmes agreed in the cost share agreements between the Crown and and Waimakariri District Council, respectively, are within priority 1. The projects within these programmes are not shown within Table 1 as they are managed through a separate governance arrangement agreed with Government. These works are expected to be completed by the end of The expected gross cost for the rebuild programme with the Crown for the period is Canterbury Regional Land Transport Plan

28 in the range of $220-$260M. The NZ Transport Agency board has a financial assistance rate of 83% for these works. The and NZ Transport Agency have agreed to the reinstatement of the Sumner-Evans Pass-Lyttelton route as part of this rebuild programme. The Council is also seeking to include the second coat reseals, central city resurfacing and the repair of the Fitzgerald Avenue and Pages Road bridges. The cost to complete the Waimakariri District Council transport post-earthquake repairs is estimated at $5.2M. The NZ Transport Agency board has agreed a financial assistance rate of 65% for these works. 26 Canterbury Regional Land Transport Plan
29 TABLE 1: PRIORITY 1 EXPENDITURE ACTIVITY 2015/ / /18 THREE-YEAR COST 2018/ / /21 SIX-YEAR COST 2021/ / / /25 TEN-YEAR COST ASHBURTON DISTRICT COUNCIL Transport planning $115,000 $15,000 $100,000 $230,000 $15,500 $15,500 $105,000 $366,000 $16,000 $16,000 $110,000 $16,500 $524,500 Road safety promotion $120,000 $120,000 $120,000 $360,000 $123,600 $127,308 $131,127 $742,035 $135,061 $139,113 $143,286 $147,585 $1,307,080 Maintenance and operation of local roads $3,868,985 $4,001,635 $4,087,815 $11,958,435 $4,209,229 $4,335,506 $4,465,570 $24,968,740 $4,599,538 $4,737,524 $4,879,650 $5,026,039 $44,211,491 Renewal of local roads $7,580,419 $7,806,223 $8,038,802 $23,425,444 $7,203,939 $7,420,058 $7,642,659 $45,692,100 $7,871,939 $8,108,097 $8,351,340 $8,601,880 $78,625,356 Local road improvements (minor improvements) $600,000 $600,000 $600,000 $1,800,000 $615,000 $630,000 $645,000 $3,690,000 $660,000 $680,000 $700,000 $715,000 $6,445,000 CHRISTCHURCH CITY COUNCIL* Transport planning $300,000 $300,000 $300,000 $900,000 $300,000 $300,000 $300,000 $1,800,000 $300,000 $300,000 $300,000 $300,000 $3,000,000 Road safety promotion $1,267,900 $1,273,013 $1,278,125 $3,819,038 $1,300,000 $1,350,000 $1,400,000 $7,869,038 $1,450,000 $1,500,000 $1,550,000 $1,600,000 $13,969,038 Public transport infrastructure $1,355,241 $4,194,647 $6,052,765 $11,602,653 $8,022,731 $5,102,313 $3,074,276 $27,801,973 $2,040,542 $1,006,871 $1,013,262 $1,019,717 $32,882,365 Maintenance and operation of local roads $31,127,715 $31,497,451 $30,417,271 $93,042,437 $31,817,271 $31,817,271 $31,817,271 $188,494,250 $31,817,271 $31,817,271 $31,817,271 $31,817,271 $315,763,334 Renewal of local roads $15,777,781 $21,876,945 $29,598,950 $67,253,676 $36,411,661 $37,654,248 $37,149,737 $178,469,322 $34,782,664 $33,052,208 $34,169,073 $35,286,446 $315,759,713 Local road improvements (minor improvements) $3,500,000 $3,500,000 $3,500,000 $10,500,000 $3,500,000 $3,500,000 $3,500,000 $21,000,000 $3,500,000 $3,500,000 $3,500,000 $3,500,000 $35,000,000 **Earthquake recovery works $500,000 $4,279,478 $13,592,888 $18,372,366 $15,694,925 $9,115,632 $8,485,752 $51,668,675 $8,339,617 $6,852,000 $3,995,000 - $70,855,292 DEPARTMENT OF CONSERVATION (MT COOK) Maintenance and operation of local roads $54,500 $48,500 $67,500 $170,500 $60,000 $60,000 $60,000 $350,500 $60,000 $60,000 $60,000 $60,000 $590,500 ENVIRONMENT CANTERBURY Transport planning $340,000 $340,000 $340,000 $1,020,000 $340,000 $340,000 $340,000 $2,040,000 $340,000 $340,000 $340,000 $340,000 $3,400,000 Public transport (existing) $40,993,894 $42,920,445 $44,470,862 $128,385,201 $45,613,943 $46,885,159 $49,673,031 $270,557,334 $51,405,432 $53,147,570 $54,579,534 $$56,561,779 $486,251,600 HURUNUI DISTRICT COUNCIL Transport planning $10,000 $10,000 $25,000 $45,000 $10,000 $10,000 $25,000 $90,000 $10,000 $10,000 $25,000 $15,000 $150,000 Road safety promotion $57,400 $57,400 $57,400 $172,200 $58,910 $59,500 $60,100 $350,710 $60,700 $61,300 $61,900 $62,500 $597,110 Maintenance and operation of local roads $3,125,560 $3,180,192 $3,195,922 $9,501,674 $4,063,860 $4,173,800 $4,255,700 $21,995,034 $4,359,800 $4,403,400 $4,447,500 $4,491,900 $39,487,634 Renewal of local roads $3,629,200 $3,825,501 $3,752,102 $11,207,203 $3,669,400 $3,594,520 $3,784,650 $22,255,773 $3,836,780 $3,905,100 $3,913,930 $3,953,060 $37,864,943 Local road improvements (minor improvements) $334,455 $336,445 $335,670 $1,006,570 $406,610 $408,390 $422,770 $2,244,340 $429,865 $435,490 $438,915 $442,623 $3,991,233 Canterbury Regional Land Transport Plan
30 ACTIVITY 2015/ / /18 THREE-YEAR COST 2018/ / /21 SIX-YEAR COST 2021/ / / /25 TEN-YEAR COST KAIKŌURA DISTRICT COUNCIL Road safety promotion $14,000 $14,000 $14,000 $42,000 $20,000 $20,000 $20,000 $102,000 $20,000 $20,000 $20,000 $20,000 $182,000 Maintenance and operation of local roads $493,000 $493,000 $513,000 $1,499,000 $493,000 $493,000 $513,000 $2,998,000 $493,000 $493,000 $513,000 $493,000 $4,990,000 Renewal of local roads $707,000 $707,000 $687,000 $2,101,000 $707,000 $707,000 $687,000 $4,202,000 $707,000 $707,000 $687,000 $707,000 $7,010,000 Local road improvements (minor improvements) $50,000 $50,000 $50,000 $150,000 $50,000 $50,000 $50,000 $300,000 $50,000 $50,000 $50,000 $50,000 $500,000 MACKENZIE DISTRICT COUNCIL Maintenance and operation of local roads $1,613,908 $1,624,133 $1,613,908 $4,851,949 $1,512,715 $1,563,840 $1,512,715 $9,441,219 $1,533,165 $1,543,390 $1,533,165 $1,512,715 $15,563,654 Renewal of local roads $1,803,000 $1,803,000 $1,923,000 $5,529,000 $1,810,000 $1,310,000 $1,310,000 $9,459,000 $1,310,000 $1,310,000 $1,310,000 $1,310,000 $14,699,000 Local road improvements (minor improvements) $250,000 $250,000 $250,000 $750,000 $250,000 $250,000 $250,000 $1,500,000 $250,000 $250,000 $250,000 $250,000 $2,500,000 NZ TRANSPORT AGENCY CANTERBURY HIGHWAY NETWORK Transport planning $500,000 $305,000 $5,000 $810,000 $5,000 $50,000 - $865, $865,000 Maintenance and operation of state highways $33,305,200 $33,012,800 $33,784,180 $100,102,180 $32,571,270 $37,638,540 $47,511,240 $217,823,230 $38,973,330 $37,748,630 $41,889,760 $48,945,920 $385,380,870 Renewal of state highways $16,871,590 $20,091,540 $19,036,860 $55,999,990 $13,763,330 $15,904,560 $20,276,370 $105,944,250 $16,468,590 $15,951,080 $17,700,960 $20,682,610 $176,747,490 State Highway minor improvements $2,363,584 $2,532,411 $2,701,238 $7,597,233 $2,700,000 $2,700,000 $2,700,000 $15,697,233 $2,700,000 $2,700,000 $2,700,000 $2,700,000 $26,497,233 SELWYN DISTRICT COUNCIL Transport planning $40,000 $42,000 $42,000 $124,000 $42,000 $42,000 $42,000 $250,000 $42,000 $42,000 $42,000 $42,000 $418,000 Road safety promotion $209,000 $218,000 $218,000 $645,000 $218,000 $219,000 $219,000 $1,301,000 $220,000 $220,000 $221,000 $221,000 $2,183,000 Maintenance and operation of local roads $5,588,000 $6,000,000 $6,179,000 $17,767,000 $6,313,000 $6,450,000 $6,591,000 $37,121,000 $6,728,000 $6,868,000 $7,012,000 $7,151,000 $64,880,000 Renewal of local roads $5,343,000 $5,611,000 $5,654,000 $16,608,000 $5,605,000 $5,645,000 $5,687,000 $33,545,000 $5,727,000 $5,768,000 $5,811,000 $5,851,000 $56,702,000 Local road improvements (minor improvements) $534,000 $2,568,000 $579,000 $4,215,000 $6,083,000 $5,591,000 $5,200,000 $21,089,000 $3,609,000 $31,618,000 $627,000 $636,000 $57,045,000 TIMARU DISTRICT COUNCIL Transport planning $50,000 $80,000 $100,000 $230,000 $50,000 $80,000 $100,000 $460,000 $60,000 $90,000 $110,000 $75,000 $795,000 Road safety promotion $260,000 $262,000 $269,000 $791,000 $312,000 $315,000 $318,000 $1,846,000 $325,000 $330,000 $330,000 $330,000 $3,051,000 Maintenance and operation of local roads $4,860,000 $4,950,000 $5,005,000 $14,815,000 $5,210,000 $5,290,000 $5,370,000 $30,685,300 $5,450,000 $5,530,000 $5,610,000 $5,800,000 $53,075,000 Renewal of local roads $6,925,000 $6,955,000 $7,095,000 $20,975,000 $7,000,000 $7,100,000 $7,200,000 $42,275,000 $7,310,000 $7,420,000 $7,530,000 $7,650,000 $72,185,000 Local road improvements (minor improvements) $1,995,000 $1,920,000 $1,870,000 $5,785,000 $1,380,000 $1,300,000 $1,300,000 $9,765,000 $1,300,000 $1,300,000 $1,500,000 $1,500,000 $15,365, Canterbury Regional Land Transport Plan
31 ACTIVITY 2015/ / /18 THREE-YEAR COST 2018/ / /21 SIX-YEAR COST 2021/ / / /25 TEN-YEAR COST WAIMAKARIRI DISTRICT COUNCIL* Road safety promotion $120,000 $120,000 $120,000 $360,000 $120,000 $120,000 $120,000 $720,000 $120,000 $120,000 $120,000 $120,000 $1,200,000 Maintenance and operation of local roads $5,261,000 $5,243,000 $5,471,000 $15,975,000 $5,500,000 $5,740,000 $6,000,000 $33,215,000 $6,300,000 $6,600,000 $7,200,000 $7,500,000 $60,815,000 Renewal of local roads $4,745,000 $4,710,000 $4,800,000 $14,255,000 $4,600,000 $4,750,000 $4,900,000 $28,505,000 $5,000,000 $5,200,000 $5,350,000 $5,500,000 $49,555,000 Local road improvements (minor improvements) $1,000,000 $1,000,000 $1,000,000 $3,000,000 $1,020,000 $1,050,000 $1,070,000 $6,140,000 $1,090,000 $1,000,000 $1,000,000 $1,000,000 $10,230,000 WAIMATE DISTRICT COUNCIL Maintenance and operation of local roads $1,871,463 $1,897,662 $1,938,836 $5,707,961 $1,983,750 $2,030,537 $2,081,066 $11,803,314 $2,133,467 $2,189,611 $2,247,627 $2,309,385 $20,683,404 Renewal of local roads $2,763,820 $2,802,514 $2,863,319 $8,429,653 $3,189,349 $3,284,100 $3,365,824 $18,268,926 $3,450,575 $3,541,379 $3,635,211 $3,735,096 $32,631,187 Local road improvements (minor improvements) $321,764 $326,269 $333,348 $981,381 $341,070 $349,114 $357,802 $2,029,367 $366,811 $376,464 $386,439 $397,057 $3,556,138 * Excludes projects that are part of the post-earthquake cost share agreement with the Crown. ** Includes provision for second coat seals, resurfacing and Fitzgerald Avenue and Pages Road bridges, if these are not included in the cost-sharing agreement with the Crown. Canterbury Regional Land Transport Plan

32 Priority 2: Finishing what we have started (existing commitments) There are a small number of significant projects that already have funding secured. In most instances, construction has already commenced. These projects include: y Roads of National Significance (RONS) and related improvements: These roads have been identified as priority in the GPS, including the Northern Arterial, Western Belfast Bypass, the Western Corridor and stages 2 and 3 of the Southern Motorway. projects that directly connect to these are also included. (Figure 3 shows the location of the RONS projects). y An Accessible City (AAC) phase 1: This includes the first of the five phases in the AAC programme for the revitalisation of Christchurch s central city. Full completion of the AAC programme is estimated to take up to 20 years. Phase 1 is already underway and expected to be completed by y Major Cycleways Programme: This programme of 13 major urban cycleways commenced in 2014 and seeks to achieve a major modal shift away from private cars to cycling. y Existing public transport infrastructure improvement commitments within Christchurch: These include the completion of the new central bus interchange, improving the Riccarton Road corridor for buses, and building suburban interchanges at Riccarton and Northlands malls. y Ferrymead bridge: This major bridge replacement in Christchurch will be completed in 2015/2016. y Wigram Magdala link: This significant road project in south-west Christchurch will continue until 2016/2017. y Mingha Bluff to Rough Creek: This project on State Highway 73 is of inter-regional significance due to the link with the West Coast. It is expected to be completed in 2016/2017. y Factory Road bridge: This project in Timaru district will be completed in 2015/2016.Table 2: Priority 2 expenditure FIGURE 3: CHRISTCHURCH RONS PROGRAMME 30 Canterbury Regional Land Transport Plan
33 TABLE 2: PRIORITY 2 EXPENDITURE ORGANISATION ACTIVITY CLASS PROJECT NAME TOTAL COST FOR ALL YEARS START YEAR Wigram Magdala link $26,270,141 - Cranford Street upgrade $19,455,828 - Northern arterial extension $39,408,849 - Ferrymead Bridge replacement and improvement $9,378,608 - Post SCIRT Fitzgerald bridges and approaches work $21,070, /15 Post SCIRT Pages Road bridge and approaches $14,872, /15 Major cycleway Papanui parallel (Grassmere route-papanui to city) $10,849, Major cycleway Rapanui-Shag Rock (Sumner to city) $21,145, Major cycleway Uni-Cycle (University to city) $9,623, Major cycleway Little River link (Little River route) $4,875, Major cycleway Nor'West Arc (western inner orbital) $21,133, Major cycleway Southern Lights (south to city) $2,070, Major cycleway Wheels to Wings (airport route) $12,372, Major cycleway Northern Line (northern rail route-belfast to Riccarton) $6,748, Major cycleway South Express (Hornby rail-templeton to city) $4,016, Major cycleway Quarryman's Trail (Halswell to city) $17,822, Major cycleway Otakaro (Avon River route-new Brighton to city) $21,935, Major cycleway Opawaho River route (Heathcote River trail) $17,102, Major cycleway Heathcote expressway (Heathcote rail route-city) $13,085, NZ Transport Agency NZ Transport Agency NZ Transport Agency NZ Transport Agency NZ Transport Agency NZ Transport Agency Timaru District Council for state highways for state highways for state highways for state highways for state highways for state highways Christchurch northern arterial rural with QEII $214,379, Christchurch southern motorway Halswell Junction Road to Rolleston (stage 2 and 3) $256,575, Harewood Road to Yaldhurst Road four-laning $75,140, Western Belfast bypass $121,750, Groynes to Sawyers Arms Road $42,300, Mingha Bluff to Rough Creek $21,800, Factory Road bridge $3,589, Priority 3: Improvements with high strategic alignment Priority 3 includes programmes with a high alignment to the objectives of this Plan. Most of these programmes are in or around Christchurch due to the higher demand levels on this part of the network. The priority 3 projects are grouped into programmes of similar type, as described below and shown in Table 3. The strategic alignment of individual projects is also shown in Table 3 through the assessment against the following evaluation criteria: y supporting the efficient movement of freight y providing transport choice y supporting earthquake recovery y improving safety y supporting long-term sustainability and resilience. Canterbury Regional Land Transport Plan
34 Each project was rated as high (H), medium (M), low (L) or nil (-) against the criteria, as shown in Table 3. The grouping of projects into sub-categories and the ordering of these sub-categories does not imply any priority order. The relative priority and importance of individual projects can be seen through the assessment of strategic priority. High priority road projects These are: y Eight downstream improvement projects relating to the RONS. y The Annex/Birmingham/Wrights upgrade which links to the Wigram/Magdala project already underway. y Brougham Street corridor improvements that are aimed at improving travel efficiency to Lyttelton. Next stages of the AAC programme for central Christchurch These will improve access and the quality of urban spaces within the central city and are jointly funded by council and the Government. Only the projects scheduled for the next three years are included in priority 3. Note: Funding of the AAC programme is yet to be confirmed. It is expected that prioritisation and funding needs will require the programme to be spread over a longer period extending beyond the ten-year life of this Plan. High priority intersection safety improvements These are all based around greater Christchurch and most are included on the NZ Transport Agency national top 100 list of dangerous intersections. Other factors, such as changes in pedestrian traffic associated with school mergers and integration with other high priority works, have also been taken into account in selecting these projects. High priority cycle routes The cycle and public transport projects aim to enhance transport choice for travel in and around greater Christchurch. Enhancing alternatives to travel by private car is a key priority in this part of the region and supports effectiveness, safety, earthquake recovery and long-term sustainability. Enhancing cycling has been recognised in the GPS as a national priority, as well as being a regional and local priority. From a regional perspective, the highest-ranked cycle route is between Christchurch and Kaiapoi where there is currently no safe crossing of the Waimakariri River for cyclists or pedestrians. High priority public transport route and facility improvements The improvements for public transport support a transition to a hub and spokes public transport system. These and the cycle routes also support access to the central city as part of earthquake recovery. Other road-related projects This includes a variety of other projects with significant alignment to the objectives in this Plan. They include three state highway corridor safety projects (Rakaia to Ashburton, Ashley to Belfast and Woodend), road and intersection improvements around greater Christchurch, and the fitting of a deluge system to improve the safety and resilience of Lyttelton tunnel. Although unlikely, closure of the tunnel due to fire damage would have a very high impact for freight as the primary access to the Port of Lyttelton. This risk is currently heightened by the closure of Evans Pass Road due to earthquake damage. There are two significant intersection improvements proposed for Rolleston within this category. The first are relatively minor improvements put forward by the NZ Transport Agency, and the second is a grade separation proposal from Selwyn District Council to address severance and safety issues related to both the state highway and rail lines between the main residential and industrial sites in Rolleston. Further discussions between the NZ Transport Agency and Selwyn District Council will refine the scope and funding of these projects. 32 Canterbury Regional Land Transport Plan
35 TABLE 3: PRIORITY 3 PROJECTS ORGANISATION ACTIVITY CLASS PROJECT NAME START YEAR END YEAR TOTAL COST FREIGHT (H,M,L) CHOICE (H,M,L) EARTHQUAKE (H,M,L) SAFETY (H,M,L) SUSTAINABILITY AND RESILIENCE (H,M,L) HIGH PRIORITY ROAD PROJECTS Annex/Birmingham/ Wrights route upgrade $11,351,260 M M M H H Intersection improvement: Belfast/ Marshland intersection $1,826,436 M M M H H Intersection improvement: Greers/ Northcote/Sawyers Arms $5,109,763 M M M H H Northcote Road four-laning $7,361,162 M M L H H RONS downstream inter improvements: Cranford Street downstream $8,875,000 L L M H M RONS downstream inter improvements: Sawyers Arms/Waimakariri $1,014,000 L L M H M RONS downstream intersection improvements: Memorial/ Orchard $1,014,000 L L M H M RONS downstream route improvement: Marshland-QEII-Shirley $1,014,000 L L M H M RONS downstream route improvements: Harewood Road $442,000 L L M H M NZ Transport Agency for state highways Brougham Street corridor improvements $12,500,000 H L M M H AN ACCESSIBLE CITY PROGRAMME FOR CENTRAL CHRISTCHURCH AAC Armagh Street (Durham-Montreal) $2,047,743 - M H M M AAC Central City: Wayfinding $9,463,040 - M H M M AAC Colombo Street (Bealey-Kilmore) $2,397,071 - M H M M AAC Colombo Street (St Asaph- Moorhouse) $3,029,994 - M H M M AAC Ferry Rd (St Asaph-Fitzgerald) $1,885,422 - M H M M AAC Hereford Street (Cambridge- Montreal) $1,494,474 - M H M M AAC Hereford Street (Madras-Manchester) $1,901,927 - M H M M AAC Hereford Street (Manchester- Cambridge) $4,451,273 - M H M M AAC Hereford Street (Montreal-Rolleston) $714,299 - M H M M Canterbury Regional Land Transport Plan
36 ORGANISATION ACTIVITY CLASS PROJECT NAME START YEAR END YEAR TOTAL COST FREIGHT (H,M,L) CHOICE (H,M,L) EARTHQUAKE (H,M,L) SAFETY (H,M,L) SUSTAINABILITY AND RESILIENCE (H,M,L) AAC High Street (Manchester-St Asaph) $2,924,651 - M H M M AAC Kilmore Street (Fitzgerald-Park) twoway conversion $8,414,024 - M H M M AAC Victoria Street $7,083,286 - M H M M AAC slow core TP30k $2,500,000 AAC Riccarton Avenue $4,223,507 Walking and cycling AAC Antigua Street (St Asaph-Moorhouse) $1,935,487 - M H M M Walking and cycling AAC High Street (Hereford-Manchester) $2,796,057 - M H M M Walking and cycling AAC Oxford Terrace (Kilmore-Madras) $96,876 - M H M M Walking and cycling AAC Salisbury Street $6,161,314 - M H M M HIGH PRIORITY INTERSECTION SAFETY IMPROVEMENTS Intersection safety: Aldwins/Buckleys/ Linwood (13) $1,014,000 - L - H - Intersection safety: Aldwins/Ensors/Ferry $4,186,000 - L - H - Intersection safety: Barrington/Lincoln/ Whiteleigh (3) $1,326,000 - L - H - Intersection safety: Bealey/Madras (6) $1,014,000 - L - H - Intersection safety: Bealey/Papanui/ Victoria (14) $1,014,000 - L - H - Intersection safety: Byron/Gasson (11) $1,326,000 - L - H - Intersection safety: Cashel/Fitzgerald (2) $1,014,000 - L - H - Intersection safety: Gasson/ Madras/ Moorhouse (1) $1,014,000 - L - H - Intersection safety: Ilam/ Middleton/ Riccarton (7) $1,014,000 - L - H - Intersection safety: Manchester/ Moorhouse/Pilgrim (5) $1,014,000 - L - H - Intersection safety: Marshland/New Brighton/ North Parade/Shirley (8) $286,000 - L - H - RONS downstream inter safety: Main North Road/ Marshland/ Spencerville (Chaneys) $988,000 L L L H - RONS downstream safety improvements: Sawyers Arms route $442,000 L L L H - NZ Transport Agency for state highways Brougham/Burlington intersection $1,350,000 L L - H - 34 Canterbury Regional Land Transport Plan
37 ORGANISATION ACTIVITY CLASS PROJECT NAME START YEAR END YEAR TOTAL COST FREIGHT (H,M,L) CHOICE (H,M,L) EARTHQUAKE (H,M,L) SAFETY (H,M,L) SUSTAINABILITY AND RESILIENCE (H,M,L) NZ Transport Agency for state highways Pineacres safety improvements $3,300, H L Selwyn District Council Prebbleton Hampton Shands CSM2 upgrades $3,000,000 L L L H L HIGH PRIORITY CYCLE ROUTES Walking and cycling Northern cycle connection: Belfast-Kaiapoi $3,848,000 L H L H H Waimakariri District Council Walking and cycling Kaiapoi-Belfast Cycleway $750,000 L H L H H HIGH PRIORITY PUBLIC TRANSPORT ROUTE AND FACILITY IMPROVEMENTS Public transport infrastructure Core public transport route and facilities: Orbiter $5,200,000 - H L M M Public transport infrastructure Core public transport route and facilities: South-west (Wigram and Halswell) $7,348,640 - H L M M Public transport infrastructure Core public transport route and facilities: South (Colombo Street) $2,190,240 - H L L M Public transport infrastructure Core public transport route and facilities: North (Papanui and Belfast) $1,508,000 - H L L M Public transport infrastructure Public transport facilities: Northlands hub $1,040,000 - H L M M Public transport infrastructure Transitional public transport infrastructure to support hubs and spokes $1,560,000 - H L M M OTHER ROAD-RELATED PROJECTS Intersection improvement: Lower Styx/ Marshland $1,676,267 L L L H M Marshland Road bridge (linked to intersection safety improvement) $5,172,220 L L L M M NZ Transport Agency for state highways Lyttelton tunnel safety retrofit (deluge) system $12,605, H H NZ Transport Agency for state highways Barters/Main South intersection $8,907,700 M L - H - NZ Transport Agency for state highways Ashley to Belfast safety improvements $400, H L NZ Transport Agency for state highways Rakaia to Ashburton safety improvements $3,999, H L NZ Transport Agency for state highways Woodend corridor safety improvements $350,000 - M - M - NZ Transport Agency for state highways State Highway 1 - Rolleston intersection improvements $1,000,000 H - L M M NZ Transport Agency for state highways Halswell Road four-laning $16,939,397 L M L M M NZ Transport Agency for state highways Carmen/Main South minor intersection improvements $1,500,000 M L - M - Selwyn District Council Rolleston State Highway 1 grade separation ,600,000 H - L M M Canterbury Regional Land Transport Plan
38 PRIORITY 4: OTHER IMPROVEMENTS All other improvement projects are included in priority 4. Projects over $5M are deemed as regionally significant and shown in this summary. All other improvement projects with expenditure between $300,000 and $5M are shown by district in Appendix 1. Projects under $300,000 are covered within the minor improvements activities. Access improvements to the Port of Timaru are currently included as being of regional significance under priority 4. Even though the current cost estimates are less than $5M they are regarded as being of regional significance as, as noted earlier, freight demand to the Port of Timaru is expected to grow, and further investigation may result in elevating this project to priority 3. TABLE 4: REGIONALLY SIGNIFICANT PRIORITY 4 PROJECTS ORGANISATION ACTIVITY CLASS PROJECT NAME START YEAR END YEAR TOTAL COST FREIGHT (H,M,L) CHOICE (H,M,L) EARTHQUAKE (H,M,L) SAFETY (H,M,L) SUSTAINABILITY AND RESILIENCE (H,M,L) Ashburton District Council Second Ashburton urban bridge, Ashburton River $27,861,980 L L - L H Ashburton District Council Thompsons Track and Mayfield Valetta Road improvements $15,762,833 L - - H M Network management improvement: Ferry and Moorhouse road widening $9,661,600 M M L H H Lincoln Road widening (Curletts to Wrights) $9,539,920 L M L M M AAC Moorhouse Avenue $9,308,000 - M H M M AAC Bealey Avenue $9,186,493 - M H M M Corridor: Sumner streets and lanes corridor $8,488,980 - L M M L Corridor: Ferry Road corridor $7,546,500 L L L H L Network management improvements: Main North Road corridor $6,344,000 - M L M L AAC Montreal Street (Beveridge-Cambridge) $5,767,064 - M H M M Network management improvements: Blenheim Road-Main South Road $5,512,000 M M M H M Walking and cycling Coastal pathway $9,424,802 - H L M L NZ Transport Agency Enhanced network resilience Canterbury $7,500,000 L - - M H NZ Transport Agency Christchurch to Rolleston alternative route s $5,000,000 M L - - L NZ Transport Agency Walnut Avenue intersection improvements $5,162,538 M L - L - Selwyn District Council Dunns Crossing/ Rolleston State Highway $5,000,000 M - L M M Timaru District Council Timaru Port southern access $4,750,000 L - - L M Waimakariri District Council Western Kaiapoi Arterial $10,000,000 L - M L L 36 Canterbury Regional Land Transport Plan
39 EXPENDITURE AND REVENUE FORECASTS Total public expenditure for Canterbury land transport projects is forecast to be over $4B over the next ten years. Figures 4 and 5 show the distribution of this expenditure by activity class and approved authority, respectively. FIGURE 4: EXPENDITURE BY APPROVED ORGANISATION Waimate District Council (1.47%) Waimakariri District Council (3.22%) Timaru District Council (3.73%) Selwyn District Council (4.61%) Mackenzie District Council (0.85%) Kaikōura District Council (0.33%) Hurunui District Council (2.06%) Environment Canterbury (16.21%) Department of Conservation (Mt Cook) (0.03%) (15.72%) NZTA Canterbury Highway Network (48.42%) Ashburton District Council (3.36%) FIGURE 5: EXPENDITURE BY ACTIVITY CLASS Transport planning (0.21%) Road safety promotion (0.61%) Walking & cycling (2.70%) Public transport (16.12%) Public transport infrstructure (3.96%) Maintenance & operation of local roads (12.34%) Renewal local roads (12.11%) New & improved infrstructure local roads (3.57%) Maintenance & operation of State highways (9.81%) Renewal of State highways (4.50%) New & improved infrastructure for State highways (34.07%) Ten-year expenditure by activity and approved authority is shown in Table 5. The primary sources of revenue for publicly funded transport projects are the NLTF and local Government contributions. Local roads and public transport services are co-funded from the NLTF and local Government, with the respective contributions depending upon the Financial Assistance Rate (FAR) applied by the NZ Transport Agency to each authority. All NZ Transport Agency and New Zealand Police activities are fully funded from the NLTF. NLTF contributions to the ten year expenditure figures are shown in Table 6. Note: Funding for some projects is yet to be finalised; in particular, those Christchurch city projects associated with earthquake recovery are subject to further discussion and consultation. In addition to the activities and funding shown in this Plan, the following activities are funded by local authorities without assistance from the NLTF: y footpath infrastructure maintenance, renewals and improvements y public off-street parking provision, maintenance and enforcement of parking regulations y amenity improvements, landscaping and urban design elements within the street environment. Canterbury Regional Land Transport Plan
40 TABLE 5: TEN-YEAR EXPENDITURE BY ORGANISATION AND ACTIVITY ACTIVITY CLASS WAIMATE DISTRICT COUNCIL WAIMAKARIRI DISTRICT COUNCIL TIMARU DISTRICT COUNCIL SELWYN DISTRICT COUNCIL MACKENZIE DISTRICT COUNCIL KAIKŌURA DISTRICT COUNCIL HURUNUI DISTRICT COUNCIL ENVIRONMENT CANTERBURY DEPT. OF CONSERVATION (MT COOK) CHRISTCHURCH CITY COUNCIL NZ TRANSPORT AGENCY CANTERBURY HIGHWAY NETWORK ASHBURTON DISTRICT COUNCIL Transport planning - - $795,000 $418, $150,000 $3,400,000 - $3,000,000 $820,000 $524,500 Road safety promotion - $1,200,000 $3,051,000 $2,183,000 - $182,000 $597, $13,969,038 - $1,307,080 Walking and cycling - $1,100,000 $650, $193,550,802 - $215,650 Public transport $511,323, Existing $486,251, New $25,072, Public transport infrastructure $23,423, Maintenance and operation of local roads $20,683,404 $60,815,000 $54,075,000 $64,880,000 $15,563,654 $4,990,000 $39,687,634 - $590,500 $184,680,578 - $44,211,491 - Maintenance, operations $20,683,404 $57,815,000 $53,075,000 $64,880,000 $15,563,654 $4,990,000 $39,687,634 - $590,500 $184,680,578 - $43,065,104 - Emergency works - $3,000,000 $1,000, $123,527,137 - $1,146,387 - Network user information Renewal local roads $32,631,187 $49,555,000 $$72,185,000 $56,702,000 $16,199,000 $7,010,000 $37,864,943 - $540,000 $135,911,558 - $78,625,356 New and improved infrastructure local roads $4,451,138 $13,780,000 $15,365,000 $57,045,000 $2,500,000 $800,000 $3,991, ,000,000 - $6,982,250 - Minor improvements $3,556,138 $10,230,000 $15,365,000 $5,945,000 $2,500,000 $500,000 $3,991, $35,000,000 - $6,445,000 - Other $895,000 $3,550,000 - $51,100,000 - $300, $368,306,000 - $537,250 Maintenance and operation of state highways $385,380,870 - Renewal of state highways $176,747,490 - New and improved infrastructure for state highways $1,338,497,233 - Total forecasted expenditure $57,765,729 $126,450,000 $$146,121,000 $181,228,000 $36,762,654 $12,982,000 $82,300,920 $514,723,975 $1,130,500 $631,961,174 $1,901,635,592 $131,866, Canterbury Regional Land Transport Plan
41 TABLE 6: TEN-YEAR EXPENDITURE FROM NATIONAL LAND TRANSPORT FUND ACTIVITY CLASS WAIMATE DISTRICT COUNCIL WAIMAKARIRI DISTRICT COUNCIL TIMARU DISTRICT COUNCIL SELWYN DISTRICT COUNCIL MACKENZIE DISTRICT COUNCIL KAIKŌURA DISTRICT COUNCIL HURUNUI DISTRICT COUNCIL ENVIRONMENT CANTERBURY DEPT. OF CONSERVATION (MT COOK) CHRISTCHURCH CITY COUNCIL NZ TRANSPORT AGENCY CANTERBURY HIGHWAY NETWORK ASHBURTON DISTRICT COUNCIL Transport planning - - $423,150 $221, $76,600 $1,737,400 - $1,512,000 $820,000 $265,045 Road safety promotion - $613,200 $1,624,850 $1,156,990 - $91,560 $305, $7,047,931 - $663,011 Walking and cycling - $561,000 $347, $51,980,000 - $109,382 Public transport $261,185, Existing $264,322, New $12,786, Public transport infrastructure $78,972, Maintenance and operation of local roads $12,125,318 $31,068,260 $28,647,450 $34,386,400 $8,248,737 $2,500,130 $22,277,049 - $590,500 $92,319,142 - $22,430,464 - Maintenance and operations $12,125,318 $29,535,260 - $34,386,400 $8,248,737 $2,500,130 $22,277,049 - $590,500 $92,319, $21,848,837 - Emergency works - $1,533, $581,627 - Network user information Renewal local roads $19,158,225 $25,320,500 $39,302,240 $30,052,060 $8,584,270 $3,511,870 $19,347,420 - $540,000 $68,136,157 - $39,869,261 New and improved infrastructure local roads $2,593,230 $7,047,300 $8,202,550 $30,233,850 $1,325,000 $403,500 $2,038, $17,640,000 - $3,541,448 - Minor improvements $2,084,730 $5,227,300 $8,202,550 $3,150,850 $1,325,000 $250,500 $2,038, $17,640,000 $26,497,233 $3,268,950 - Other $508,500 $1,820,000 - $27,083,000 - $153, $1,312,000,000 $272,498 Maintenance and operation of state highways $385,380,870 - Renewal of state highways $176,747,490 - New and improved infrastructure for state highways $1,338,497,233 - Total forecasted expenditure $33,876,772 $64,610,260 $78,547,740 $96,050,840 $19,483,007 $6,507,060 $42,045,042 $325,219,774 $1,130,500 $310,447,080 $1,901,635,592 $66,878,610 Canterbury Regional Land Transport Plan

42 Aaron Campbell Photography 40 Canterbury Regional Land Transport Plan
43 MONITORING AND PERFORMANCE INDICATORS The performance of the activities included this Plan will be assessed by monitoring the indicators and targets contained in Table 7. The 2024 and 2042 targets are consistent with those shown in the 2012 RLTS. TABLE 7: OUTCOMES AND PERFORMANCE MEASURES OUTCOME PERFORMANCE INDICATOR 2024 TARGETS 2042 TARGETS LEAD AGENCY OBJECTIVE 1: A LAND TRANSPORT NETWORK THAT ADDRESSES CURRENT AND FUTURE TRANSPORT DEMAND Roads are maintained to a level that is fit for purpose. Travel times and travel time reliability for freight and passenger trips are maintained at current levels outside of greater Christchurch. Strategic freight routes are suitable for HPMVs. Within greater Christchurch, the percentage of peak trips made by cycle or bus is increased. Within greater Christchurch the total number of trips made by cycle or bus is increasing. Average travel time reliability is maintained at 15% or better in greater Christchurch. To be developed in conjunction with ONRC. Level of service on sample of key routes outside greater Christchurch. Travel time variability on sample of intra-regional and inter-regional freight routes. Percentage of strategic freight routes suitable for HPMVs. To be developed in conjunction with NZ Transport Agency. Peak cycle mode share for all trip legs - greater Christchurch. Peak public transport mode share for all trip legs - greater Christchurch. To be developed. To be developed. NZ Transport Agency, district councils. Level of service C or better is maintained over life of Plan. No increase over Level of service C or better is maintained over life of Plan. No increase over NZ Transport Agency/RCAs via annual survey conducted by Environment Canterbury. Regional Council - via extension of NZ Transport Agency Travel Time Survey methodology. 100%. 100%. NZ Transport Agency. To be developed. To be developed. To be developed. To be developed. Total number of cycle and bus trips. To be developed. To be developed. Travel time variability on strategic road network within greater Christchurch - AM and PM peak. Travel time variability on strategic road network within greater Christchurch - inter-peak. Less than 15% variability by Less than 10% variability by Less than 15% variability by Less than 10% variability by OBJECTIVE 2: A LAND TRANSPORT SYSTEM THAT IS INCREASINGLY FREE FROM DEATH AND SERIOUS INJURY Fewer deaths and serious injuries. Deaths per annum on regions' roads. Serious injuries per annum on regions' roads. Not more than 30 per annum. Not more than 250 per annum. Not more than 25 per annum. Not more than 200 per annum. Fewer crashes. Total crashes per annum. To be developed. To be developed. OBJECTIVE 3: THE CANTERBURY EARTHQUAKES RECOVERY IS SUPPORTED Repair of horizontal infrastructure is delivered in accordance with timetables and standards contained in infrastructure recovery plans and the costsharing agreement with Government. Transport infrastructure supports the redevelopment of central Christchurch. The provision of transport infrastructure and services support the objectives and policies of the Canterbury Earthquake Land Use Recovery Plan. Percentage of road repairs completed. Lane kilometres of road repairs completed. Percentage of repairs completed to time frames and standards in recovery plans. Percentage of AAC transport projects completed. Measure to be developed in conjunction with LURP reporting and review. Possibly biennial evaluation report). To be developed. 100%. To be developed. 100%. To be developed. To be developed. Regional Council - via analysis of Ministry of Transport HTS data. Regional Council - via analysis of Ministry of Transport HTS data. Regional Council - via analysis of Ministry of Transport HTS data. NZ Transport Agency/Environment Canterbury/ - Christchurch Travel Time Surveys. NZ Transport Agency/Environment Canterbury/ - Christchurch Travel Time surveys. NZ Transport Agency - to supply Regional Council with annual data. NZ Transport Agency - to supply Regional Council with annual data. NZ Transport Agency - to supply Regional Council with annual data., Waimakariri District Council., Waimakariri District Council, Waimakariri District Council. To be developed. 100%.. To be developed. To be developed. Regional Council. Canterbury Regional Land Transport Plan
44 OUTCOME PERFORMANCE INDICATOR 2024 TARGETS 2042 TARGETS LEAD AGENCY OBJECTIVE 4: THE LAND TRANSPORT NETWORK IS RESILIENT AND SUPPORTS LONG-TERM SUSTAINABILITY Infrastructure and services are more resilient to disruption from acute events such as natural hazards or crashes. Long-term sustainability issues are fully incorporated into transport planning decisions: energy efficiency. Long-term sustainability issues are fully incorporated into transport planning decisions: climate change. Long-term sustainability issues are fully incorporated into transport planning decisions: Ageing population. Long-term sustainability issues are fully incorporated into transport planning decisions: public health. Transport infrastructure and services are integrated with and support land use and development patterns, contained in the RPS and district plans. Number of events that close the strategic road network and the number of hours to resolve them. Total petrol sales per capita. Total diesel sales/regional GDP. Tonnes of CO2 from domestic land transport per capita. Number of public transport trips made by people aged 65+. Number of trips made by active travel modes. Average trip length for all trips - Canterbury region. Percentage of households in urban areas within ten minutes walk of a key activity centre. Percentage of households in greater Christchurch within 30 minutes of public transport trip or ten minutes walk/cycle trip of a key activity centre. To be developed. Less than 600 litres per capita by Reduce to 22 litres/$1,000 GDP. Return to 1998 levels 1.45M tonnes per annum To be developed. Less than 500 litres per capita by Reduce to 20 litres/$1,000 GDP. Halve by 2040 from 2007 levels M tonnes per annum NZ Transport Agency, district councils. To be developed. To be developed. Regional Council. To be developed. To be developed. To be developed. To be developed. To be developed. To be developed. To be developed. To be developed. OBJECTIVE 5: INVESTMENT IN LAND TRANSPORT INFRASTRUCTURE AND SERVICES IS EFFICIENT All agencies involved in the provision of infrastructure and services will ensure expenditure is efficient and strive for productivity improvements. NZ Transport Agency will monitor and report on the efficiency of NLTF expenditure in Canterbury. Annual assessment and report by NZ Transport Agency to RTC. Annual assessment and report by NZ Transport Agency to RTC. N/A. N/A. Regional Council, with fuel sales data supplied quarterly by Christchurch City Council, Waimakariri District Council and Timaru District Council. Environment Canterbury - via Infometrics Regional GDP data and TA fuel sales data. Regional Council, with fuel sales data supplied quarterly by Christchurch City Council, Waimakariri District Council and Timaru District Council. Regional Council - via analysis of Ministry of Transport HTS data/other travel diary data. Regional Council - via analysis of Ministry of Transport Household Travel Survey (HTS) data. Regional Council - via accessibility modelling that is updated biannually to reflect walking network changes Regional Council - via accessibility modelling that is updated biannually to reflect PT, cycle and walking network changes. NZ Transport Agency, district councils, Regional Council. N/A. N/A. NZ Transport Agency. Monitoring implementation of the Plan The implementation of the Plan will be monitored and reported to RTC no less than annually. Reporting will include: y actual versus planned expenditure for all regionally significant activities y actual versus planned expenditure for each approved authority y actual versus planned project and programme delivery for all regionally significant activities. 42 Canterbury Regional Land Transport Plan
45 APPENDICES Appendix 1: Regional programme details The full regional programme is shown in the following tables. This includes projects that are not regionally significant but provide local benefit and are under $5M. TABLE 8: PROJECT INFORMATION BY APPROVED AUTHORITY PRIORITY ACTIVITY CLASS PROJECT NAME 3 Northcote Road (four-laning) 2014Aaron 2016 Campbell $7,361,162 Photography START YEAR END YEAR TOTAL COST FOR ALL YEARS ASHBURTON DISTRICT COUNCIL 1 Transport planning Transport planning $524,500 1 Road safety promotion Road safety promotion $1,307,080 1 Maintenance and operation of local roads Maintenance and operation of local roads $44,211,491 1 Renewal of local roads Renewal of local roads $78,625,356 1 Local road improvements (minor improvements) $6,445,000 4 Walnut Avenue intersection improvement $2,100,000 4 Second Ashburton urban bridge, Ashburton River $27,861,980 4 Thompsons Track and Mayfield Valetta Road improvements $15,762,833 4 Park Street extension $400,000 4 Tinwald corridor associated improvement $150,000 4 Land purchase, Ashburton second urban bridge $860,000 CHRISTCHURCH CITY COUNCIL 1 Transport planning Transport planning $3,000,000 1 Road safety promotion Road safety promotion $13,969,038 1 Public transport infrastructure Public transport infrastructure $23,423,000 1 Maintenance and operation of local roads Maintenance and operation of local roads $439,290,471 1 Renewal of local roads Renewal of local roads $258,863,316 1 Local road improvements (minor improvements) $35,000,000 2 Wigram Magdala link $26,270,141 2 Cranford Street upgrade $19,455,828 2 Northern arterial extension $39,408,849 2 Ferrymead Bridge replacement and improvement $9,378,608 2 Walking and cycling Major cycleway: Papanui parallel (Grassmere route-papanui to city) $10,849,112 2 Walking and cycling Major cycleway: Rapanui-Shag Rock (Sumner to city) $21,145,053 2 Walking and cycling Major cycleway: Uni-Cycle (University to city) $9,623,488 2 Walking and cycling Major cycleway: Little River link (Little River route) $4,875,172 2 Walking and cycling Major cycleway: Nor'West Arc (western inner orbital) $21,133,734 2 Walking and cycling Major cycleway: Southern Lights (south to city) $2,070,622 2 Walking and cycling Major cycleway: Wheels to Wings (airport route) $12,372,880 2 Walking and cycling Major cycleway: Northern Line (northern rail route-belfast to Riccarton) $6,748,786 2 Walking and cycling Major cycleway: South Express (Hornby rail-templeton to city) $4,016,192 2 Walking and cycling Major cycleway: Quarryman's Trail (Halswell to city) $17,822,621 2 Walking and cycling Major cycleway: Otakaro (Avon River route-new Brighton to city) $21,935,880 2 Walking and cycling Major cycleway: Opawaho River route (Heathcote River trail) $17,102,873 2 Walking and cycling Major cycleway: Heathcote expressway (Heathcote rail route-city) $13,085,159 3 Annex/Birmingham/Wrights route upgrade $11,351,260 3 Intersection improvement: Belfast/Marshland intersection $1,826,436 3 Intersection improvement: Greers/Northcote/Sawyers Arms $5,109,763 Canterbury Regional Land Transport Plan
46 PRIORITY ACTIVITY CLASS PROJECT NAME START YEAR END YEAR TOTAL COST FOR ALL YEARS 3 RONS downstream inter improvements: Cranford Street downstream $8,875,000 3 RONS downstream inter improvements: Sawyers Arms/Waimakariri $1,014,000 3 RONS downstream intersection improvements: Memorial/Orchard $1,014,000 3 RONS downstream route improvement: Marshland-QEII-Shirley $1,014,000 3 RONS downstream route improvements: Harewood Road $442,000 3 RONS downstream route improvements: Cotswold Avenue $182,000 3 AAC Armagh Street (Durham-Montreal) $2,047,743 3 AAC central city: Wayfinding $9,463,040 3 AAC Colombo Street (Bealey-Kilmore) $2.397,071 3 AAC Colombo Street (St Asaph-Moorhouse) $3,029,994 3 AAC Ferry Rd (St Asaph-Fitzgerald) $1,885,422 3 AAC Hereford Street (Cambridge-Montreal) $1,494,474 3 AAC Hereford Street (Madras-Manchester) $1,901,927 3 AAC Hereford Street (Manchester-Cambridge) $4,451,273 3 AAC Hereford Street (Montreal-Rolleston) $714,299 3 AAC High Street (Manchester-St Asaph) $2,924,651 3 AAC Cashel Street (Cambridge-Montreal) $1,302,013 3 AAC Madras street (Kilmore-Lichfield) $3,671,959 3 AAC Kilmore Street (Fitzgerald-Park) two-way conversion $8,414,024 3 AAC Victoria Street $7,083,286 3 Walking and cycling AAC Antigua Street (St Asaph-Moorhouse) $2,935,487 3 Walking and cycling AAC High Street (Hereford-Manchester) $2,796,057 3 Walking and cycling AAC Oxford Terrace (Kilmore-Madras) $96,876 3 Walking and cycling AAC Salisbury Street $6,161,314 3 AAC Slow core TP30k $2,500,000 3 AAC Riccarton Avenue $4,223,507 3 Intersection safety: Aldwins/Buckleys/Linwood (13) $1,014,000 3 Intersection safety: Aldwins/Ensors/Ferry $4,186,000 3 Intersection safety: Barrington/Lincoln/Whiteleigh (3) $1,326,000 3 Intersection safety: Bealey/Madras (6) $1,014,000 3 Intersection safety: Bealey/Papanui/Victoria (14) $1,014,000 3 Intersection safety: Byron/Gasson (11) $1,326,000 3 Intersection safety: Cashel/Fitzgerald (2) $996,938 3 Intersection safety: Clarence/Riccarton/Straven $286,000 3 Intersection safety: Gloucester/Stanmore $286,000 3 Intersection safety: Gasson/Madras/Moorhouse (1) $1,014,000 3 Intersection safety: Ilam/Middleton/Riccarton (7) $1,014,000 3 Intersection safety: Manchester/Moorhouse/Pilgrim (5) $1,014,000 3 Intersection safety: Marshland/New Brighton/North Parade/Shirley (8) $286,000 3 RONS downstream inter safety: Main North Road/Marshland/ Spencerville (Chaneys) $988,000 3 RONS downstream safety improvements: Sawyers Arms route $442,000 3 Safety improvements: Guardrails new assets $4,680,000 3 Walking and cycling Local cycleway: Northern cycle connection: Belfast-Kaiapoi $3,848,000 3 Public transport infrastructure Core public transport route and facilities: Orbiter $5,200,000 3 Public transport infrastructure Core public transport route and facilities: South-west (Wigram and Halswell) $7,348,640 3 Public transport infrastructure Core public transport route and facilities: South (Colombo Street) $2,190,240 3 Public transport infrastructure Core public transport route and facilities: North (Papanui and Belfast) $1,508,000 3 Public transport infrastructure Public transport facilities: Northlands hub $1,040, Canterbury Regional Land Transport Plan
47 PRIORITY ACTIVITY CLASS PROJECT NAME 3 Public transport infrastructure Transitional public transport infrastructure to support hubs and spokes START YEAR END YEAR TOTAL COST FOR ALL YEARS $1,560,000 3 Public transport infrastructure Public transport facilities $3,796,000 3 Intersection improvement: Lower Styx/Marshland $1,676,267 3 Marshland Road bridge (linked to intersection safety improvement) $5,172,220 3 RONS downstream safety improvements: Sawyers Arms pedestrian crossing $487,272 3 Walking and cycling Belfast Park: Cycle/pedestrian rail underpass $1,261,000 4 Network management improvement: Ferry and Moorhouse Road widening $9,661,600 4 Lincoln Road widening (Curletts to Wrights) $9,539,920 4 AAC Moorhouse Avenue $9,308,000 4 AAC Bealey Avenue $9,186,493 4 Corridor: Sumner streets and lanes corridor $8,488,980 4 Corridor: Ferry Road corridor $7,546,500 4 Network management improvements: Main North Road corridor $6,344,000 4 AAC Montreal Street (Beveridge-Cambridge) $5,767,064 4 Network management improvements: Blenheim Road-Main South Road $5,512,000 4 Awatea route upgrade $2,009,111 4 Halswell Junction Road extension $4,855,500 4 Wigram Road extension-halswell Junction to Marshs $2,786,234 4 Wigram Road upgrade $1,392,862 4 Intersection improvement: Curries/Tanner $520,000 4 Intersection improvement: Ferry/Humphries/Main $182,000 4 Intersection improvement: Ferry/Moorhouse/Wilsons $702,000 4 Intersection improvement: Highsted/Sawyers Arms $2,288,000 4 Intersection improvement: Clyde/Riccarton/Wharenui $680,160 4 Network management improvements: Dunbars Road $728,000 4 Intersection improvement: Deans/Moorhouse $520,000 4 Intersection improvement: Matipo/Riccarton $1,014,000 4 Inner Harbour Road improvements (Lyttelton-Diamond Harbour) $2,769,520 4 Intersection improvements: Blenheim/Foster/Mandeville $26,000 4 Intersection improvements: Blenheim/Hansons $26,000 4 Intersection improvements: Blenheim/Wharenui $26,000 4 New links: Main South Road to CB2/ $2,080,000 4 Intersection improvement: Cranford/Main North $702,000 4 RONS downstream intersection safety: Orchard/Wairakei (29) $1,014,000 4 Network management improvement: Waterloo Park $832,000 4 Network management improvements: Halswell Junction Road $936,000 4 New links: Halswell Junction Road to Connaught $1,040,000 4 Corridor: Edgeware corridor $3,043,040 4 Corridor: Linwood corridor $920,400 4 Corridor: Main North Road corridor $2,568,000 4 Corridor: New Brighton corridor $4,329,000 4 Corridor: Selwyn Street corridor $490,178 4 Intersection improvements: Memorial/Roydvale $416,000 4 Intersection safety: Barbadoes/Bealey (16) $1,014,000 4 Intersection safety: Durham/Moorhouse (20) $1,014,000 4 Intersection safety: Falsgrave/Fitzgerald/Moorhouse (21) $1,014,000 4 RONS downstream intersection safety: Cotswold/Sawyers Arms $702,000 Canterbury Regional Land Transport Plan
48 PRIORITY ACTIVITY CLASS PROJECT NAME START YEAR END YEAR TOTAL COST FOR ALL YEARS 4 RONS downstream route improvements: Cotswold Avenue $182,000 4 Intersection improvement: Harewood/Main North/Papanui $1,066,000 4 Intersection improvement: Burwood/Mairehau $1,114,839 4 Intersection improvement: Greers/Harewood $1,319,760 4 Intersection improvement: Harewood/Railway $442,000 4 Intersection improvement: Harewood/Stanleys $416,000 4 Intersection safety: Blenheim/Matipo (24) $1,014,000 4 Intersection safety: Cavendish/Styx Mill (28) $702,000 4 Intersection safety: Fitzgerald/Hereford (17) $1,014,000 4 Intersection safety: Hills/North Avon (25) $1,326,000 4 Intersection safety: Moorhouse/Selwyn (22) $1,014,000 4 Intersection safety: Riccarton/Waimairi (18) $286,000 4 Intersection safety: Cashmere/Centaurus/Colombo/Dyers Pass (260) $1,752,988 4 Safety improvements: Guardrails-Dyers Pass Road $1,716,000 4 Intersection safety: Ferry/St Johns $338,000 4 Route improvements : Old Main North Road $416,000 4 AAC Montreal Street (Bealey-Beveridge and St Asaph-Moorhouse) $2,702,769 4 AAC Gloucester Street (Oxford-Montreal) $2,475,002 4 AAC Gloucester Street (Manchester-Colombo) $1,992,775 4 AAC Rolleston Avenue (Hereford-Armagh) $1,262,061 4 AAC central city connecting roads and lanes $1,081,280 4 AAC Park Terrace $1,040,000 4 Intersection safety: Bealey/Manchester (15) $1,014,000 4 Intersection safety: Deans/Riccarton/Riccarton (31) $1,014,000 4 AAC Gloucester Street (Madras-Manchester) $961,584 4 AAC Worcester Street (Oxford-Montreal) $846,050 4 AAC Worcester Street (Montreal-Rolleston) $782,758 4 AAC Durham Street (Tuam-St Asaph) $765,966 4 AAC Montreal Street (Cambridge-Tuam) $765,966 4 AAC Montreal Street (Tuam-St Asaph) $765,966 4 AAC Armagh Street (Manchester-Colombo) $759,077 4 RONS downstream intersection improvements: Crofton/Sawyers $702,000 4 AAC Cambridge Terrace (Montreal-Rolleston) $531,383 4 AAC Chester Street (Madras-Oxford) $520,978 4 AAC Lichfield Street (Madras-Manchester) $443,118 4 AAC Rolleston Avenue (Cambridge-Hereford) $373,726 4 AAC Cambridge Terrace (Kilmore-Barbadoes) $279,864 4 AAC Armagh Street (Montreal-Park) $215,280 4 AAC Chester Street (Cranmer-Park) $183,706 4 AAC Chester Street (Durham-Cranmer) $101,899 4 Walking and cycling Coastal pathway $9,424,802 4 Walking and cycling AAC Cashel Street (Manchester-Cambridge) $4,620,483 4 Walking and cycling Local cycleway: Development connections-north $2,288,000 4 Walking and cycling Local cycleway: Development connections-east $4,368,000 4 Walking and cycling Local cycleway: Development connections-south $4,368,000 4 Walking and cycling Local cycleway: Development connections-west $2,288,000 4 Walking and cycling Local cycleway: Northern arterial link Cranford-Rutland Reserve $1,040, Canterbury Regional Land Transport Plan
49 PRIORITY ACTIVITY CLASS PROJECT NAME START YEAR END YEAR TOTAL COST FOR ALL YEARS DEPARTMENT OF CONSERVATION (MT COOK) 1 Maintenance and operation of local roads Maintenance and operation of local roads $590,500 ENVIRONMENT CANTERBURY 1 Transport planning Transport planning $3,400,000 1 Public transport (existing) Public transport (existing) $486,584,660 4 Public transport (new) Public transport (new) $25,072,137 HURUNUI DISTRICT COUNCIL 1 Transport planning Transport planning $150,000 1 Road safety promotion Road safety promotion $597,110 1 Maintenance and operation of local roads Maintenance and operation of local roads $39,687,634 1 Renewal of local roads Renewal of local roads $37,864,943 1 Local road improvements (minor improvements) $3,991,233 KAIKŌURA DISTRICT COUNCIL 1 Road safety promotion Road safety promotion $182,000 1 Maintenance and operation of local roads Maintenance and operation of local roads $4,990,000 1 Renewal of local roads Renewal of local roads $7,010,000 1 Local road improvements (minor improvements) $500,000 MACKENZIE DISTRICT COUNCIL 1 Maintenance and operation of local roads Maintenance and operation of local roads $15,563,654 1 Renewal of local roads Renewal of local roads $16,199,000 1 Local road improvements (minor improvements) $2,500,000 NZ TRANSPORT AGENCY 1 Transport planning Transport planning $820,000 1 Maintenance and operation of state highways Maintenance and operation of state highways $385,380,870 1 Renewal of state highways Renewal of state highways $176,747,490 1 for state highways State highway minor improvements $26,497,233 2 for state highways Christchurch northern arterial rural with QEII $214,379,715 2 for state highways Christchurch southern motorway Halswell Junction Road-Rolleston (stages 2 and 3) $256,575,401 2 for state highways Harewood Road to Yaldhurst Road four-laning $75,140,981 2 for state highways Western Belfast bypass $121,750,000 2 for state highways Mingha Bluff to Rough Creek $21,800,000 2 for state highways Groynes to Sawyers Arms Road $42,300,000 3 for state highways Brougham Street corridor improvements $12,500,000 3 for state highways Pineacres safety improvements $3,300,000 3 for state highways Brougham/Burlington intersection $1,350,000 3 for state highways Lyttelton tunnel safety retrofit (deluge) system $12,605,000 3 for state highways Barters/Main South intersection $8,907,700 3 for state highways Ashley to Belfast safety improvements $400,000 3 for state highways Rakaia to Ashburton safety improvements $3,999,600 3 for state highways Woodend corridor safety improvements $350,000 3 for state highways State Highway 1-Rolleston intersection improvements $1,000,000 3 for state highways Halswell Road four-laning $16,939,397 3 for state highways Carmen/Main South minor intersection improvements $1,500,000 4 for state highways Western corridor improvements $3,001,000 4 for state highways HPMV T2 Darfield to Lyttelton $450,000 4 for state highways Ashburton intersection improvements 2018/ /22 $800,000 4 for state highways Bridge Street to Waimataitai Street four-laning 2019/ /21 $1,490,000 4 for state highways Christchurch to Rolleston alternative route 2018/ /21 $5,000,000 4 for state highways Enhanced network resilience Canterbury $7,500,000 Canterbury Regional Land Transport Plan
50 PRIORITY ACTIVITY CLASS PROJECT NAME START YEAR END YEAR TOTAL COST FOR ALL YEARS 4 for state highways Hilton Highway four-laning 2019/ /21 $4,800,000 4 for state highways Leadleys Road right turn bay Delivered as minor improvements for state highways Main South/Aylesbury intersection 2018/ /20 $1,500,000 4 for state highways Marshand to Burwood median barrier 2019/ /21 $4,000,000 4 for state highways State Highway 1 Kaikōura coast resilience project 2018/ /22 $2,850,000 4 for state highways State Highway 74/Scruttons 2019/ /20 $2,844,000 4 for state highways State Highway 77/Park Street int TS 2018/ /21 $1,710,000 4 for state highways State Highway 82 Elephant Hill Stream bridge 2019/ /21 $3,446,000 4 for state highways Timaru intersection improvements 2019/ /21 $1,760,000 4 for state highways Waimataitai to Te Weka four-laning 2019/ /20 $4,920,000 4 for state highways Walnut Avenue intersection improvements 2018/ /21 $5,162,538 4 for state highways Washdyke Creek bridge 2019/ /20 $1,700,000 4 for state highways West Melton to Darfield passing opp 2019/ /21 $1,270,000 4 for state highways Yaldhurst to West Melton passing opp 2019/ /21 $1,170,000 4 Transport planning Christchurch network operating plan implementation 2015/ /16 $50,000 4 Transport planning State Highway 1 Christchurch to Dunedin corridor (Christchurch section) 2015/ /17 $200,000 4 Transport planning State Highway 73/76 West Melton tunnel 2015/ /16 $250,000 4 Transport planning State Highway 75 Halswell Road corridor 2016/ /17 $100,000 4 Transport planning State Highway 1 and 71 Picton to Christchurch (NRR22) 2015/ /17 $150,000 4 Transport planning Strategic transport model updating 2014/ /19 $115,000 4 Transport planning Weigh right facilities Canterbury 2016/ /18 $560,898 SELWYN DISTRICT COUNCIL 1 Transport planning Transport planning $418,000 1 Road safety promotion Road safety promotion $2,183,000 1 Maintenance and operation of local roads Maintenance and operation of local roads $64,880,000 1 Renewal of local roads Renewal of local roads $56,702,000 1 Local road improvements (minor improvements) $57,045,000 3 Prebbleton Hampton Shands CSM2 upgrades $3,000,000 3 Prebbleton Blakes Shands CSM2 upgrades $3,500,000 3 Rolleston State Highway 1 grade separation $31,600,000 4 Dunns Crossing/Rolleston State Highway $5,000,000 4 Tennyson/Brookside Rolleston State Highway $2,500,000 4 Prebbleton Hampton Springs CSM2 upgrades $2,000,000 4 Prebbleton Trents upgrade CSM2 upgrades $500,000 TIMARU DISTRICT COUNCIL 1 Transport planning Transport planning $795,000 1 Road safety promotion Road safety promotion $3,051,000 1 Maintenance and operation of local roads Maintenance and operation of local roads $53,075,000 1 Renewal of local roads Renewal of local roads $72,185,000 1 Local road improvements (minor improvements) $15,365,000 2 Factory Road bridge $3,589,000 4 Walking and cycling New cycleways $300,000 4 Timaru Port southern access $4,750,000 4 Washdyke industrial area road upgrades $2,700,000 4 Arowhenua Road upgrade $2,800,000 4 Washdyke new local roads-land purchase $300,000 4 Brenton Road reconstruction $890,000 4 Orari Station Road upgrade $300, Canterbury Regional Land Transport Plan
51 PRIORITY ACTIVITY CLASS PROJECT NAME START YEAR END YEAR TOTAL COST FOR ALL YEARS 4 Rangitata Island Road improvement $800,000 4 Rangitata Island Road improvement $400,000 4 Orari Back Road seal extension $800,000 WAIMAKARIRI DISTRICT COUNCIL 1 Road safety promotion Road safety promotion $1,200,000 1 Maintenance and operation of local roads Maintenance and operation of local roads $60,815,000 1 Renewal of local roads Renewal of local roads $49,555,000 1 Local road improvements (minor improvements) $10,230,000 3 Walking and cycling Kaiapoi to Belfast Cycleway $750,000 4 Western Kaiapoi Arterial $10,800,000 4 Townsend Road $1,500,000 4 Southbrook Road/South Belt intersection upgrade $965,000 4 Kaiapoi Pa Road upgrade $750,000 4 Thongcaster Road (Depot Road to Browns Rock Road) improvements $1,000,000 WAIMATE DISTRICT COUNCIL 1 Maintenance and operation of local roads Maintenance and operation of local roads $20,683,404 1 Renewal of local roads Renewal of local roads $32,631,187 1 Local road improvements (minor improvements) $3,556,138 Approved variations to the Canterbury RLTP 2015 since its adoption CHRISTCHURCH CITY COUNCIL 29 May 2015 Main North Road Corridor Optimisation 2015/ /16 $800, Aug 2015 Transport planning Christchurch Transport Model and CAST model update 2015/ /16 $231,280 ENVIRONMENT CANTERBURY 28 Aug 2015 Public Transport Public Transport Shelters and Facilities 2015/ /18 $1,774, Aug 2015 Public Transport Real Time Information replacement 2016/ /17 $2,500,000 NEW ZEALAND TRANSPORT AGENCY 29 May 2015 Transport planning Activity Management Plan Canterbury 2015/ / /19 $700, May 2015 for SH Broughs Road Extension 2014/ /17 $4,830, May 2015 Walking and cycling Ashburton River Bridge Pedestrian and Cycle Improvements 2016/ /17 $1,490,000 4 Dec 2015 State Highway Improvements SH7 Waipara to Waikari Safety Improvements 2015/ /18 $3,000,000 TIMARU DISTRICT COUNCIL 29 April 2016 Accelerated renewal street lighting LED conversion project 2016/ /19 $390,000 WAIMAKARIRI DISTRICT COUNCIL 29 May 2015 Walking and cycling Rangiora Kaiapoi Cycleway 2015/ /18 $1,050, May 2015 Walking and cycling Rangiora Woodend Cycleway 2015/ /18 $500,000 (These approved variations are noted in the minutes of the Canterbury Regional Transport Committee on the dates noted. Minutes can be found at Canterbury Regional Land Transport Plan
52 Appendix 2: Significance policy Each regional transport committee must, in accordance with section 106(2) of the Act, adopt a policy that determines significance in respect of variations it wishes to make to its RLTP as provided for by section 18D of the Act and the activities that are included in the plan under section 16. If good reason exists to do so, a regional transport committee may prepare a variation to its RLTP during the period to which it applies. A variation may be prepared by a regional transport committee: i. at the request of an approved organisation or the transport agency ii. on the regional transport committee s own motion. Consultation is not required for any variation to the RLTP that is not significant in terms of this Significance Policy. The Significance Policy is defined below. Variations are considered significant if: An improvement activity is large or of strategic importance. These are activities with an estimated construction cost (including property) exceeding $5M and/or that have significant effect on the objectives in this Plan or have significant network, economic or land use implications or impact on other regions. Activities relating to local road maintenance, local road renewals, local road minor capital works, and existing public transport services valued at over $5M or 20 per cent of the total value of the activity class for the relevant authority, whichever is the larger. Removal of activities within the programmes identified as priority 2 or 3 which would individually or collectively reduce programme expenditure by more than 20 per cent over the six years of this Plan. Any other activity that the regional transport committee resolves as being regionally significant. For the avoidance of doubt, the following variations to the RLTP are considered not significant for purposes of consultation: i. Addition of an activity or combination of activities that has previously been consulted on in accordance with section 18 of the Act. ii. A scope change to an activity that, when added to all previous scope changes for the same activity, varies by less than $5M from its cost as shown in the current NLTP and does not materially change the objective(s) and proposed outcomes of the activity. iii. Replacement of activities within an approved programme or group with activities of the same type and general priority. iv. Funding requirements for preventative maintenance and emergency reinstatement activities. v. For improvement projects variations to timing, cash flow or total cost resulting from costs changes. vi. End-of-year carry-over of allocations. vii. Addition of the investigation or design phase of a new activity which has not been previously consulted upon in accordance with section 18 of the Act. viii. Variations to timing of activities if sufficient reasoning is provided for the variation and the variation does not substantially alter the balance. For activities included in the Plan, section 16(3)(d) of the LTMP requires the Plan to show the order priority for all activities identified by the regional transport committee as significant. The policy for determining significance for 16(3)(d) is that projects are deemed regionally significant if they are: priority 1, 2 or 3 activities priority 4 activities and have a total cost of over $5M any other activity that the regional transport committee resolves as being regionally significant. 50 Canterbury Regional Land Transport Plan
53 Appendix 3: Assessment of compliance with LTMA section 14 Section 16(6) of the LTMA requires the inclusion of an assessment of how the Plan complies with section 14 of the Act. The following outlines how this requirement has been met. An RLTP must contribute to the purpose of the LTMA which is to contribute to an effective, efficient, and safe land transport system in the public interest (section 3, LTMA). This purpose is reflected in the objectives of this Plan and the prioritisation process and the resulting statement of priorities. In addition, the NZ Transport Agency and approved authorities provide assessments of effectiveness and efficiency in submitting projects for funding. Safety is explicitly included as an objective in the Plan. An RLTP must be consistent with the GPS which has been incorporated in the development of this Plan and referenced at numerous points. There is also a significant degree of overlap between the objectives of the GPS and this Plan. The RTC must have considered alternative regional land transport objectives that would contribute to the purpose of the LTMA, and the feasibility and affordability of those alternative objectives. The development of the consultation draft took account of the existing 2012 RLTS and the objectives within that. An ILM process was also completed and provided consideration of alternatives and their feasibility. The public notification, submissions and hearings provided further opportunity for consideration of alternative objectives. The RLTP must take into account any: NEECS relevant NPS and any relevant RPSs or plans that are, for the time being, in force under the RMA likely funding from any source. The Plan supports the NEECS through the objectives of improving transport choice and improving resilience and longterm sustainability, and the assessment of regional priorities in the Plan. Similarly, the relevant sections of the Canterbury RPS and district plans are reflected in the projects put forward in this Plan and the respective priorities applied. All likely funding sources have been taken into account and are identified within this Plan. Appendix 4: Assessment of the relationship of Police activities to the RLTP Section 16(6) of the LTMA requires the inclusion of an assessment of the relationship of Police activities to the RLTP. Police in Canterbury are bound by the New Zealand Police Statement of Intent 2014/15 to 2017/18, which establishes the strategic programme of works for the Police and aligns with the Government priorities of reducing death and injuries on our roads. New Zealand s road safety strategy, Safer Journeys, provides a focus for road policing. This strategy has led to the introduction of a range of measures to promote a safe road system which will reduce the number of deaths and injuries on the roads. The New Zealand Police receives annual Government funding of around $300M for road safety work. In the Canterbury Police district, which does not include Kaikōura, Police have identified the following as priorities: speeding drink/drug driving restraint use intersections. The Police work with other transport sector agencies, including the Road Safety Trust and local authorities to co-ordinate delivery of programmes. In Canterbury local authorities, the Police and other partner agencies develop annual road safety action plans and regularly report against these plans. The New Zealand Police were invited to provide a summary of expenditure for the Canterbury district to include in this Plan, but declined to do so. Canterbury Regional Land Transport Plan
54 Appendix 5: Summary of consultation The Draft RLTP was developed with input from district council staff, the NZ Transport Agency and the New Zealand Police. It took into account relevant existing public documents as required by the LTMA. Where appropriate, the aspirations and targets of the existing 2012 Canterbury RLTS have been incorporated. The Plan was approved for consultation by the RTC on 23 December 2014 and was open for submissions from 21 January-20 February A total of 53 submissions were received. Hearings were held at Rolleston on 4 March 2015 to hear the ten submitters who wished to be heard. The Hearing Panel consisted of Commissioner Mr Rex Williams (Chair), Mayor David Ayers, Cr Kerry Stevens, Cr Phil Clearwater, Mr Jim Harland and Cr Derek Milton. The Hearing Panel decisions were recommended to the RTC on 30 March 2015 and approved by Environment Canterbury in April The Hearing Panel s report is available on the Environment Canterbury website. Appendix 6: Legislative requirements The following extracts from the LTMA outline the key requirements with respect to regional land transport plans. Section 14 - core requirements of regional land transport plans Before a regional transport committee submits a regional land transport plan to a regional council, the regional transport committee must: a. be satisfied that the regional land transport plan i. contributes to the purpose of this Act ii. is consistent with the GPS on land transport b. have considered i. alternative regional land transport objectives that would contribute to the purpose of this Act ii. the feasibility and affordability of those alternative objectives c. have taken into account any i. NEECS ii. relevant NPS and any relevant RPSs or plans that are, for the time being, in force under the RMA iii. likely funding from any source. Section 16 form and content of regional land transport plants 1. A regional land transport plan must set out the region s land transport objectives, policies, and measures for at least ten financial years from the start of the regional land transport plan. 2. A regional land transport plan must include: a. a statement of transport priorities for the region for the ten financial years from the start of the regional land transport plan b. a financial forecast of anticipated revenue and expenditure on activities for the ten financial years from the start of the regional land transport plan c. all regionally significant expenditure on land transport activities to be funded from sources other than the NLTF during the six financial years from the start of the regional land transport plan d. an identification of those activities (if any) that have inter-regional significance. 3. For the purpose of seeking payment from the national land transport fund, a regional land transport plan must contain for the first six financial years to which the plan relates: a. activities proposed by approved organisations in the region relating to Local road maintenance, local road renewals, local road minor capital works, and existing public transport services b. (not relevant to Canterbury) c. the following activities that the regional transport committee decides to include in the regional land transport plan: 52 Canterbury Regional Land Transport Plan
55 i. activities proposed by approved organisations in the region other than those activities specified in paragraphs (a) and (b) ii. activities relating to state highways in the region that are proposed by the agency iii. activities, other than those relating to state highways, that the agency may propose for the region and that the agency wishes to see included in the regional land transport plan d. the order of priority of the significant activities that a regional transport committee includes in the regional land transport plan under paragraphs (a), (b), and (c) e. an assessment of each activity prepared by the organisation that proposes the activity under paragraph (a), (b), or (c) that includes: i. the objective or policy to which the activity will contribute ii. an estimate of the total cost and the cost for each year iii. the expected duration of the activity iv. any proposed sources of funding other than the NLTF (including, but not limited to, tolls, funding from approved organisations, and contributions from other parties) v. any other relevant information f. the measures that will be used to monitor the performance of the activities. 4. An organisation may only propose an activity for inclusion in the regional land transport plan if it or another organisation accepts financial responsibility for the activity. For the purpose of the inclusion of activities in a national land transport programme: a. a regional land transport plan must be in the form and contain the detail that the agency may prescribe in writing to regional transport committees b. the assessment under subsection (3)(e) must be in a form and contain the detail required by the regional transport committee, taking account of any prescription made by the agency under paragraph (a) 5. For the purpose of the inclusion of activities in a national land transport programme: a. a regional land transport plan must be in the form and contain the detail that the agency may prescribe in writing to regional land transport committees b. the assessment under subsection (3)(e) must be in a form and contain the detail required by the regional transport committee, taking account of any prescription made by the agency under paragraph (a). 6. A regional land transport plan must also include: a. an assessment of how the plan complies with section 14 b. an assessment of the relationship of Police activities to the regional land transport plan c. a list of activities that have been approved under section 20 but are not yet completed d. an explanation of the proposed action, if it is proposed that an activity be varied, suspended or abandoned e. a description of how monitoring will be undertaken to assess implementation of the regional land transport plan f. a summary of the consultation carried out in the preparation of the regional land transport plan g. a summary of the policy relating to significance adopted by the regional transport committee under section 106(2) h. any other relevant matters. For the purposes of this section, existing public transport services means the level of public transport services in place in the financial year before the commencement of the regional land transport plan, and any minor changes to those services. Section 18 - consultation requirements 1. When preparing a regional land transport plan, a regional transport committee: a. must consult in accordance with the consultation principles specified in section 82 of the Local Government Act 2002 b. may use the special consultative procedure specified in section 83 of the Local Government Act Canterbury Regional Land Transport Plan

56 Section functions of regional transport committees 1. The functions of each regional transport committee are: a. to prepare a regional land transport plan, or any variation to the plan, for the approval of the relevant regional council b. to provide the regional council with any advice and assistance the regional council may request in relation to its transport responsibilities. 2. Each regional transport committee must adopt a policy that determines significance in respect of: a. variations made to regional land transport plans under section 18D b. the activities that are included in the regional land transport plan under section Canterbury Regional Land Transport Plan
57 Appendix 7: Glossary Active transport Transport modes that rely on human power, primarily walking and cycling. AM peak The period between 07:00 and 09:00 on weekdays. An Accessible City (AAC) An Accessible City refers to the transport chapter of the Christchurch Central Recovery Plan. It was launched in October 2013 and is available from the Canterbury Earthquake Recovery Authority. Canterbury For the purposes of this strategy, the Canterbury region is the administrative area covered by the Canterbury Regional Council, excluding the administrative area covered by the Waitaki District Council. The whole of the Waitaki district is covered under the Otago Regional Land Transport Strategy. Capacity The theoretical maximum number of vehicles (vehicular capacity) or persons (person capacity) that can pass through a given section of road or an intersection during a given period of time, usually expressed as vehicles per hour or persons per hour. Community transport A transport service established and operated by a community for members of that community. Corridor A geographical area usually defined by a railway, motorway, roadway, or other physical element and its immediate surrounding area. Freight hub Is a physical location where freight vehicles converge on a common user facility for the purpose of transferring goods within or between transport modes. Greater Christchurch For the purpose of this strategy, greater Christchurch is the area covered by the Greater Christchurch Urban Development Strategy (UDS). Greater Christchurch comprises the area, including Lyttelton Harbour but not the remainder of Banks Peninsula, and parts of Waimakariri and Selwyn district councils. For a map of the UDS area, visit Infrastructure All fixed components of a transportation system, including roadways and bridges, railways, ports, parkand-ride sites, bus stops/shelters and other physical elements. Interchanges Places where people or goods transfer between vehicles or from one mode to another. Inter-peak The period between 09:00 and 16:00 on weekdays. Investment Logic Mapping (ILM) A technique to test and confirm the rationale for a proposed investment. Land transport means: (a) transport on land by any means, (b) the infrastructure, goods and services facilitating that transport. The definition also includes coastal shipping. Land transport system All infrastructure, services, mechanisms and institutions that contribute to providing for land transport. Level of service A qualitative measure that describes the operational conditions of a road or intersection. Level of service C The Austroads Guide to Traffic Engineering Practice Part 2 Roadway Capacity describes this level of service as The zone of stable flow but most drivers are restricted to some extent in their freedom to select their desired speed and to manoeuvre within the traffic stream. The general level of comfort and convenience declines noticeably at this level. In the context of this RLTS, the term is used to describe the desired minimum level of service on the regional strategic road network that lies outside of greater Christchurch. Local roads Roads operated by territorial local authorities. LTMA Land Transport Management Act Mobility The ability to move or be moved freely and easily. Mobility is not the same as accessibility which is about the ease of reaching a specific location or service. Multi-modal Used to describe travel or transport of goods involving more than one transport mode. Mode A categorisation of transport methods, e.g. private motor vehicle, walking, cycling, rail, public transport. Motor vehicles A vehicle powered by an engine or motor, including cars, vans, trucks, trains and motorbikes. National Energy Efficiency and Conservation Strategy (NEECS) A Government strategy prepared under the Energy Efficiency and Conservation Act National Land Transport Fund (NLTF) The dedicated part of the Crown Bank Account into which land transport revenue, as defined in section 6 of the Land Transport Management Act 2003, is paid. Canterbury Regional Land Transport Plan
58 National Land Transport Programme (NLTP) The mechanism through which the NZ Transport Agency allocates funds for land transport infrastructure and services. New Zealand Transport Agency (NZ Transport Agency) A Government transport agency created under section 93 of the Land Transport Management Act Network Infrastructure or services that are connected to enable the transition of people and goods from one piece of infrastructure or service to another. One Network Road Classification (ONRC) A road classification system jointly developed by the NZ Transport Agency and local government to provide a nationally consistent framework for determining road function, future levels of service, the appropriate maintenance levels, and improvement priorities. Outcome Outcomes set out how the objectives of the strategy will be delivered. Peak period The time period, usually in the morning and in the afternoon, when the heaviest demand occurs on a transportation facility or corridor. PM peak The period between 16:00 and 18:00 on weekdays. Private motor vehicles Motor vehicles owned, leased or hired for sole use by an individual, household or organisations. Public transport Passenger transportation services available to the public on a regular basis using vehicles, including buses, trains, trams, ferries and taxis, that transport people for payment of a fare, usually but not exclusively over a set route or routes from one fixed point to another. Regional GDP Annual estimates of regional Gross Domestic Product for the Canterbury region. These estimates are provided by Infometrics. RMA Resource Management Act Rideshare The act of co-ordinating the sharing of rides with other people in a private motor vehicle, sometimes referred to as carpooling. RLTS Regional Land Transport Strategy. Road Controlling Authority (RCA) City councils, district councils and the NZ Transport Agency. Roads of National Significance (RONS) A group of state highway projects commenced in 2009 to address Government priorities for the state highway system within, or close to, New Zealand s five largest population centres. Regional Transport Committee (RTC) A committee of Environment Canterbury required by the Land Transport Management Act The Committee is responsible for the preparation and approval of this Plan. Rural area For the purposes of this strategy, the definition used by Statistics New Zealand is applied: The rural areas of New Zealand are those which are not specifically designated as urban. They include rural centres and district territories where these are not included in main, secondary or minor urban areas. (Refer to definitions in this glossary of rural centres, main, secondary and minor urban areas.) Single occupancy vehicle A vehicle carrying a driver with no passengers. State highway A road managed by the NZ Transport Agency and gazetted as state highway. Strategic network A network of routes that has been defined as having strategic significance at a regional level. Sustainability - In the transport sector, this is taken to mean finding ways to move people and goods in ways that reduce the impact upon the environment, economy and society. Territorial local authorities City councils and district councils. Transport Officer Group An informal group of transport staff from the regional council, district councils and the NZ Transport Agency. Total Mobility A subsidised transport service to increase the mobility of people with serious mobility constraints. Volume The number of vehicles or people on a motorway, roadway or any other transportation facility. Vehicle occupancy The number of people in a vehicle. 56 Canterbury Regional Land Transport Plan

59 Canterbury Regional Land Transport Plan
The Government s Aviation Strategy Transport for the North (TfN) response
 response") The Government s Aviation Strategy Transport for the North (TfN) response Transport for the North Background Good transport links are a crucial part of a strong economy supporting labour markets and delivering
The Government s Aviation Strategy Transport for the North (TfN) response Transport for the North Background Good transport links are a crucial part of a strong economy supporting labour markets and delivering
CHRISTCHURCH MOTORWAYS. Project Summary Statement February 2010
 CHRISTCHURCH MOTORWAYS Project Summary Statement February 2010 Table of Contents 1. Purpose of Document 2. Strategic Context 3. Benefits 4. Project Scope and Economics 5. Implementation Plan 1 ROADS OF
Wellington $312 $49 $456 OVERVIEW WELLINGTON REGIONAL SUMMARY
 National Land Transport Programme 2015 18 Wellington WELLINGTON REGIONAL SUMMARY OVERVIEW The Wellington region is made up of a number of cities, urban areas and supporting rural hinterland. The city is
6 Road infrastructure
 6 Road infrastructure 51 ƨƨsummary New Zealand does not score highly for its road infrastructure when compared to other developed nations. This may partly be due to geography and population size, which
Regional summary - Wellington
 Regional summary Wellington Regional summary - Wellington This is a summary of data relevant to transportation in this region, viewed from a Land Transport NZ perspective. It s purpose is to inform the
NATIONAL AIRSPACE POLICY OF NEW ZEALAND
 NATIONAL AIRSPACE POLICY OF NEW ZEALAND APRIL 2012 FOREWORD TO NATIONAL AIRSPACE POLICY STATEMENT When the government issued Connecting New Zealand, its policy direction for transport in August 2011, one
$244 $45 OVERVIEW National Land Transport Programme Bay of Plenty BAY OF PLENTY REGIONAL SUMMARY
 2015 18 National Land Transport Programme Bay of Plenty BAY OF PLENTY REGIONAL SUMMARY OVERVIEW Transport investment in the Bay of Plenty is targeted to support significant residential growth, new industrial
WELLINGTON $422 MILLION $614 MILLION $83 MILLION 22% SPEND $1.9 BILLION
 WELLINGTON WELLINGTON $1.9 BILLION FORECAST TOTAL WELLINGTON INVESTMENT The Wellington region s transport challenges are dominated by the region s concentration of population in the metropolitan cities,
$745 $10 $41 OVERVIEW
 2015 1 National Land Transport Programme Southern SOUTHERN REGIONAL SUMMARY The NZ Transport Agency s Southern region comprises the local government regions of Canterbury, Otago, Southland and the West
Gold Coast: Modelled Future PIA Queensland Awards for Planning Excellence 2014 Nomination under Cutting Edge Research category
 Gold Coast: Modelled Future PIA Queensland Awards for Planning Excellence 2014 Nomination under Cutting Edge Research category Jointly nominated by SGS Economics and Planning and City of Gold Coast August
Freight Movements in the Upper North Island
 Freight Movements in the Upper North Island Presentation 4 September 2009 Freight Key driver supporting economic growth Planning and management of freight Good information Role of NFDS Current patterns
SUSTAINABLE DEVELOPMENT PLAN 2015
 LAND USE SUSTAINABLE DEVELOPMENT PLAN 2015 EAST MINILANDS EAST MINILANDS SUSTAINABLE DEVELOPMENT SUSTAINABLE DEVELOPMENT DHL eastmidlandsairport.com OUR AIRPORT FOREWORD by Andy Cliffe Managing Director
Case study: outbound tourism from New Zealand
 66 related crime, less concerned about the stability and certainty offered by booking a package holiday, and may choose to be independent travellers, organizing their travel and itinerary themselves. Tourists
$960 $1,175 $91 OVERVIEW National Land Transport Programme Auckland AUCKLAND REGIONAL SUMMARY
 2015 18 National Land Transport Programme Auckland AUCKLAND REGIONAL SUMMARY OVERVIEW Achieving an effective and efficient transport system is central to supporting Auckland s future. Auckland is home
RE: PROPOSED STRATEGIC ALLIANCE AGREEMENT BETWEEN AIR NEW ZEALAND AND SINGAPORE AIRLINES
 28 February 2014 Richard Cross Senior Adviser Ministry of Transport Dear Richard RE: PROPOSED STRATEGIC ALLIANCE AGREEMENT BETWEEN AIR NEW ZEALAND AND SINGAPORE AIRLINES Christchurch International Airport
Transport Indicators Report June 2018
 Transport Indicators Report June 2018 Board Meeting 21 August 2018 Recommendation That the Board: i. Receives this report. Executive summary 1. The attached Monthly and Quarterly Indicator Reports provide
NSW PRE-BUDGET STATEMENT FUTURE ECONOMY FUTURE JOBS
 2017-18 NSW PRE-BUDGET STATEMENT FUTURE ECONOMY FUTURE JOBS Executive Summary The 2017-18 NSW State Budget presents an opportunity for the NSW Government to future-proof the tourism and transport sectors.
30 th January Local Government s critical role in driving the tourism economy. January 2016 de Waal
 30 th January 2016 Local Government s critical role in driving the tourism economy January 2016 de Waal Contents Local Government can make or break tourism in their jurisdiction... 3 TNQ Tourism Vision...
A TRANSPORT SYSTEM CONNECTING PEOPLE TO PLACES
 THE MAYOR'S VISION FOR TRANSPORT A TRANSPORT SYSTEM CONNECTING PEOPLE TO PLACES VISION We will build a transport system that works for everyone, connecting people to the places they want to go within the
2 ECONOMIC ASSESSMENT
 2 ECONOMIC ASSESSMENT LYTTELTON PORT COMPANY LIMITED ASSESSMENT OF ECONOMIC BENEFITS OF THE PROPOSED LYTTELTON HARBOUR CHANNEL DEEPENING PROJECT Mike Copeland Brown, Copeland & Co Ltd 8 September, 2016
JUNE 2017 AUCKLAND ECONOMIC INSIGHTS SERIES ENGAGING GLOBALLY AUCKLAND S TRADING LINKAGES. aucklandnz.com/business nzier.org.nz
 AUCKLAND ECONOMIC INSIGHTS SERIES ENGAGING GLOBALLY AUCKLAND S TRADING LINKAGES aucklandnz.com/business nzier.org.nz JUNE 2017 4 AUCKLAND ECONOMIC INSIGHTS SERIES 1 2 3 4 Advanced Industries Auckland s
REAUTHORISATION OF THE ALLIANCE BETWEEN AIR NEW ZEALAND AND CATHAY PACIFIC
 Chair Cabinet Economic Growth and Infrastructure Committee Office of the Minister of Transport REAUTHORISATION OF THE ALLIANCE BETWEEN AIR NEW ZEALAND AND CATHAY PACIFIC Proposal 1. I propose that the
From: OECD Tourism Trends and Policies Access the complete publication at:
 From: OECD Tourism Trends and Policies 2014 Access the complete publication at: http://dx.doi.org/10.1787/tour-2014-en New Zealand Please cite this chapter as: OECD (2014), New Zealand, in OECD Tourism
TOWN PLANNING SUBMISSION TO THE GREATER SYDNEY COMMISSION LANDS AT ARTARMON
 TOWN PLANNING SUBMISSION TO THE GREATER SYDNEY COMMISSION LANDS AT ARTARMON March 2017 TABLE OF CONTENTS 1.0 INTRODUCTION 3 2.0 THE SUBJECT SITE 4 3.0 STRATEGIC PLANNING CONTEXT 6 4.0 SUMMARY AND CONCLUSIONS
Frequently Asked Questions
 CAA Funding Review Why has CAA s funding been reviewed? New Zealand has a well-regarded civil aviation system and a good aviation safety record. However, both the government and a range of reviews (including
Auckland Port and the Unitary Plan Dr Douglas Fairgray
 Auckland Port and the Unitary Plan Dr Douglas Fairgray Source: Auckland 1886 - Sir George Grey Special Collections, Auckland Libraries, NZ Map 374 Scope The interface between the Unitary Plan and the Port
Queensland Tourism Aviation Blueprint to 2016
 Queensland Tourism Aviation Blueprint to 2016 tq.com.au Blueprint outline The purpose of the Queensland Tourism Aviation Blueprint to 2016 is to develop the strategic framework that will guide aviation
Consultation on Draft Airports National Policy Statement: new runway capacity and infrastructure at airports in the South East of England
 Tony Kershaw Honorary Secretary County Hall Chichester West Sussex PO19 1RQ Telephone 033022 22543 Website: www.gatcom.org.uk If calling ask for Mrs. Paula Street e-mail: secretary@gatcom.org.uk 22 May
5 Rail demand in Western Sydney
 5 Rail demand in Western Sydney About this chapter To better understand where new or enhanced rail services are needed, this chapter presents an overview of the existing and future demand on the rail network
Rail Delivery Group. Consultation on the future of the East Midlands rail franchise
 Rail Delivery Group Response to: Department for Transport Consultation on the future of the East Midlands rail franchise Date: 11 October 2017 Rail Delivery Group Limited Registered Office, 2nd Floor,
IATA ECONOMIC BRIEFING FEBRUARY 2007
 IATA ECONOMIC BRIEFING FEBRUARY 27 NEW AIRCRAFT ORDERS KEY POINTS New aircraft orders remained very high in 26. The total of 1,834 new orders for Boeing and Airbus commercial planes was down slightly from
Kilometres. Blacktown. Penrith. Parramatta. Liverpool Bankstown. Campbelltown
 0 5 10 15 20 Kilometres Penrith Blacktown Parramatta Liverpool Bankstown Campbelltown accessibility outcomes Legend Outcomes targeted in Western Sydney are: public transport that is accessible throughout
TWENTY-SECOND MEETING OF THE ASIA/PACIFIC AIR NAVIGATION PLANNING AND IMPLEMENTATION REGIONAL GROUP (APANPIRG/22)
") INTERNATIONAL CIVIL AVIATION ORGANIZATION TWENTY-SECOND MEETING OF THE ASIA/PACIFIC AIR NAVIGATION PLANNING AND IMPLEMENTATION REGIONAL GROUP (APANPIRG/22) Bangkok, Thailand, 5-9 September 2011 Agenda
INTERNATIONAL CIVIL AVIATION ORGANIZATION TWENTY-SECOND MEETING OF THE ASIA/PACIFIC AIR NAVIGATION PLANNING AND IMPLEMENTATION REGIONAL GROUP (APANPIRG/22) Bangkok, Thailand, 5-9 September 2011 Agenda
Land area 1.73 million km 2 Queensland population (December 2015) Brisbane population* (June 2015)
 Brisbane population* (June 2015)") Queensland - 18 Queensland OVERVIEW Queensland is nearly five times the size of Japan, seven times the size of Great Britain, and two and a half times the size of Texas. Queensland is Australia s second
Queensland - 18 Queensland OVERVIEW Queensland is nearly five times the size of Japan, seven times the size of Great Britain, and two and a half times the size of Texas. Queensland is Australia s second
About ABTA. Executive summary
 ABTA response to the Department for Transport Draft Airports National Policy Statement new runway capacity and infrastructure at airports in the South East of England About ABTA ABTA The Travel Association
Submission to. Southland District Council on. Draft Stewart Island/Rakiura Visitor Levy Policy and Bylaw
 Submission to Southland District Council on Draft Stewart Island/Rakiura Visitor Levy Policy and Bylaw Date: 9 November 2018 Tourism Industry Aotearoa (TIA) welcomes the opportunity to comment on Southland
BUSINESS CASE EXECUTIVE SUMMARY CHANNEL CAPACITY UPGRADE
 www.channelcapacityupgrade.com.au 2 $10 BILLION in trade value Introduction The Port of Townsville is the largest container and automotive port in Northern Australia and last financial year handled around
Response to the London Heathrow Airport Expansion Public Consultation
 Response to the London Heathrow Airport Expansion Public Consultation Summary This report sets out the response to the Heathrow Airport s consultation on airport expansion and airspace change. The consultation
Policy Transport. Policy highlights. Our plan
 Policy 2017 Our plan Policy highlights National is committed to building the world-class infrastructure to ensure New Zealand continues to grow. Record investment in transport Delivering the Roads of National
Number 1 Gross Regional Product per capita in Queensland
 Number 1 Gross Regional Product per capita in Queensland Whitsunday Region is the nation building region of Australia providing over $22 billion of economic value to the Australian economy. Our region
EAST WEST RAIL EASTERN SECTION. prospectus for growth
 EAST WEST RAIL EASTERN SECTION prospectus for growth September 2018 executive summary The East West Rail Consortium, a partnership of local authorities, rail operators and Network Rail, continues to promote
Draft Marine and Harbour Facilities Strategy
 Draft Marine and Harbour Facilities Strategy Vision The Coromandel peninsula is a destination of choice for safe, sustainable and accessible marine and harbour facilities that are fit for purpose to meet
PO Box 257 PO Box 257 PARRAMATTA NSW 2124 PARRAMATTA NSW 2124
 31 March 2017 Sean O Toole Sheridan Dudley District Commissioner - West District Commissioner - South West Greater Sydney Commission Greater Sydney Commission PO Box 257 PO Box 257 PARRAMATTA NSW 2124
2013/14 Pre-Budget Submission Accommodation Association of Australia
 2013/14 Pre-Budget Submission Accommodation Association of Australia Accommodation Association of Australia Principal Contact Mr Richard Munro Chief Executive Officer Phone: +61 2 8666 9015 EXECUTIVE SUMMARY
Land area 1.73 million km 2 Queensland population (as at 31 December 2017) Brisbane population* (preliminary estimate as at 30 June 2017)
 Brisbane population* (preliminary estimate as at 30 June 2017)") Queensland - 11 Queensland OVERVIEW Queensland is nearly five times the size of Japan, seven times the size of Great Britain, and two and a half times the size of Texas. Queensland is Australia s second
Queensland - 11 Queensland OVERVIEW Queensland is nearly five times the size of Japan, seven times the size of Great Britain, and two and a half times the size of Texas. Queensland is Australia s second
JUNE 2016 GLOBAL SUMMARY
 JUNE 2016 GLOBAL SUMMARY FAST FACTS The world of air transport, 2014 All figures are for 2014, unless otherwise stated, to give a single set of data for one year. Where available, the latest figures are
The Coalition s Policy to Build the Swan Valley Bypass and Perth Gateway
 1 Our Plan Real Solutions for all Australians The direction, values and policy priorities of the next Coalition Government. The Coalition s Policy to Build the Swan Valley Bypass and Perth Gateway August
The implementation of this Master Plan will be undertaken in logical stages to meet passenger and workforce demands.
 The implementation of this Master Plan will be undertaken in logical stages to meet passenger and workforce demands. Connecting People Building Opportunities 198 Brisbane Airport Corporation CHAPTER 10
Gold Coast. Rapid Transit. Chapter twelve Social impact. Chapter content
 Gold Coast Rapid Transit Chapter twelve Social impact Chapter content Social impact assessment process...235 Existing community profile...237 Consultation...238 Social impacts and mitigation strategies...239
Mood of the Nation New Zealanders' perceptions of international visitors. March 2018
 Mood of the Nation New Zealanders' perceptions of international visitors March 2018 Contents 1 Background and approach 3 2 Key insights 6 3 Detailed insights 10 4 Appendix: measures by region 31 2 1 Background
Airport forecasting is used in master planning to guide future development of the Airport.
 Airport Forecasts Airport forecasting is used in master planning to guide future development of the Airport. 4.1 INTRODUCTION Airport forecasting ensures development is appropriate for passengers, ground
Tourism Development Framework for Scotland. Executive Summary- Development Framework to 2020 for the Visitor Economy (Refresh 2016)
") Tourism Development Framework for Scotland Executive Summary- Development Framework to 2020 for the Visitor Economy (Refresh 2016) Introduction The Tourism Development Framework for Scotland refresh 2016:
Tourism Development Framework for Scotland Executive Summary- Development Framework to 2020 for the Visitor Economy (Refresh 2016) Introduction The Tourism Development Framework for Scotland refresh 2016:
Agenda Item 5: Rail East Midlands Rail Franchise Consultation
 Strategic Transport Forum 15 th September 2017 Agenda Item 5: Rail East Midlands Rail Franchise Consultation Recommendation: It is recommended that the Forum agree (subject to any amendments agreed by
The Sunshine Coast is part of the global community and generates wealth through export, high-value industries and new investment.
 3.2 Strategic intent 3.2.1 Shaping growth an overview In 2031, the Sunshine Coast is renowned for its vibrant economy, ecological values, unique character and strong sense of community. It is Australia
South of England north-south connectivity
 South of England north-south connectivity An outline economic case for the inclusion of north-south connectivity improvements to form part of the government s road investment strategy (RIS2) Weston-super-Mare
East Lancashire Highways and Transport Masterplan East Lancashire Rail Connectivity Study Conditional Output Statement (Appendix 'A' refers)
") Report to the Cabinet Member for Highways and Transport Report submitted by: Director of Corporate Commissioning Date: 1 June 2015 Part I Electoral Divisions affected: All East Lancashire Highways and
Report to the Cabinet Member for Highways and Transport Report submitted by: Director of Corporate Commissioning Date: 1 June 2015 Part I Electoral Divisions affected: All East Lancashire Highways and
JAL Group Announces its FY Medium-Term Business Plan
 JAL Group Announces its FY2006-2010 Medium-Term Business Plan -Mobilize the Group s Strengths to Regain Trust - Tokyo, Thursday March 2, 2006: The JAL Group today announced its medium-term business plan
North Waikato Integrated Growth Management
 North Waikato Integrated Growth Management Programme Business Case Draft Revision C November 2017 Contents 1. Introduction... 10 1.1 Partners and key stakeholders... 11 2. Programme context... 12 2.1 Geographic
Memorandum of Understanding with ACT Government
 MEDIA RELEASE 8 April 2015 Memorandum of Understanding with ACT Government The ACT Government and Canberra Airport today entered into a new Memorandum of Understanding (MoU) on key areas of common interest
DRAFT. Master Plan RESPONSIBLY GROWING to support our region. Summary
 Master Plan GROWING 2017-2037 RESPONSIBLY to support our region Summary DRAFT 2 1 Introduction Over the next three decades, Southern Ontario is set to experience significant growth its population will
PORT OF TOWNSVILLE NORTHERN AUSTRALIA S TRANSPORT LINK TO THE WORLD TOWNSVILLE PORT EXPANSION PROJECT MAGNETIC ISLAND KNOWLEDGE FORUM 29 APRIL 2017
 PORT OF TOWNSVILLE NORTHERN AUSTRALIA S TRANSPORT LINK TO THE WORLD TOWNSVILLE PORT EXPANSION PROJECT MAGNETIC ISLAND KNOWLEDGE FORUM 29 APRIL 2017 AGENDA: Contents CONTENTS 1 2 3 Port of Townsville Context
AUCKLAND $1.2 BILLION $1.9 BILLION $149 MILLION 15% SPEND $5.7 BILLION
 AUCKLAND AUCKLAND $5.7 BILLION FORECAST TOTAL AUCKLAND INVESTMENT The next 10 years are expected to underline Auckland s performance as the fastest growing major city in Australasia. The city is expected
3. Coach Supporting Statement
 3. Coach Supporting Statement Content 1. Setting the Scene 2. Vision 3. Coaches and the Shared Priorities 4. Issues 5. Delivery Programme in the first Plan Period 2001/02 2005/06 6. Good Practice 7. Strategy
TERMINAL DEVELOPMENT PLAN
 5.0 TERMINAL DEVELOPMENT PLAN 5.0 TERMINAL DEVELOPMENT PLAN Key points The development plan in the Master Plan includes the expansion of terminal infrastructure, creating integrated terminals for international,
CRUISE TOURISM S CONTRIBUTION TO THE NEW ZEALAND ECONOMY 2017
 CRUISE TOURISM S CONTRIBUTION TO THE NEW ZEALAND ECONOMY 2017 21 August 2017 CRUISE TOURISM S CONTRIBUTION TO THE NEW ZEALAND ECONOMY 2017 Prepared for New Zealand Cruise Association Document reference:
a manifesto for business
 a manifesto for business to 2020 Introduction and role of this manifesto What is Suffolk Chamber of Commerce s role? Suffolk is a county undergoing profound economic change. Suffolk Chamber of Commerce,
KANGAROO ISLAND WATERGAP PROJECT
 KANGAROO ISLAND WATERGAP PROJECT 1. BACKGROUND Although Kangaroo Island is only 112km from Adelaide, it is economically and socially disadvantaged by its 16km watergap separation from the mainland. There
Wales. Andy Thomas. Route Managing Director Wales. Ken Skates, Cabinet Secretary for Economy and Infrastructure, Welsh Government
 Wales The railway in Wales and Borders plays a critical role in connecting people, businesses and communities to support both regional and national economic growth. We run the safest railway in Europe,
Activity Concept Note:
 Activity Concept Note: Summary Provide a short summary of the proposed Activity including indicative New Zealand funding level and note whether this is a New Zealandled or partner-led process. Why: Rationale
APPENDIX 20 EFFECTS ON NAVIGATIONAL SAFETY
 APPENDIX 20 EFFECTS ON NAVIGATIONAL SAFETY Effects of Lyttelton Port Recovery Plan on Navigational Safety November 2014 INTRODUCTION Lyttelton Port of Christchurch (LPC) utilises an integrated health
NATIONAL LAND TRANSPORT PROGRAMME
 NATIONAL LAND TRANSPORT PROGRAMME 2018 21 NATIONAL LAND TRANSPORT PROGRAMME 2018 21 NZ TRANSPORT AGENCY 1 2018 21 NLTP REVENUE AND INVESTMENT FLOWS FUNDING WILL COME FROM National Land Transport Fund Local
https://gsc-public-1.s3-ap-southeast-2.amazonaws.com/s3fs-public/draft-eastern-city-district-plan.pdf
 GSC Sydney East Rev Draft -references Port Botany - 30 https://gsc-public-1.s3-ap-southeast-2.amazonaws.com/s3fs-public/draft-eastern-city-district-plan.pdf Pages 6. The District s freight routes, particularly
This report is PUBLIC [NOT PROTECTIVELY MARKED] Board Meeting. Councillor Roger Lawrence Transport
![This report is PUBLIC [NOT PROTECTIVELY MARKED] Board Meeting. Councillor Roger Lawrence Transport](/thumbs/85/92100595.jpg "This report is PUBLIC [NOT PROTECTIVELY MARKED] Board Meeting. Councillor Roger Lawrence Transport") Agenda Item No. 5.4 Board Meeting Date 17 February 2017 Report title Cabinet Member Portfolio Lead Accountable Managing Director Accountable Employee Report has been considered by West Midlands Bus Alliance
Agenda Item No. 5.4 Board Meeting Date 17 February 2017 Report title Cabinet Member Portfolio Lead Accountable Managing Director Accountable Employee Report has been considered by West Midlands Bus Alliance
CAIRNS RECTANGULAR PITCH STADIUM NEEDS STUDY PART 1 CAIRNS REGIONAL COUNCIL DRAFT REPORT SEPTEMBER 2011
 CAIRNS RECTANGULAR PITCH STADIUM NEEDS STUDY PART 1 CAIRNS REGIONAL COUNCIL DRAFT REPORT SEPTEMBER 2011 CAIRNS RECTANGULAR PITCH STADIUM NEEDS STUDY PART 1 Cairns Regional Council September 2011 Coffey
Otago Economic Overview 2013
 Final report May 2014 www.berl.co.nz Background Author(s): Mark Cox, Hugh Dixon and Masrur Alam Khan DISCLAIMER All work is done, and services rendered at the request of, and for the purposes of the client
Ireland. Tourism in the economy. Tourism governance and funding
 Ireland Tourism in the economy Tourism is one of Ireland s most important economic sectors and has significant potential to play a further role in Ireland s economic renewal. In 2014, spending by visitors
Submission to. Queenstown Lakes District Council. on the
 Submission to Queenstown Lakes District Council on the Queenstown Lakes District Proposed District Plan, Section 32 Evaluation, Stage 2 Components October 2017, for Visitor Accommodation Date: 23 Feb 2018
Transportation Working Group Proposed Work Plan for 2018
 2018/SOM2/SCE/006 Agenda Item: 3.3 Transportation Working Group Proposed Work Plan for 2018 Purpose: Consideration Submitted by: TPTWG Lead Shepherd Second SOM Steering Committee on Economic and Technical
ANA Reports Record Profits for FY2012
 ANA HOLDINGS NEWS ANA Reports Record Profits for FY2012 TOKYO April 30, 2013 - ANA Holdings today reports consolidated financial for the fiscal year ended March, 2013. Financial and Operational Highlights
Infrastructure Policy Priorities for New Zealand
 Infrastructure Policy Priorities for New Zealand The problem Transport investment international comparisons Funding gap Solutions: Debt financing: Infrastructure Bonds, PPPs Tax Increment Financing TIF
SUBMISSION BY THE BOARD OF AIRLINE REPRESENTATIVES OF NEW ZEALAND ON THE DRAFT QUEENSTOWN LAKES DISTRICT COUNCIL DRAFT PLAN
 SUBMISSION BY THE BOARD OF AIRLINE REPRESENTATIVES OF NEW ZEALAND ON THE DRAFT QUEENSTOWN LAKES DISTRICT COUNCIL DRAFT PLAN Background to BARNZ BARNZ is an incorporated society comprising 19 member airlines
Annual Business Plan 2017/2018
 Annual Business Plan 2017/2018 Introduction Visitors to Marlborough spent $368 million to the year-end March 2017 up 1% on the previous year. This is a remarkable achievement considering the region was
Preparatory Course in Business (RMIT) SIM Global Education. Bachelor of Applied Science (Aviation) (Top-Up) RMIT University, Australia
 SIM Global Education. Bachelor of Applied Science (Aviation) (Top-Up) RMIT University, Australia") Preparatory Course in Business (RMIT) SIM Global Education Bachelor of Applied Science (Aviation) (Top-Up) RMIT University, Australia Brief Outline of Modules (Updated 18 September 2018) BUS005 MANAGING
Preparatory Course in Business (RMIT) SIM Global Education Bachelor of Applied Science (Aviation) (Top-Up) RMIT University, Australia Brief Outline of Modules (Updated 18 September 2018) BUS005 MANAGING
Airport analyses informing new mobility shifts: Opportunities to adapt energyefficient mobility services and infrastructure
 Airport analyses informing new mobility shifts: Opportunities to adapt energyefficient mobility services and infrastructure Alejandro Henao, Josh Sperling, Venu Garikapati, Yi Hou, Stan Young National
The Strategic Commercial and Procurement Manager
 Item 3 To: Procurement Sub Committee On: 8 June 2016 Report by: The Strategic Commercial and Procurement Manager Heading: Renfrewshire Council s Community Benefit Strategy 2016 1. Summary 1.1. The purpose
Public Transport for Perth in 2031
 South West Group Submission Public Transport for Perth in 2031 October 2011 South West Group Vision and Mission Local Governments in South Metropolitan Perth, through cooperation with industry, community
REGION OF WATERLOO INTERNATIONAL AIRPORT AIRPORT MASTER PLAN EXECUTIVE SUMMARY MARCH 2017
 REGION OF WATERLOO INTERNATIONAL AIRPORT AIRPORT MASTER PLAN EXECUTIVE SUMMARY MARCH 2017 Contact: Chris Wood, Airport General Manager cwood@regionofwaterloo.ca (519) 648-2256 ext. 8502 Airport Master
The Civil Aviation Sector as a Driver for Economic Growth in Egypt
 The Civil Aviation Sector as a Driver for Economic Growth in Egypt EDSCA Conference Cairo, November 10, 2013 Agenda 1. Facts and figures 2. Socio-economic impact of the civil aviation sector 3. Options
T O U R I S M P L A N 2020
 T O U R I S M P L A N 2020 2 CITY OF HOLDFAST BAY TOURISM PLAN 2020 CONTENTS Executive Summary 4 Introduction 7 Tourism at a State and National Level 7 Tourism in the City of Holdfast Bay 7 Our Focus 8
The Economic Impact of Tourism in Hillsborough County. July 2017
 The Economic Impact of Tourism in Hillsborough County July 2017 Table of contents 1) Key Findings for 2016 3 2) Local Tourism Trends 7 3) Trends in Visits and Spending 12 4) The Domestic Market 19 5) The
AFTA s 2017 Foreign Policy White Paper Submission
 AFTA s 2017 Foreign Policy White Paper Submission Page 1 of 10 About AFTA Ltd (AFTA) was founded in 1957 to: establish professional standards for travel agents; stimulate and promote travel; bring together
From: OECD Tourism Trends and Policies Access the complete publication at: Ireland
 From: OECD Tourism Trends and Policies 2014 Access the complete publication at: http://dx.doi.org/10.1787/tour-2014-en Ireland Please cite this chapter as: OECD (2014), Ireland, in OECD Tourism Trends
REGIONAL TRANSPORT COMMITTEE
 REGIONAL TRANSPORT COMMITTEE Report of the Regional Transport Committee of the Waikato Regional Council held in the Council Chamber, Waikato Regional Council Office, 401 Grey Street Hamilton East at 9.32
A Master Plan is one of the most important documents that can be prepared by an Airport.
 The Master Plan A Master Plan is one of the most important documents that can be prepared by an Airport. A Master Plan is a visionary and a strategic document detailing planning initiatives for the Airport
Australian Cities Accounts Estimates. December 2011
 Australian Cities Accounts 2010-11 Estimates December 2011 This report has been prepared by: SGS Economics and Planning Pty Ltd ACN 007 437 729 Level 5 171 Latrobe Street MELBOURNE VIC 3000 P: + 61 3 8616
The Coalition s Policy
 The Coalition s Policy Key Commitments Townsville is a city with immense potential. With a population of around 170,000, some 16,000 regional businesses, and regional product of over $11 billion, Townsville
Tourism, the Distribution Channel and working with ITOC
 Tourism, the Distribution Channel and working with ITOC 25 August 2011 Presentation Lesley Immink, Chief Executive Inbound Tour Operators Council of New Zealand New name 2012: New Zealand Tourism Export
29 December Canada Transportation Act Review Secretariat 350 Albert Street Ottawa ON K1A 0N5
 29 December 2014 BHP Billition Canada Inc. 130 3rd Avenue South Saskatoon SK S7K 1L Canada Tel +1 306 385 8400 www bhpbilliton.com Canada Transportation Act Review Secretariat 350 Albert Street Ottawa
The Challenges for the European Tourism Sustainable
 The Challenges for the European Tourism Sustainable Denada Olli Lecturer at Fan S. Noli University, Faculty of Economy, Department of Marketing, Branch Korça, Albania. Doi:10.5901/mjss.2013.v4n9p464 Abstract
VISITOR ECONOMY STRATEGY
 ECONOMY STRATEGY WESTERN 6 6% GDP 3.5M NIGHTS 3.5m The Western Bay of Plenty subregion incorporates the Western Bay of Plenty District and Tauranga City. The Western Bay of Plenty District covers 212,000