Date: February 06, 2019
|
|
|
- Carmel Cole
- 5 years ago
- Views:
Transcription
1 Date: February 06, 2019 To, The Manager, Listing Compliance, Department of Corporate Services, BSE Limited, Floor 25, P. J. Towers, Dalal Street, Mumbai BSE Scrip Code: To, The Manager, Listing Compliance, Department of Corporate Services, National Stock Exchange of India Limited, Exchange Plaza, Plot no. C/1, G Block Bandra Kurla Complex, Bandra (E) Mumbai NSE Scrip Symbol: ROHLTD Dear Sir/Madam, Subject: Investors Presentation In continuation to our letter dated February 04, 2019 please find enclosed herewith the presentation for conference call to be held today i.e Wednesday, February 06, 2019 at 3:30 p.m. to discuss Q3/9M-FY19 results This is for the information and records of the Exchanges. For ROYAL ORCHID HOTELS LIMITED RANABIR SANYAL COMPANY SECRETARY & COMPLIANCE OFFICER Encl: a/a


2 Royal Orchid Hotels Ltd Q3FY19 Results Presentation Expect more from Royal Orchid Hotels
3 Disclaimer Statements made in this Presentation describing the Company s objectives, projections, estimates, predictions and expectations may be forward-looking statements, within the meaning of applicable securities laws and regulations. As forward-looking statements are based on certain assumptions and expectations of future events over which the Company exercises no control, the Company cannot guarantee their accuracy nor can it warrant that the same will be realized by the Company. The Company assumes no responsibility to publicly amend, modify or revise any forward looking statements on the basis of any subsequent developments or events or for any loss any investor may incur by investing in the shares of the Company based on the forwardlooking statements.
4 Table of Contents Industry Overview Company Overview Business Overview Financial Overview
5 Industry Overview Industry Outlook Growth Drivers Key Challenges
6 Industry Outlook - Current Trend 1. Disposable income on the rise PER CAPITA NATIONAL INCOME (at Current Price) % 8.60% 6.20% 6.90% 4.60% % 12.00% 10.00% 8.00% 6.00% 4.00% PRIVATE CONSUMPTION ON RESTAURANT & HOTELS (at Current Price) % Per Capita NNI (Rs crore) Growth (Y-on-Y) Source: Central Statistics Office 0.00% Source: Central Statistics Office Expenditure on Restuartants & Hotels (Rs core) India s Per Capita National Income has increased at a CAGR of 9.26% over the last 5 years from to Private Final Consumption on Restaurants & Hotel has grown at a CAGR of 8.29% over the 5 years period to (2018 data not yet available)
7 Industry Outlook 2. PROPOSED BRANDED HOTEL ROOMS ACROSS MAJOR CITIES ROHL has properties in Ahmedabad, Bengaluru, Chennai, Gurugram, Goa, and Jaipur / / 23 (P) Source: 2018 India Hospitality Trends & Opportunity report by Hotelivate Agra Ahmedabad Bengaluru Chennai New Delhi Gurugam NOIDA Goa Hyderabad Jaipur Kolkata Mumbai Pune Top 10 Busiest Airports in India by Passenger Traffic (2016/ /18) (Rs in Lakh) 2016/ /18 % Change Delhi (DIAL) % Mumbai (MIAL) % Bengaluru (BIAL) % Chennai % Kolkata % Hyderabad (GHIAL) % Cochin (CIAL) % Ahmedabad % Goa % Pune % A report by hospitality consulting firm Hotelivate shows expected rise in branded hotel rooms by 2023 given the increasing trend in the per capita income.
8 Key Growth Divers International tourist arrivals in India expected to reach 30.5 million by Medical tourism to touch $9 billion by 2020 (Source: IBEF) Diverse portfolio of with focus on niche tourism products cruises, adventure medical, wellness, sports, MICE, ecotourism, films, rural & religious tourism Robust Demand Attractive Opportunity Rising FDI Policy Support Hotel & Tourism sector has received cumulative FDI inflows of US$ billion between April 2000 and June 2018 (Source: IBEF) Government has allocated 100% FDI in Tourism & Hospitality sector under automated route. Swadesh Darshan scheme has 13 thematic circuits across the country selected for development of tourism infrastructure

9 Key Industry Challenges INFRASTRUCTURE Limited land availability at the desired location Rising property prices FUNDING Increasing cost of debt Medium to small size hotels, not favorable to PE, VC funding REGULATORY Delays in getting approvals and licenses leading to increasing project cost COMPETITION Entry of Travel aggregators intensifies competitive landscape
10 Company Overview Who we are? Our Journey Management Team Our Presence
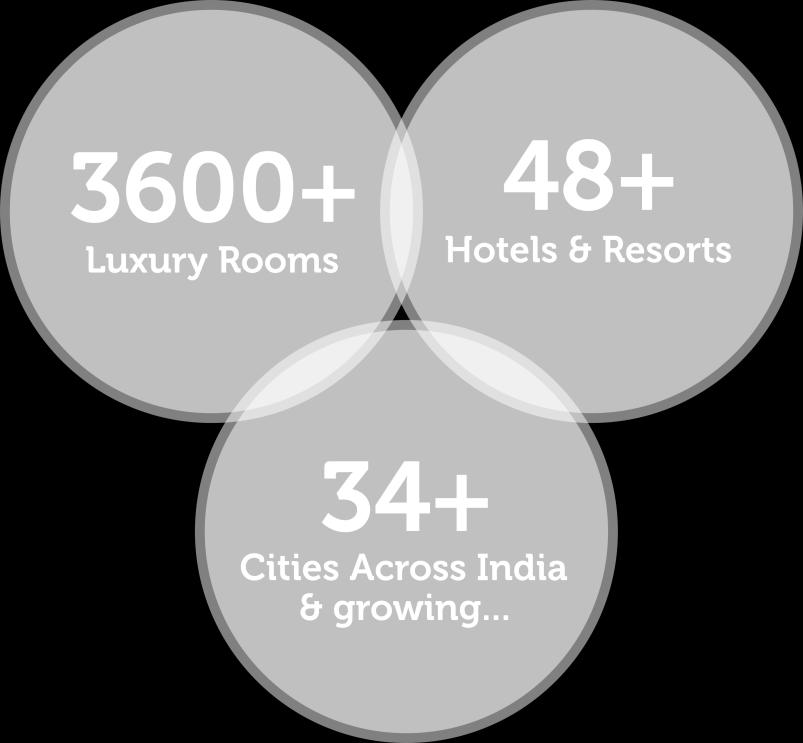
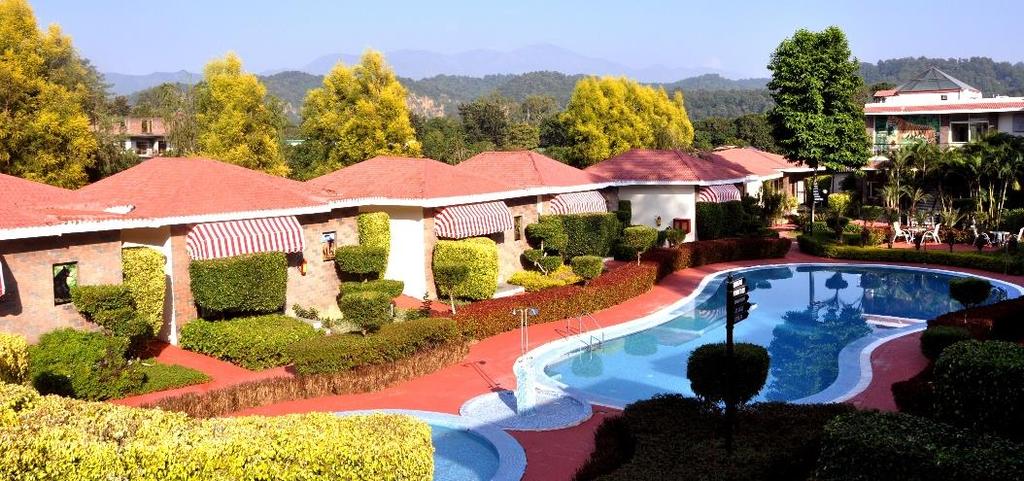
11 Who we are? Royal Orchid Hotel Ltd (ROHL) was incorporated in 1986 under the name of Universal Resorts Ltd. Promoted by Mr. Chander K Baljee ROHL is engaged in business of managing hotels under flagship brands Royal Orchid, Royal Orchid Central, Royal Orchid Suites, Regenta Hotels & Regenta Inn The no of hotels managed as of December 2018 is 48 FY18 turnover at Rs crore. Present in 34 locations 11 states with 3,378 no of keys and lakh Royal Reward members. Our Brands 5 Star 4 Star Hotel Royal Orchid Royal Orchid Central Regenta Central Service Apartment Royal Orchid Suites Resorts/ Heritage Royal Orchid Resorts Regenta Resorts
12 Our Journey 2001 Hotel Royal Orchid Bangalore 2003 Royal Orchid Central Bangalore 2004 Royal Orchid Metropole, Mysore 2006 Listed on 6th February Royal Orchid Resort & Convention Centre, Bangalore 2007 RO Golden Suites, Pune RO Central, Jaipur RO Brindavan, Mysore Nationwide Sales Offices 2008 Royal Orchid Central, Pune Royal Orchid Beach Resort & Spa, GOA 2008 Royal Orchid Suites, Bangalore Royal Orchid Central, Ahmedabad 2010 Royal Orchid Central, Grazia, Navi Mumbai Royal Orchid Central Kireeti, Hospet 2011 RO Central, Shimoga & Vadodara, RO Resort, Mussorie, RO, Jaipur Central Blue stone, Gurgaon 2012 Regenta MPG Club, Mahabaleshwar Regenta Central Ashok, Chandigarh 2013 Regenta Central, Jaipur Regenta Central Harimangla, Bharuch Malaika Beach resort, Tanzania 2014 Regenta, Ahmedabad Regenta Resort, Bhuj Regenta Central, Rajkot Regenta Orko s Haridwar Hotel Royal Orchid, Nairobi 2015 Regenta Al-meida, Chandigarh, Regenta Orko s Kolkata, Regenta Central Jhotwara, Jaipur, Regenta Camellia Resort & Spa, Shantinekhetan 2016 Regenta Central, Amritsar, Regenta Inn, Bangalore, Regenta Resort Varca Beach, Goa Regenta Resort Vanyamahal, Ranthambore, Regenta Central Deccan, Chennai Regenta Resort Tarika, Jim Corbett 2017 Regenta Central-Kolkata, Regenta Central-Vadodara, Regenta Central- Ludhiana, Regenta Central- Ahmedabad 2018 Regenta Inn-Dwarka, Regenta Resort-Pushkar, Regenta Central Somnath, Regenta Resort-Nashik, Regenta Central-Srinagar, Regenta Central-Dahej, Regenta Central- Bharatpur, Regenta Central Nagpur


13 Key Management Mr. Chander Baljee, Managing Director Royal Orchid Hotels is promoted by Mr. Chander K Baljee, a P.G Graduate from Indian Institute of Management (Ahmedabad) with over 4 decades of experience in the hospitality industry Mr. Amit Jaiswal, Chief Financial Officer Mr. Amit Jaiswal is a Commerce graduate from Calcutta University MBA, BA LLB. He has vast experience of 25 years in different industries including Finance, Manufacturing and Hotels. Mr. Pushpinder Kumar, Executive Director A graduate from IHM, Mumbai and OCLD (Gold medalist) with 28+ years of experience with Marriott Renaissance, Oberoi hotels & Park Plaza Hotels. Previously recognized as the CEO for Fern Hotels and Resorts. Mr. Vikas Passi, Vice President Operations A Hotel Management graduate from Mangalore University and MBA in Sales & Marketing from Pune University, having 16+ years of vast experience in hotel operations and sales. Mr. Ranjan Gupta, Vice President Operations (South) A Hotel Management graduate from IHM, Mumbai, having 30+ years of vast experience in hotel operations and development.

14 Our Geographical footprints Royal Orchid & Regenta Hotels Across India
15 Business Overview Our Business Structure Our Business Model Our Offerings Competitive Advantage
16 Our Business Structure Royal Orchid Hotels Limited (ROHL) By Business Portfolio By Legal Entity Owned hotels Leased Hotels Managed & Franchised Hotels Subsidiaries Companies
17 Our Business Model -Asset Light Model Steadily gaining strong foothold through focus on Management contracts which will lead to high growth Key factors No upfront requirement of capex Maintenance Capex required Rs 1.5 cr to 2 cr (approx) Break even of Operating profit in just 1 year Facilitates expansion plans and ramping up presence Creates brand visibility at a faster rate
18 Asset Portfolio Revenue Model Category FY 2018 YTD FY2019 (%) 5 Star % 4 Star 1,840 1,911 4% Service Apartment % Resort/Heritage/MICE % Total Keys 3,294 3,378 3% Category FY 2018 YTD FY2019 (%) Owned % Leased % JV % Managed 2,317 2,354 2% Total Keys 3,294 3,378 3% Category Owned Leased JV Managed Total 5 Star Star ,536 1,911 Service Apartment Resort/Heritage/MICE Total Keys ,354 3,378
19 Growth in rooms and loyalty members Steady growth in rooms No of Properties ,000 3,000 2,000 1, ,426 1,557 1,645 1,943 2,224 2,613 3,159 3,294 FY12 FY13 FY14 FY15 FY16 FY17 FY18 YTDFY19 Beginning of the year Additions 3,00,000 2,00,000 1,00,000 - Loyalty members 2,16,694 1,74,086 1,33,055 98,874 51,704 66,881 2,534 FY13 FY14 FY15 FY16 FY17 FY18 YTDFY19
20 Property breakup with rooms Adding No of Keys FY18 YTDFY18 YTDFY19 Management Contracts 2,317 2,292 2,354 JV Owned (Domestic) Owned (Overseas) Leased Total KEYS 3,294 3,269 3,378 Average Occupancy rate (JLO) 78% 76% 76% Average Room Rate (JLO) (Rs) 3,853 3,720 4,079 Average Occupancy rate (Managed) 67% 65% 70% Average Room Rate (Managed) (Rs) 2,886 2,847 2,884


21 Business Hotels Current Locations Bangalore Mysore Jaipur Shimoga Pune Bharuch Gurgaon Ahmedabad Rajkot Chennai Chandigarh Kolkata Kanpur Ludhiana Vadodara


22 Leisure Destinations Current Locations Goa Mysore Ranthambore Jim Corbett Mussoorie Bangalore Jaipur Bhuj Pushkar Hampi Mahabaleshwar


23 Wedding Destinations Current Locations Bangalore Mysore Goa Mussoorie Jaipur Dehradun Amritsar Ranthambore Bhuj Mahabaleshwar Ludhiana


24 Religious Destinations Current Locations Amritsar Ajmer Haridwar Dwarka


25 Wild-life Tourism Currently Located: Ranthambore Jim Corbett Haridwar
26 Competitive Advantage Balanced portfolio having presence in over 34 locations and 11 states Strong sales presence across major source markets in India Affordable luxury having plethora of options for modern travellers
27 Financial Overview Quarterly & Nine months Highlights and Financial results Margins Consolidated Income Statement & Balance Sheet snapshot Shareholding
28 Quarter and Nine months highlights Quarterly Q3FY18 Q2FY19 Q3FY19 Revenue from operations EBITDA PAT YTD Nine Months ended YTDFY18 YTDFY19 Revenue from operations EBITDA PAT Rs. In crore
29 Margins Quarterly Margins Year to date Margins 30% 25% 25% 20% 15% 10% 24% 19% 14% 18% 16% 11% 22% 18% 14% 20% 15% 10% 17% 14% 19% 16% 11% 11% 5% 5% 0% Q3FY18 Q2FY19 Q3FY19 0% YTDFY18 YTDFY19 EBITDA PBT PAT EBITDA PBT PAT
30 Quarter ended financial results Particulars (Rs in Crs) Q3FY19 Q2FY19 Q3FY18 Q3FY19 vs Q2FY19 Q3FY19 vs Q3FY18 Income from Operations % 8% Total Income % 8% Cost of Material Consumed % 16% Employee Benefits Expense % 11% Power and fuel Expense % 27% Rent Expense % 13% Other Expenses % 2% Total Expense % 10% EBITDA % 0% EBITDA Margin (%) 22% 18% 24% 23% -7% Other Income % -8% Depreciation % -2% EBIT % -2% Finance Cost % -14% PBT % 1% Tax Current Tax % -21% Deferred Tax % -311% Total Tax % -14% Exceptional Items % 0% Net Profit % 6% Other Comprehensive Income/(Loss) % 0% Total Comprehensive Income % 6% Net Profit Margin (%) 14% 11% 14% 35% 0% EPS (In Rs) % 6%
31 Nine months ended financial results Particulars (Rs in Crs) YTDFY19 YTDFY18 YTDFY19 vs YTDFY18 Income from Operations % Total Income % Cost of Material Consumed % Employee Benefits Expense % Power and fuel Expense % Rent Expense % Other Expenses % Total Expense % EBITDA % EBITDA Margin (%) 19% 17% 11% Other Income % Depreciation % EBIT % Finance Cost % PBT % Tax Current Tax % Deferred Tax % Total Tax % Exceptional Items - - 0% Net Profit % Other Comprehensive Income/(Loss) - - 0% Total Comprehensive Income % Net Profit Margin (%) 11% 11% 4% EPS (In Rs) %
32 Sustainable Growth Consolidated numbers Revenue from Operations FY16 FY17 FY EBITDA EBITDA Margins 15.49% 12.83% 10.83% FY16 FY17 FY18 20% 15% 10% 5% 0% 20 Cash Profit 2 Net Debt to Equity Interest Coverage FY16 FY17 FY FY16 FY17 FY18 Rs. In crore
33 Consolidated Income Statement - Snapshot Particulars (Rs in Crs) FY17 FY18 Income from Operations Total operating expenses EBITDA EBITDA Margin (%) 10.83% 16.13% Other Income Finance Cost PBT PBT Margins (%) 0.06% 4.61% Tax PAT PAT Margins (%) -2.42% 1.23%
34 Consolidated Balance Sheet - Snapshot Particulars (Rs in Crs) FY 2018 FY 2017 Assets Property, plant and equipment Capital work-in-progress Goodwill Other non-current assets Total Non-current assets Current Assets Total assets Equity and liabilities (a) Equity share capital (b) Other equity Total Networth Non-Controlling Interests Secured Loan and other non current liabilities Total Non-current liabilities Current Liabilities Total equity and liabilities

35 Shareholding Promoters Mutual Funds Foreign Portfolio Investors Others Key Investors Holding (%) 5.86 National Westminster Bank PLC as trustees of the Jupiter India Fund 4.07% Jupiter South Asia Investment Company Limited - South Asia Access Fund Edelweiss Trusteeship Co Ltd AC- Edelweiss MF AC- Edelweiss Mid Cap Fund 1.08% 0.42%
Date: February 02, 2018
 Date: February 02, 2018 To, The Manager, Listing Compliance, Department of Corporate Services, BSE Limited, Floor 25, P. J. Towers, Dalal Street, Mumbai 400 001 BSE Scrip Code: 532699 To, The Manager,
Royal Orchid Hotels Ltd Q4FY17 & FY17 Results Presentation. Expect more from Royal Orchid Hotels
 Royal Orchid Hotels Ltd Q4FY17 & FY17 Results Presentation Expect more from Royal Orchid Hotels 1 in every 11 people worldwide are employed by TOURISM SECTOR High Employment Potential Sector Rs 10 Lakhs
Royal Orchid Hotels Ltd Q1FY18 Results Presentation. Expect more from Royal Orchid Hotels
 Royal Orchid Hotels Ltd Q1FY18 Results Presentation Expect more from Royal Orchid Hotels 1 in every 11 people worldwide are employed by TOURISM SECTOR High Employment Potential Sector Rs 10 Lakhs of Investment
Royal Orchid Hotels Ltd Investor Presentation. Expect more from Royal Orchid Hotels
 Royal Orchid Hotels Ltd Investor Presentation Expect more from Royal Orchid Hotels 1 in every 11 people worldwide are employed by TOURISM SECTOR High Employment Potential Sector Rs 10 Lakhs of Investment
Royal Orchid Hotels Investor Presentation Q2FY17. Expect more from Royal Orchid Hotels
 Royal Orchid Hotels Investor Presentation Q2FY17 Expect more from Royal Orchid Hotels 1 in every 11 people worldwide are employed by TOURISM SECTOR High Employment Potential Sector Rs 10 Lakhs of Investment
Royal Orchid & Regenta Hotels
 Royal Orchid & Regenta Hotels Presentation expect more History Royal Orchid & Regenta Hotels is one of India s fastest growing hotel chains primarily operates 4 and 5 star hotels, one of India s most
Nicco Parks & Resorts Ltd BSE Scrip Code:
 Nicco Parks & Resorts Ltd BSE Scrip Code: 526721 Other Leisure Facilities September 14, 2012 Equity Statistics Current Market Price Rs. 15.9 52 Week High / Low Rs. 24.4/15.2 Market Capitalisation Rs. crores
DLF Ltd. Q1 Analyst Presentation
 DLF Ltd. Q1 Analyst Presentation 1 Results at a Glance Q1 Sl.No. Consolidated Financials 1Q FY08 Rs. In Crores A) 1 Sales and Other Receipts 3074 2 Other Income 47 Percentage of Total Revenue Margins(%)
Investor Presentation
 Investor Presentation ICR XChange January 17, 2008 Forward-Looking Statements Some of the statements in this presentation constitute forward-looking statements. Forward-looking statements relate to expectations,
--- Disclosure A uirements) A~ulatlons October 24, 2018 IGAUSECT / /1 0
 A~ulatlons October 24, 2018 IGAUSECT / /1 0") October 24, 2018 IGAUSECT /1 0-1 8/1 0 To National Stock Exchange of India limited Exchange Plaza, C - 1, Block G Sandra Kurla Complex Sandra - (E) Mumbai - 400 051 Symbol: INDIGO To Department of Corporate
October 24, 2018 IGAUSECT /1 0-1 8/1 0 To National Stock Exchange of India limited Exchange Plaza, C - 1, Block G Sandra Kurla Complex Sandra - (E) Mumbai - 400 051 Symbol: INDIGO To Department of Corporate
GMR Infrastructure Limited
 GMR Infrastructure Limited Registered Office: Naman Centre, 7th Floor Opp. Dena Bank, Plot No. C-31 G Block, Bandra Kurla Complex Bandra(East), Mumbai Maharashtra, India-400051 CIN: L45203MH1996PLC281138
Q4 & FULL YEAR FY15 RESULTS UPDATE MAY 2015
 Q4 & FULL YEAR FY15 RESULTS UPDATE MAY 2015 DISCUSSION SUMMARY Q4 & FY15 RESULTS HIGHLIGHTS OUR PORTFOLIO UPDATE AMUSEMENT PARK, BANGALORE RESORT, BANGALORE AMUSEMENT PARK, KOCHI AMUSEMENT PARK, HYDERABAD
Financial Results Q1 FY September 2017
 Financial Results Q1 FY18 12 September 2017 2 Key Highlights Q1FY18 Net profit after tax of INR 58cr Ninth successive profitable quarter for the Group Gross debt reduced by INR 398cr and net debt almost
MGM Resorts International Reports Second Quarter Financial Results
 NEWS RELEASE MGM Resorts International Reports Second Quarter Financial Results 8/5/2014 Consolidated Adjusted EBITDA Increased 8%, Led By 10% Growth In Wholly Owned Domestic Resorts MGM China Declares
ERW. 022/ ACC003/ th February Subject: Management's Discussion and Analysis period ending 31 st December 2012
 ERW. 022/ ACC003/56 26 th February 2013 Subject: Management's Discussion and Analysis period ending 31 st December 2012 Attention: The President, The Stock Exchange of Thailand Dear Sir, The Erawan Group
Indiabulls Real Estate Limited (CIN : L45101DL2006PLC148314)
") Indiabulls Real Estate Limited (CIN : L45101DL2006PLC148314) Earnings Update Audited Financial Results FY 2013-14 April 23, 2014 Safe Harbor Statement This document contains certain forward looking statements
Indiabulls Real Estate Limited (CIN : L45101DL2006PLC148314) Earnings Update Audited Financial Results FY 2013-14 April 23, 2014 Safe Harbor Statement This document contains certain forward looking statements
Q2 & H1 FY17 RESULT UPDATE October 2016
 Q2 & H1 FY17 RESULT UPDATE October 2016 DISCUSSION SUMMARY Q2 & H1 FY17 RESULT HIGHLIGHTS Q2 & H1 FY17 PORTFOLIO UPDATE AMUSEMENT PARK, BANGALORE RESORT, BANGALORE AMUSEMENT PARK, KOCHI AMUSEMENT PARK,
Lemon Tree Hotels Limited
 Lemon Tree Hotels Limited Q1 FY19 Earnings Presentation Aug 13, 2018 Disclaimer Certain statements in this communication may be forward looking statements within the meaning of applicable laws and regulations.
Lemon Tree Hotels Limited
 Lemon Tree Hotels Limited Q4 & FY18 Earnings Presentation May 25, 2018 Disclaimer Certain statements in this communication may be forward looking statements within the meaning of applicable laws and regulations.
Financial Results Q3FY February
 Financial Results Q3FY18 14 February Key Highlights Q3FY18 Net profit after tax of INR 186cr Eleven successive profitable quarters for the Group Operating revenue increased by 10.2% and PLF% by 4.4pts
GMR Infrastructure Limited
 GMR Infrastructure Limited Corporate Office: IBC Knowledge Park. Phase 2. "D" Block. 10th Floor. 4/1. Bannerghatta Road. Bangalore 560 029 T +91 8040432000 F +91 80 40432333 W www.gmrgroup.in November
Financial Results Q3 FY February 2016
 Financial Results Q3 FY17 03 February 2016 2 Agenda Key performance highlights Jet Airways performance highlights 3 Key highlights Net profit after tax of INR 156.3 crores - Seventh successive profitable
JET AIRWAYS (I) LTD. Presentation on Financial Results Q3 2012
 LTD. Presentation on Financial Results Q3 2012") JET AIRWAYS (I) LTD Presentation on Financial Results Q3 2012 20.01.2012 1 1 1 Domestic operating environment 2 2 2 Domestic industry. 8.00 7.00 6.00 5.00 4.00 3.00 Q3 12 vs Q3 11 Industry capacity 17%
JET AIRWAYS (I) LTD Presentation on Financial Results Q3 2012 20.01.2012 1 1 1 Domestic operating environment 2 2 2 Domestic industry. 8.00 7.00 6.00 5.00 4.00 3.00 Q3 12 vs Q3 11 Industry capacity 17%
DLF Limited. Q2 Analyst Presentation
 DLF Limited Q2 Analyst Presentation 1 Results at a Glance Q2 Q2 FY08 Percentage Sl.No. Consolidated Financials Rs. Crs. of Total Revenue Rs. Crs A) 1 Sales and Other Receipts 3,250 3,074 2 Other Income
Fourth Quarter and Full Year 2009
 Investor and analyst meeting: Fourth Quarter and Full Year 29 25 th February 21 2 The views expressed here contain some information derived from publicly available sources that have not been independently
Q2 & H1 FY18 RESULT HIGHLIGHTS Q2 & H1 FY18 PORTFOLIO UPDATE AMUSEMENT PARK, BANGALORE RESORT, BANGALORE AMUSEMENT PARK, KOCHI AMUSEMENT PARK,
 Q2 & H1 FY18 RESULT HIGHLIGHTS Q2 & H1 FY18 PORTFOLIO UPDATE AMUSEMENT PARK, BANGALORE RESORT, BANGALORE AMUSEMENT PARK, KOCHI AMUSEMENT PARK, HYDERABAD FINANCIALS COMPANY OVERVIEW 2 Q2 & H1 FY18 RESULT
Q3 & 9M FY16 RESULT UPDATE FEBRUARY 2016
 Q3 & 9M FY16 RESULT UPDATE FEBRUARY 2016 GLOBAL RANKING AND RECOGNITION Wonderla parks were ranked at #1 and #2 in India by Tripadvisor for 2015. Wonderla parks were ranked at #7 and #9 in Asia by TripAdvisor
ERW. 083/ ACC012/ th November Subject: Management's Discussion and Analysis period ending 30 th September 2012
 ERW. 083/ ACC012/55 12 th November 2012 Subject: Management's Discussion and Analysis period ending 30 th September 2012 Attention: The President, The Stock Exchange of Thailand Dear Sir, The Erawan Group
Financial Results Q2 FY November 2016
 Financial Results Q2 FY17 11 November 2016 2 Agenda Key performance highlights Jet Airways performance highlights 3 Key highlights Net profit after tax of INR 84.9 crores - Sixth successive profitable
Q2 & H1 FY16 RESULT UPDATE OCTOBER 2015
 Q2 & H1 FY16 RESULT UPDATE OCTOBER 2015 GLOBAL RANKING AND RECOGNITION Wonderla parks were ranked at #1 and #2 in India by Tripadvisor for 2015. Wonderla parks were ranked at #7 and #9 in Asia by TripAdvisor
All Time High Quarter I Results, FY Net Sales up 35.7 %, EBITDA up 65.6 %, Net profit up 55.8%
 All Time High Quarter I Results, FY 2014-15 Net Sales up 35.7 %, EBITDA up 65.6 %, Net profit up 55.8% Mumbai, July 30, 2014: Pharma Major, Lupin Ltd. reported its performance for the first quarter ending
MGM Resorts International Reports First Quarter Financial And Operating Results
 NEWS RELEASE MGM Resorts International Reports First Quarter Financial And Operating Results 4/27/2017 LAS VEGAS, April 27, 2017 /PRNewswire/ -- MGM Resorts International (NYSE: MGM) ("MGM Resorts" or
Financial Results Q3 FY16
 Financial Results Q3 FY16 6 February 2016 Agenda Key performance highlights Jet Airways performance highlights JetLite performance highlights 2 Key highlights Highest ever quarterly and period profit Jet
IPO Report LEMON TREE HOTELS LTD AVOID. Valuation. IPO Details o. Research Analyst : Astha Jain
 IPO Report LEMON TREE HOTELS LTD AVOID IPO Details o Issue Date 26 th Mar-28 th Mar 2018 Price Band 54-56/Share Bid Lot 265 & in multiplethere of Face Value Rs 10/Share Listing BSE, NSE Offer For Sale
Financial Results Q2 FY December 2017
 Financial Results Q2 FY18 07 December 2017 2 Key Highlights Q2FY18 Net profit after tax of INR 71cr Ten successive profitable quarters for the Group Net debt reduced during the quarter by INR 194cr Continued
Summary of Results for the First Quarter of FY2015/3
 Summary of for the First Quarter of FY2015/3 August 8, 2014 Tokyu Corporation (9005) http://www.tokyu.co.jp/ Contents Ⅰ.Executive Summary 2 Ⅱ.Conditions in Each Business 4 Ⅲ.Details of Financial for the
Q1 FY19 RESULT UPDATE August 2018
 RESULT UPDATE August 2018 RESULT HIGHLIGHTS PORTFOLIO UPDATE AMUSEMENT PARK, BANGALORE RESORT, BANGALORE AMUSEMENT PARK, KOCHI AMUSEMENT PARK, HYDERABAD FINANCIALS COMPANY OVERVIEW 2 RESULT HIGHLIGHTS
Financial Results Q2 FY December 2017
 Financial Results Q2 FY18 07 December 2017 2 Key Highlights Q2FY18 Net profit after tax of INR 71cr Ten successive profitable quarters for the Group Net debt reduced during the quarter by INR 194cr Continued
Key Highlights Q4FY18
 Key Highlights Q4FY18 Net loss after tax of INR 1,040cr Q4FY18 results adversely impacted on account of: Year-on-Year impact of increase in fuel prices of INR 366 crores; Mark-to-market adjustment due
OPERATING AND FINANCIAL HIGHLIGHTS. Subsequent Events
 Copa Holdings Reports Net Income of $103.8 million and EPS of $2.45 for the Third Quarter of 2017 Excluding special items, adjusted net income came in at $100.8 million, or EPS of $2.38 per share Panama
Summary of Results for the First Three Quarters FY2015/3
 Summary of Results for the First Three Quarters FY2015/3 February 10, 2015 Tokyu Corporation (9005) http://www.tokyu.co.jp/ Contents Ⅰ.Executive Summary 2 Ⅱ.Conditions in Each Business 5 Ⅲ.Details of Financial
Forward-Looking Statements Statements in this presentation that are not historical facts are "forward-looking" statements and "safe harbor
 2017 Annual Meeting of Shareholders Presentation May 2017 Forward-Looking Statements Statements in this presentation that are not historical facts are "forward-looking" statements and "safe harbor statements"
Domestic Travel Policy CMS
 Page 1 of 10 Domestic Travel Policy CMS Policy Manual: Version 2/2013 Page 1 of 10 Page 2 of 10 1.0 Objective: To reimburse the traveling expenses incurred by Management Staff on work. 2.0 Effective Date:
For more information or additional copies of this document, please contact:
 INDIAN HOTEL INDUSTRY SURVEY 2016-2017 For more information or additional copies of this document, please contact: Secretary General Federation of Hotel & Restaurant Associations of India (FHRAI) th B-82,
Thank you for participating in the financial results for fiscal 2014.
 Thank you for participating in the financial results for fiscal 2014. ANA HOLDINGS strongly believes that safety is the most important principle of our air transportation business. The expansion of slots
Q4 & FY17 RESULT UPDATE MAY 2017
 Q4 & FY17 RESULT UPDATE MAY 2017 DISCUSSION SUMMARY Q4 & FY17 RESULT HIGHLIGHTS Q4 & FY17 PORTFOLIO UPDATE AMUSEMENT PARK, BANGALORE RESORT, BANGALORE AMUSEMENT PARK, KOCHI AMUSEMENT PARK, HYDERABAD COMPANY
Brigade Group. Investor Presentation Q2 FY
 Brigade Group Investor Presentation Q2 FY 2014 15 Q2 FY 15 Key Highlights Standalone Q2 FY 2014 15 Revenue of Rs. 3.29 Bn (82% Y o Y increase) and PAT of Rs. 0.22 Bn (13% Y o Y increase) Standalone YTD
Investor Update Q1 FY18.
 Investor Update Q1 FY18. Disclaimer This report contains forward-looking statements, which may be identified by their use of words like plans, expects, will, anticipates, believes, intends, projects, estimates,
Realty Decoded - Q4 FY 18 April 2018
 Realty Decoded - FY 18 April 2018 Executive Summary Indian real estate has finally come out of bottom of down- cycle in FY 18 with sales growing by more than 35% over FY 17 Sales increase is not limited
Jet Airways (India) Ltd. Presentation on Financial Results Q3 FY th January 2008
 Ltd. Presentation on Financial Results Q3 FY th January 2008") Jet Airways (India) Ltd. Presentation on Financial Results Q3 FY08 28 th January 2008 1 1 1 Agenda Performance highlights Q3 FY08 Apr - Dec FY08 Outlook JetLite performance highlights 2 2 2 Performance
Jet Airways (India) Ltd. Presentation on Financial Results Q3 FY08 28 th January 2008 1 1 1 Agenda Performance highlights Q3 FY08 Apr - Dec FY08 Outlook JetLite performance highlights 2 2 2 Performance
Certain statements in this release concerning Jet Airways future growth prospects are forward-looking statements, which involve a number of risks,
 Certain statements in this release concerning Jet Airways future growth prospects are forward-looking statements, which involve a number of risks, and uncertainties that could cause actual results to differ
Partial List of Customers for Celfrost - All India
 Partial List of Customers for Celfrost - All India 30-09-2014 S. No. Customer / Brands Location Description of Products Application 1 Oberoi Flight Kitchen Delhi 32 big size Cold Rooms and Blast Chillers
An Overview of SATS. Cho Wee Peng, CFO SIAS Corporate Profile & Investment Seminar 30 November 2013
 An Overview of SATS Cho Wee Peng, CFO SIAS Corporate Profile & Investment Seminar 30 November 2013 Forward Looking Statements This presentation may contain forward-looking statements regarding, among other
Melco International Development Limited (Incorporated in Hong Kong with limited liability) Website : (Stock Code : 200)
 Website : (Stock Code : 200)") Hong Kong Exchanges and Clearing Limited and The Stock Exchange of Hong Kong Limited take no responsibility for the contents of this announcement, make no representation as to its accuracy or completeness
Hong Kong Exchanges and Clearing Limited and The Stock Exchange of Hong Kong Limited take no responsibility for the contents of this announcement, make no representation as to its accuracy or completeness
OPERATING AND FINANCIAL HIGHLIGHTS
 Copa Holdings Reports Financial Results for the Fourth Quarter of 2018 Excluding special items, adjusted net profit came in at $44.0 million, or Adjusted EPS of $1.04 Panama City, Panama --- February 13,
JET AIRWAYS (I) LTD. Presentation on Financial Results Q4 FY08
 LTD. Presentation on Financial Results Q4 FY08") JET AIRWAYS (I) LTD Presentation on Financial Results Q4 FY08 June 24, 2008 1 1 1 Agenda Domestic operating environment Jet Airways performance highlights JetLite performance highlights Consolidated Jet
JET AIRWAYS (I) LTD Presentation on Financial Results Q4 FY08 June 24, 2008 1 1 1 Agenda Domestic operating environment Jet Airways performance highlights JetLite performance highlights Consolidated Jet
Q3 & 9M FY18 RESULT UPDATE February 2018
 Q3 & 9M FY18 RESULT UPDATE February 2018 Q3 & 9M FY18 RESULT HIGHLIGHTS Q3 & 9M FY18 PORTFOLIO UPDATE AMUSEMENT PARK, BANGALORE RESORT, BANGALORE AMUSEMENT PARK, KOCHI AMUSEMENT PARK, HYDERABAD FINANCIALS
Marriott International Reports Third Quarter 2016 Results
 November 7, 2016 Marriott International Reports Third 2016 Results BETHESDA, Md., Nov. 7, 2016 /PRNewswire/ -- HIGHLIGHTS Marriott International's acquisition of Starwood Hotels & Resorts Worldwide closed
1.0 TRAFFIC SUMAPRY 2.0 AIRCRAFT MOVEMENTS:
 1.0 TRAFFIC SUMAPRY During the month of 2010, all operational airports (taken together) handled 111.40 thousand aircraft movements (excludes general aviation movements), 11.01 million passengers and 180.10
FIRST QUARTER RESULTS 2017
 FIRST QUARTER RESULTS 2017 KEY RESULTS In the 1Q17 Interjet total revenues added $4,421.5 million pesos that represented an increase of 14.8% over the income generated in the 1Q16. In the 1Q17, operating
Religare Health Trust 1 st Annual General Meeting. 25 th July 2013
 Religare Health Trust 1 st Annual General Meeting 25 th July 2013 Disclaimer This presentation may contain forward-looking statements that involve risks and uncertainties. Actual future performance, outcomes
AIRPORT MODERNISATION IN INDIA By K Roy Paul Secretary, Ministry of Civil Aviation, India and Chairman, Air-India Limited
 - 1 - AIRPORT MODERNISATION IN INDIA By K Roy Paul Secretary, Ministry of Civil Aviation, India and Chairman, Air-India Limited With phenomenal growth in air traffic, the importance of air transport in
Investor Relations Update January 25, 2018
 General Overview Investor Relations Update Accounting Changes On January 1, 2018, the company adopted two new Accounting Standard Updates: (ASUs): ASU 2014-9: Revenue from Contracts with Customers (the
INVESTOR PRESENTATION DECEMBER 2013
 INVESTOR PRESENTATION DECEMBER 2013 Particulars Q3-14 Q2-14 Q3-13 YTD Q3 14 YTD Q3 13 Rs. Mn Rs. Mn Rs. Mn Rs. Mn Rs. Mn Q3 14 on Q2 14 YTD Q3 Q3 14 14 on on Q3 13 YTD Q3 13 Turnover 1,835 1,808 1,591
China Lodging Group (HTHT.US) Q Earnings Call August 17, 2017
 Q Earnings Call August 17, 2017") China Lodging Group (HTHT.US) Q2 2017 Earnings Call August 17, 2017 Agenda Lodging Landscape in China Strategy Review Operational and Financial Review Q & A Appendix 1 Strong Demand: Domestic Travel Remains
China Lodging Group (HTHT.US) Q2 2017 Earnings Call August 17, 2017 Agenda Lodging Landscape in China Strategy Review Operational and Financial Review Q & A Appendix 1 Strong Demand: Domestic Travel Remains
Investment Highlights
 Third Quarter 2014 Investment Highlights 1 Mexican airport portfolio positioned to take full advantage of global growth. 2 Diversified business model contributing to earnings resilience. 3 Well-defined
Tiger Airways Holdings Limited FY11 Results
 Tiger Airways Holdings Limited FY11 Results May 2011 Financial Year Ended 31 March 2011 Disclaimer The information contained in this presentation (the "Information") is provided by Tiger Airways Holdings
OPERATING AND FINANCIAL HIGHLIGHTS. Subsequent Events
 Copa Holdings Reports Financial Results for the First Quarter of 2016 Excluding special items, adjusted net income came in at US$69.9 million, or EPS of US$1.66 per share Panama City, Panama --- May 5,
Historical Statistics
 Historical Statistics FedEx Corporation Financial and Operating Statistics FY 2005 FY 2014 This report is a statistical supplement to FedEx s interim financial reports and is prepared quarterly. Additional
Indian Media Industry Overview
 HT Media Ltd Indian Media Industry Overview Sector dynamics 1.6 1.4 1.2 1.0 0.8 0.6 High growth potential 0.55 1.12 1.34 0.95 0.98 0.4 0.34 0.2 0.0 India China Singapore US UK Global Advertising spend
Melco International Development Limited (Incorporated in Hong Kong with limited liability) Website : (Stock Code : 200)
 Website : (Stock Code : 200)") Hong Kong Exchanges and Clearing Limited and The Stock Exchange of Hong Kong Limited take no responsibility for the contents of this announcement, make no representation as to its accuracy or completeness
Hong Kong Exchanges and Clearing Limited and The Stock Exchange of Hong Kong Limited take no responsibility for the contents of this announcement, make no representation as to its accuracy or completeness
JET AIRWAYS (I) LTD. Presentation on Financial Results Q July 24, 2009
 LTD. Presentation on Financial Results Q July 24, 2009") JET AIRWAYS (I) LTD Presentation on Financial Results Q1 2010 July 24, 2009 1 1 1 Agenda Domestic operating environment Jet Airways performance highlights JetLite performance highlights Outlook 2 2 2 Domestic
JET AIRWAYS (I) LTD Presentation on Financial Results Q1 2010 July 24, 2009 1 1 1 Agenda Domestic operating environment Jet Airways performance highlights JetLite performance highlights Outlook 2 2 2 Domestic
Summary o f Results for the First Half of FY2018
 Summary o f Results for the First Half of FY2018 November 9, 2018 (9005) https://www.tokyu.co.jp/ Contents Ⅰ.Executive Summary 2 Ⅱ.Conditions in Each Business 6 Ⅲ.Details of Financial Results for the 13
Management Presentation. March 2016
 Management Presentation March 2016 Forward looking statements This presentation as well as oral statements made by officers or directors of Allegiant Travel Company, its advisors and affiliates (collectively
Disclosure under Regulation 30 of the SEBI (Listing Obligations and Disclosure Requirements) Regulations, 2015
 Regulations, 2015") September 10, 2018 Department of Corporate Services, BSE Limited, Phiroz Jeejeebhoy Towers, Dalal Street, Mumbai - 400 001 Reference: Subject: Scrip Code: 500285 and Scrip ID: SPICEJET Disclosure under
September 10, 2018 Department of Corporate Services, BSE Limited, Phiroz Jeejeebhoy Towers, Dalal Street, Mumbai - 400 001 Reference: Subject: Scrip Code: 500285 and Scrip ID: SPICEJET Disclosure under
Airports NOVEMBER For updated information, please visit
 Airports NOVEMBER 1 Contents Advantage India Market overview and trends Growth drivers Success stories: Delhi, Mumbai Opportunities Useful information 2 Airports NOVEMBER Advantage India 2000 No of operational
THIRD QUARTER RESULTS 2018
 THIRD QUARTER RESULTS 2018 KEY RESULTS In the 3Q18 Interjet total revenues added $ 6,244.8 million pesos that represented an increase of 7.0% over the revenue generated in the 3Q17. In the 3Q18, operating
MGM Resorts International Reports Strong First Quarter Financial And Operating Results
 NEWS RELEASE MGM Resorts International Reports Strong First Quarter Financial And Operating Results 5/5/2016 Increases Wholly Owned Domestic Resorts Net Revenue and Adjusted Property EBITDA by 3% and 24%
INVESTOR PRESENTATION. May 2015
 INVESTOR PRESENTATION May 2015 Forward-looking Statements This presentation contains forward-looking statements within the meaning of the Private Securities Litigation Reform Act of 1995 that reflect the
JET AIRWAYS (I) LTD. Financial Results Q1 FY09
 LTD. Financial Results Q1 FY09") JET AIRWAYS (I) LTD Presentation on Financial Results Q1 FY09 July 29, 2008 1 1 1 Agenda Domestic operating environment Jet Airways performance highlights JetLite performance highlights Outlook 2 2 2 Domestic
JET AIRWAYS (I) LTD Presentation on Financial Results Q1 FY09 July 29, 2008 1 1 1 Agenda Domestic operating environment Jet Airways performance highlights JetLite performance highlights Outlook 2 2 2 Domestic
Quarterly Meeting# 4/2018
 Quarterly Meeting# 4/2018 3Q18 & 9M18 Performance & Outlook 14 November 2018 1 2016 ERAWAN. All rights reserved. The views expressed here contain some information derived from publicly available sources
SET Opportunity Day #3/2011
 SET Opportunity Day #3/2011 2Q11 & 1H11 Performance & Outlook 18 August 2011 The views expressed here contain some information derived from publicly available sources that have not been independently verified.
Copa Holdings Reports Net Income of $136.5 million and EPS of $3.22 for the First Quarter of 2018
 Copa Holdings Reports Net Income of $136.5 million and EPS of $3.22 for the First Quarter of 2018 May 9, 2018 PANAMA CITY, May 9, 2018 /PRNewswire/ -- Copa Holdings, S.A. (NYSE: CPA), today announced financial
Peppers Docklands, Melbourne
 Peppers Docklands, Melbourne Contents Mantra Group Overview State of Market 8 3 Australian Market Mantra Group 18 24 Mantra Salt, Kingscliff Peppers Noosa, Noosa Mantra Group* CBD - RevPAR (A$) Largest
Copa Holdings Reports Record Earnings of US$41.8 Million for 4Q06 and US$134.2 Million for Full Year 2006
 Copa Holdings Reports Record Earnings of US$41.8 Million for 4Q06 and US$134.2 Million for Full Year 2006 Panama City, Panama --- March 7, 2007. Copa Holdings, S.A. (NYSE: CPA), parent company of Copa
JET AIRWAYS (I) LTD. Presentation on Financial Results Q2 FY10
 LTD. Presentation on Financial Results Q2 FY10") JET AIRWAYS (I) LTD Presentation on Financial Results Q2 FY10 October 27, 2009 1 1 1 Agenda Domestic operating environment Jet Airways performance highlights JetLite performance highlights Outlook 2 2
JET AIRWAYS (I) LTD Presentation on Financial Results Q2 FY10 October 27, 2009 1 1 1 Agenda Domestic operating environment Jet Airways performance highlights JetLite performance highlights Outlook 2 2
OPERATING AND FINANCIAL HIGHLIGHTS
 Copa Holdings Reports Net Income of US$32.0 Million and EPS of US$0.72 for the Second Quarter of 2012 Excluding special items, adjusted net income came in at $58.6 million, or EPS of $1.32 per share Panama
1Q13 R sults esentation
 1Q13 Results Presentation 14 May 2013 Disclaimer The presentation is dated the day it is given. The delivery of this presentation shall not, under any circumstances, create any implication that there has
MARRIOTT INTERNATIONAL, INC. PRESS RELEASE SCHEDULES QUARTER 4, 2016 TABLE OF CONTENTS
 PRESS RELEASE SCHEDULES QUARTER 4, 06 TABLE OF CONTENTS Consolidated Statements of Income - As Reported A- Consolidated Statements of Income - Fourth Quarter Adjusted 06 Compared to Combined 05 A-3 Consolidated
Management Presentation. November 2011
 Management Presentation November 2011 Forward looking statements This presentation as well as oral statements made by officers or directors of Allegiant Travel Company, its advisors and affiliates (collectively
Management Presentation. May 2013
 Management Presentation May 2013 Forward looking statements This presentation as well as oral statements made by officers or directors of Allegiant Travel Company, its advisors and affiliates (collectively
MGM Resorts International Reports Fourth Quarter And Full Year Financial And Operating Results; Announces Quarterly Dividend
 NEWS RELEASE MGM Resorts International Reports Fourth Quarter And Full Year Financial And Operating Results; Announces Quarterly Dividend 2/16/2017 Increased diluted earnings per share in the fourth quarter
Investment Highlights
 Second Quarter 2014 Investment Highlights 1 Mexican airport portfolio positioned to take full advantage of global growth. 2 Diversified business model contributing to earnings resilience. 3 Well-defined
Interim Report 3m Bilfinger Berger SE, Mannheim May 10, 2012 Joachim Müller, CFO
 Interim Report 3m 2012 Bilfinger Berger SE, Mannheim May 10, 2012 Joachim Müller, CFO Bilfinger Berger SE Interim report 3m 2012 May 10, 2012 Page 1 3m 2012: Highlights Growth in output volume and orders
OPERATING AND FINANCIAL HIGHLIGHTS
 Copa Holdings Reports Financial Results for the Fourth Quarter of 2015 Excluding special items, adjusted net income came in at $31.7 million, or EPS of $0.73 per share Panama City, Panama --- February
Crown Resorts Limited
 Crown Resorts Limited 2016 Half Year Results Presentation 25 February 2016 1 Crown Resorts Limited Results Overview Crown Resorts Limited (Crown) performance: The 2016 First Half results across Crown s
Interim Report 6m 2014
 August 11, 2014 Interim Report 6m 2014 Investors and Analysts Conference Call on August 11, 2014 Joachim Müller, CFO Latest ad-hoc release (August 4, 2014) Reduction of forecast, primarily due to a further
AIRPORTS. November 2010
 AIRPORTS November 2010 AIRPORTS November 2010 Contents Advantage India Market overview Investments Policy and regulatory framework Opportunities Industry associations 2 ADVANTAGE INDIA Advantage India
OPERATING AND FINANCIAL HIGHLIGHTS. Subsequent Events
 Copa Holdings Reports Net Income of US$113.1 Million and EPS of US$2.57 for the First Quarter of 2015 Excluding special items, adjusted net income came in at US$106.0 million, or EPS of US$2.41 per share
Information meeting. Jean-Cyril Spinetta Chairman and CEO
 Information meeting Jean-Cyril Spinetta Chairman and CEO Forward-looking statements The information herein contains forward-looking statements about Air France-KLM and its business. These forward-looking