REGIONAL RESIDENTS SURVEY on REGIONAL AMENITIES
|
|
|
- Margaret Martin
- 5 years ago
- Views:
Transcription

1 REGIONAL RESIDENTS SURVEY on REGIONAL AMENITIES Report prepared for: Wellington Region Mayoral Forum Report prepared by: Ian Binnie, Colmar Brunton Social Research Agency Date: 9 March 2011 Level 9, Sybase House, Lambton Quay PO Box 3622, Wellington Ph:
2 Table of Contents Executive Summary... 2 Objectives and Methodology : Use of amenities Use of amenities by all residents in the region Use of amenities by residents based outside the immediate council area Average use by theme : Perceived Share of benefits from each amenity Perceived share of benefits views from outside each amenity s immediate council area Perceived share of benefits views from non-users Perceived benefits by theme : Views on region-wide support Views on region-wide support from outside each amenity s immediate council area Region-wide support views from non-users Views on region-wide support by theme : Willingness to Pay : Thematic Analysis of Open Ended question asking about other amenities Appendix A: Response rate calculation Appendix B: Demographic tables COLMAR BRUNTON 2011 Page: 1
3 Executive Summary Objectives Colmar Brunton was commissioned by Wellington City Council who were acting on behalf of territorial local authorities across the Wellington Region (Wellington City, Hutt City, Upper Hutt City, Kapiti Coast District, Porirua City, South Wairarapa District, Carterton District and Masterton District Councils) and the Greater Wellington Regional Council. The research was undertaken to gain an understanding of: the types of amenities that residents in the region view as being important to the Wellington region s identity, quality of life, economy and attractiveness to residents and visitors; and the level of public support across the Wellington region for regionally funded amenities (measured by whether they support the concept of collaboration between councils and to what extent residents are prepared to pay for regional amenities). The aim of the research was to get a sense of the type of entities that residents in the region view as being regionally important. Lists of amenities generated through this research are not meant to provide a definitive list of regional amenities that should be supported by the region. This research is the first step of a wider project being conducted by the territorial authorities in the region to review the funding of regionally significant and beneficial amenities for the Wellington region. Methodology This research report is based upon the results of a telephone survey of 2,000 residents across the Wellington region. A telephone survey was chosen as the main data collection methodology because it is more representative than an online survey. Compared with online surveys, telephone surveys tend to include a broader range of income groups and people from different ethnic backgrounds. The sample design for the telephone survey ensured a broad spread of views from across the region. The less populous areas within the region were deliberately over-sampled so that their views could be analysed with more robustness than is possible with a completely random survey of the region (see below for details). Online panel questions to identify amenities of regional importance An online pre-survey of 630 respondents living throughout the Wellington region was conducted to develop a list of regionally important amenities that was resident driven (respondents were not prompted with a list but told us what they considered to be regional amenities in their own words). Respondents were recruited at random from Colmar Brunton s in-house research panel, although the sample was stratified so that it contained a minimum number within each council area. 132 respondents lived in Wellington City, 99 lived in Lower Hutt, 96 lived in Porirua, 93 lived in Kapiti, 70 lived in Upper Hutt, 53 lived in Masterton, 47 lived in South Wairarapa, and 40 lived in Carterton. The online pre-survey is referred to in this report as the pre-survey. Respondents were asked what attractions, events, facilities, venues, organisations or services in the arts/cultural, environment, recreation, economic or social areas were important for the whole Wellington region. COLMAR BRUNTON 2011 Page: 2
4 Main telephone survey The results from the online panel survey were used to inform the list of regionally important amenities for the main telephone survey. As stated above, this list was not intended to be definitive, rather it was intended to collect views on a selection of different types of amenities (including cultural, environmental and social amenities, and venues, attractions, organisations and events. The list included amenities that were identified from across the region (including those based inside and outside of Wellington City). Because there was a limit on the number of amenities that could be included in the telephone survey, the main questionnaire focused upon the objective of assessing support for a range of different types of amenities across these parameters. For more detail, please see the methodology section in the main body of the report. The telephone survey was then refined through a live-trial conducted immediately prior to fieldwork for the main survey (this live-trial identified a need to cut the number of questions we did this by removing some lower priority demographic questions). Two versions of the telephone survey questionnaire were used, one asked a series of questions about 11 regional amenities, the other version asked the same questions, but about a different set of 11 regional amenities. The two versions of the questionnaire were created because the alternative, which would involve asking about all 22 amenities, would present a heavy burden for the respondent. This would reduce response rates which, in turn, would reduce the quality of the data. The telephone survey generated survey data about 22 regional amenities, each with an approximate sample size of about 1,000. Other questions, not about individual amenities, have a sample size of 2,000. A sample size of 1,000 is subject to maximum margins of error of +/- 3.1% and a sample size of 2,000 is subject to maximum margins of error of +/- 2.2%. It should also be noted that the sample can be broken down by District Council area. In total the sample was spread as follows: 400 interviews in Wellington City 329 interviews in Lower Hutt 210 interviews in Upper Hutt 241 interviews in Porirua 240 interviews in Kapiti Coast 196 interviews in Masterton 192 interviews in South Wairarapa 192 interviews in Carterton. When data for the region, as a whole, is presented it is re-weighted so that it is regionally representative (based upon the adult population spread across the whole Wellington region), and does not over, or under, represent any one particular area. Subgroup analysis by District Council area is included in this report, and there is a set of tables with District level results that accompany this report. In terms of interviews achieved per ethnic grouping we interviewed 1,776 New Zealand European respondents, 185 Māori respondents, 66 Pacific respondents, 70 Asian respondents, and 38 with an other ethnicity. (Please note that people can belong to more than one ethnic group). COLMAR BRUNTON 2011 Page: 3
5 Key results Later in the Executive Summary we provide results by thematic grouping of amenities, and highlight the key findings for individual amenities. In this section below we describe some of the overall findings from the research. Overall findings from the research Most amenities had more non-users than users For those amenities that are available for most of the year, including venues and attractions such as Te Papa or Kapiti Island, the time-scale asked about was use in the past year. For amenities that are more occasional, including events such as World of Wearable Art or the Ambulance Service, the time-scale was use in the past five years. Within this report, a user was someone who had used or visited that amenity within these time-scales. Apart from Te Papa and the Westpac Stadium all other amenities had more non-users than users. Levels of use varied, from as high as 77% for Te Papa and as low as 6% for Kapiti Island. The average use level across all amenities included in the survey was 32%. (More details on levels of use can be found below). People were more likely to use local amenities Amenities were more likely to be used by residents living in the immediate council area where the amenity is based. Examples of this include: Respondents in Lower Hutt were more likely than average to have used the New Dowse. Respondents in Porirua were more likely to have used Pataka Museum and Gallery and Te Rauparaha Arena. Respondents in Kapiti were more likely to have used Kapiti Island. Respondents from the Wairarapa were more likely to have used Martinborough Fair, Wings Over Wairarapa, and Pukaha Mount Bruce wildlife centre. Respondents in Wellington City were more likely to have used all of the Wellington City based amenities (with the exceptions of the Rugby Sevens and the NZ Symphony Orchestra, where use was higher, but the difference was not statistically significant). (Please refer to the main body of the report for more details on significant differences in use by location). Backing for region-wide support is not always related to level of use Both users and non-users often agreed that particular amenities should receive support from all of the councils in the region. For all but six of the twenty two amenities the proportion backing the idea of region-wide support was higher than the proportion of users. There are two clear examples where support for amenities was not related to levels of use. Only 6% of respondents had been to Kapiti Island in the past year and 13% had seen the NZ Symphony Orchestra however, 54% thought that Kapiti Island should receive support from all the councils in the region and 57% thought that the NZ Symphony Orchestra should receive support from all the councils in the region. The average amenity in the survey had a score of 42% when it came to the proportion agreeing that there should be region-wide support. This is higher than the average level of use which was 32% (discussed above). COLMAR BRUNTON 2011 Page: 4
6 Perceived benefit for the region is not always related to level of use Respondents were asked to describe who they thought received the most benefit from each amenity. Those who said it benefits everyone or it benefits most people in the region were classified as answering that the amenity provided regional benefit. Levels of perceived benefit varied, from as high as 92% for Ambulance Services and as low as 23% for Te Rauparaha Arena. The average score for perceived benefit across all amenities included in the survey was 50%. Again it is worth noting that this is much higher than the average usage level of 32%, suggesting that non-users often perceive a wider benefit for the region, even though they may not use a particular amenity. Amenities viewed as beneficial are not automatically viewed as requiring regional support For some amenities there are high proportions saying there is regional benefit, but much lower proportions saying there should be region-wide support. Two examples are Wellington Botanic Gardens and Martinborough Fair. Around two-thirds said most people in the region benefited from them, but only 30% backed region-wide support for the Botanic Gardens and 16% backed region-wide support for Martinborough Fair. For these amenities most people said support should come from the local council only. However, amenities which have strong support for region-wide collaboration are normally perceived as providing regional benefit Although some amenities which are viewed as regionally beneficial are also viewed as only requiring local council support (see above), amenities which have strong support for region-wide collaboration tend to always have high proportions agreeing there is regional benefit, suggesting that region-wide benefit is normally viewed as a prerequisite for region-wide support. The only exception to this is the NZ Symphony Orchestra. 57% backed the concept of region-wide support for the orchestra, whereas only 29% said that most people in the region benefited from the orchestra (most people thought it only benefited those with special interests ). Views from respondents living outside the amenity s immediate council area did not differ very much from the regional results Respondents outside the amenity s immediate council area often held similar views to respondents across the region. For example, Te Papa, Westpac Stadium, and Wellington Zoo were viewed as the top three most beneficial amenities across the region. This was still the case when removing Wellington City respondents from the analysis. (Please note Ambulance services were not included in analysis of respondents living outside the amenity s immediate council area because they are not based in one particular council area). Views on region-wide support for amenities outside respondents immediate council areas were also broadly similar to views across the whole region. Excluding Ambulance Services, the top three amenities (ranked by the proportion saying there should be support from all of the councils in the region) were Westpac Stadium, Te Papa and Wellington Zoo. This remained the case when excluding Wellington City respondents from the analysis. The majority were willing to pay to support regional amenities Respondents were asked how much they would be willing to pay each year to financially support attractions and services that are important to the Wellington region. One in five respondents said they were not willing to pay, with a further 4% unsure. This means that 76% of respondents were willing to pay something, with over half of them (57%) willing to pay $25 or more per year. COLMAR BRUNTON 2011 Page: 5
7 Willingness to pay varied by income Willingness to pay varied by income, with respondents from higher income households being willing to pay more, for example, 52% of respondents with a household income of $100,000 per year or more were willing to pay $50 or more per year (compared with 22% of those with a household income of $30,000 per year). However, it is worth noting that even within the lowest income bracket (up to $30,000 per year), the majority (67%) were willing to pay something to support regionally important amenities (27% were not and a further 6% were unsure). Willingness to pay varied by Council area Across the region 76% said they were willing to pay to support amenities, this proportion varied by Council area as follows: Wellington City 80%. Lower Hutt 76%. South Wairarapa 72%. Kapiti Coast 70%. Upper Hutt 69%. Porirua 68%. Masterton 67%. Carterton 62%. Rate-payers were generally supportive of regional amenities Rate-payers were more likely than those who do not pay rates directly to a council to say that amenities benefited most people in the region. Most rate-payers (73%) were also willing to pay for regional amenities through an increase in their rates (although this is slightly lower than the equivalent proportion among those who do not pay rates directly to the council, 80%). Thematic analysis of responses A high-level thematic analysis was conducted in order to highlight respondent s overall views about venues, attractions, organisations and events, and to look at whether there was any difference in views across cultural, environmental and social amenities. The results for all 22 individual amenities included in the survey were split into two themes for further analysis the first involved grouping amenities by function (venues, attractions, organisations and events). The second theme involved grouping amenities around purpose (cultural, environmental or social). Please refer to the methodology section in the main body of the report for further details of which amenities fell into each category (see page 17). It was not possible to provide survey data on the full range of venues, attractions, organisations, and events in the Wellington region. Nor was it possible to provide survey data on the full range of cultural, environmental and social amenities in the region (we were limited to only asking about 22 specific amenities). Therefore results from the groupings are indicative only because they only reflect views about a limited number of amenities within each category. COLMAR BRUNTON 2011 Page: 6
8 Use by groupings The average amenity in this survey was used by 32% of the population. Use was higher for venue amenities (the average venue was used by 42%) and lower for organisations (the average organisation was used by 21% of the population). The scores for events (31%) and attractions (34%) were broadly in line with average use. A similar analysis was conducted for use by purpose this analysis groups amenities into cultural, environmental or social. Use was higher for social amenities (35%) and lower for the environmental amenities included in the survey (27%). Use of cultural amenities was 33% (broadly in line with the average amenity). It should be noted that the average amenity or the average venue, average organisation etc. is an artificial construction and is only used for thematic analysis of the survey results. Results for use of specific amenities (and other questions about specific amenities) are described later in the Executive Summary. Perceived share of benefits by groupings 50% was the average score from all amenities when it came to perceived benefit for the region. This score was higher for venues (54% for the average venue) and slightly lower for events (49%). Attractions and organisations were both in line with the average (50% each). A similar analysis was conducted for use by purpose this analysis groups amenities into cultural, environmental or social. Social and environmental amenities scored higher when it came to perceived benefit for the region (58% and 56% respectively) but this score was lower for cultural amenities (41%). It is interesting to note that environmental amenities receive a higher benefit score, despite having a low use score (see above). Views on region-wide support by groupings For each amenity, respondents were asked whether all the councils in the region should support it or not. 42% was the average score from all amenities when it came to backing region-wide support. This score was higher for organisations (55% for the average organisation) and venues (45%), but lower for events (38%) and attractions (40%). A similar analysis was conducted for use by purpose this analysis groups amenities into cultural, environmental or social. Support was higher for social and environmental amenities (45% each) and lower for cultural amenities (38%). Again, it is interesting to note that environmental amenities receive a higher level of backing for region-wide support, despite having a low use score (see above). The next section examines the use, perceived benefits, and backing for region-wide support for the 22 specific amenities included in the telephone survey. Use of specific amenities In terms of amenities that were available for most of the year, Te Papa, Westpac Stadium and Wellington Botanic Gardens had the highest proportion of users (with 77%, 59% and 58% respectively using them in the past year), and NZ Symphony Orchestra, Pukaha Mount Bruce wildlife centre and Kapiti Island had the lowest proportions of users (with 13%, 11% and 6% respectively using them in the past year). In terms of events (and Ambulance Services), the NZ International Arts Festival had the highest proportion of users (42% of respondents had been to see something at the NZ International Arts Festival within the past five years), and Wings Over Wairarapa had the smallest proportion of users (with 18% going at least once over the past five years). COLMAR BRUNTON 2011 Page: 7
9 Looking at use across all amenities (either in the past year, or past five years for events) the top five most commonly used amenities were: 1. Te Papa (77% of respondents had used it recently). 2. Westpac Stadium (59%). 3. Wellington Botanic Gardens (58%). 4. TSB Arena (47%). 5. Michael Fowler Centre and the NZ International Arts Festival both had 42% of respondents classified as recent users. Perceived share of benefits from specific amenities Respondents were asked to describe who they thought received the most benefit from each amenity. The top five amenities (in terms of the proportion saying that they benefit everyone or most people ) were: 1. The Ambulance Service (including Wellington Free Ambulance and St John) (92% of respondents said that everyone or most people benefited from the Ambulance Service). 2. Te Papa (86%). 3. Westpac Stadium (78%). 4. Wellington Zoo (77%). 5. Wellington Botanic Gardens (66%). Pukaha Mount Bruce wildlife centre and Kapiti Island have a relatively small proportion of users (11% had visited Pukaha Mount Bruce wildlife centre in the past year, and 6% had visited Kapiti Island), however they have relatively high proportions saying they benefit everyone, or most people - 40% and 46% respectively. There are amenities that have much lower proportions than this, such as Downstage Theatre, New Dowse and Te Rauparaha Arena, which had the lowest proportions saying they benefited everyone or most people (28%, 27% and 23% respectively). Region-wide support for specific amenities Over half of respondents agreed that the following amenities should receive support from all the councils in the region: Ambulance Services (87% said this should receive region-wide support). Westpac Stadium (75%). Te Papa (69%). Wellington Zoo (65%). NZ Symphony Orchestra (57%). Rugby Sevens (54%). Kapiti Island (54%). The NZ International Arts Festival (52%). It should be noted that Westpac Stadium already receives regional funding. The NZ International Arts Festival receives core funding from Wellington City Council and received project funding from Porirua City, Hutt City, Upper Hutt, Kapiti Coast District and councils in the Wairarapa. For other amenities in the survey, less than half of respondents backed the idea of region-wide support. Some amenities received low levels of backing for region-wide support, these include: Downstage Theatre (20%), New Dowse (17%) and the Martinborough Fair (16%). COLMAR BRUNTON 2011 Page: 8
10 Levels of backing for region-wide support is not always related to levels of use. For example, only 6% had been to Kapiti Island in the past year and 13% had seen the NZ Symphony Orchestra in the past year (although over half supported the idea of regionwide support for these two amenities). Views from respondents living outside the amenity s immediate council area did not differ very much from the results listed above. Over half of respondents living outside the amenity s immediate council area thought the following amenities should receive support from all the councils in the area: Westpac Stadium (71% of respondents living outside Wellington City thought this should receive support from all the councils in the region). Te Papa (69% of respondents living outside Wellington City thought this should receive region-wide support). Wellington Zoo (60% of respondents living outside Wellington City thought this should receive region-wide support). Kapiti Island (54% of respondents living outside Kapiti thought this should receive region-wide support). NZ Symphony Orchestra (54% of respondents living outside Wellington City thought this should receive regionwide support). Rugby Sevens (51% of respondents living outside Wellington City thought this should receive region-wide support). 47% of respondents living outside Wellington City thought the NZ International Arts Festival should receive region-wide support. The equivalent figure was lower for all other amenities. (Ambulance Services was not included in this analysis because they do not operate in one council area). Summary table showing key scores for each individual amenity The table overleaf summarises the key scores for each amenity. Rather than present three separate tables, the three key pieces of data for each amenity are presented side-by-side to assist quick reference. The first column is the proportion of all respondents across the region who thought that amenity should receive region-wide support. The table is ranked by this important variable. The second column is the proportion who thought everyone, or most, people benefited from that amenity (as noted above, some amenities, such as Martinborough Fair are viewed as beneficial, but this does not necessarily mean people back regionwide support for that amenity). The third column is the proportion who had used that amenity recently, in the case of amenities that were open for most of the year this was used in the past year and for amenities that were events (and the Ambulance Services) this was used in the past five years. As noted above, level of use is not always related to perceived benefit nor backing for region-wide support. Here are examples of how to read the first two rows of the table are below: 87% backed the idea of region-wide support for Ambulance Services, 92% thought that Ambulance Services benefited most people in the region, and 31% of respondents had used Ambulance Services recently (as discussed above, recent use of Ambulance Services was classified as used in the past five years but for other amenities, apart from events, this was classified as used in the past year ). For Westpac Stadium, 75% backed the idea of region-wide support for the amenity, 78% thought that most people in the region benefited from it, and 59% had used the Westpac Stadium in the past year. COLMAR BRUNTON 2011 Page: 9
11 Amenity % backing region-wide support % thinking everyone or most people in % used recently the region benefit Ambulance Services Westpac Stadium Te Papa Wellington Zoo NZ Symphony Orchestra Rugby Sevens Kapiti Island The NZ International Arts Festival TSB Arena World of Wearable Art Zealandia Pukaha Mount Bruce Wildlife Centre Michael Fowler Centre Wellington Museum of City and Sea Wellington Botanic Gardens Pataka Museum and Gallery Wellington City Gallery Wings Over Wairarapa Te Rauparaha Arena Downstage New Dowse Martinborough Fair COLMAR BRUNTON 2011 Page: 10
12 Objectives and Methodology Objectives Colmar Brunton was commissioned by Wellington City Council who were acting on behalf of territorial local authorities across the Wellington Region (Wellington City, Hutt City, Upper Hutt City, Kapiti Coast District, Porirua City, South Wairarapa District, Carterton District and Masterton District Councils) and the Greater Wellington Regional Council. The research was undertaken to gain an understanding of: the types of amenities that residents in the region view as being important to the Wellington region s identity, quality of life, economy and attractiveness to residents and visitors; and the level of public support across the Wellington region for regionally funded amenities (measured by whether they support the concept of collaboration between councils and to what extent residents are prepared to pay for regional amenities). The aim of the research was to get a sense of the type of entities that residents in the region view as being regionally important. Lists of amenities generated through this research are not meant to provide a definitive list of regional amenities that should be supported by the region. This research is the first step of a wider project being conducted by the territorial authorities in the region to review the funding of regionally significant and beneficial amenities for the Wellington region. Methodology This research report is based upon the results of a telephone survey of 2,000 residents across the Wellington region. A telephone survey was chosen as the main data collection methodology because it is more representative than an online survey. Compared with online surveys, telephone surveys tend to include a broader range of income groups and people from different ethnic backgrounds. Two versions of the questionnaire were used, one asked a series of questions about 11 regional amenities, the other version asked the same questions, but about a different set of 11 regional amenities. The two versions of the questionnaire were created because the alternative, asking about all 22 amenities, would present a heavy burden for the respondent, and this would reduce response rates which, in turn, would reduce the quality of the data. The telephone survey generated survey data about 22 regional amenities (each with an approximate sample size of about 1,000). Other questions, not about individual amenities, have a sample size of 2,000. A sample size of 1,000 is subject to maximum margins of error of +/- 3.1% and a sample size of 2,000 is subject to maximum margins of error of +/- 2.2%. Prior to the main telephone survey, an online survey of 630 respondents living throughout the Wellington region was conducted (respondents were recruited at random from Colmar Brunton s in-house research panel). This short survey used some open ended questions to identify regionally important amenities. A phase of questionnaire development followed, and the questionnaire was refined through a live-trial conducted immediately prior to the main survey. More details of each stage of the research can be found below. COLMAR BRUNTON 2011 Page: 11


13 Online panel questions using open ended questions to identify amenities of regional importance. Questionnaire constructed to ask: use, perceived share of benefits, and backing for region-wide support across 22 regionally important amenities. Live trial with 41 respondents. Mainstage telephone survey of n=2,000 respondents. Online panel questions An online pre-survey of 630 respondents living throughout the Wellington region was conducted to develop a list of regionally important amenities that was resident driven (respondents were not prompted with a list but told us what they considered to be regional amenities in their own words). Respondents were recruited at random from Colmar Brunton s in-house research panel, although the sample was stratified so that it contained a minimum number within each council area. 132 respondents lived in Wellington City, 99 lived in Lower Hutt, 96 lived in Porirua, 93 lived in Kapiti, 70 lived in Upper Hutt, 53 lived in Masterton, 47 lived in South Wairarapa, and 40 lived in Carterton. The questionnaire (which took around 7 minutes to complete) focused on the following question topics including: visitor attractions that are regionally important events that are regionally important facilities, venues or attractions that are regionally important organisations or services in the arts/cultural, environment, recreation, economic or social areas that are regionally important. This stage of the research is referred to in this report as the pre-survey. The pre-survey was not intended to be a robust regionally representative survey rather it was an initial step used to inform the design of the main telephone survey and identify the type of amenities viewed as regionally important by residents. COLMAR BRUNTON 2011 Page: 12
14 A list of regionally important amenities was developed using data from the open ended questions used in the pre-survey. Because the questions were open ended, respondents were not prompted with a list, rather they told us their answers using their own words. Please note that we did not use the word amenity in any the research because it could confuse respondents. In the pre-survey respondents were asked what attractions, events, facilities, venues, organisations or services in the arts/cultural, environment, recreation, economic or social areas were important for the whole Wellington region. A large variety of amenities and services were mentioned in the pre-survey, and answers varied by location. Some answers from the pre-survey focused on core council or central government services such as infrastructure and roading. Many answers were not about specifically named entities, for example, beaches or parks. The results from the pre-survey were used to inform the list of specific amenities included in the main telephone survey (see below for more details). This list was not intended to be definitive, rather it was intended to collect views on a selection of different types of amenities (including cultural, environmental and social amenities, and venues, attractions, organisations and events, and including amenities that were identified from different parts of the region both inside and outside of Wellington City). Questionnaire development for the main telephone survey A fourteen minute questionnaire was used for the main telephone survey. The survey focused on four key questions (plus demographic information): recent levels of use for each of the regionally important amenities. perception of who benefited most from each of the regionally important amenities. support for region-wide funding for each of the regionally important amenities. willingness to pay to support regionally important amenities. The results from the online panel survey (the pre-survey ) were used to inform the list of regionally important amenities for the main telephone survey. Because there was a limit on the number of amenities that could be included in the telephone survey, the main questionnaire focused upon the objective of assessing support for a range of different types of amenities identified in the pre-survey from across the social, environmental and cultural sectors. A mixture of venues, attractions, organisations and events were also included. Te Papa, Westpac Stadium, Rugby Sevens and World of Wearable Arts featured strongly in the pre-survey with other amenities being mentioned much less often sometimes by less than 10% of pre-survey respondents (see below for details). General infrastructure suggestions from the pre-survey (such as rail or airports) were not included in the telephone survey, nor were amenities which were about non-specific environmental features (some answers in the pre-survey included beaches, coast-lines and rivers). The list also included some amenities from the pre-survey which were mentioned in the areas outside of Wellington City (some of these amenities were not mentioned by high proportions at the regional level but were mentioned quite often within a particular district, an example of this is Wings Over the Wairarapa). In the end the following 22 regional amenities were included in the main telephone survey: Te Papa (which was mentioned by 70% of respondents across the region in the pre-survey, and 74% of pre-survey respondents based in Wellington City). Wellington City Gallery (which was mentioned by 3% of respondents across the region in the pre-survey, and 5% of pre-survey respondents based in Wellington City). New Dowse (which was mentioned by 4% of respondents across the region in the pre-survey, and 9% of pre-survey respondents based in Lower Hutt). COLMAR BRUNTON 2011 Page: 13
15 Te Rauparaha Arena (which was mentioned by 3% of respondents across the region in the pre-survey, and 13% of pre-survey respondents based in Porirua). Michael Fowler Centre (which was mentioned by 9% of respondents across the region in the pre-survey, and 6% of pre-survey respondents based in Wellington City). Zealandia, also known as the Karori Sanctuary (which was mentioned by 20% of respondents across the region in the pre-survey, and 29% of pre-survey respondents based in Wellington City). Pukaha Mount Bruce wildlife centre (which was mentioned by 3% of respondents across the region in the presurvey, and 12% of pre-survey respondents based in the Wairarapa). Ambulance Services including Free Wellington Ambulance and St John (ambulances were mentioned by 13% of respondents across the region in the pre-survey). The NZ International Arts Festival (which was mentioned by 18% of respondents across the region in the presurvey, and 26% of pre-survey respondents based in Wellington City). The Rugby Sevens (which was mentioned by 59% of respondents across the region in the pre-survey, and 64% of pre-survey respondents based in Wellington City). The Martinborough Fair (which was mentioned by 4% of respondents across the region in the pre-survey, and 21% of pre-survey respondents based in the Wairarapa). NZ Symphony Orchestra (which was mentioned by 3% of respondents across the region in the pre-survey, and 2% of pre-survey respondents based in Wellington City). Wellington Museum of City and Sea (which was mentioned by 5% of respondents across the region in the presurvey, and 7% of pre-survey respondents based in Wellington City). Pataka Museum and Gallery (which was mentioned by 2% of respondents across the region in the pre-survey, and 8% of pre-survey respondents based in Porirua). Downstage Theatre (which was mentioned by 4% of respondents across the region in the pre-survey, and 5% of pre-survey respondents based in Wellington City). Westpac Stadium (which was mentioned by 60% of respondents across the region in the pre-survey, and 59% of pre-survey respondents based in Wellington City). TSB Arena (which was mentioned by 13% of respondents across the region in the pre-survey, and 16% of presurvey respondents based in Wellington City). Wellington Zoo (which was mentioned by 14% of respondents across the region in the pre-survey, and also 14% of pre-survey respondents based in Wellington City). Kapiti Island (which was mentioned by 4% of respondents across the region in the pre-survey, and 25% of presurvey respondents based in Kapiti). Wellington Botanic Gardens (which was mentioned by 15% of respondents across the region in the pre-survey, and 18% of pre-survey respondents based in Wellington City). World of Wearable Art (which was mentioned by 50% of respondents across the region in the pre-survey, and 60% of pre-survey respondents based in Wellington City). Wings over Wairarapa (which was mentioned by 3% of respondents across the region in the pre-survey, and 19% of pre-survey respondents based in the Wairarapa). Due to the large number of amenities, the list was split in two. This created two lists of 11 different amenities. Respondents were randomly allocated so that they were asked about only one of the two lists of amenities. This minimised the burden on respondents. The alternative, asking about all 22 amenities in one questionnaire, would reduce the response rate to the survey which, in turn, would reduce the quality of the data. However, it does mean that the sample size for each question about individual amenities is smaller (about half, i.e. 1,000 interviews) compared with other questions in the survey (which have a sample size of 2,000). COLMAR BRUNTON 2011 Page: 14
16 Respondents given the chance to identify regionally important amenities not on the list Following questions about each amenity, a randomised selection of respondents 1 were given the chance to mention other regionally important amenities that were not on the list. Data was recorded in an open ended question and thematic analysis was conducted on the results (please see Chapter 5 for details). One in four respondents were asked this open ended question. However, this was increased to 8 in 10 Māori and Pacific respondents (this was done to compensate for the under-representation of Māori and Pacific respondents that often occurs in online and telephone surveys). In total 634 respondents were asked this open ended question (including 513 New Zealand European respondents, 166 Māori respondents, 47 Pacific respondents, 16 Asian respondents and 13 respondents with other ethnicities please note that some people have more than one ethnicity). It should be noted that around half of respondents said either do not know or I have nothing to add as their answer to this open ended question. This information, combined with the information generated by the online questions asked before the main survey, means that, in total, 1,048 New Zealand Europeans, 193 Māori, 57 Pacific and 32 Asian respondents were given the chance to comment, in an open ended response, on regionally important amenities. Live-trial A live-trial of the survey was conducted with 41 respondents immediately prior to the main stage of survey fieldwork. This livetrial identified a need to shorten the questionnaire somewhat (which we did by removing some demographic questions). Some minor amendments were also made to the questionnaire to improve the flow of the survey and improve question comprehension among respondents. Main stage of survey fieldwork Following the live-trial, Colmar Brunton surveyed 2,000 residents across the region. Sampling Respondents were identified through random-digit dialling. This process includes all possible telephone numbers in the region. Within each household a random respondent was selected by asking for the person aged 15 and over with the next birthday. The sample design ensured a broad spread of views from across the region. The less populous areas within the region were deliberately over-sampled so that their views could be analysed with more robustness than is possible with a completely random survey of the region (which would not generate many interviews outside the most urbanised areas). In total the sample was spread as follows: 400 interviews in Wellington City 329 interviews in Lower Hutt 210 interviews in Upper Hutt 241 interviews in Porirua 240 interviews in Kapiti Coast 196 interviews in Masterton 192 interviews in South Wairarapa 192 interviews in Carterton. 1 This question was asked to a limited number of respondents to stay within the total research budget. It was sufficient to ask this question to a random sub-set of respondents because the type of analysis conducted on this question was qualitative rather than quantitative (see chapter 5 for analysis of this question). COLMAR BRUNTON 2011 Page: 15
17 When data for the region, as a whole, is presented it is re-weighted so that it is regionally representative (based upon the adult population spread across the whole Wellington region), and does not over, or under, represent any one particular area. A table showing the results from respondents in each territorial authority accompanies this report. Fieldwork Data was gathered using Computer Assisted Telephone Interviewing (CATI). The questionnaire took, on average, 14 minutes to complete. The final response rate was 25%. This is a normal response rate for a general public survey which is conducted through random-digital dialling. The main reasons for non-response were non-contact and refusals for more details see Appendix A. Weighting, analysis and reporting Weighting The results of the survey were weighted so that they were representative by area, gender and broad age-group (2006 Census data was used to conduct this weighting). Subgroup analysis Analysis was then conducted by Colmar Brunton using in-house survey software. The results were analysed by key groups of interest, including: Territorial authority (referred to in this report as area ) where respondent lives. Due to small base sizes some of the subgroup analysis involving South Wairarapa, Carterton and Masterton has been merged together and presented as the Wairarapa this grouping has been made clear when this occurs in the text). Gender. Age group (in order to conduct robust sub-analysis it was necessary to group age into 15-29, 30-49, and 50+). Ethnicity (in order to conduct robust sub-analysis it was necessary to group ethnicity into New Zealand European, Māori, Pacific, Asian and Other ethnicities). Household income (in order to conduct robust sub-analysis it was necessary to group household income into up-to $30,000, $30,001-$50,000, $50,001-$80,000, $80,001-$100,000 and $100,000+). Ratepayer status (whether pay rates to the council directly or not). The questionnaire also asked people where they worked or studied. However, this was found to be a very weak analytical variable compared with where someone lived. For this reason analysis by work-location is not included in this report. Differences between subgroups described in the text within this report are statistically significant at the 95% confidence level unless stated otherwise. Differences tend to be reported by subgroup compared against the average score the average score is the total response including all respondents in the survey. For subgroup analysis involving only two categories where one group forms a large part (close to half) of the total population (for example, females) - then that group is compared with the opposite group in its category (for example, males). COLMAR BRUNTON 2011 Page: 16
18 Thematic analysis by groupings of amenities Additional thematic analysis was undertaken looking at groupings of amenities. After each chapter there is a brief summary that describes average scores received for groupings of amenities. The first set of groupings relates to function. Amenities were split into venues, attractions, organisations or events. The groupings for this split are described below. Venues: Te Rauparaha Arena Michael Fowler Centre Westpac Stadium TSB Arena Attractions: Te Papa Wellington City Gallery Wellington Museum of City and Sea Pataka Museum and Gallery New Dowse Zealandia Pukaha Mount Bruce wildlife centre Wellington Zoo Kapiti Island Wellington Botanic Gardens Organisations: NZ Symphony Orchestra Downstage Theatre Ambulance Services (including St John and Wellington Free Ambulance) Events: The NZ International Arts Festival World of Wearable Art Rugby Sevens Martinborough Fair Wings over Wairarapa COLMAR BRUNTON 2011 Page: 17
19 The next set of groupings centred around purpose. Amenities were split into cultural, environmental or social. The groupings for this split are described below. Cultural amenities: Te Papa Wellington City Gallery Wellington Museum of City and Sea Pataka Museum and Gallery New Dowse NZ Symphony Orchestra Downstage Theatre The NZ International Arts Festival World of Wearable Art Environmental amenities: Zealandia Pukaha Mount Bruce wildlife centre Wellington Zoo Kapiti Island Wellington Botanic Gardens Social amenities: Te Rauparaha Arena Michael Fowler Centre Westpac Stadium TSB Arena Ambulance Services (including St John and Wellington Free Ambulance) Rugby Sevens Martinborough Fair Wings over Wairarapa It should be noted that each of these groupings only contain a small number of regional amenities. It was not possible to provide survey data on the full range of venues, attractions, organisations, and events in the Wellington region. Nor was it possible to provide survey data on the full range of cultural, environmental and social amenities in the region (we were limited to only asking about 22 specific amenities). Therefore results from the groupings defined above are indicative only and should be treated with caution because they only reflect views about a limited number of amenities within each category. Analysis of open ended question on additional amenities Additional thematic analysis of an open ended question about amenities not included on the pre-coded response list was conducted by Wellington City Council (this question is described above). The results of this analysis can be found in Chapter 5. COLMAR BRUNTON 2011 Page: 18
20 Notes on reading this report We have not included findings where the base size was less than 30 respondents. Subgroup analyses have been conducted for most key variables within the report. All differences in the report are statistically significant at the 95% confidence level unless otherwise stated. It should also be noted that sometimes percentages for single coded questions do not add up to 100%. This is due to rounding. Similarly percentages which sum one or more categories together are sometimes one percentage point different from the number achieved through a straightforward addition of each single category, again this is because of rounding. COLMAR BRUNTON 2011 Page: 19
21 1: Use of amenities This chapter examines recent use of amenities. For those amenities that are available for most of the year (including venues and attractions such as Te Papa or Kapiti Island) the time-scale asked about was use in the past year. For amenities that are more occasional (including events such as World of Wearable Art or the Ambulance Service) the time-scale was use in the past five years. Within this report, a user was someone who had used or visited that amenity within these time-scales. Use of amenities by all residents in the region Results for amenities that are available most of the year are described in the chart overleaf. COLMAR BRUNTON 2011 Page: 20


22 Amenities used in past 12 months % that HAVE used in past year le Papa 5% 23% 23% 77 Westpac Stadium 5% 10% 20% 41% 59 Wellington Botanic Gardens 17% 41% 58 lsb Arena Michael Fowler Centre 24% 58% 1 42 Wellington Zoo 1 2 ", ", 21% 64% Wellington City Gallery 4% 17% 64% New Dowse Wgtn Museum of City & Sea Pataka Museum and Gallery Zealandia Downstage lhealre le Rauparaha Arena ", 14% 67% 2 17% 71% 1 12% 70% 3%, :.', 17% 73% 1,.', 13% 79% NZ Symphony Orchestra Pukaha Mount Bruce wildlife centre 1 Kapiti Island 1 7% 9% 5% 87% 1 87% 2 94% More than twelve times Four to six times.once Have not heard of this Seven to twelve times Two to three times Have not used in past 12 months QA1d) How often hdve you persondlly used/visited [Amenity].., in the Pdst 12 months? Bdse: All respondents (n=998 to 1002) Note: the '%' symbol has sometimes been removed from the smaller results towards the left-hand side of edch bdr to mdke space. In these Cdses, the number still represents d percentage.,,. Colmar Brunton G- tj Social Research Agency COLMAR BRUNTON 2011 Page: 21
, and NZ Symphony Orchestra, Pukaha Mount Bruce wildlife centre and Kapiti Island had the lowest proportions of users (with 13%, 11% and 6% respectively using them in the past")
, the NZ International Arts Festival had the highest proportion of users (42% of respondents had been to see something at the NZ International Arts Festival")
23 In terms of amenities that were available for most of the year, Te Papa, Westpac Stadium and Wellington Botanic Gardens had the highest proportion of users (with 77%, 59% and 58% respectively using them in the past year), and NZ Symphony Orchestra, Pukaha Mount Bruce wildlife centre and Kapiti Island had the lowest proportions of users (with 13%, 11% and 6% respectively using them in the past year). Levels of use for events (and Ambulance Services) are described in the chart below. In terms of events (and Ambulance Services), the NZ International Arts Festival had the highest proportion of users (42% of respondents had been to see something at the NZ International Arts Festival within the past five years), and Wings Over Wairarapa had the smallest proportion of users (with 18% going at least once over the past five years). Looking at use (either in the past year, or past five years for events) the top five highest amenities used were: 1. Te Papa (77% of respondents had used it recently). 2. Westpac Stadium (59%). 3. Wellington Botanic Gardens (58%). 4. TSB Arena (47%). 5. Michael Fowler Centre and the NZ International Arts Festival both had 42% of respondents classified as users. COLMAR BRUNTON 2011 Page: 22
24 Use of amenity - subgroup analysis Use of amenities varied within different groups of the population. The section below looks at different groups of the population in the region and highlights where use of an amenity by a particular subgroup stood out from the rest. For more detailed examination by area, the reader should refer to the set of tables which accompany this report. Gender Females were more likely than males to have used the following amenities: Te Papa (80% compared to 73% of males). The Martinborough Fair (43% compared to 36%). World of Wearable Art (34% compared to 21%). Pataka Museum and Gallery (35% compared to 20%). And were less likely to have used: The Rugby Sevens (25% compared to 33% of males) Westpac Stadium (55% compared to 64%). Age Older respondents (those aged 50 or older) were generally less likely to use amenities including: Te Papa (67% of those aged 50 or older had visited Te Papa in the past year compared to the average of 77%). Westpac Stadium (45% compared to 59%). Wellington Botanic Gardens (51% compared to 58%). TSB Arena (35% compared to 47%). Wellington Zoo (20% compared to 36%). Rugby Sevens (18% compared to 29%). Zealandia (20% compared to 26%). (Those who were younger were more likely than those who were older to visit the above attractions). However, those aged 50 or older were more likely to have used New Dowse (36% compared to the average of 31%) and Pukaha Mount Bruce wildlife centre (15% compared to 11%). Ethnicity Māori were more likely to have used Te Rauparaha Arena (39% compared to the average of 18%) and Rugby Sevens (43% compared to 29%). Māori were less likely to have used Wellington Botanic Gardens (46% compared to 58%), New Dowse (14% compared to 31%), and the NZ International Arts Festival (23% compared to 42%). Pacific respondents were more likely to have used Te Rauparaha Arena (42% compared to the average of 18%) and Rugby Sevens (50% compared to 29%), but were less likely to have used Wellington City Gallery (14% compared to 35%), Zealandia (10% compared to 26%), and Downstage Theatre (3% compared to 20%). Asian respondents were more likely to have used TSB Arena (67% compared to the average of 47%), but less likely to have used the Westpac Stadium (37% compared to 59%) and Pataka Museum and Gallery (10% compared to 27%). COLMAR BRUNTON 2011 Page: 23
25 Income Those with a household income of $100,000 or more were more likely than average to have used most amenities. They were significantly more likely to have used: Te Papa (85% compared to the average of 77%). Wellington Botanic Gardens (69% compared to 58%). Westpac Stadium (74% compared to 59%). Michael Fowler Centre (53% compared to 42%). The NZ International Arts Festival (54% compared to 42%). Wellington Zoo (44% compared to 36%). The Rugby Sevens (39% compared to 29%). Zealandia (37% compared to 26%). Wellington City Gallery (43% compared to 35%). Downstage Theatre (27% compared to 20%). (There were no amenities that this income group were less likely to have used). Those in the lowest income bracket (household income up to, and including, $30,000) were less likely to have used: Te Papa (64% compared to the average of 77%). Westpac Stadium (38% compared to 59%). Wellington Botanic Gardens (35% compared to 58%). TSB Arena (35% compared to 47%). Wellington Zoo (27% compared to 36%). Michael Fowler Centre (31% compared to 42%). Zealandia (15% compared to 26%). The NZ International Arts Festival (34% compared to 42%). The Rugby Sevens (18% compared to 29%). Te Rauparaha Arena (12% compared to 18%). (There were no amenities that this income group were more likely to have used). Rate-payers Rate-payers were more likely than those who do not pay rates directly to a council to have visited Martinborough Fair (42% compared to 33%), World of Wearable Art (31% compared to 20%), Pataka Museum and Gallery (30% compared to 21%), and NZ Symphony Orchestra (14% compared to 8%), but were less likely to have used TSB Arena (44% compared to 55%). COLMAR BRUNTON 2011 Page: 24
26 Location Amenities were more likely to be used by residents living in the immediate council area where the amenity is based. Examples of this are illustrated below. Respondents in Lower Hutt were more likely to have used the New Dowse (55% of them did, compared with the average of 31%). However they were less likely to have used: Te Papa (68% compared to the average of 77%). Wellington City Gallery (22% compared to 35%). Pataka Museum and Gallery (18% compared to 27%). Pukaha Mount Bruce wildlife centre (5% compared to 11%). The NZ International Arts Festival (33% compared to 42%). Respondents in Upper Hutt were less likely to have used: Wellington Museum of City and Sea (17% compared to the average of 28%). Pataka Museum and Gallery (15% compared to 27%). (There were no amenities that Upper Hutt respondents were more likely to have used). Respondents in Porirua were more likely to have used: Pataka Museum and Gallery (61% compared to the average of 27%). Te Rauparaha Arena (56% compared to 18%). Respondents in Porirua were less likely to have used: Wellington Botanic Gardens (46% compared to 58%). Wellington City Gallery (24% compared to 35%). New Dowse (18% compared to 31%). The NZ International Arts Festival (32% compared to 42%). World of Wearable Art (18% compared to 28%). Respondents in Kapiti were more likely to have used: Ambulance Services (41% compared to the average of 31%). Kapiti Island (11% compared to 6%). Respondents in Kapiti were less likely to have used: Westpac Stadium (48% compared to 59%). Wellington Botanic Gardens (39% compared to 58%). TSB Arena (25% compared to 47%). Wellington Zoo (23% compared to 36%). Wellington City Gallery (19% compared to 35%). New Dowse (10% compared to 31%). Zealandia (10% compared to 26%). Downstage Theatre (12% compared to 20%). COLMAR BRUNTON 2011 Page: 25
27 Respondents in Wellington City were less likely to have used Martinborough Fair (32% compared to the average of 39%), but were more likely to have used the following amenities: Te Papa (89% compared to the average of 77%). Westpac Stadium (69% compared to 59%). Wellington Botanic Gardens (78% compared to 58%). TSB Arena (61% compared to 47%). Michael Fowler Centre (52% compared to 42%). Wellington Zoo (45% compared to 36%). Wellington City Gallery (55% compared to 35%). Wellington Museum of City and Sea (36% compared to 28%). Zealandia (40% compared to 26%). Downstage Theatre (31% compared to 20%). The NZ International Arts Festival (59% compared to 42%). World of Wearable Art (38% compared to 28%). Respondents from the Wairarapa (which includes residents from South Wairarapa, Carterton and Masterton) were more likely to have used: The Martinborough Fair (71% compared to the average of 39%). Wings Over Wairarapa (52% compared to 18%). Pukaha Mount Bruce wildlife centre (44% compared to 11%). Respondents from the Wairarapa were less likely to have used: Te Papa (54% compared to 77%). Westpac Stadium (37% compared to 59%). Wellington Botanic Gardens (21% compared to 58%). TSB Arena (22% compared to 47%). The NZ International Arts Festival (21% compared to 42%). Michael Fowler Centre (17% compared to 42%). Wellington Zoo (20% compared to 36%). Wellington City Gallery (11% compared to 35%). New Dowse (7% compared to 31%). Rugby Sevens (17% compared to 29%). World of Wearable Art (17% compared to 28%). Wellington Museum of City and Sea (13% compared to 28%). Pataka Museum and Gallery (7% compared to 27%). Zealandia (8% compared to 26%). Downstage Theatre (4% compared to 20%). Te Rauparaha Arena (8% compared to 18%). NZ Symphony Orchestra (4% compared to 13%). Kapiti Island (2% compared to 6%). COLMAR BRUNTON 2011 Page: 26
28 Use of amenities by residents based outside the immediate council area Each amenity had users who were based outside the immediate council area where the amenity was based. The table below shows the proportions of respondents across the region that had used each amenity (this repeats the information already discussed above), the second column shows the proportion of respondents living outside that amenity s council area that had used that amenity, and the third column shows the proportion of each individual amenity s users that come from outside its immediate council area. Amenity % of respondents across the region who have used the amenity % of respondents across the region who have used the amenity, excluding those living in the council where the amenity is based Share of that amenity s regional visitors that live outside the immediate council area where the amenity is based Te Papa Westpac Stadium Wellington Botanic Gardens Martinborough Fair (past five years) TSB Arena Michael Fowler Centre The NZ International Arts Festival (past five years) Wellington Zoo Rugby Sevens (past five years) World of Wearable Art (past five years) New Dowse Pataka Museum and Gallery Wellington Museum of City and Sea Wellington City Gallery Zealandia Wings Over Wairarapa (past five years) Te Rauparaha Arena Downstage NZ Symphony Orchestra Pukaha Mount Bruce Wildlife Centre Kapiti Island The table shows that, even when removing respondents based outside the amenity s council area, Te Papa, Westpac Stadium and Wellington Botanic Gardens are still the top three most used amenities (68% of respondents based outside Wellington City COLMAR BRUNTON 2011 Page: 27
29 had been to Te Papa in the past year, 52% had used Westpac Stadium and 44% had been to Wellington Botanic Gardens). It is worth noting that 38% of respondents based outside of South Wairarapa had been to Martinborough Fair within the past five years, making this the fourth most commonly used amenity by residents outside its council area, closely followed by TSB Arena (37%). Regardless of overall levels of use, some amenities receive a high proportion of their Wellington region users from outside their immediate council area. Examples include Wings Over Wairarapa (which is based in Masterton), Martinborough Fair (based in South Wairarapa), Kapiti Island (based in Kapiti), Pataka Museum and Gallery and Te Rauparaha Arena (both based in Porirua), and Pukaha Mount Bruce wildlife centre (based in Masterton). These amenities have a high proportion of their visitors from across other parts of the Wellington region refer to the third column in the table above for details. COLMAR BRUNTON 2011 Page: 28
30 Average use by theme A high-level thematic analysis was conducted in order to highlight respondent s overall views about venues, attractions, organisations and events, and to look at whether there was any difference in views across cultural, environmental and social amenities. All 22 individual amenities were split into two themes for further analysis the first involved grouping amenities by function (venues, attractions, organisations and events). The second theme involved grouping amenities around purpose (cultural, environmental or social). Please refer to page 17 for further details of which amenities fell into each category. The following table shows the average scores for amenities within each grouping. This simply takes the use figure for each amenity (described earlier in this section) within each grouping and sums them; the total is then divided by the number of amenities in that grouping. The results should be treated with caution because use vs. non-use was defined differently for amenities that were available for most of the year vs. amenities that were only available at certain times. So, in this analysis, the score of 28% for those who have been to the World of Wearable Art in the past five years is not treated any differently from the score of 28% for those who have visited Wellington Museum of City and Sea in the past year. Furthermore, each of these groupings only contain a small number of regional amenities. It was not possible to provide survey data on the full range of venues, attractions, organisations, and events in the Wellington region. Nor was it possible to provide survey data on the full range of cultural, environmental and social amenities in the region (we were limited to only asking about 22 specific amenities). Therefore results from the groupings are indicative only because they only reflect views about a limited number of amenities within each category. Grouping of amenities by function Average use score Venues 42 Attractions 34 Organisations 21 Events 31 TOTAL (average of all amenities in survey) 32 The average amenity in this survey was used by 32% of the population. Use was higher for venue amenities (the average venue was used by 42%) and lower for organisations (the average organisation was used by 21% of the population). It should be noted that the average amenity or the average venue, average organisation etc. is an artificial construction and is only used for thematic analysis of the survey results. A similar analysis was conducted for use by purpose this analysis groups amenities into cultural, environmental or social. The results are described in the table below. Grouping of amenities by purpose Average use score Cultural 33 Environmental 27 Social 35 TOTAL (average of all amenities in survey) 32 The average amenity in this survey was used by 32% of the population. Use was higher for social amenities (35%) and lower for environmental amenities (27%). COLMAR BRUNTON 2011 Page: 29
31 2: Perceived Share of benefits from each amenity Respondents were asked to describe who they thought received the most benefit from each amenity. They were offered the options of it benefits most people in the region, it only benefits people living near it, or it only benefits people with special interests. Some people volunteered a further response which was it benefits everyone or it benefits everyone in New Zealand, including those living outside the region however this type of answer was unprompted and was not part of the response list read out to respondents. For the purposes of further analysis later in this chapter we have combined it benefits everyone, including those outside the region and it benefits most people. Results for the perceived benefit of all amenities are illustrated in the chart overleaf. COLMAR BRUNTON 2011 Page: 30

32 Share of benefits from each amenity % everyone/ most people Ambula nce Services Te Papa Westpac Stadium Wellington Zoo Wellington Botanic Gardens :, 19% "' 78 12% TSB Arena 25% 64 The Rugby Sevens '. 33% " 61 The Martinborough Fair 26% % 56 Michael Fowler Centre 9 '. 35% % 52 Zealandia 28% 51 Wgtn Museum of Cy & Sea The NZ International Arts Festival World of Wearable Art Kapiti Island Pukaha Mount Bruce wildlife centre Wings over Wairarapa Wellington City Gallery ',. 45% 46,. 49%, Pataka Museum and Gallery NZ Symphony Orchestra '. 66%,. 35% The Downstage Theatre '. 57% 28 New Dowse 42% 12% 27 Te Rauparaha Arena 20% 31% 23 Everyone, including those outside region Most people living in region Only people living near it Only people with special interests Don't know / not heard of it,, Col mar Brunton G- Social Research Agency OB1) I am now going to read out the list again, and I'd like you to think about who receives the most benefit from each one. So thinking about... [Amenity]... would you say that... Base: All respondents (n=998 to 1002) COLMAR BRUNTON 2011 Page: 31
33 The top five amenities (in terms of the proportion saying that they benefit everyone or most people) were: 1. The Ambulance Service (including Wellington Free Ambulance and St John) (92% of respondents said that everyone or most people benefited from the Ambulance Service). 2. Te Papa (86%). 3. Westpac Stadium (78%). 4. Wellington Zoo (77%). 5. Wellington Botanic Gardens (66%). Downstage Theatre, New Dowse and Te Rauparaha Arena had the lowest proportions saying they benefited everyone or most people (28%, 27% and 23% respectively). It is interesting to note that although Pukaha Mount Bruce wildlife centre and Kapiti Island have a relatively small proportion of users (11% had visited Pukaha Mount Bruce wildlife centre in the past year, and 6% had visited Kapiti Island - see Chapter 1 for details), they have relatively high proportions saying they benefit everyone, or most people (40% and 46% respectively). Views on the benefits of amenity - subgroup analysis Perceptions about who benefits from each amenity varied within different groups of the population. The section below looks at different groups of the population in the region and highlights where views by a particular subgroup stood out from the rest. For more detailed examination by area, the reader should refer to the set of tables which accompany this report. Gender Females were more likely than males to say the following amenities benefited everyone or most people: World of Wearable Art (50% compared to 41% of males). Wellington Botanic Gardens (71% compared to 61%). And were less likely to say the following amenities benefited everyone or most people: Westpac Stadium (73% compared to 84% of males). The Rugby Sevens (58% compared to 65%). TSB Arena (59% compared to 68%). Wings Over Wairarapa (30% compared to 39%). Age Older respondents (those aged 50 or older) were more likely than average to say the following amenities benefited everyone or most people: New Dowse (33% compared to the average of 12%). Michael Fowler Centre (60% compared to 52%). Pukaha Mount Bruce wildlife centre (47% compared to 40%). NZ Symphony Orchestra (36% compared to 29%). Downstage Theatre (35% compared to 28%). COLMAR BRUNTON 2011 Page: 32
34 Older respondents (those aged 50 or older) were less likely than average to say the following amenities benefited everyone or most people: Westpac Stadium (73% compared to the average of 78%). TSB Arena (53% compared to 64%). Ethnicity Māori were more likely than average to say Te Rauparaha Arena benefited everyone or most people (39% compared to the average of 23%). However, they were less likely than average to say the following amenities benefited everyone or most people: Wellington Museum of City and Sea (37% compared to the average of 49%). Kapiti Island (32% compared to 46%). Wellington City Gallery (18% compared to the average of 30%). NZ Symphony Orchestra (13% compared to 29%). Pacific respondents were less likely than average to say the following amenities benefited everyone or most people: Te Papa (70% compared to the average of 86%). Wellington Zoo (61% compared to 77%). World of Wearable Art (24% compared to 46%). New Dowse (12% compared to 27%). NZ Symphony Orchestra (13% compared to 29%). (There were no amenities that Pacific respondents were more likely to say benefited everyone or most people ). Asian respondents were less likely than average to say the following amenities benefited everyone or most people: Ambulance Services (81% compared to 92%). Westpac Stadium (62% compared to 78%). Michael Fowler Centre (35% compared to the average of 52%). Zealandia (15% compared to 51%). The NZ International Arts Festival (29% compared to 46%). NZ Symphony Orchestra (12% compared to 29%). Downstage Theatre (10% compared to 28%). (There were no amenities that Asian respondents were more likely to say benefited everyone or most people ). Income Those with a household income of $100,000 or more were more likely than average to say the following amenities benefited everyone or most people: Westpac Stadium (90% compared to the average of 78%). TSB Arena (71% compared to 64%). The NZ International Arts Festival (55% compared to 46%). Zealandia (61% compared to 51%). (There were no amenities that they were less likely to say benefited everyone or most people ). COLMAR BRUNTON 2011 Page: 33
35 Those in the lowest income bracket (household income up to, and including, $30,000) were less likely than average to say the following amenities benefited everyone or most people: Ambulance Services (86% compared to the average of 92%). Te Papa (75% compared to 86%). Westpac Stadium (65% compared to the average of 78%). TSB Arena (55% compared to 64%). The Rugby Sevens (50% compared to 61%). World of Wearable Art (37% compared to 46%). Zealandia (40% compared to 51%). (There were no amenities that they were more likely to say benefited everyone or most people ). Rate-payers Rate-payers were generally more likely to feel that everyone or most people benefited from amenities. They were more likely than those who do not pay rates directly to a council to say the following amenities benefited everyone or most people: Wellington Zoo (79% compared to 72% of those who do not pay rates directly). Martinborough Fair (60% compared to 56%). Zealandia (53% compared to 45%). The NZ International Arts Festival (49% compared to 41%) Kapiti Island (49% compared to 38%). Wings over Wairarapa (37% compared with 27% of those who do not pay rates directly). NZ Symphony Orchestra (32% compared to 22%). Pataka Museum and Gallery (32% compared to 23%). Downstage Theatre (33% compared to 18%). New Dowse (30% compared to 22%). (There were no amenities that they were less likely to say benefited everyone or most people ). Location Respondents in Lower Hutt were less likely than average to say the following amenities benefited everyone or most people: Te Papa (79% compared to the average of 86%). World of Wearable Art (35% compared to 46%). (There were no amenities that they were more likely to say benefited everyone or most people ). Respondents in Upper Hutt were more likely than average to say the following amenities benefited everyone or most people: Zealandia (62% compared to 51%). Wings Over Wairarapa (45% compared to 34%). Martinborough Fair (68% compared to 56%). (There were no amenities that they were less likely to say benefited everyone or most people ). COLMAR BRUNTON 2011 Page: 34
36 Respondents in Porirua were more likely than average to say that Te Rauparaha Arena benefited everyone or most people (40% compared to 23%). But were less likely than average to say the New Dowse benefited everyone or most people (19% compared with the average of 27%). Respondents in Kapiti were less likely than average to say the following amenities benefited everyone or most people: Zealandia (27% compared with the average of 51%). Pukaha Mount Bruce wildlife centre (28% compared to 40%). Wellington City Gallery (19% compared to 30%). New Dowse (18% compared to 27%). (There were no amenities that they were more likely to say benefited everyone or most people ). Respondents in Wellington City were more likely than average to say the following amenities benefited everyone or most people: Westpac Stadium (84% compared with the average of 78%). TSB Arena (72% compared to 64%). Zealandia (62% compared to 51%). World of Wearable Art (57% compared to 46%). New Dowse (35% compared to 27%). Wellington City Gallery (39% compared to 30%). (There were no amenities that they were less likely to say benefited everyone or most people ). Respondents from the Wairarapa (which includes residents from South Wairarapa, Carterton and Masterton) were more likely than average to say the following amenities benefited everyone or most people: The Martinborough Fair (71% compared with the average of 56%). Pukaha Mount Bruce wildlife centre (65% compared to 40%). Wings over Wairarapa (57% compared to 34%). However, they were less likely than average to say the following amenities benefited everyone or most people: Ambulance Services (87% compared to 92%). Te Papa (73% compared to 86%). Westpac Stadium (70% compared to 78%). TSB Arena (48% compared to 64%). Wellington Botanic Gardens (45% compared to 66%). Michael Fowler Centre (41% compared to 52%). The NZ International Arts Festival (38% compared to 46%). World of Wearable Art (37% compared to 46%). Wellington Museum of City and Sea (36% compared to 49%). Kapiti Island (34% compared to 46%). Zealandia (27% compared to 51%). Pataka Museum and Gallery (23% compared to 29%). Wellington City Gallery (23% compared to 30%). Downstage Theatre (22% compared to 28%). Te Rauparaha Arena (13% compared to 23%). New Dowse (10% compared to 27%). COLMAR BRUNTON 2011 Page: 35
37 Perceived share of benefits views from outside each amenity s immediate council area To help determine amenities that are regarded as beneficial - even by residents who do not live close to the amenity - we filtered the data to include only those who lived outside the immediate council area of each amenity. The results are illustrated in the chart overleaf. The summary statistic for each amenity on the right hand side (in grey boxes) represents the proportion of respondents outside the amenity s council area that said that the amenity benefited everyone or most people. The indicator in brackets is how much higher, or lower, views are compared with views from across the whole region (presented in the previous chart). Please note that Ambulance Services have been excluded from this analysis because they operate across all council areas. COLMAR BRUNTON 2011 Page: 36
![Share of benefits from each amenity [only views from outside that council area] % everyone/ most people Te Papa Wellingtan Zaa 12% ", 15% ", 83(3%) 74(3%) westpac Stadium 24% 73(5%) Wellington](/docs-images/94/120541595/images/38-0.jpg "Botanic Gardens 13% \", 65 (1%) The Rugby Sevens \" 34% 60 (1%) TSB Arena 58(6%) The Martinborough Fair \" 26% 5% 56(=) Michael Fowler Centre \" 35% 51 (1%) Wgtn Museum of City & Sea 36% 8% 46(3%) Kapiti")
38 Share of benefits from each amenity [only views from outside that council area] % everyone/ most people Te Papa Wellingtan Zaa 12% ", 15% ", 83(3%) 74(3%) westpac Stadium 24% 73(5%) Wellington Botanic Gardens 13% ", 65 (1%) The Rugby Sevens " 34% 60 (1%) TSB Arena 58(6%) The Martinborough Fair " 26% 5% 56(=) Michael Fowler Centre " 35% 51 (1%) Wgtn Museum of City & Sea 36% 8% 46(3%) Kapiti Island 37% 5% 46 ( = ) Zealandia 15% 44 (7%) The NZ International Arts Festival 49% % 42 (4%) Pukaha Mount Bruce wildlife centre 34% 12% 39 (1%) World of Wearable Art " 57% ", 38(8%) Wings over Wairarapa 49% 33 (1%) Pataka Museum and Gallery 36% 28 (1%) The Downstage Theatre 57% 5% 24(5%) New Dowse 42% 13% 27 ( = ) Wellingtan City Gallery 61% 6% 24(6%) NZ Symphony Orchestra 68% 4% 24(5%) Te Rauparaha Arena 21% 34% 21 (2%) Everyone, including those outside region Most people living in region Only people living near it Only people with special interests Don't know / not heard of it,,. Colmar Brunton tj Social Research Agency G- QBl) I am now going to read out the list again, and I'd like you to think about who receives the most benefit from each one, So thinking about..,[amenity]... would you say that... Base: All respondents who do not live in same location as amenity [799 to 902) COLMAR BRUNTON 2011 Page: 37
39 Even when filtering out respondents living in the council area where the amenity is based, Te Papa, Wellington Zoo and Westpac Stadium continue to be the top three amenities with the highest proportion saying that everyone or most people benefited from them 2. For example, 83% of respondents living outside of Wellington City said that everyone or most people benefited from Te Papa this is slightly lower than the result when looking at answers across the region (86% for all regions including Wellington City). The proportions of respondents based outside Wellington City who said Wellington Zoo and Westpac Stadium benefited everyone or most people were: 74% and 73% respectively (this is closely followed by 65% for Wellington Botanic Gardens and 60% for the Rugby Sevens). Te Rauparaha Arena is the amenity that receives the lowest proportion of respondents saying that everyone or most people benefit this is the case when looking at results from across the region as a whole and also when looking at everywhere in the region excluding Porirua (23% and 21% respectively). Wellington City Gallery and NZ Symphony Orchestra receive relatively low scores for benefit when views from outside Wellington City are examined. 24% of those outside Wellington City said Wellington City Gallery benefited everyone or most people, and the same proportion said this for NZ Symphony Orchestra). This is significantly lower than the view when including Wellington City in the analysis (30% and 29% respectively). Perceived share of benefits views from non-users People can understand the benefit of an amenity, even if they have not used it. In order to examine this further, we filtered out users to determine the perceived share of benefits from non-users (defined as not having used that amenity in the past year or past five years for events/ambulance). The results are illustrated in the chart overleaf. The format is similar to the previous chart. The grey box on the right-hand side of the chart represents the proportion of non-users that said that the amenity benefited everyone or most people. The number in brackets shows whether views from non-users are lower or higher (and by what percentage) than views from all respondents (including users and non-users which was the data presented at the beginning of this chapter). 2 Not withstanding Ambulance Services which was excluded from this analysis because they were not based in any one particular council area. COLMAR BRUNTON 2011 Page: 38
![Share of benefits from each amenity [only views from non-users] % everyone/ most people Ambulance Services 93(1'1%) Wellington Zoo '. 14% 75(,",2%) Te Papa 71 (,",15%) westpac Stadium '.. 32% ".](/docs-images/94/120541595/images/40-1.jpg "63 (,\",15%) Wellington Botanic Gardens 16% 61(,\",5%) The Rugby Sevens 37% '.")
40 Share of benefits from each amenity [only views from non-users] % everyone/ most people Ambulance Services 93(1'1%) Wellington Zoo '. 14% 75(,",2%) Te Papa 71 (,",15%) westpac Stadium '.. 32% ". 63 (,",15%) Wellington Botanic Gardens 16% 61(,",5%) The Rugby Sevens 37% '. 57(,",4%) TSB Arena 53 (,",11%) The Martinborough Fair 48(,",8%) Kapiti Island 45(,",1%) Zealandia 45(,",6%) Wgtn Museum ot Cy & Sea 43(,",6%) Michael Fowler Centre 42 (,",10%) Pukaha Mount Bruce wildlife centre 39(,",1%) The NZ International Arts Festival 38(,",8%) World of Wearable Art 38(,",8%) Wings over Wairarapa '. 53% 30(,",4%) The Downstage Theatre NZ Symphony Orchestra Wellington City Gallery Pataka Museum and Gallery New Dowse T e Rauparaha Arena '. 58% '. '. 69%,'. 41% 47% 33% 27(,",1%) 26(,",3%) 22(,",8%) 22(,",7%) 21 (,",6%) 18(,",5%) Everyone, including those outside region Only people living near it Most people living in region Only people with special interests Don't know / not heard of it QB1) I am now going to read out the list again, and I'd like you to think about who receives the most benefit from each one. So thinking about... IAmenity)... would you say that... Base: All respondents who have not used amenity in past year / past five years (for events/ambulance) (n=313 to n=948),:,'&''' Colmar Brunton tj Social Research Agency G COLMAR BRUNTON 2011 Page: 39
41 The top five most beneficial amenities among non-users are: Ambulance Services (93% of non-users said this benefited everyone or most people), Wellington Zoo (75%), Te Papa (71%), Westpac Stadium (63%), and Wellington Botanic Gardens (61%). This is similar to the top five most beneficial amenities described in the first chart in this chapter. Additional subgroup analysis we conducted between users and non-users of each amenity reveals that users of amenities are always more likely than non-users to say that the amenity benefits everyone or most people. However, the relationship was less strong (not statistically significant at the 95% confidence level) for three amenities: Kapiti Island, Downstage Theatre and Wellington Zoo. 3 Perceived benefits by theme A high-level thematic analysis was conducted in order to highlight respondent s overall views about venues, attractions, organisations and events, and to look at whether there was any difference in views across cultural, environmental and social amenities. All 22 individual amenities were split into two themes for further analysis the first involved grouping amenities by function (venues, attractions, organisations and events). The second theme involved grouping amenities around purpose (cultural, environmental or social). Please refer to page 17 for further details of which amenities fell into each category. The following table shows the average scores for amenities within each grouping. This simply takes the benefits everyone and benefits most people figure for each amenity (described earlier in this section) within each grouping and sums them; the total is then divided by the number of amenities in that grouping. The results should be treated with caution because each of these groupings only contain a small number of regional amenities. It was not possible to provide survey data on the full range of venues, attractions, organisations, and events in the Wellington region. Nor was it possible to provide survey data on the full range of cultural, environmental and social amenities in the region (we were limited to only asking about 22 specific amenities). Therefore results from the groupings are indicative only because they only reflect views about a limited number of amenities within each category. Grouping of amenities by function Average benefit score Venues 54 Attractions 50 Organisations 50 Events 49 TOTAL (average of all amenities in survey) 50 50% was the average score from all amenities when it came to benefiting everyone or most people. This score was higher for venues (54% for the average venue) and slightly lower for events (49%). It should be noted that the average amenity or the average venue etc. is an artificial construction and is only used for thematic analysis of the survey results. A similar analysis was conducted for use by purpose this analysis groups amenities into cultural, environmental or social. The results are described in the table below. 3 81% of Wellington Zoo users said it benefited everyone or most people the figure for non-users was lower, although not significantly lower, at 75%. Comparable percentages for Kapiti Island were 54% for users and 45% for non-users, and 35% and 27% respectively for Downstage. COLMAR BRUNTON 2011 Page: 40
42 Grouping of amenities by purpose Average benefit score Cultural 41 Environmental 56 Social 58 TOTAL (average of all amenities in survey) 50 50% was the average score from all amenities when it came to benefiting everyone or most people. This score was higher for social and environmental amenities (58% and 56% respectively) and lower for cultural amenities (41%). COLMAR BRUNTON 2011 Page: 41
43 3: Views on region-wide support Respondents were asked to think about council support for each amenity. They were asked to think whether the amenity should be from all of the councils in the region together, just the council where it is based, or neither in other words it should not receive any council support. Results for all amenities are illustrated in the chart overleaf. COLMAR BRUNTON 2011 Page: 42

 Just the council where it is based Don't know / not heard of it,,.")
44 Views on region-wide support per amenity Ambulance Service westpac Stadium Te Papa Wellington Zoo NZ Symphony Orchestra The Rugby Sevens Kapiti Island NZ International Arts Festival TSB Arena World of Wearable Art Zealandia Pukaha Mount Bruce wildlife centre Michael Fowler Centre Wgtn Museum of City & Sea Wellington Botanic Gardens Pataka Museum and Gallery Wellington City Gallery Wings over Wairarapa Te Rauparaha Arena Downstage Theatre New Dowse The Martinborough Fair ---75% ii19% 29% 36% 40% 39% 46% 48% 61% 68% 62% 60% 65% -44% 57% 62% 66% 68% 53% 35% % 14%.. 9% % "., 14%.. 12%.... All the councils in the region together Neither (no council support) Just the council where it is based Don't know / not heard of it,,. Colmar Brunton G- tj Social Research Agency QCl) Do you think council support for.. [Amenity] should be from... 7 Base: All respondents (n=974 to 1001) COLMAR BRUNTON 2011 Page: 43
45 The Ambulance Service (including Wellington Free Ambulance and St John) received the highest proportion of respondents saying that all of the councils should support it (87%). This was closely followed by: Westpac Stadium (75%). Te Papa (69%). Wellington Zoo (65%). NZ Symphony Orchestra (57%). Views on region-wide support subgroup analysis Within the population there were varying levels of backing for region-wide support by subgroup. Significant differences are described below. Gender Females were more likely than males to back region-wide support for: World of Wearable Art (47% compared to 41% of males). Michael Fowler Centre (42% compared to 32%). Te Rauparaha Arena (22% compared to 17%). Females were less likely than males to back region-wide support for: Wings Over Wairarapa (20% compared to 26% of males). Age Those aged 50+ were more likely to back region-wide support for: NZ Symphony Orchestra (64% compared to 57%). Pukaha Mount Bruce wildlife centre (47% compared to 38%). Zealandia (46% compared to the average of 40%). Downstage Theatre (27% compared to 20%). Those aged 50+ were less likely to back region-wide support for: The Rugby Sevens (48% compared to the average of 54%). TSB Arena (38% compared to 47%). Ethnicity Māori were less likely to back region-wide support for a number of amenities including: Te Papa (55% compared to the average of 69%). NZ Symphony Orchestra (43% compared to 57%). The NZ International Arts Festival (40% compared to 52%). Zealandia (26% compared to 40%). Downstage Theatre (12% compared to 20%). (They were not more likely to back region-wide support for any amenity). COLMAR BRUNTON 2011 Page: 44
46 Pacific respondents were more likely to back region-wide support for Wellington Museum of City and Sea (52% compared to the average of 33%), but less likely to back region-wide support for NZ Symphony Orchestra (34% compared to 57%). Asian respondents were more likely to back region-wide support for Wellington City Gallery (48% compared to the average of 25%), but less likely to back region-wide support for Zealandia (17% compared to 40%). Income There was no significant variation in most income bands when it came to backing for region-wide support of amenities. However, the lowest income band (household income up to $30,000) were slightly less likely to back region-wide support for: Westpac Stadium (68% compared to 75%). Kapiti Island (44% compared to 54%). But this income group were more likely to back region-wide support for: Downstage Theatre (27% compared to 20%). Martinborough Fair (22% compared to 16%). Rate-payers Those who pay rates directly to the council were more likely to back region-wide support for Wellington Museum of City and Sea (35% compared to 27% of those who do not pay rates directly to a council). However, they were less likely to back region-wide support for a number of amenities, including: The Rugby Sevens (51% compared to 63% of those who do not pay rates directly to a council). Wellington City Gallery (21% compared to 33%). New Dowse (15% compared to 22%). Martinborough Fair (13% compared to 24%). Location Lower Hutt residents were more likely than average to say that Ambulance Services should receive region-wide support (94% compared to the average of 87%). (They were not less likely to back region-wide support for any particular amenity). Upper Hutt residents were more likely than average to say that Zealandia should receive region-wide support (59% compared to 40%). (They were not less likely to back region-wide support for any particular amenity). Porirua residents were more likely than average to say that Ambulance Services should receive region-wide support (94% compared to the average of 87%). However, they were less likely than average to say that NZ Symphony Orchestra should receive region-wide support (47% compared to 57%). Kapiti Coast residents were less likely than average to say that the following amenities should receive region-wide support: Westpac Stadium (66% compared to the average of 75%). Wellington Zoo (50% compared to 65%). Zealandia (28% compared to 40%). Wellington City Gallery (16% compared to 25%). Wings Over Wairarapa (13% compared to 23%). (They were not more likely to back region-wide support for any particular amenity). COLMAR BRUNTON 2011 Page: 45
47 Wellington City residents were more likely than average to think that Wellington Zoo should receive region-wide support (72% compared to the average of 65%). However, they were less likely to think that Ambulance Services should receive region-wide support (82% compared to 87%). Wairarapa residents were less likely to back region-wide funding for most amenities including: Ambulance Services (77% compared to 87%). Westpac Stadium (66% compared to 75%). Te Papa (52% compared to 69%). Wellington Zoo (55% compared to 65%). NZ Symphony Orchestra (50% compared to 57%). Kapiti Island (47% compared to 54%). The NZ International Arts Festival (43% compared to 52%). The Rugby Sevens (40% compared to 54%). TSB Arena (39% compared to 47%). World of Wearable Art (32% compared to 44%). Michael Fowler Centre (28% compared to 37%). Wellington Museum of City and Sea (24% compared to 33%). Wellington Botanic Gardens (21% compared to 30%). Zealandia (20% compared to 40%). Pataka Museum and Gallery (19% compared to 25%). Downstage Theatre (14% compared to 20%). Te Rauparaha Arena (13% compared to 20%). New Dowse (12% compared to 17%). However, they were more likely to back region-wide funding for: Pukaha Mount Bruce wildlife centre (49% compared to 38%). Wings Over Wairarapa (37% compared to 23%). (There was no statistically significant difference between Wairarapa and the region for Wellington City Gallery and Martinborough Fair). With the obvious exception of Wairarapa residents, there are less demographic and sub-regional differences for this question compared with other questions in the survey, which means there is a degree of consensus in the population around what amenities should be supported by all of the councils in the region. COLMAR BRUNTON 2011 Page: 46
48 Views on region-wide support from outside each amenity s immediate council area To help determine views on region-wide support for each amenity among residents who do not live close to each amenity, we filtered the data to include only those who lived outside the immediate council area where each amenity was based. The results are illustrated in the chart overleaf. The indicator in brackets on the right-hand side of each bar (in a grey box) is how much lower (or higher) views are compared with views from across the whole region (i.e. the data presented in the previous chart). Please note that Ambulance Services have been excluded from this analysis because they operate across all council areas. COLMAR BRUNTON 2011 Page: 47
![Views on region-wide support per amenity [only views from outside that council area] % diff.](/docs-images/94/120541595/images/49-1.jpg "compared with region-wide figure westpac Stadium Te Papa Wellington Zoo 20% 36% 21% (-l-4) ( =) (-l-s) Kapiti Island 34% ( = ) NZ Symphony Orchestra 24% (-l-3) The Rugby Sevens 32% 14% ',.")
 Zealandia 49% (-l-3) Pukaha Mount Bruce wildlife centre - 37% 46% (-l-1) Michael Fowler Centre - 36% 55% (-l-1) Wgtn Museum of CHy & Sea 57% (1'1) Wellington Botanic Gardens Pataka Museum and")
49 Views on region-wide support per amenity [only views from outside that council area] % diff. compared with region-wide figure westpac Stadium Te Papa Wellington Zoo 20% 36% 21% (-l-4) ( =) (-l-s) Kapiti Island 34% ( = ) NZ Symphony Orchestra 24% (-l-3) The Rugby Sevens 32% 14% ',. (-l-3) NZ International Arts Festival 40% (-l-s) TSB Arena 39% 9% ',. ( =) World of Wearable Art - 40% 38% 19% ',. (-l-4) Zealandia 49% (-l-3) Pukaha Mount Bruce wildlife centre - 37% 46% (-l-1) Michael Fowler Centre - 36% 55% (-l-1) Wgtn Museum of CHy & Sea 57% (1'1) Wellington Botanic Gardens Pataka Museum and Gallery -33% 61% 65% ;;; 'it (1'3) ( = ) Wellington City Gallery 66% (-l-2) Wings over Wairarapa 60% (-l-1) Downstage Theatre 59% 15%. ',. (1'2) Te Rauparaha Arena 56% ( =) New Dowse 65% ( = ) The Martinborough Fair 68% 12%. ',. ( = ) All the councils in the region together Neither (no council support) Just the council where it is based Don't know / not heard of it QCl) Doyou think coun cil support for.. [A menityj should be from...? Base: All respondents who do not live in same location as amenity (n=799 to 902),,. Colmar Brunton tj Social Research Agency G- COLMAR BRUNTON 2011 Page: 48
50 Views on region-wide support for amenities outside respondents immediate council areas were broadly similar to views across the whole region. Excluding Ambulance Services, the top five amenities (ranked by the proportion saying there should be support from all of the councils in the region) are: 1. Westpac Stadium (71% of respondents outside of Wellington City said there should be support from all of the councils in the region for Westpac Stadium), 2. Te Papa (69% of those based outside of Wellington City said there should be region- wide support), 3. Wellington Zoo (60% of those based outside of Wellington City said there should be region-wide support), 4. Kapiti Island (54% of those based outside of Kapiti supported the idea of region-wide support), and 5. NZ Symphony Orchestra (54% of those based outside of Wellington City said there should be region-wide support). Each of these five amenities received positive answers about region-wide support from over half of respondents living outside the immediate council area where the amenity was based. With the exception of Ambulance Services (which did not form part of this part of the analysis), this top five is very similar to the overall top five when all respondents across the region are included, with the exception of Kapiti Island, which was ranked just outside the top five when the whole region was examined. (Kapiti Island was one of several amenities that received an identical level of backing for region-wide support inside and outside of its council area). Region-wide support views from non-users People may agree with the idea of region-wide support for an amenity, even if they have not used it personally. In order to examine this further, we filtered out users to determine the views from non-users (defined as not having used that amenity in the past year or past five years for events/ambulance). The results are illustrated in the chart overleaf. The format is similar to the previous chart. The indicator in brackets on the right-hand side of each bar (in a grey box) is how much lower (or higher) views are compared with views from across the whole region (i.e. the data presented in the first chart in this Chapter). COLMAR BRUNTON 2011 Page: 49
![Views on region-wide support per amenity [only views from non-users] % lower compared with region-wide figure Ambulance Services (=) westpac Stadium (-l-8) Wellington Zoo - 63% [-l-2) Te Papa 19%](/docs-images/94/120541595/images/51-1.jpg "(-l-8) NZ Symphony Orchestra 21% (-l-2) Kapiti Island 35% (-l-l) The Rugby Sevens 29% 18%. ',. (-l-5) NZ International Arts Festival -44% 40% 12%.")
51 Views on region-wide support per amenity [only views from non-users] % lower compared with region-wide figure Ambulance Services (=) westpac Stadium (-l-8) Wellington Zoo - 63% [-l-2) Te Papa 19% (-l-8) NZ Symphony Orchestra 21% (-l-2) Kapiti Island 35% (-l-l) The Rugby Sevens 29% 18%. ',. (-l-5) NZ International Arts Festival -44% 40% 12%... (-l-8) TSB Arena 38% (-l-3) World of Wearable Art 40% 18% " (-l-4) Zealandia 49% (-l-3) Pukaha Mount Bruce wildlife centre 48% (-l-2) Michael Fowler Centre 58% (-l-7) Wgtn Museum of City & Sea 63% (-l-3) Wellington Botanic Gardens 68% [-l-2) Pataka Museum and Gallery 65% [-l-3) Wellington City Gallery 67% [-l-3) Wings over Wairarapa 62% (-l-l) Downstage Theatre 62% ( =) Te Rauparaha Arena 60% (-l-2) New Dowse 66% (-l-l) The Martinborough Fair 69% 12%. ',. (-l-l) All the councils in the region together Neither (no council support) Just the council where it is based Don't know / not heard of it,:,'&''' Colmar Brunton tj Social Research Agency G OCl) DD you think council support for.. [Amenity] should be from... 7 Base: All respondents WilD have not used amenity in past year / past five years (for events/ambulance) (n=313 to 948) COLMAR BRUNTON 2011 Page: 50
52 When it comes to opinions on region-wide support, views of non-users do not vary too much from the norm. Among non-users the top five amenities (in terms of proportions backing region-wide support) are the same as the top five amenities across all respondents in the region (although Te Papa drops from third place to fourth place). A close examination of users vs. non-users reveals that users are more likely to back region-wide support (compared directly against non-users) for all amenities except: Ambulance Services (87% of non-users back region-wide support compared with 89% of users). Downstage Theatre (20% compared with 22%). Wellington Botanic Gardens (28% compared with 32%). Although non-users of these amenities were less likely to say they should receive region-wide support, compared with users, the difference was not statistically significant. Views on region-wide support by theme A high-level thematic analysis was conducted in order to highlight respondent s overall views about venues, attractions, organisations and events, and to look at whether there was any difference in views across cultural, environmental and social amenities. All 22 individual amenities were split into two themes for further analysis the first involved grouping amenities by function (venues, attractions, organisations and events). The second theme involved grouping amenities around purpose (cultural, environmental or social). Please refer to page 17 for further details of which amenities fell into each category. The following table shows the average scores for amenities within each grouping. This simply takes the figure for region-wide support for each amenity (described earlier in this section) within each grouping and sums them; the total is then divided by the number of amenities in that grouping. Grouping of amenities by function Average region-wide support score Venues 45 Attractions 40 Organisations 55 Events 38 TOTAL (average of all amenities in survey) 42 The results should be treated with caution because each of these groupings only contains a small number of regional amenities. It was not possible to provide survey data on the full range of venues, attractions, organisations, and events in the Wellington region. Nor was it possible to provide survey data on the full range of cultural, environmental and social amenities in the region (we were limited to only asking about 22 specific amenities). Therefore results from the groupings are indicative only because they only reflect views about a limited number of amenities within each category. 42% was the average score from all amenities when it came to backing region-wide support. This score was higher for organisations (55% for the average organisation) and venues (45%), but lower for events (38%) and attractions (40%). It should be noted that the average amenity or the average venue etc. is an artificial construction and is only used for thematic analysis of the survey results. COLMAR BRUNTON 2011 Page: 51
53 A similar analysis was conducted for use by purpose this analysis groups amenities into cultural, environmental or social. The results are described in the table below. Grouping of amenities by purpose Average region-wide support score Cultural 38 Environmental 45 Social 45 TOTAL (average of all amenities in survey) 42 42% was the average score from all amenities when it came to backing for region-wide support. This score was higher for social and environmental amenities (45% each) and lower for cultural amenities (38%). COLMAR BRUNTON 2011 Page: 52
54 4: Willingness to Pay Respondents were asked how much they would be willing to pay each year to financially support attractions and services that are important to the Wellington region. The results are illustrated in the chart below. Willingness to pay for regional amenities Nothing 20 Up to $10 18 Up to $25 20 Up to $50 21 Up to $ More than $100 6 Don t know 4 0% 10% 20% 30% 40% QC3) If your council was to financially support attractions and services that are important to the Wellington region, extra funds might need to be raised through rates. For those who rent this would mean an increase in rent, and for those who pay rates, this would mean an increase in rates. How much would you be prepared to pay each year? Base: All respondents (n=2000) One in five respondents said they were not willing to pay, with a further 4% unsure. This means that 76% of respondents were willing to pay something, with over half of them (57%) willing to pay up to $25 or higher per year. Willingness to pay varied by income, with respondents from high income households being willing to pay more (as the following table demonstrates). COLMAR BRUNTON 2011 Page: 53
55 Willingness to pay by household income Total Up to $30,000 $30,001 to $50,000 $50,001 to $80,000 $80,001 - $100,000 $100,000+ Base size: (n=2,000) (n=428) (n=300) (n=441) (n=205) (n=463) Nothing, $0 20% 27% 19% 17% 18% 16% Up to $10 18% 25% 21% 20% 14% 11% Up to $25 20% 19% 19% 22% 22% 20% Up to $50 21% 14% 20% 22% 21% 28% Up to $100 10% 4% 8% 8% 16% 16% More than $100 6% 4% 6% 5% 6% 8% Don t know 4% 6% 6% 6% 4% 1% Willingness to pay varied by income, with respondents from higher income households being willing to pay more, for example, 52% of respondents with a household income of $100,000 per year or more were willing to pay $50 or more per year (compared with 22% of those with a household income of $30,000 per year). However, it is worth noting that even within the lowest income bracket (up to $30,000 per year), the majority (67%) were willing to pay something to support regionally important amenities (27% were not and a further 6% were unsure). Apart from variation by income, there were some variations within other groups of the population as described below. Willingness to pay subgroup analysis Age Younger respondents were more willing to pay than older respondents (82% of those aged up to 29 were willing to pay, 77% of those aged were willing to pay, and 70% of those aged 50+ were willing to pay). Ethnicity Māori, Pacific, and Asian respondents were no more, or less, likely to be willing to pay (compared with average). However, Māori and Pacific were more likely to say up to $10 (23% of Māori respondents and 49% of Pacific respondents compared to 18% on average). Rate-payers Ratepayers were less willing to pay (73% compared to 80% of those who do not pay rates directly to a council). COLMAR BRUNTON 2011 Page: 54
56 Location Those based in Wellington City were more willing to pay (80% compared to the average of 75%). Those based in Porirua were less likely to be willing to pay (68% compared to the average of 75%), as were residents based in Wairarapa (67%) and Upper Hutt (69%). The proportion that were willing to pay did vary by other district councils, although the differences were not statistically significant (the proportion that were willing to pay was 76% in Lower Hutt and 70% in Kapiti). In terms of Wairarapa councils, 72% of those living in South Wairarapa were willing to pay (which is in line with the average). But the figures in Masterton and Carterton were below average (at 67% and 62% respectively). Lower Hutt residents were no more, or less, likely to be willing to pay but the amount they would be willing to pay was lower (23% said they would want to pay up to $10 compared with 18% on average). Wellington City residents tended to respond more positively to the higher payment options (15% were willing to pay up to $100 compared with 10% on average, and 10% were willing to pay more than $100 compared with 6% on average). (Please note there was no difference in willingness to pay by gender). COLMAR BRUNTON 2011 Page: 55
57 5: Thematic Analysis of Open Ended question asking about other amenities Towards the end of the questionnaire respondents were asked "The councils in the region are always looking for new ways to improve the region. Thinking of the types of things we have discussed, what things to do you think the region, not just your local council, should support?" A thematic analysis of responses was undertaken by Wellington City Council. The main findings were: There was a broad range and size of amenities and services commented on - social (for example, Rugby Sevens), environmental (for example, Kapiti Island) and cultural (for example, World of Wearable Art). As described in the methodology section, each respondent was asked about half of the total amenities (in order to minimise burden on the respondent). The majority of comments reflected the list asked of the other half of the sample (for example, people being asked about the first set of amenities were likely to mention an amenity which was on the second set and vice-versa). A number of the comments reiterated amenities that were identified in the original online panel questions which were used to develop the list of regionally important amenities (this is also described in the methodology). Some of the amenities that were mentioned in the online questions were not included in the final telephone survey because of the small number of times they were mentioned compared to the final list of amenities (examples of this include Cuba Street Carnival and the Dragon Boat Festival although these two amenities were not mentioned by large numbers of respondents). Some respondents focused on core council or central government services such as infrastructure and roading. An example quote here is "infrastructure is everything that is behind the scenes in the region that makes the region tick", another said: "The school, just support the teachers needs like having good wages so that they can teach the children more efficiently." Māori respondents identified Kapa Haka (Māori performing group), support for their local marae and the Lower Hutt event 'Te Ra o Te Raukura ' as areas for support which weren't apparent from any stage of the research apart from analysis of this final open ended question in the telephone survey. While the vast majority of comments related to existing amenities rather than the establishment of new venues or services, some new ventures or future opportunities were mentioned (examples include the Marine Education Centre, creating opportunities for young sports people and young musicians and artists, someone also said: I think they should support more, doesn't have to mean physically building things, but should support more ways for children to become more involved and to stay involved in sport ). Some respondents commented on councils needing to focus on their own areas or stick to core council activities (some quotes from this theme of answers include: I think they should support their own areas because there's enough coming out of our rates as it is. Our rates bill is high enough as it is and They have got to look after themselves first, keeping the public parks and things up to scratch ). COLMAR BRUNTON 2011 Page: 56

58 Appendix A: Response rate calculation The final response rate was 25%. Fieldwork outcome codes and the response rate are listed in the table below. COLMAR BRUNTON 2011 Page: 57
.")

59 Appendix B: Demographic tables The following tables show the demographic break-down of survey respondents. The percentages for the Wellington Amenities survey are weighted (see methodology section for details). Where possible we have provided equivalent data from the 2006 Census. Often the data is not directly comparable for various reasons. Where the data is not directly comparable we have inserted an explanatory footnote. COLMAR BRUNTON 2011 Page: 58


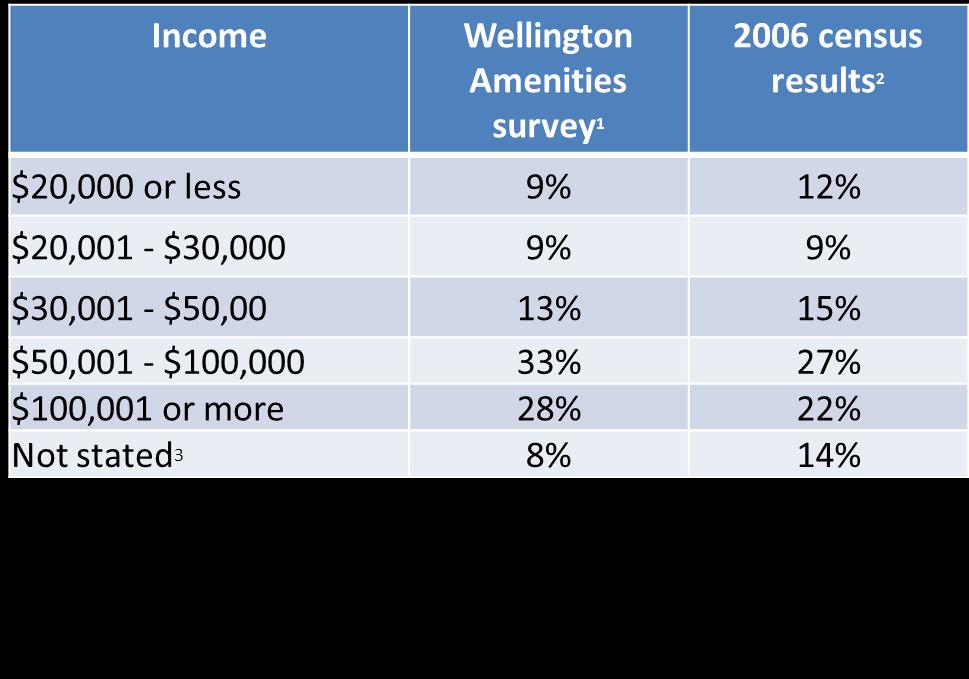
60 COLMAR BRUNTON 2011 Page: 59


61 COLMAR BRUNTON 2011 Page: 60

62 COLMAR BRUNTON 2011 Page: 61
1: Use of amenities. Use of amenities by all residents in the region
 1: Use of amenities This chapter examines recent use of amenities. For those amenities that are available for most of the year (including venues and attractions such as Te Papa or Kapiti Island) the time-scale
3: Views on region-wide support
 3: Views on region-wide support Respondents were asked to think about council support for each amenity. They were asked to think whether the amenity should be from all of the councils in the region together,
Measuring New Zealanders attitudes towards their oceans and marine reserves
 Cat Holloway / WWF-Canon Measuring New Zealanders attitudes towards their oceans and marine reserves A Colmar Brunton report for WWF-New Zealand Published 26 May 2011 wwf.org.nz 25-May-11 / 1 Approach
Tourism Industry Council Tasmania Community Survey 2018 Research Report. May 2018
 Tourism Industry Council Tasmania Community Survey 2018 Research Report May 2018 This report has been prepared by Enterprise Marketing and Research Services 60 Main Road, Moonah TAS 7009 All enquiries
Juneau Household Waterfront Opinion Survey
 Juneau Household Waterfront Opinion Survey Prepared for: City and Borough of Juneau Prepared by: April 13, 2004 TABLE OF CONTENTS Executive Summary...1 Introduction and Methodology...6 Survey Results...7
Measuring New Zealanders attitudes towards their oceans and marine reserves
 Cat Holloway / WWF-Canon Measuring New Zealanders attitudes towards their oceans and marine reserves A Colmar Brunton report for WWF-New Zealand Published 26 May 2011 wwf.org.nz Colmar Brunton research
Events Tasmania Research Program Hobart Baroque Festival
 Events Tasmania Research Program Hobart Baroque Festival Research Report 2014 Prepared by This report has been prepared by Enterprise Marketing and Research Services Pty. Ltd. 60 Main Road, Moonah, 7009
COLMAR BRUNTON. Public Sector Reputation Index. Embargoed until 8 March 2016
 COLMAR BRUNTON Public Sector Reputation Index (BENCHMARK RESULTS TO BE LAUNCHED 8 MARCH 2016) 2016 Embargoed until 8 March 2016 An increasing focus on public sector reputation In recent years more and
ARRIVAL CHARACTERISTICS OF PASSENGERS INTENDING TO USE PUBLIC TRANSPORT
 ARRIVAL CHARACTERISTICS OF PASSENGERS INTENDING TO USE PUBLIC TRANSPORT Tiffany Lester, Darren Walton Opus International Consultants, Central Laboratories, Lower Hutt, New Zealand ABSTRACT A public transport
National Passenger Survey Spring putting rail passengers first
 National Passenger Survey putting rail passengers first What is Passenger Focus? Passenger Focus is the independent national rail consumer watchdog. Our mission is to get the best deal for Britain s rail
TRAMPING FINDINGS FROM THE 2013/14 ACTIVE NEW ZEALAND SURVEY. Sport & Active Recreation Profile ACTIVE NEW ZEALAND SURVEY SERIES.
 ACTIVE NEW ZEALAND SURVEY SERIES Te Rangahau Korikori o Aotearoa Sport & Active Recreation Profile TRAMPING FINDINGS FROM THE 213/14 ACTIVE NEW ZEALAND SURVEY www.sportnz.org.nz Introduction Content This
ONE News Colmar Brunton Poll May 22-26, New Zealand s most respected market research company. ONE News Colmar Brunton Poll
 - Colmar Brunton New Zealand s most respected market research company ONE News Colmar Brunton Poll May 22-26, PREPARED FOR ATTENTION ONE News Colmar Brunton Poll Television New Zealand ISSUE DATE 30/05/10
2013 Business & Legislative Session Visitor Satisfaction Survey Results
 2013 Business & Legislative Session Visitor Satisfaction Survey Results Completed by Juneau Economic Development Council in partnership with The Alaska Committee August 2013 JEDC research efforts are supported
Domestic Tourism Survey 2016
 STATISTICAL RELEASE P0352.1 Domestic Tourism Survey 2016 January to December 2016 Embargoed until: 04 September 2017 10:30 ENQUIRIES: FORTHCOMING ISSUE: EXPECTED RELEASE DATE User Information Services
Ontario Arts and Culture Tourism Profile Executive Summary
 Ontario Arts and Culture Tourism Profile Executive Summary Prepared by for Ontario Arts Council November 2012 ONTARIO ARTS AND CULTURE TOURISM PROFILE EXECUTIVE SUMMARY The Ontario Arts Council (OAC) commissioned
San Francisco Municipal Transportation Agency (SFMTA) Travel Decision Survey 2012
 Travel Decision Survey 2012") Note: The weighting used in this report is not consistent with Travel Decision Surveys (TDS) 2013 and 2014, and findings from this report should not be compared with findings from TDS 2013 and TDS 2014.
Note: The weighting used in this report is not consistent with Travel Decision Surveys (TDS) 2013 and 2014, and findings from this report should not be compared with findings from TDS 2013 and TDS 2014.
The Economic Impact of Tourism Brighton & Hove Prepared by: Tourism South East Research Unit 40 Chamberlayne Road Eastleigh Hampshire SO50 5JH
 The Economic Impact of Tourism Brighton & Hove 2014 Prepared by: Tourism South East Research Unit 40 Chamberlayne Road Eastleigh Hampshire SO50 5JH CONTENTS 1. Summary of Results 1 1.1 Introduction 1 1.2
The Economic Impact of Tourism on Calderdale Prepared by: Tourism South East Research Unit 40 Chamberlayne Road Eastleigh Hampshire SO50 5JH
 The Economic Impact of Tourism on Calderdale 2015 Prepared by: Tourism South East Research Unit 40 Chamberlayne Road Eastleigh Hampshire SO50 5JH CONTENTS 1. Summary of Results 1 2. Table of Results Table
Travel Decision Survey Summary Report. San Francisco Municipal Transportation Agency (SFMTA)
") Note: The weighting used in this report is not consistent with Travel Decision Surveys (TDS) 2013 and 2014, and findings from this report should not be compared with findings from TDS 2013 and TDS 2014.
Note: The weighting used in this report is not consistent with Travel Decision Surveys (TDS) 2013 and 2014, and findings from this report should not be compared with findings from TDS 2013 and TDS 2014.
Department of Conservation National Survey Report 1: Quintessentially Kiwi
 Department of Conservation National Survey Report 1: Quintessentially Kiwi Survey conducted: June 2011 Reporting produced: September 2011 Contents 1.0 Methodology... 3 2.0 Findings... 5 2.1 Places... 5
The Economic Impact of Tourism Brighton & Hove Prepared by: Tourism South East Research Unit 40 Chamberlayne Road Eastleigh Hampshire SO50 5JH
 The Economic Impact of Tourism Brighton & Hove 2013 Prepared by: Tourism South East Research Unit 40 Chamberlayne Road Eastleigh Hampshire SO50 5JH CONTENTS 1. Summary of Results 1 1.1 Introduction 1 1.2
National Passenger Survey Spring putting rail passengers first
 National Passenger Survey Spring 2006 putting rail passengers first What is Passenger Focus? Passenger Focus is the independent national rail consumer watchdog. Our mission is to get the best deal for
The Economic Impact of Tourism on Scarborough District 2014
 The Economic Impact of Tourism on Scarborough District 2014 Prepared by: Tourism South East Research Unit 40 Chamberlayne Road Eastleigh Hampshire SO50 5JH CONTENTS 1. Summary of Results 1 2. Table of
National Rail Passenger Survey Autumn 2013 Main Report
 National Rail Passenger Survey Autumn 2013 Main Report What is Passenger Focus? Passenger Focus is the independent consumer watchdog for Britain s rail passengers and England s bus, coach and tram passengers
LOCAL AREA TOURISM IMPACT MODEL. Wandsworth borough report
 LOCAL AREA TOURISM IMPACT MODEL Wandsworth borough report London Development Agency May 2008 CONTENTS 1. Introduction... 3 2. Tourism in London and the UK: recent trends... 4 3. The LATI model: a brief
The tourism value of the natural environment and outdoor activities in
 The tourism value of the natural environment and outdoor activities in the South West Produced on behalf of the South West Coast Path Association By The South West Research Company Ltd January 2016 1 Contents
Royal Parks Stakeholder Research Programme 2014
 1 Royal Parks Stakeholder Research Programme 2014 Park profile: Greenwich Park (Waves 1-3) January 2015 Technical note 2 This slide deck presents findings from three waves of survey research conducted
South Australian Strategic Plan
 South Australian Strategic Plan Selected Targets Survey Results May 2008 Prepared for Department of the Premier and Cabinet, Government of South Australia Population Research and Outcome Studies Unit Health
Christmas - spending plans, religious significance and shifting summer holidays to February
 MEDIA RELEASE 10 December 2015 Christmas - spending plans, religious significance and shifting summer holidays to February The issue: Every year around this time we conduct a poll with New Zealanders on
PUBLIC OPPOSED TO GAMING S EXPANSION AND DIVIDED OVER REVENUE SHARING WITH AC
 For immediate release Wednesday, June 24 Contact: Krista Jenkins 973.443.8390; kjenkins@fdu.edu PUBLIC OPPOSED TO GAMING S EXPANSION AND DIVIDED OVER REVENUE SHARING WITH AC State leaders may be considering
SURVEY OF U3A MEMBERS (PART 1)
") SURVEY OF U3A MEMBERS (PART 1) Introduction To provide a satisfactory service to its member U3As, The Third Age Trust recognised that it needs to be aware of the diversity of individual U3A members and
SURVEY OF U3A MEMBERS (PART 1) Introduction To provide a satisfactory service to its member U3As, The Third Age Trust recognised that it needs to be aware of the diversity of individual U3A members and
PUBLIC OPINION IN KOSOVO BASELINE SURVEY RESULTS NOVEMBER, 2010
 PUBLIC OPINION IN KOSOVO BASELINE SURVEY RESULTS NOVEMBER, 2010 1 METHODOLOGY Quantitative research using face-to-face method within household Sample size n=1500 respondents age 18+ throughout Kosovo Stratified
CORNWALL VISITOR FREQUENCY SURVEY
 CORNWALL VISITOR FREQUENCY SURVEY Analysis and Report from PFA Research Ltd 2 nd December 2015 Authors: Robert Rush, Managing Director robert.rush@pfa-research.com Emma Lydon, Research & Marketing Consultant
Chinese New Zealanders Domestic Travel Survey 2018
 92.7% Of Chinese New Zealanders took at least one domestic holiday trip in the past 12 months Chinese New Zealanders Domestic Travel Survey 2018 February 2018 2019 will be the China-New Zealand Year of
REPORT. VisitEngland Business Confidence Monitor Wave 5 Autumn
 REPORT VisitEngland Business Confidence Monitor 2011 5-7 Museum Place Cardiff, Wales CF10 3BD Tel: ++44 (0)29 2030 3100 Fax: ++44 (0)29 2023 6556 www.strategic-marketing.co.uk Page 2 of 31 Contents Page
IPSOS / REUTERS POLL DATA Prepared by Ipsos Public Affairs
 Ipsos Poll Conducted for Reuters Airlines Poll 6.30.2017 These are findings from an Ipsos poll conducted June 22-29, 2017 on behalf Thomson Reuters. For the survey, a sample of roughly 2,316 adults age
Commuting patterns in Wellington
 Commuting patterns in Wellington Highlights In 2006, 1 of 10 employed people in New Zealand worked in one of the four cities of the Wellington region (Porirua, Upper Hutt, Lower Hutt, and Wellington),
National Rail Passenger Survey Autumn 2015 Main Report
 National Rail Passenger Survey Autumn 2015 Main Report Transport Focus is the independent transport user watchdog Our mission is to get the best deal for passengers and road users. With a strong emphasis
The Essential Report. 25 February MELBOURNE SYDNEY BRISBANE ADELAIDE BRUSSELS
 The Essential Report 25 February 2014 MELBOURNE SYDNEY BRISBANE ADELAIDE BRUSSELS www.essentialresearch.com.au The Essential Report Date: 25 February 2014 Prepared by: Essential Research Data supplied:
National Passenger Survey Autumn putting rail passengers first
 National Passenger Survey Autumn putting rail passengers first What is Passenger Focus? Passenger Focus is the independent national rail consumer watchdog. Our mission is to get the best deal for Britain
CEREDIGION VISITOR SURVEY 2011 TOTAL SAMPLE. November 2011
 CEREDIGION VISITOR SURVEY 2011 TOTAL SAMPLE November 2011 TERMS OF CONTRACT Unless otherwise agreed, the findings of this study remain the copyright of Beaufort Research Ltd and may not be quoted, published
NAPA VALLEY VISITOR INDUSTRY 2012 Economic Impact Report
 Join Visit Napa Valley NAPA VALLEY VISITOR INDUSTRY 2012 Economic Impact Report Research prepared for Visit Napa Valley by Destination Analysts, Inc. Table of Contents SECTION 1 Introduction 2 SECTION
Survey of Long Beach Voters
 Final Report Survey of Long Beach Voters Conducted for: May, 00 0 Stone Pine Road 9 South Market Street, Suite 00 South Figueroa Street, 00 0 Grand Avenue, Suite G Half Moon Bay CA 9099 San Jose CA 90
Recreationists on the Gifford Pinchot National Forest: A Survey of User Characteristics, Behaviors, and Attitudes
 Recreationists on the Gifford Pinchot National Forest: A Survey of User Characteristics, Behaviors, and Attitudes by Alan R. Graefe The Pennsylvania State University Robert C. Burns University of Florida
The Economic Impact of Tourism West Oxfordshire Prepared by: Tourism South East Research Unit 40 Chamberlayne Road Eastleigh Hampshire SO50 5JH
 The Economic Impact of Tourism West Oxfordshire 2014 Prepared by: Tourism South East Research Unit 40 Chamberlayne Road Eastleigh Hampshire SO50 5JH CONTENTS 1. Summary of Results 1 1.1 Introduction 1
Benefits and costs of tourism for remote communities
 Benefits and costs of tourism for remote communities Case study for the Carpentaria Shire in north-west Queensland Chapter 2 1 THE CARPENTARIA SHIRE COMMUNITY AND TOURISM... 2 Plate 5: Matilda Highway
The Economic Impact of Tourism New Forest Prepared by: Tourism South East Research Unit 40 Chamberlayne Road Eastleigh Hampshire SO50 5JH
 The Economic Impact of Tourism New Forest 2008 Prepared by: Tourism South East Research Unit 40 Chamberlayne Road Eastleigh Hampshire SO50 5JH CONTENTS Glossary of terms 1 1. Summary of Results 4 2. Table
The Economic Impact of Tourism Eastbourne Prepared by: Tourism South East Research Unit 40 Chamberlayne Road Eastleigh Hampshire SO50 5JH
 The Economic Impact of Tourism Eastbourne 2016 Prepared by: Tourism South East Research Unit 40 Chamberlayne Road Eastleigh Hampshire SO50 5JH CONTENTS Page 1. Summary of Results 1 1.1 Introduction 1 1.2
Accommodation Survey: November 2009
 Embargoed until 10:45am 19 January 2010 Accommodation Survey: November 2009 Highlights Compared with November 2008: International guest nights were up 2 percent, while domestic guest nights were down 1
NAPA VALLEY VISITOR INDUSTRY 2016 Economic Impact Report
 NAPA VALLEY VISITOR INDUSTRY 2016 Economic Impact Report Research prepared for Visit Napa Valley by Destination Analysts, Inc. Table of Contents S E C T I O N 1 Introduction 2 S E C T I O N 2 Executive
Community Rail Partnership Action Plan The Bishop Line Survey of Rail Users and Non-Users August 2011 Report of Findings
 Community Rail Partnership Action Plan The Bishop Line Survey of Rail Users and Non-Users August 2011 Report of Findings Analysis and report NWA Social Research 1 Contents Page No. A. Summary of Main Findings...
The Economic Impact of Tourism on the District of Thanet 2011
 The Economic Impact of Tourism on the District of Thanet 2011 Prepared by: Tourism South East Research Unit 40 Chamberlayne Road Eastleigh Hampshire SO50 5JH CONTENTS 1. Summary of Results 1 2. Table of
Taking Part 2015/16: WEST MIDLANDS
 Taking Part 2015/16: WEST MIDLANDS 1 This report provides an overview of the arts and cultural engagement of adults living in the West Midlands. Data is taken from the Taking Part Survey 2015/16 and makes
Analysing the performance of New Zealand universities in the 2010 Academic Ranking of World Universities. Tertiary education occasional paper 2010/07
 Analysing the performance of New Zealand universities in the 2010 Academic Ranking of World Universities Tertiary education occasional paper 2010/07 The Tertiary Education Occasional Papers provide short
MELBOURNE S WEST TOURISM RESEARCH
 MELBOURNE S WEST TOURISM RESEARCH COLLATION OF TOURISM RESEARCH AUSTRALIA DATA MAY 2017 WESTERN MELBOURNE TOURISM Urban Enterprise Urban Planning / Land Economics / Tourism Planning / Industry Software
2015 IRVING HOTEL GUEST SURVEY Final Project Report
 2015 IRVING HOTEL GUEST SURVEY Final Project Report Research prepared for the Irving Convention & Visitors Bureau by Destination Analysts, Inc. Table of Contents S E C T I O N 1 Introduction 2 S E C T
REPORT. VisitEngland 2010 Business Confidence Monitor. Wave 1 New Year
 REPORT VisitEngland Wave 1 New Year 5-7 Museum Place Cardiff, Wales CF10 3BD Tel: ++44 (0)29 2030 3100 Fax: ++44 (0)29 2023 6556 www.strategic-marketing.co.uk Contents Page 1. Headline Findings... 3 2.
Self Catering Holidays in England Economic Impact 2015
 Self Catering Holidays in England Economic Impact 2015 An overview of the economic impact of self catering holidays in England Published by The South West Research Company Ltd March 2017 Contents Page
NAPA VALLEY VISITOR INDUSTRY 2014 Economic Impact Report
 NAPA VALLEY VISITOR INDUSTRY 2014 Economic Impact Report Research prepared for Visit Napa Valley by Destination Analysts, Inc. Table of Contents SECTION 1 Introduction 2 SECTION 2 Executive Summary 5 SECTION
National Passenger Survey Autumn putting rail passengers first
 National Passenger Survey Autumn 2005 putting rail passengers first What is Passenger Focus? Passenger Focus is the independent national rail consumer watchdog. Our mission is to get the best deal for
A TYPOLOGY OF CULTURAL HERITAGE ATTRACTION VISITORS
 University of Massachusetts Amherst ScholarWorks@UMass Amherst Tourism Travel and Research Association: Advancing Tourism Research Globally 2007 ttra International Conference A TYPOLOGY OF CULTURAL HERITAGE
2015 Travel Survey. for the States of Guernsey Commerce & Employment Department RESEARCH REPORT ON Q1 2015
 215 Travel Survey for the States of Guernsey Commerce & Employment Department RESEARCH REPORT ON Q1 215 April 28 th 215 Table of Contents Page No. Summary of Results 1 Survey Results 2 Breakdown of departing
The Future of Street Lighting in Leeds November 2017 to January 2018 Public Consultation Document
 The Future of Street Lighting in Leeds November 2017 to January 2018 Public Consultation Document Should we turn off more street lights between midnight and 5:30 am? If so, how should we decide which ones
Salt Lake Downtown Alliance. June 2018
 Salt Lake Downtown Alliance June 2018 2 SURVEY DETAILS Short telephone survey updating previous benchmark data around key topics 609 respondents ±4% margin of error Trending is provided for all questions
2017 Citizen Satisfaction Survey
 2017 Citizen Satisfaction Survey CITY OF BRAMPTON TOPLINE SUMMARY SEPTEMBER 14, 2017 CITY OF BRAMPTON 2017 CITIZEN SATISFACTION SURVEY REPORT INTRODUCTION AND METHODOLOGY The City of Brampton commissioned
Division of Governmental Studies and Services. Final Report. Washington State Outdoor Recreation Survey Report
 D 1 Appendix D: Survey Analysis Division of Governmental Studies and Services Final Report November 29, 2017 Washington State Outdoor Recreation Survey Report Report Authors: Christina Sanders, Acting
Chapter 1: The Population of NHS Greater Glasgow and Clyde
 Population Estimate (thousands) Chapter 1: The Population of NHS Greater Glasgow and Clyde Population Trends and Projections National Records of Scotland estimated (NRS SAPE) 1 the 2013 NHS Greater Glasgow
COMMUNITY BASED TOURISM DEVELOPMENT (A Case Study of Sikkim)
") COMMUNITY BASED TOURISM DEVELOPMENT (A Case Study of Sikkim) SUMMARY BY RINZING LAMA UNDER THE SUPERVISION OF PROFESSOR MANJULA CHAUDHARY DEPARTMENT OF TOURISM AND HOTEL MANAGEMENT KURUKSHETRA UNIVERSITY,
COMMUNITY BASED TOURISM DEVELOPMENT (A Case Study of Sikkim) SUMMARY BY RINZING LAMA UNDER THE SUPERVISION OF PROFESSOR MANJULA CHAUDHARY DEPARTMENT OF TOURISM AND HOTEL MANAGEMENT KURUKSHETRA UNIVERSITY,
Methodology and coverage of the survey. Background
 Methodology and coverage of the survey Background The International Passenger Survey (IPS) is a large multi-purpose survey that collects information from passengers as they enter or leave the United Kingdom.
The Role of Online in Travel Purchases. Hungary
 The Role of Online in Travel Purchases Hungary Methodology Vertical Deep Dive Travel Hungary Target group: Internet user in Hungary, 18 years and older Sample: n=1,000 Internet users Methodology: Online
Estimating Tourism Expenditures for the Burlington Waterfront Path and the Island Line Trail
 A report by the University of Vermont Transportation Research Center Estimating Tourism Expenditures for the Burlington Waterfront Path and the Island Line Trail Report # 10-003 February 2010 Estimating
HEATHROW COMMUNITY NOISE FORUM
 HEATHROW COMMUNITY NOISE FORUM 3Villages flight path analysis report January 216 1 Contents 1. Executive summary 2. Introduction 3. Evolution of traffic from 25 to 215 4. Easterly departures 5. Westerly
CONGESTION MONITORING THE NEW ZEALAND EXPERIENCE. By Mike Curran, Manager Strategic Policy, Transit New Zealand
 CONGESTION MONITORING THE NEW ZEALAND EXPERIENCE 26 th Australasian Transport Research Forum Wellington New Zealand 1-3 October 2003 By, Manager Strategic Policy, Transit New Zealand Abstract New Zealand
The Economic Impact of Tourism West Oxfordshire Prepared by: Tourism South East Research Unit 40 Chamberlayne Road Eastleigh Hampshire SO50 5JH
 The Economic Impact of Tourism West Oxfordshire 2010 Prepared by: Tourism South East Research Unit 40 Chamberlayne Road Eastleigh Hampshire SO50 5JH CONTENTS Summary of Results 1 1.1 Introduction 1 1.2
Regional Differences in International Airline Operating Economics: 2008 and 2009
 Cir 332 AT/191 Regional Differences in International Airline Operating Economics: 2008 and 2009 Approved by the Secretary General and published under his authority International Civil Aviation Organization
Irish Fair of Minnesota: 2017 Attendee Profile
 TOURISM CENTER Irish Fair of Minnesota: 2017 Attendee Profile Authored by Xinyi Qian, Ph.D. Irish Fair of Minnesota: 2017 Attendee Profile November 13, 2017 Authored by Xinyi (Lisa) Qian, Ph.D., University
Institute of Transport and Logistics Studies Interfleet Transport Opinion Survey (TOPS) Quarter 3, September 2011
 Quarter 3, September 2011") Institute of Transport and Logistics Studies Interfleet Transport Opinion Survey (TOPS) Quarter 3, September 2011 Transport stable as highest priority issue Highlights In the September 2011 quarter, 8%
Institute of Transport and Logistics Studies Interfleet Transport Opinion Survey (TOPS) Quarter 3, September 2011 Transport stable as highest priority issue Highlights In the September 2011 quarter, 8%
Official Journal of the European Union L 7/3
 12.1.2010 Official Journal of the European Union L 7/3 COMMISSION REGULATION (EU) No 18/2010 of 8 January 2010 amending Regulation (EC) No 300/2008 of the European Parliament and of the Council as far
Cairngorms National Park Visitor Survey 2009/2010 Summary
 Cairngorms National Park Visitor Survey 2009/2010 Summary Published by Cairngorms National Park Authority Cairngorms National Park Visitor Survey 2009/2010 Summary Please contact the Cairngorms National
RECOMMENDED CITATION: Pew Research Center, January, 2015, Most Support Stronger U.S. Ties With Cuba
 NUMBERS, FACTS AND TRENDS SHAPING THE WORLD FOR RELEASE JANUARY 16, 2015 FOR FURTHER INFORMATION ON THIS REPORT: Carroll Doherty, Director of Political Research Jocelyn Kiley, Associate Director, Research
Florida Voters Consider Manatee Protection
 RESEARCH AND COMMUNICATIONS Florida Voters Consider Manatee Protection March 2001 Introduction As the Florida Fish and Wildlife Conservation Commission considers new rules and regulations aimed at protecting
Convention Centre Proposal. Have your say before we make a final decision later this year.
 Convention Centre Proposal Have your say before we make a final decision later this year. Conventions are important to cities because of the economic benefits they bring. Page 2 CONTENTS Introduction...3
JATA Market Research Study Passenger Survey Results
 JATA Market Research Study Passenger Survey Results Prepared for the Jackson Area Transportation Authority (JATA) April, 2015 3131 South Dixie Hwy. Suite 545 Dayton, OH 45439 937.299.5007 www.rlsandassoc.com
Christmas - spending plans, religious significance and shifting summer holidays to February
 MEDIA RELEASE 19 December 2016 Christmas - spending plans, religious significance and shifting summer holidays to February The issue: Every year around this time we conduct a poll with New Zealanders on
Americans Favor New Approach to Cuba: Lift the Travel Ban, Establish Diplomatic Relations
 Americans Favor New Approach to Cuba: Lift the Travel Ban, Establish Diplomatic Relations April 14, 2009 Audio of the 4/15/09 event at the Inter-American Dialogue Questionnaire/Methodology (PDF) Full PDF
Mood of the Nation New Zealanders' perceptions of international visitors. March 2018
 Mood of the Nation New Zealanders' perceptions of international visitors March 2018 Contents 1 Background and approach 3 2 Key insights 6 3 Detailed insights 10 4 Appendix: measures by region 31 2 1 Background
Tourism Barometer April 2013
 Tourism Barometer April 2013 Contents Page 1. Headline Findings... 2 2. Qualitative Findings... 4 3. Visitor Volumes in 2013... 5 4. Profitability... 13 5. Average Room Yield... 14 6. Ireland Market (Hotels)...
International Passenger Survey (IPS) Methodology. May 2017
 Methodology. May 2017") International Passenger Survey (IPS) Methodology May 2017 1 Contents Introduction IPS and VisitBritain Key concepts and definitions Sampling approach Collection of IPS data Producing national estimates
International Passenger Survey (IPS) Methodology May 2017 1 Contents Introduction IPS and VisitBritain Key concepts and definitions Sampling approach Collection of IPS data Producing national estimates
The Value of Activities for Tourism
 The Value of Activities for Tourism Introduction The measurement of activities undertaken during tourism trips is an important element of all the three main tourism monitors the GBTS (domestic overnight),
Non-Motorized Outdoor Recreation in British Columbia in 2012: Participation and Economic Contributions
 Non-Motorized Outdoor Recreation in British Columbia in 2012: Participation and Economic Stephen Kux Wolfgang Haider School of Resource and Environmental Management Simon Fraser University Burnaby, British
Inverness, Culloden and Suburbs Settlement Economic Overview
 Strategic planning and research Economic information December 2007 Inverness, Culloden and Suburbs Settlement Economic Overview Summary Between 2001 and 2006, the population of Inverness, Culloden and
Seattle Southside Digital Media Conversion Study. Prepared by
 Seattle Southside Digital Media Conversion Study Prepared by Project Overview PURPOSE The purpose of the Seattle Southside Visitor Services Digital Media Conversion Study was to measure the conversion
Travel and Tourism in Ukraine: Key Trends and Opportunities to 2016
 Travel and Tourism in Ukraine: Key Trends and Opportunities to 2016 Reference code: TT0037MR_SP Published: July 2012 www.timetric.com Timetric John Carpenter House 7 Carmelite Street London EC4Y 0BS United
2013 Travel Survey. for the States of Guernsey Commerce & Employment Department RESEARCH REPORT ON Q1 2013
 213 Travel Survey for the States of Guernsey Commerce & Employment Department RESEARCH REPORT ON Q1 213 May 21st 213 Table of Contents Page No. Summary of Results 1 Survey Results 2 Breakdown of departing
Performance monitoring report for 2014/15
 Performance monitoring report for 20/15 Date of issue: August 2015 Gatwick Airport Limited Summary Gatwick Airport is performing well for passengers and airlines, and in many aspects is ahead of the performance
ISE INDUSTRY FORUM CSISG 2018 Q2 RESULTS Announcement INSTITUTE OF SERVICE EXCELLENCE SINGAPORE MANAGEMENT UNIVERSITY
 ISE INDUSTRY FORUM CSISG 2018 Q2 RESULTS Announcement INSTITUTE OF SERVICE EXCELLENCE SINGAPORE MANAGEMENT UNIVERSITY CSISG 2018 Q2 RESULTS LAND TRANSPORT & AIR TRANSPORT INSTITUTE OF SERVICE EXCELLENCE
HOUSEHOLD TRAVEL SURVEY
 HOUSEHOLD TRAVEL SURVEY Household Travel Survey i TABLE OF CONTENTS Page 1.0 INTRODUCTION... 1 2.0 SUMMARY OF TRAVEL... 2 2.1 All-Day Travel Patterns... 2 2.1.1 Automobile Availability... 2 2.1.2 Trip
Living on the edge: The impact of travel costs on low paid workers living in outer London executive summary. living on the edge 1
 Living on the edge: The impact travel costs on low paid workers living in outer London executive summary living on the edge 1 introduction key findings London has a world-class public transport system
Tram Passenger Survey
 Key findings Autumn 2015 Foreword Jeff Halliwell Now in its third year, our Tram Passenger Survey has covered passengers views of their journey in six network areas in Britain. For the second time this
Gwynedd and Anglesey Housing and the Welsh Language Survey
 Gwynedd and Anglesey Housing and the Welsh Language Survey Executive summary and main conclusions July 2014 Produced by the Research and Analytics Service, Gwynedd Council research@gwynedd.gov.uk Research