Tasmanian Midlands Socio-Economic Profile
|
|
|
- Philippa Stanley
- 5 years ago
- Views:
Transcription


1 Tasmanian Midlands Socio-Economic Profile Report by: Samantha Gadsby1, Michael Lockwood1, Susan Moore2 and Allan Curtis3 1. University of Tasmania 2. Murdoch University 3. Charles Sturt University June 2013
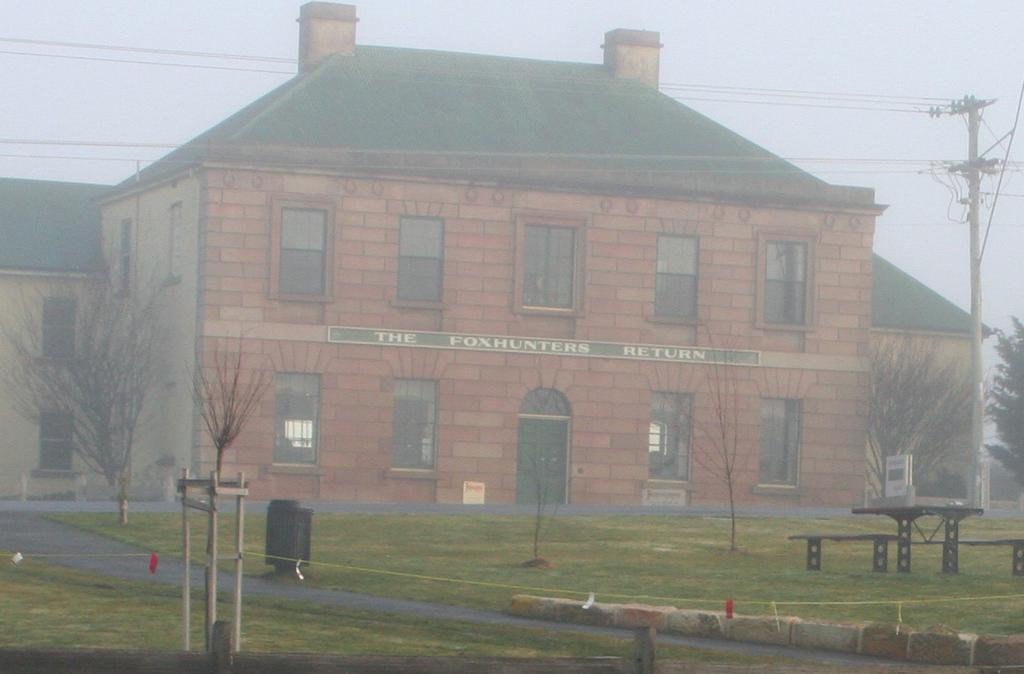
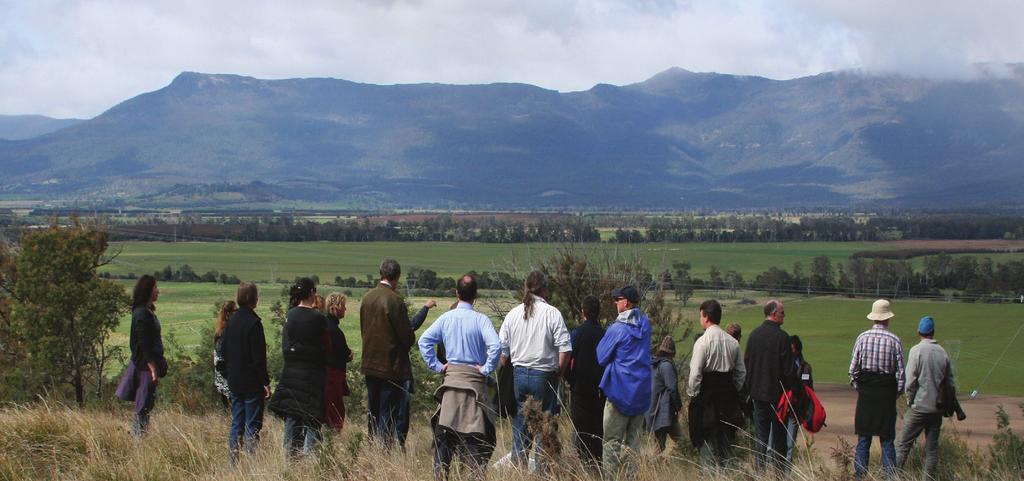
2 Tasmanian Midlands Socio-Economic Profile ISBN: Hub Publication Reference: LaP2013/ Enquiries to: University of Tasmania This work is copyright. It may be produced in whole or in part for study or training purposes subject to the inclusion of an acknowledgement of the source. It is not intended for commercial sale or use. Reproduction for other purposes other than those listed above requires the written permission from the authors. Requests and enquiries concerning reproduction rights should be addressed to: Communications Manager Landscapes and Policy Hub Private Bag 141, Hobart Tasmania 7001 Tel: Landscapes.Policy@utas.edu.au Purpose of Report The purpose of the report is to bring together secondary data on the social characteristics of the Tasmanian Midlands. It provides a social profile that will inform the identification of potential futures for the region and help shape options for institutional, planning and management arrangements directed towards improving biodiversity outcomes. The information presented is primarily drawn from the Australian Bureau of Statistics (ABS) Censuses of Housing (2001, 2006, 2011). The report was produced by the Social and Institutional Futures Team and is an output of the Landscapes and Policy Research Hub. Please cite the report as follows: Gadsby S, Lockwood M, Moore SA & Curtis A (2013) Tasmanian Midlands Socio-Economic Profile, University of Tasmania, Hobart, Tasmania. About the Authors Samantha Gadsby completed her masters studies in 2012 in the School of Geography and Environmental Studies at the University of Tasmania. Dr Michael Lockwood is an environmental social scientist at the University of Tasmania. Associate Professor Susan Moore is a researcher in the environmental and conservation sciences at Murdoch University, WA. Professor Allan Curtis is the Professor of Integrated Environmental Management at the Institute for Land, Water and Society, Charles Sturt University. Acknowledgements Many thanks to Suzie Gaynor, Communications Manager, for preparing this report for publishing. The report is an output from the Landscapes and Policy Research Hub. The hub is supported through funding from the Australian Government s National Environmental Research Program and involves researchers from the University of Tasmania (UTAS), The Australian National University (ANU), Murdoch University, the Antarctic Climate and Ecosystems Cooperative Research Centre (ACE CRC), Griffith University and Charles Sturt University (CSU). Photo Credits: Michael Lockwood (front cover image, left) and Suzie Gaynor (all others)
3 Contents Frequently Used Abbreviations...2 Executive Summary Introduction Background and purpose Spatial delineation of the study region Approach Population Age structure Sex ratio Number of youth Indigenous population Number, age and mobility of farmers/farm managers Education Persons with post-school qualifications Farmers/farm managers with post-school qualifications Health Cultural diversity Work force Labour force participation rate Unemployment rate Youth unemployment rate Employment in the agriculture, fisheries and forestry sector Persons volunteering in last 12 months Average annual taxable income Agricultural holdings Physical infrastructure Building approvals per 1,000 persons Home ownership Persons using Internet at home Socio-economic disadvantage Low-income households Housing stress Index of relative socio-economic disadvantage Implications for biodiversity conservation References Appendix 1 Profile variable description Appendix 2 SA1 data tables Table A2.1 Population, 2011 census Table A2.2 Education, 2011 census Table A2.3 Work force, 2001 census Table A2.4 Physical infrastructure, 2011 census Table A2.5 Low-income households, 2011 census Page 1
4 Frequently Used Abbreviations ABS AFF AFS CD DSEWPaC EPBC Act FFM IRSD LGA LOTE MNES NERP OEH PHIDU SA1 SLA UCL Australian Bureau of Statistics Agriculture, Fisheries and Forestry (sector) Accommodation, Food and Service (sector) Collection District Department of Sustainability, Environment, Water, Communities Environment Protection and Biodiversity Conservation Act 1999 (Cwlth) Farmers/Farm Managers (sector) Index of Relative Socio-Economic Disadvantage Local Government Area Language other than English Matters of National Environmental Significance National Environmental Research Program Office of Environment and Heritage (NSW) Public Health Information Development Unit Statistical Area Level 1 Division Statistical Local Area Urban Centre Locality Page 2
5 Executive Summary The Landscapes and Policy Hub, established under the Australian Government s National Environmental Research Program, is researching tools, techniques and policy options for landscape-scale biodiversity conservation. This research effort focuses on two contrasting study areas the Australian Alps, a largely publicly owned series of mountain protected areas; and the Tasmanian Midlands, largely privately owned lowlands primarily managed for agriculture. For the Tasmanian Midlands Study Area, the hub s Social and Institutional Futures Project is investigating the social and institutional elements of these landscapes, with a particular focus on the threatened native grasslands that are scattered throughout the region. This report brings together secondary data on the socio-economic characteristics of the Tasmanian Midlands. It provides a socio-economic profile that will be used to inform identification of potential futures for the region and help shape options for institutional, planning and management arrangements directed towards improving biodiversity outcomes. The themes and variables selected for this profile were based on work conducted in the Murrumbidgee Valley by the Bureau of Rural Sciences (Curtis et al. 2003a), as well as reports on social and economic aspects of natural resource management by Webb et al. (2004) and ABS (2004). The information presented is primarily drawn from the Australian Bureau of Statistics 2001, 2006 and 2011 Censuses of Housing. Where available, descriptions of trends over the ten-year period from 2001 to 2011 are provided. For the purposes of this report, the Tasmanian Midlands is delineated by 15 Statistical Area Level 1 Divisions (SA1) that cover most of the Northern Midlands Local Government Area (LGA) and the northern part of the Southern Midlands Local Government Area. A Statistical Area Level 1 Division is the smallest geographic area defined in the Australian Statistical Geography Standard for which data are readily publically available. Where data are not available for the Statistical Area Level 1 Division, Statistical Local Area (SLA) data for the Northern Midlands Statistical Local Area were used. Previous censuses in 2001 and 2006 used Collection Districts (CD) rather than Statistical Area Level 1 Divisions. When examining trends between 2001 and 2011, the 22 collection districts that covered a similar region to the 15 Statistical Area Level 1 Divisions were used for comparisons over this period. Other data sources were the Public Health Information Development Unit Social Health Atlas of Australia (2012) and the Australian Bureau of Statistics Agricultural Census. The following analysis addresses aspects of human and human-produced economic capital. An absence of suitable information on social capital has been addressed by including a section on social disadvantage, based on the interpretation that such measures of disadvantage are a reflection of a lack of social capital. A summary socio-economic profile of the Tasmanian Midlands Study Region is given in Table 1. In 2011, approximately 4,709 people lived within the Tasmanian Midlands. The median age of the Tasmanian Midlands population was 42 years, having risen by 3 years since 2001, with this median being 2 years higher than for the state. Over the same period, the Tasmanian Midlands population decreased by 1.2% per year, whereas the population for Tasmania for the same period experienced an annual increase of 0.7%. This decline was mainly evident in the region s rural areas most urban centres had stagnant populations. The youth population decreased by 7.1%. A smaller proportion of the Tasmanian Midlands population has a post-school qualification (25.7%) relative to the Tasmanian population (33.0%). Page 3
6 As the Tasmanian Midlands has lower labour force participation rates than the state as whole (53.2% and 58.5% respectively), the region s unemployment rates are lower. The Tasmanian Midlands unemployment rate of 4.8% is lower than the state rate of 6.4%. The youth unemployment rate is also lower: 9.7% for the Tasmanian Midlands versus 13.7% for Tasmania. The percentage of the Tasmanian Midlands population participating in voluntary work over the last 12 months was almost double that for Tasmania (17.6% compared with 9.7%). A total of 30.0% of the study region s population is employed in the agriculture, fisheries and forestry sector, with two-thirds of the population in two of the Statistical Area Level 1 Divisions (Ross Surrounds and South East) employed in this sector. In 2011, 6.9% of the Tasmanian Midland s population (326 people) identified themselves as being a farmer or farm manager. There are 179 agricultural businesses in the Northern Midlands Statistical Local Area, with 41.9% of these (75 businesses) having set aside some lands for conservation, with on average 294 ha set aside per business. Data are only available at the statistical local area level, as such we were not able to identify the number of businesses in the four Statistical Area Level 1 Divisions located in the Southern Midlands Statistical Local Area. The Tasmanian Midlands farmer/farm manager population declined by 23.5%, between 2006 and 2011, which was much higher than for the state as a whole, where the decline was 8.1%. Farming properties in the Tasmanian Midlands are much larger, with an average size of 1,750.4 ha, than the state average of ha. A higher percentage of farmers and farm managers in the Tasmanian Midlands relative to Tasmanian farmers in general, have a post-school qualification: 45.7 versus 40.8%. Internet use by these farmers is also higher that for the state as a whole (63% compared with 59%). Regarding social disadvantage, the percentage of low-income households in the Tasmanian Midlands (8.0%) is much higher than for Tasmania (1.0%). A higher percentage of the Tasmanian Midlands low-income households relative to Tasmanian low-income households were experiencing mortgage stress (11.9% compared with 8.1%), while a lower percentage of these households relative to Tasmanian low-income households experienced rental stress (18.5% compared with 28.9%). The index of relative socio-economic disadvantage for the Northern Midlands Statistical Local Area is 956, where scores above 1,000 indicate relative advantage and those below relative disadvantage. The index for the Southern Midlands is 940, but a substantial proportion of this statistical local area is outside our study region. The index for Tasmania is 961, so the Northern Midlands is less advantaged than Tasmania as a whole. Page 4
7 We consider these profiling details to have the following implications for biodiversity conservation in the Tasmanian Midlands, with an emphasis on conserving native grasslands on private lands used for agriculture. 1. The Tasmanian Midlands, and Tasmania as a whole, are economically disadvantaged compared with the Australian average, which limits capacity of the state to carry all the costs of providing public good benefits associated with conserving native grasslands on private lands. An active role for the Australian Government, on behalf of the Australian people, alone or in partnership with philanthropic and non-government organisations, may therefore be warranted to protect an ecosystem of national significance. 2. The relatively small number of agricultural businesses in the Tasmanian Midlands, and the smaller sub-set again who have native grasslands on their properties, makes it practical and feasible to provide individualised, targeted assistance to individual landholders for grassland protection and management activities. 3. Agriculture is part of the character and identity of the Tasmanian Midlands. As such, conservation activities that can be co-produced with agricultural pursuits will have greater chance of success than ventures that focus on biodiversity alone. Declining numbers of farmers and farm managers is a cause for concern in terms of loss of local knowledge and land management capacity. 4. Although the Tasmanian Midlands is economically disadvantaged, it has strong social capital in the form of volunteering. Such volunteering efforts, currently at almost twice the state average, suggest the potential for continued and enhanced contributions to protecting these grasslands, in partnership with private landholders. 5. Relative to other farmers in Tasmania, Midlands farmers are better educated and more of them use the internet. Both features may result in them being very amenable to innovation, potentially assisted by web-based delivery. Page 5
8 Variable Table 1 Tasmanian Midlands at a Glance Page 6 Unit Tasmanian Midlands Range across Midlands SA1s Tasmania Population Total population no. 4, to ,029 Average annual population growth rate % na 0.7 Population median age years to Change in median age years 3 na 4 Population sex ratio (males to females) % to Young persons (15-24 years of age) % to Percentage change in number of young persons % -7.1 na 2.8 Indigenous people as proportion of total population % to Percentage of farmers/farm managers % to Percentage change in number of farmers % na -8.1 Farmers/farm managers median age years to Change in farmers/farm managers median age years 7 na 2 Farmers/farm managers with different address 5 years ago % to Farmers/farm managers using Internet % 63 2 na 59 Education Persons with a post-school qualification % to Farmers/farm managers with a post-school qualification % to Health Indirect standardised death rate (a) x 1, na 6.6 Cultural diversity Persons who speak a LOTE at home % to Work force Labour force participation rate % to Unemployment rate % to Youth (15-24 years of age) unemployment rate % to Persons employed in agriculture, fisheries, forestry sector in 2011 % to Changed employment agriculture, fisheries, forestry (AFF) % -4.1 na -2.0 Males employed in AFF sector in 2011 % to Females employed in AFF sector in 2011 % to Volunteerism (participated in voluntary work in last 12 months) % to Income Annual average taxable income (b) $ 46,507 3 na 49,388 Agricultural holdings Agricultural area of holding average per business (c) ha 1, na Physical infrastructure Building approvals per 1,000 population (b) x 1, na 6.3 Home ownership % to Internet access % to Socio-economic disadvantage Low-income households % to Low-income households with mortgage stress (d) % 11.9 na 8.1 Low-income households with rental stress (d) % 18.5 na 28.9 Index of relative socio-economic disadvantage (e) score na Sources: 2001, 2006 and 2011 Censuses of Housing (ABS 2012), except: (a) ABS Deaths, Australia (ABS 2011a) (b) National Regional Profile (ABS 2011b) (c) ABS Agricultural Census (ABS 2011c) (d) PHIDU 2012 (e) PHIDU 2006 na = Not applicable/not available LOTE: Language other than English 1 Data not available at SA1 level for 2001 and 2006 so Collection Districts are used for comparisons between 2001 and Data not available at SA1 level, so only for the Northern Statistical Division. 3 Data not available at SA1 level, so only for the Northern Midlands SLA.
9 1. Introduction 1.1. Background and purpose The Landscapes and Policy Hub established under the Australian Government s National Environmental Research Program (NERP), is one of five multi-institutional research hubs established to provide robust science that is essential for managing the sustainability of Australia s environment (DSEWPAC 2011). The hub comprises a team of researchers from the University of Tasmania, the Antarctic Climate & Ecosystems Cooperative Research Centre, Australian National University, Murdoch University, Griffith University and Charles Sturt University. The aim of the hub is to develop tools, techniques and policy options that enable biodiversity to be considered at landscape scale. The hub is focusing on two study areas: the Tasmanian Midlands and the Australian Alps. The Tasmanian Midlands is one of the oldest grazed regions in Australia, with a traditional wool growing region that dates back to the 1820s (Fulton 2000), and is predominately private land. Wool continues to be the largest enterprise in the region (Mooney et al. 2010), however production has diversified to include crops such as peas, cereal, potato and poppies. Expanded irrigation schemes will likely lead to an extension of irrigated agriculture across the region. The land use history of the region has resulted in a number of conservation issues including fragmentation of remnant vegetation, rural tree decline and degradation of native grassland (Mooney et al. 2010). This report contributes to the Landscapes and Policy Hub by providing a socio-economic profile for areas encompassing the Tasmanian Midlands. The hub s Social and Institutional Futures Project is investigating the social and institutional elements of these landscapes, with a particular focus on the lowland native grasslands scattered through the region. Lowland native grasslands are the most depleted vegetation formation in Tasmania and are listed as critically endangered under the Environment Protection and Biodiversity Conservation Act 1999 (Cwlth). Much of the native grassland cover has been lost since European settlement, with remnants persisting as small fragments that provide vital habitat for a wide range of flora and fauna, including four plant species and at least 11 invertebrate species endemic to the region (Gouldthorpe & Gilfedder 2002). While there are small remnants on roadsides, in local reserves and in some cemeteries, the majority of the ecological community is on private property, making the conservation activities and commitment of private landholders essential for its survival. This profile is provided to help identify potential futures for the Tasmanian Midlands and shape options for institutional, planning and management arrangements directed towards improving biodiversity outcomes. Page 7
 and the northern part of the Southern Midlands LGA (Figure 1).")
10 1.2 Spatial delineation of the study region For the purposes of this report, the Tasmanian Midlands is delineated by 15 Statistical Area Level 1 Divisions (SA1) that cover most of the Northern Midlands Local Government Area (LGA) and the northern part of the Southern Midlands LGA (Figure 1). A SA1 is the smallest geographic area defined in the Australian Statistical Geography Standard for which data are readily publically available. Where data are not available for the SA1 level, Statistical Local Area (SLA) data for the Northern Midlands SLA were used. The SA1 codes and associated names are given in Table 2 (the SA1 names being our descriptive labels). The ABS has recently replaced their geographical framework, the Australian Standard Geographical Classification (ASGC), with the Australian Statistical Geographical Standard (ASGS). Statistical boundaries have been replaced by new units and this influences comparisons made between 2011 and prior years. Census data for 2011 are provided at the SA1 scale while the 2006 and 2001 census data is provided at the former Collection District (CD) scale. This caused some minor differences in the geographic areas used to compare across censuses. These differences were of such small magnitude that they did not affect the findings in this report , Cressy , Campbell Town Ross , Oatlands Figure 1 Tasmanian Midlands Study Area depicting the 11 SA1s in the Northern Midlands SLA and 4 SA1s in the Southern Midlands SLA Page 8
11 Table 2 SLAs and SA1 codes and names that define our Tasmanian Midlands Study Area SLA Name SA1 Code SA1 Name Northern Midlands Pt B Campbell Town A Northern Midlands Pt B Campbell Town B Northern Midlands Pt B Ross Northern Midlands Pt B Campbell Town Surrounds Northern Midlands Pt B Cressy A Northern Midlands Pt B North West Northern Midlands Pt B Ross Surrounds Northern Midlands Pt B Cressy Surrounds Northern Midlands Pt B Cressy B Northern Midlands Pt B North East Northern Midlands Pt B North Southern Midlands Oatlands Surrounds Southern Midlands South East Southern Midlands Oatlands A Southern Midlands Oatlands B 1.3 Approach The use of socio-economic data in environmental decision-making is identified by the ABS (2004) as playing an important role in: providing context to regional planning through enhanced understanding of baseline social conditions and processes which impact upon a region s capacity for environmental action; enhancing understanding of the social impacts of particular interventions, noting that impacts can be positive or negative and unevenly distributed in a community; contributing to the monitoring and evaluation of the effectiveness of environmental interventions; and informing the assumptions which underpin major policy initiatives, particularly in relation to the decision making behaviour of individuals, families and firms. Socio-economic data can be categorised into three types of capital (capacity): human capital, human-produced economic capital, and social and institutional capital (Webb et al. 2004). Human capital refers to the knowledge, skills and general ability of individuals through their leadership and problem solving, to contribute to the life of their community (Cocklin & Alston 2003). With respect to land management, human capital is important at several scales from individuals to regional communities. At the regional scale, the diversity of skills and abilities across the entire community will influence the community s capacity to adapt to change (Webb et al. 2004). Human capital also influences the likelihood and quality of stakeholder participation in environmental decision-making processes (Pretty 2003, Moore et al. 2006). Human-produced economic capital is generated via economic activity through human ingenuity and technological change. It refers to commodities brought into existence through human endeavour (Webb et al. 2004). Included are products that have been harvested or manufactured, the built environment (including dwellings, other buildings, Page 9
.")

12 roads, railways and bridges) and financial resources (Curtis et al. 2003a). Cultural and intellectual property are also forms of produced economic capital (Webb & Curtis 2002). This form of capital is a fundamental contributor to the well-being and capacity of regional communities (Webb et al. 2004). In this report, based on the available data, the socio-economic profile for the Tasmanian Midlands addresses aspects of human and human-produced economic capital. An absence of suitable information on social capital has been addressed by including a section on social disadvantage, based on the interpretation that such measures of disadvantage are a reflection of a lack of social capital. A total of 31 variables were used to develop the socio-economic profile for the region (Appendix 1). The choice of variables was informed by work conducted in the Murrumbidgee Valley by the Bureau of Rural Sciences (Curtis et al. 2003a), and reports on social and economic aspects of natural resource management by Webb et al. (2004) and ABS (2004). The secondary data sources used to construct the profile include the Australian Bureau of Statistics (ABS) 2001, 2006 and 2011 Population and Housing Census data (where available) at SA1 and CD geographies (ABS 2012). Other data sources were the Public Health Information Development Unit Social Health Atlas of Australia (PHIDU 2012) and the ABS Agricultural Census (2011c). Where possible, SA1 and CD scales were used due to their ability to represent the local rural communities at a fine resolution and to enable the comparison between the town centres and neighbouring rural regions. 2. Population Population data by SLA1 are given in Appendix 2. In 2011, the Tasmanian Midlands total population was 4,709, which was less than 1% of the state s census population of 489,029. The areas of highest population were Cressy Surrounds (729), Campbell Town B (466) and North West (424). Areas of lowest population were North (77), Ross Surrounds (151) and Campbell Town Surrounds (216) (Figure 2). Figure 2 Distribution of population in Tasmanian Midlands, 2011 Page 10
13 Between 2001 and 2011, the population in the Tasmanian Midlands decreased by 1.2% per annum. By comparison, Tasmania as a whole had an annual growth rate over this period of 0.7%. In the Tasmanian Midlands, there was also a trend for population losses across the younger age cohorts (< 50 years) while population growth occurred in the older age cohorts (> 50 years) (Figure 3). Between 2001 and 2011, the largest annual population growth in the Tasmanian Midlands occurred in the year age cohort (4.3%), year age cohort (3.3%), year age cohort (3%) and the year age cohort (2.7%). The largest declines in the Tasmanian Midlands population occurred in the year age cohort (-4.5%), 5-9 year age cohort (-3.4%) and 0-4 year age cohort (-3.2%) (Figure 3) % Population Change Age Figure 3 Percent annual change in population in Tasmanian Midlands by age, Each town or Urban Centre Locality (UCL) with 200 or more persons within the Tasmanian Midlands was classified as having experienced an increase, decrease or stagnant population trend. Following Curtis et al. (2003b), these distinctions were made on the basis that in the ten-year period between 2001 and 2011: there was an increased population trend when the population rose by more than 0.5% per year on average over the period; there was a decreased population trend when the population fell by more than 0.5% per year on average over the period; or the population trend was stagnant when the increase or decrease was less than 0.5% on average across the period. There are four UCLs within the Tasmanian Midlands Cressy, Campbell Town, Ross and Oatlands. None of these UCLs experienced an increased population trend. Cressy, Campbell Town and Ross had a stagnant population trend while Oatlands experienced a decrease in population over the period Page 11
14 In 2011, 48.4% of the Tasmanian Midlands population lived outside of UCL boundaries (that is, were rural populations). Across the Tasmanian Midlands, the rural populations experienced a decline of 2.1% during the ten-year period between 2001 and This is higher than the highest decrease experienced by any of the UCLs (Oatlands at 0.6%). 2.1 Age structure In 2011, the median age of the Tasmanian Midlands population was 42 years (Appendix 2, Table A2.1). This median age was two years more than that for the state. Since 2001, the median age of the Tasmanian Midlands has increased by 3 years, from 39 years to 42 years. The median age for the state has increased 4 years from 36 years to 40 years. In 2011, areas with a high median age were Oatlands A (61), Ross (57) and Campbell Town B (52). Areas with lowest median age were Cressy A (36), Cressy Surrounds (37), Cressy B (39) and Ross Surrounds (39) (Appendix 2, Table A2.1). 2.2 Sex ratio In 2011, the Tasmanian Midland s population comprised 2,157 females and 2,257 males, or males per 100 females. This is a considerably higher proportion of males than for the state as a whole, which had 95.9 males per 100 females. (See Appendix 2, Table A2.1 for full details). In 2011, the regions with the highest sex ratios were: Campbell Town Surrounds (129.8 males per 100 females); South East (127 males per 100 females); and Ross Surrounds (125.4 males per 100 females). In 2011, the lowest sex ratios in the Tasmanian Midlands were: the North SA1 (87.8 males per 100 females); Campbell Town B (89.4 males per 100 females); and Oatlands A (91.2 males per 100 females). In considering the Tasmanian Midlands population by age and sex (Figure 4), the lowest sex ratios occurred in the year cohort (26.1 males per 100 females) and the year cohort (85.7 males per 100 females). Page 12
15 Age Class %Female %Male Percent Figure 4 Tasmanian Midlands population by age and sex, Number of youth Youth numbers are an indicator of community viability and vitality - that is, the capacity of a place-based community to retain or attract young people. In 2011, 10.1% (274) of the population of the Tasmanian Midlands was years of age. This is slightly lower than the state-wide proportion of 12.8%. Based on the 2001 CD data, the number of youths in the Tasmanian Midlands decreased by 7.1% (from 510 in 2001 to 474 in 2011). By contrast, the number of youths increased across the state by 2.8%. Youth as a proportion of the total population was highest in the township of Cressy Cressy B (15.6% of the population) and Cressy A (13.4% of the population). The next highest region was Cressy Surrounds, with 12.8%. The lowest concentrations of youth occurred in the North SA1, (3.9%), Ross Surrounds (5.3%) and North East (6%) (Appendix 2, Table A2.1). 2.4 Indigenous population In 2011, 2.6% of the Tasmanian Midland s population identified themselves as Indigenous. This is lower than the state-wide figure of 4%. The highest concentrations of Indigenous people occurred in the south of the study region in Oatlands Surrounds (6.8%), South East (4.0%) and in the township areas Cressy A and Campbell Town B with 6.5% and 4.0% respectively. There were no Indigenous people recorded from the North SA1, Ross Surrounds, Ross and Campbell Town Surrounds (Appendix 2, Table A2.1). Page 13
16 2.5 Number, age and mobility of farmers/farm managers In 2011, 6.9% of the Tasmanian Midland s population (326 people) identified themselves as a farmer or farm manager. This is lower than the state s 8.0% of the population identifying themselves as farmers/farm managers (FFM) (Table 3). The highest proportions of farmers/farm managers were in Campbell Town Surrounds (26.4%) and Ross Surrounds (25.5%), Oatlands Surrounds (19.7%) and the South East SA1 (12.7%). No census respondents identified themselves as farmer/farm managers in Oatlands A, Oatlands B, Campbell Town B or Ross (Table 3, Appendix 2, Table A2.1). SA1 Table 3 SA1 pop n Summary of farming characteristics in the Tasmanian Midlands, 2011 Census No. FFMs % of all Midlands FFMs % of SA1 pop n FFM median age % FFMs with post-school qualification (Section 3.2) AFF employment (Section 6.4) Campbell Town A na na 15.4 Campbell Town B na na 6.6 Ross na na 18.7 Campbell Town Surrounds Cressy A na na 13.7 North West Ross Surrounds Cressy Surrounds Cressy B na na 11.7 North East North Oatlands Surrounds South East Oatlands A na na 16.7 Conservation lands on farms (Section 8) In the Northern Midlands SLA 75 agricultural businesses (41.9%) have areas set aside for conservation, an average 294 ha (7.0% of total property area) Oatlands B na na 10.3 Tasmanian 326 4, na na Midlands (6.9%) Tasmania 489,029 39,122 (8.0%) na 1,471 agricultural businesses, average farm size ha, average 94.5 ha set aside for conservation Page 14
17 Between 2006 and 2011, the Northern Midlands SLA s farmer/farm manager population declined by 8.8%, which was similar to that for the state as a whole, where the decline was 8.1%. In 2011, the median age of the Tasmanian Midlands population who identified themselves as farmers/farm managers was 49 years. This median age was 5 years lower than that for the state as a whole, which in 2011 was 54 years. The highest median age of famers/farm managers in the Tasmanian Midlands was in North East SA1, with a median age of 67. The lowest median age of 42 occurred in Oatlands Surrounds. Between 2006 and 2011, the median age of farmers and farm managers in the Tasmanian Midlands increased by 7 years (from 42 years to 49 years). This is much higher than the 2-year increase experienced for the state (from 52 years to 54 years) (Table 3, Appendix 2, Table A2.1). In 2011, 79 famers/farm managers in the Northern Midlands SLA (24.5%) had a different address in This is very similar to the state-wide proportion of 23.6%. The SA1s with the highest proportions of famers and or farm managers whom had a different address in 2006 were Campbell Town A, Cressy B and Cressy A with 100.0%, 75.0% and 75.0% respectively, but these figures are based on very low numbers of farmers/farm managers in these SA1s. The South East SA1 had only 8.9% of farmers/farm managers with a different address in 2006, while no farmers/farm managers changed residence in the North SA1 (Table 3, Appendix 2, Table A2.1). 3. Education Education data by SLA1 are given in Appendix 2, Table A Persons with post-school qualifications In 2011, 25.7% (1,212) of the Tasmanian Midlands population aged 15 years or older had a post school qualification. This is lower than the state s proportion of 33.0%. The highest proportions of people with post school qualifications in 2011 were in the SA1s of North and Cressy Surrounds, both having higher proportions than the state with 35.1% and 35.4% respectively. The lowest proportions of people with post school qualifications in 2011, were in the North East (18.7%), South East (18.9%), and Cressy A (20.2%) (Table 3, Appendix 2, Table A2.2). From 2001 to 2011, the proportion of people with a post school qualification in the Tasmanian Midlands increased by 7.9%. 3.2 Farmers/farm managers with post-school qualifications In 2011, 45.7% (149) of people who identified themselves as farmers/farm managers in the Tasmanian Midlands had a post school qualification. This is higher than the state s proportion of farmers/farm managers with a post school qualification of 40.8%. The highest proportions of farmers/farm managers with post-school qualifications were in Cressy A (75.0%) and Cressy Surrounds (56.2%). There were no farmers/farm managers with post-school qualifications in Campbell Town A, Cressy B and North (Table 3, Appendix 2, Table A2.2). Page 15
18 4. Health The ABS provides one indicator of health status in the study area the indirect standardised death rate. The indirect standardised death rate represents the death rate of populations with different age structures by relating them to a standard population (the 2011 population) to account for the variation between actual deaths and the number of deaths that would have occurred if the population had experienced the age-specific death rates of the standard population (ABS 2011a). The indirect (average) standardised death rate for the Northern Midlands SLA was 5.7 deaths per 1,000 persons. The Southern Midlands SLA recorded 6.7 deaths per 1,000 persons. The indirect (average) standardised death rate for Tasmania in 2011 was 6.6 deaths per 1,000 persons. 5. Cultural diversity In 2011, 1.3% of the population in the Tasmanian Midlands spoke a language other than English (LOTE) in their own home. This is lower than the 4.5% average for the state. The SA1s with the highest proportion of LOTE speakers were Campbell Town Surrounds (3.7%), Cressy Surrounds (2.1%) and Campbell Town A and B both with 1.9%. There were no LOTE speakers identified in Ross, North West, Ross Surrounds, North East, North, Oatlands Surrounds or Oatlands B (Appendix 2, Table A2.2). 6. Work force Work force data by SA1 are given in Appendix 2, Table A Labour force participation rate In 2011, labour force participation in the Tasmanian Midlands was 53.2%. This is lower than the rate for the state (58.5%). The highest participation rates were in Ross Surrounds (68.4%), Cressy A (63.8%) and South East (60.3%). The three lowest labour force participation rates were all found in townships, with Oatlands A (33.6%), Ross (41.3%) and Campbell Town A (45.5%) (Appendix 2, Table A2.3). 6.2 Unemployment rate In 2011, the percentage of the labour force that was unemployed in the Tasmanian Midlands was 4.8%. This is 1.6% less than that for the state (6.4%). The highest levels of unemployment were found in the SA1s of North East (18.0%), Oatlands A (9.5%) and Cressy A (9.2%). There was no identified unemployment in Campbell Town Surrounds, North, Oatlands Surrounds and Oatlands B (Appendix 2, Table A2.3). 6.3 Youth unemployment rate In 2011, 9.7% of the Tasmanian Midlands labour force aged years was unemployed. This is 4% lower than the state s youth unemployment rate. The highest youth unemployment rate was in the North East (100%), however this SA1 only had a youth population of 3 people. Other high unemployment areas included Cressy A (26.3%) and Campbell Town A (15.8%). There was no identified youth unemployment in Oatlands Surrounds, South East, Ross Surrounds, Campbell Town Surrounds, Oatlands A, Oatlands B, Ross, Campbell Town B and North (Appendix 2, Table A2.3). The Tasmanian Midlands SA1s that had high youth unemployment also had high overall unemployment, and correspondingly areas with lower levels of youth unemployment had low levels of overall unemployment. Page 16
19 6.4 Employment in the agriculture, fisheries and forestry sector In 2011, 1,945 persons aged 15 years and over were employed within the agriculture, fisheries and forestry (AFF) sector, accounting for 30% of all employed persons within the Tasmanian Midlands. This was more than six times than the corresponding figure for the state (4.7%). Across the Tasmanian Midlands, there were variations in the level of employment within the agriculture, fisheries and forestry sector. The highest levels of such employment were found in the SA1s of South East (71.9%), Ross Surrounds (65.8%) and Campbell Town Surrounds (54.3%). Although all areas were above the state average, the lowest levels of employment within the agriculture, fisheries and forestry sector were in the SA1s of Campbell Town B (6.6%), Oatlands B (10.3%) and Cressy B (11.7%) (Appendix 2, Table A2.3). In the Tasmanian Midlands, the proportion of males (41.5%) employed within the agriculture, fisheries and forestry sector is more than double the proportion of females (14.9%). This male to female ratio is consistent with the state s proportion of employment in the agriculture, fisheries and forestry sector with substantially more males (6.7%) than females (2.6%). The SA1s with the highest number of males were South East (94.9%), Ross Surrounds (90.8%) and Oatlands Surrounds (57.9%). The number of males employed in this sector was lowest in Campbell Town B (13.0%), Cressy B (13.0%) and Oatlands B (17.4%). The percentage of females employed in the agriculture, fisheries and forestry sector was highest in Ross Surrounds (37.8%), South East (35.1%) and Cressy Surrounds (25.7%). There were no women identified as being employed in the sector in Campbell Town B, Cressy A, Oatlands A and Oatlands (Appendix 2, Table A2.3). Between 2001 and 2011, the number of people working within the agriculture, fisheries and forestry sector in the Tasmanian Midlands decreased by 4.1%. This is a 2.1% larger decline than for the state as a whole. During this time, the proportion of males to females working in this sector increased slightly from 77.2% males to 78.6% males. Conversely, the proportion of males to females working in this sector across the state decreased by 0.4% from 73.9% males to 73.5% males. 6.5 Persons volunteering in last 12 months In 2011, 17.6% of people in the Tasmanian Midlands undertook voluntary work for an organisation or group over the preceding 12 months. This is almost twice the state-wide percentage of 9.7%. The highest percentage of persons undertaking voluntary work occurred in North (28.6%), South East (28.2%) and Cressy Surrounds (22.9%). The lowest percentage of persons undertaking voluntary work occurred in the SA1s of Cressy A (12.2%), North West (12.7%) and Cressy B (13.1%). In 2011, 16.1% of the male population in the Tasmanian Midlands had volunteered in the preceding 12 months. The SA1s with the highest percentage of males volunteering were Cressy Surrounds (20.3%), North (19.4%) and Campbell Town Surrounds (18.6%). The corresponding figure for females was 19.0%, with the highest percentages also found in North (36.6%), Oatlands Surrounds (26.0%) and Cressy Surrounds (25.7%) (Appendix 2, Table A2.3). Page 17
20 7. Average annual taxable income In 2009, the personal taxpayers within the Northern Midlands SLA had an average taxable income of $46,507 and those in the entire Southern Midlands SLA, a substantial proportion of which is outside our study area, had an average taxable income of $42,285. The average state-wide taxable income was $49,388. In comparison, states such as NSW ($59,782) and Victoria ($55,986) have higher taxable incomes (Gadsby et al. 2013). 8. Agricultural holdings In 2010, there were 179 agricultural businesses 1 in the Northern Midlands SLA with an estimated of holding of 313,326 ha. The average area of an agricultural property was 1,750.4 ha. By comparison, the state s 4,085 agricultural businesses had an average holding of ha. There were 75 agricultural businesses in the Northern Midlands SLA that had set aside an estimated 22,068 ha for conservation. This is compared to the state s total of 1,471 agricultural businesses and an estimated 138,985 ha set aside for conservation (Table 3). 9. Physical infrastructure 9.1 Building approvals per 1,000 persons Within the Tasmanian Midlands, the number of building approvals in 2010 for the Northern Midlands SLA was 10 dwellings, accounting for 0.3% of building approvals in the state. In the Southern Midlands SLA, a substantial proportion of which is outside our study area, 27 building approvals accounted for 0.9% of the state s building approvals. Per thousand persons, the Northern Midlands SLA had a building approvals-population rate of 2.3 per 1,000 people and the Southern Midlands SLA had a building approvals-population rate of 4.6 per 1,000 people. The building approvals-population rate for the state was higher at 6.3 per 1,000 people. 9.2 Home ownership In 2011, 1,290 households had dwellings that were either owned outright or being purchased, accounting for 72.9% of all households within the Tasmanian Midlands region. This level of home ownership was 4.4% higher than the state average of 68.5%. The SA1s with the highest levels of home ownership were Cressy Surrounds (92.2%), North (84.0%) and Oatlands B (83.3%). The areas with the lowest levels of home ownership were Ross Surrounds (46.7%), Campbell Town Surrounds (56.8%) and South East (59.3%) (Appendix 2, Table A2.4). 9.3 Persons using Internet at home In 2011, 1,135 people had internet access at their home in the Tasmanian Midlands (63.2% of households). This is 8.3% lower than for the state as a whole (71.5%). The highest percentage of the population with internet access at home occurred in the South East (89.7%), Cressy Surrounds (74.4%) and Ross Surrounds (72.4%). The lowest percentage occurred in Oatlands A (43.4%) and Oatlands B (46.0%) (Appendix 2, Table A2.4). 1 A business which is engaged in agricultural activities above $5,000, based on Estimated Value of Agricultural Operations or a derived value based on Business Activity Statement Turnover (ABS 2012). Page 18
21 10. Socio-economic disadvantage The ability of land management agencies to engage with local communities is influenced by the levels of social capital in these communities (Morrison et al. 2011). Social capital includes trust, connectedness and leadership (Pretty & Ward 2001). Communities where these characteristics are particularly evident have been shown to be more responsive to environmental programs (Pretty 2003). However, the social capital of communities in the Tasmanian Midlands has not been formally documented. We have used available social disadvantage data as an indirect indication of the extent to which social capital may be underdeveloped in the Tasmanian Midlands Low-income households In 2011, low-income households were classified as those with a total gross weekly household income of $300 or less. At this time, 144 households in the Tasmanian Midlands were low income, accounting for 8.0% of all households. This is considerably higher proportion than for the state as a whole, which had 1.0% of households earning a total gross weekly income of $300 or less. The highest level of low-income households was found in the township of Ross (15.2%). Other SA1s with a high number of low-income households were South East (12.6%) and North (11.1%). The lowest levels of low-income households were in Campbell Town Surrounds (0%), North West (1.9%) and Cressy B (3.3%) (Appendix 2, Table A2.5) Housing stress In 2011, the percentage of low-income families experiencing mortgage stress in the Northern Midlands SLA was 10.1% and 13.8% for the entire Southern Midlands SLA, much of which is outside our study area. The corresponding figure for the state was 8.1%. Rental stress was experienced by 15.6% of low-income households in the Northern Midlands SLA, and by 21.5% in the Southern Midlands SLA. This corresponding figure for the state was 28.9% Index of relative socio-economic disadvantage The index of relative socio-economic disadvantage (IRSD) scores each area by summarising attributes of the population, such as low income, low educational attainment, high unemployment and jobs in relatively unskilled occupations. It reflects the overall or average level of disadvantage of the population of an area. The index has a base of 1000 for Australia: scores above 1000 indicate relative advantage and those below, disadvantage (PHIDU 2006). In 2006, the average IRSD score for the Northern Midlands SLA was 956 and the Southern Midlands SLA score was 940. Both are slightly lower than the IRSD for the state of 961. Page 19
22 11. Implications for biodiversity conservation The IRSD score for the Tasmanian Midlands is below that for Tasmania, with the scores for both the Tasmanian Midlands and Tasmania reflecting relative disadvantage. The difference in average taxable income between Tasmania, NSW and Victoria is also illustrative of the relative disadvantage experienced by Tasmanians, with the average taxable income in Tasmania about $10,000 lower than in NSW. Additionally, the number of low-income households in the Tasmanian Midlands, is eight times higher than the state figure (8.0% versus 1.0%), showing the relative disadvantage and an associated lack of discretionary capital to devote to nature conservation activities. The combined public-private value of biodiversity and for this study region the focus is native grasslands on private lands suggests opportunities for the co-creation of values through partnerships in which the Australian Government is an active participant. Native grasslands in the Tasmanian Midlands are a Matter of National Environmental Significance (MNES) under the EPBC Act 1999 (Cwlth), acknowledging and emphasising their national importance (that is, their importance to Australia and Australians). The relative disadvantage of landholders, as part of the Tasmanian Midlands population and as Tasmanians, combined with the national importance of these grasslands, indicate an active role for the Australian Government on behalf of the Australian people, alone or in partnership with philanthropic and non-government organisations, may therefore be warranted to protect an ecosystem of national significance. The Tasmanian Midlands and Tasmania are economically disadvantaged, which limits capacity of the state to carry all the costs of conserving native grasslands on private lands. There is already a local support base for private-land conservation initiatives 41.9% of businesses in the Northern Midlands SLA have set aside some of their land for conservation purposes. There is an opportunity to build on this support, particularly given the relatively small number of agricultural businesses in the Tasmanian Midlands (179 agricultural businesses in the Northern Midlands SLA). This small number of businesses lends itself to a targeted, individualised approach by government and non-government organisations with an interest in and commitment to these grasslands. Individualised, targeted assistance to individual landholders for grassland protection and management activities is practical and feasible. In terms of opportunity costs, having a relatively small number of farmers/managers to work with, emphasises the potential benefits of building relationships and partnerships over time and strategic, jointly defined investment goals and strategies. Agriculture is part of the character and identity of the Tasmanian Midlands. In this region, 30.0% of the population is employed in the agriculture, fisheries and forestry sector, with two-thirds of the population in two of the SA1s (Ross Surrounds and South East) employed in this sector. As such, conservation activities that can be co-produced with agricultural pursuits will have greater chance of success than single-focus ventures (that is, those with a focus on biodiversity alone). However, the farmer/farm manager population declined by 23.5%, between 2006 and 2011, which was much higher than for the state as a whole, where the decline was 8.1%. Declining numbers of farmers and farm managers is a cause for concern in terms of loss of local knowledge and land management capacity. Although the Tasmanian Midlands has economic disadvantage, it has strong human-produced/social capital in the form of volunteering. In the Tasmanian Midlands, 17.6% of the population volunteered in 2011, almost twice the state average. This figure suggests a cadre of individuals potentially Page 20
23 available to undertake nature conservation activities currently at provide suggest the potential for contributions through volunteering, to protecting these grasslands, in partnership with private landholders. Relative to other farmers in the state, Tasmanian Midlands farmers are relatively better educated and more of them use the internet. A total of 45.7% of farmers and farm managers in the Tasmanian Midlands have a post-school qualification compared to 40.8% for the Tasmanian farming population. This suggests potentially more awareness of management options through additional post-school training and possibilities for innovative approaches combining agriculture and native grasslands protection, potentially assisted by web-based delivery. Page 21
24 12. References ABS (2004) Measuring Social capital: an Australian Framework and Indicators, viewed October 2012, Australian Bureau of Statistics, Canberra, < nsf/0/13c0688f6b98dd45ca256e360077d526/ $File/13780_2004.pdf>. ABS (2011a) Deaths, Australia, ABS Catalogue No Australian Bureau of Statistics, Canberra. ABS (2011b) National Regional Profile , viewed October 2012, Australian Bureau of Statistics, Canberra, < pmaps.nsf/new+gmappages/national+region al+profile>. ABS (2011c) Agricultural Census, Agricultural Commodities, Australia , ABS Catalogue No , Australian Bureau of Statistics, Canberra. ABS (2012) Census data and analysis, viewed September-October 2012, Australian Bureau of Statistics, Canberra, < me.nsf/home/data?opendocument&navpos=20 0>. Cocklin C & Altson M (eds) (2003) Community Sustainability in Rural Australia: a question of capital? Academy of the Social Sciences in Australia, Canberra. Curtis A, Herreria E & Kelson S. (2003a) Murrumbidgee Valley Socio-Economic Profile, Bureau of Rural Sciences, Canberra. Curtis A, Magpantay C, Kelson S & Charalambou C (2003b) Small Towns: Population Trends , Bureau of Rural Sciences, Canberra. DSEWPAC (2011) NERP Program Overview, viewed October 2012, Department of Sustainability, Environment, Water, Communities, Canberra, < Fulton A & Weatherly J (2000) Accelerating Diversification in the Northern Midlands and Fingal Valley, report to the Department of Primary Industries, Parks, Water and Environment, Tasmanian Institute of Agricultural Research, Hobart. Gadsby S, Lockwood M, Moore SA, Curtis A & Joyce S (2013) Australian Alps Socio-Economic Profile, Landscapes and Policy Hub, University of Tasmania. Gouldthorpe J & Gilfedder L (2002) Biodiversity strategy case study: Tasmanian Northern Midlands Bioregion, a report to the National Land and Water Resources Audit, Nature Conservation Branch Technical Report 02/08, Department of Primary Industries, Water and Environmental, Tasmania. Mooney C, Defenderfer D & Anderson M (2010) Reasons Why Farmers Diversify Northern Midlands, Tasmania, Rural Industries Research and Development Corporation, Canberra. Moore SA, Severn RC & Millar R (2006) A conceptual model of community capacity. Geographical Research 44(4): Morrison M, Oczkowski E & Greig J (2011) The primacy of human capital and social capital in influencing landholders' participation in programmes designed to improve environmental outcomes, Australian Journal of Agricultural and Resource Economics 55: Pretty J (2003) Social capital and the collective management of resources, Science 302(5652): Pretty J & Ward H (2001) Social capital and the environment, World Development 29: PHIDU (2006) Summary measure of disadvantage: Index of Relative Socio-Economic Disadvantage, 2006, viewed October 2012, Public Health Information Development Unit, Canberra, < g/2012/notes/notes_d&s_irsd.htm>. PHIDU (2012) Low income households with mortgage stress, 2011, viewed October 2012, Public Health Information Development Unit, Canberra, < g/2012/notes/notes_d&s_mortgage_stress.htm >. Webb TJ & Curtis A (2002) Mapping Regional Capacity: a method to map regional capacity to adopt more sustainable natural resource management practices, report to Land & Water Australia, Bureau of Rural Sciences, Canberra. Webb T, Cody K, Harrison B, Sincock A & Mues C (2004) Social and Economic Information for NRM: an initial discussion paper, National Land & Water Resources Audit, Canberra. Page 22
25 Appendix 1 Profile variable descriptions Variable Unit Source Definition Geography Time series Population 1. Number of persons Number (no.) 2. Population change Median age of total population 4. Change in median age of total population Per cent 5. Population sex ratio Per cent 6. Number of young persons aged years 7. Change in the number of persons aged years 2011 Census of 2001, 2006, 2011 Censuses of Population & Years 2011 Census of. Years 2001, Censuses of Population & Per cent Per cent 8. Indigenous persons Per cent 9. Number of farmers/farm managers 10. Median age of farmers/farm managers by employment sector 11. Change in median age of farmers/farm managers by employment sector 12. Farmers/farm managers with different address 5 years ago by employment sector Per cent Years 2011 Census of 2011 Census of 2001, 2006 and 2011, Censuses of Population & 2011 Census of 2011 Census of 2011 Census of Population & Years 2006 and 2011 Censuses of Population & Per cent 2011 Census of Persons enumerated on Census night (place of enumeration) Average annual population growth rate between 2001 and 2011 (place of enumeration) The median age indicates the age at which half the population is older and half is younger Difference between the median age of total population between Number of males per 100 females expressed as a percentage Number of persons aged years Percentage change in the number of persons aged years between Number of persons who identified themselves as being of Indigenous origin as a percentage of the total population Number of persons who identified themselves as being a farmer/farm manager as a percentage of the total population The median age indicates the age at which half property managers population is older and half is younger Difference between the median age of farmers/farm managers by employment sector between Number of property who stated that their usual address was different 5 years ago expressed as a percentage of all property managers by employment sector SA SA1, CD SA SA1, CD SA SA SA1, CD SA SA SA SA1, CD SA Page 23
26 Variable Unit Source Definition Geography Time series 13. Percentage of Per cent 2011 Census of Number of farmers/farm managers SA farmers/farm managers who used Internet at home who had used Internet only at home during the week prior to Census night as percentage of all property managers Education 14. Persons with a postschool qualification 15. Change in persons with a post-school qualification. 16. Farmers with a postschool qualification Health 17. Indirect standardised death rate Cultural diversity 18. Persons who speak a language other than English at home Work force 19. Labour force participation rate Per cent Per cent Per cent per 1,000 Per cent Per cent 20. Unemployment rate Per cent 21. Youth unemployment rate 22. Employment and change in employment within the AFF sector by sex 23. Persons who undertook voluntary work for a group or organisation Per cent Per cent Per cent 2011 Census of 2001, 2006 and 2011, Censuses of Population & 2011 Census of 2011 Deaths Australia, ABS 2011 Census of 2011 Census of 2011 Census of 2011 Census of 2001, 2006 and 2011 Censuses of Population & 2001, 2006, 2011 Census of Number of persons with a postschool qualification as a percentage of total persons aged 15 years and over Percentage change in persons with a post-school qualification between The number of farmers with a post-school qualification as a percentage of total farmers The indirect method is used when the populations under study are small and the age-specific death rates are unreliable or not known The number of persons who speak a language other than English at home as a percentage of total persons The percentage of the population aged 15 years and over who were in the labour force The percentage of the labour force that was unemployed The percentage of the labour force aged years who were unemployed. Change in the proportion of males, females and persons who were employed in AFF as a percentage of all employed males, females and persons The number of people who use the have volunteered in the last 12 months as a percentage of the total population SA SA1, CD SA SLA 2011 SA SA SA SA SA1, CD SA Page 24
27 Variable Unit Source Definition Geography Time series Income 24. Annual average taxable income $ Regional Profile , ABS Total taxable income divided by the number of taxpayers SLA 2009 Agricultural holdings 25. Number and area of agricultural holdings No, ha Agricultural Census, ABS Estimated average of total area of land operated per agricultural business SLA Physical infrastructure 26. Building approvals per 1,000 persons per 1, Home ownership Per cent 28. Percentage of households with internet access Socio-economic disadvantage 29. Low-income households 30. Mortgage and rental stress 31. Index of relative social disadvantage Per cent Per cent Per cent National Regional Profile , ABS 2011 Census of 2011 Census of 2011 Census of PHIDU 2012 The number of dwelling units approved during divided the population by 1,000 persons The number of households being fully owned, being purchased, and being purchased under a rent/buy scheme as percentage of total households The number of households who have access to the internet at home as a percentage of the total population The number of households with a weekly household income of $300 or less as percentage of households with no members temporarily absent and all income stated. It refers to gross weekly household Low-income families spending more than 30% of their income on rent or mortgage Score PHIDU 2006 Reflects the overall or average level of disadvantage of the population of an area -the index has a base of 1000 for Australia SLA 2010 SA SLA 2011 SA SLA 2011 SLA 2006 Page 25
28 Appendix 2 Table A2.1 SA1 data tables Population, 2011 census SA1 Number of persons Population sex ratio Indigenous people Persons median age Youth (15-24 years) Farmers/ farm managers (FFMs) FFM with different address 5 years ago FFM median age No. % % Years % % % Years Campbell Town A na na Campbell Town B na na Ross na na Campbell Town Surrounds Cressy A na na North West Ross Surrounds Cressy Surrounds Cressy B na na North East North Oatlands Surrounds South East Oatlands A na na Oatlands B na na Tasmanian Midlands 4, Tasmania 489, Page 26
29 Table A2.2 Education, 2011 census SA1 Persons with a post-school qualification Farmers with post-school qualifications LOTE speakers % % % Campbell Town A 26.7 na 1.9 Campbell Town B 25.1 na 1.9 Ross 22.1 na 0.0 Campbell Town Surrounds Cressy A North West Ross Surrounds Cressy Surrounds Cressy B 21.2 na 1.9 North East North 35.1 na 0.0 Oatlands Surrounds South East Oatlands A 23.8 na 1.1 Oatlands B 21.0 na 0.0 Tasmanian Midlands Tasmania Table A2.3 Work force, 2001 census SA1 Labour force participation rate Unemployment rate Page 27 Youth unemployment rate Persons employed within AFF sector Males employed within AFF sector Females employed within AFF sector Persons volunteering in last 12 months % % % % % % % Campbell Town A Campbell Town B Ross Campbell Town Surrounds Cressy A North West Ross Surrounds Cressy Surrounds Cressy B North East North Oatlands Surrounds South East Oatlands A Oatlands B Tasmanian Midlands Tasmania
30 Table A2.4 Physical infrastructure, 2011 census SA1 Home ownership Internet access at home % % Campbell Town A Campbell Town B Ross Campbell Town Surrounds Cressy A North West Ross Surrounds Cressy Surrounds Cressy B North East North Oatlands Surrounds South East Oatlands A Oatlands B Tasmanian Midlands Tasmania Table A2.5 Low-income households, 2011 census SA1 Percent low-income households Campbell Town A 7.6 Campbell Town B 9.6 Ross 15.2 Campbell Town Surrounds 0.0 Cressy A 4.6 North West 1.9 Ross Surrounds 5.2 Cressy Surrounds 8.9 Cressy B 3.3 North East 9.2 North 11.1 Oatlands Surrounds 9.4 South East 12.6 Oatlands A 10.0 Oatlands B 5.6 Tasmanian Midlands 8.0 Tasmania 1.0 % Page 28
31 Hub Acknowledgements The Landscapes & Policy Research Hub is supported through funding from the Australian Government s National Environmental Research Program and involves researchers from the University of Tasmania (UTAS), The Australian National University (ANU), Murdoch University and the Antarctic Climate & Ecosystems Cooperative Research Centre (ACE CRC), Griffith University and Charles Sturt University (CSU). Scientific leadership and contributions are from a consortium of schools from these organisations including: UTAS Centre for Environment, UTAS School of Geography and Environmental Studies, UTAS School of Economics and Finance, Murdoch University School of Veterinary and Life Sciences, The ANU Fenner School of Environment & Society, ACE CRC Climate Futures, UTAS School of Zoology, UTAS School of Plant Science - Environmental Change Biology Group, Griffith University Griffith Climate Change Response Program and CSU Institute for Land and Water Society.

32
Statistical Picture of Aboriginal and Torres Strait Islander School Students in Australia
 Chapter 2 Statistical Picture of Aboriginal and Torres Strait Islander School Students in Australia Statistical Picture The Australian Bureau of Statistics (ABS) reported that the estimated resident Aboriginal
2. Recommendations 2.1 Board members are asked to: i. note the content of the May 2018 Renfrewshire Economic Profile.
 To: Leadership Board On: 20 June 2018 Report by: Director of Development and Housing Services Heading: Renfrewshire Economic Profile May 2018 1. Summary 1.1 This report is the second edition of a revised
Aboriginal and Torres Strait Islander Life Expectancy and Mortality Trend Reporting
 Aboriginal and Torres Strait Islander Life Expectancy and Mortality Trend Reporting Technical Report December 2015 Amended May 2016 Authors: Clare Coleman, Nicola Fortune, Vanessa Lee, Kalinda Griffiths,
Youth Retention: July Value of post secondary education in regional settings. Prepared for Luminosity Youth Summit.
 Youth Retention: Value of post secondary education in regional settings Prepared for Luminosity Youth Summit July 2013 Prepared by MID NORTH COAST NSW Table of contents Table of contents... 2 Introduction...
Aboriginal and Torres Strait Islander Life Expectancy and Mortality Trend Reporting to 2014
 Aboriginal and Torres Strait Islander Life Expectancy and Mortality Trend Reporting to 2014 Technical Report June 2016 Authors: Clare Coleman, Nicola Fortune, Vanessa Lee, Kalinda Griffiths, Richard Madden
Regional Universities Network. Introduction. Regional Universities Network. Economic Impact of the Universities in the Regional Universities Network
 Regional Universities Network Economic Impact of the Universities in the Regional Universities Network Introduction The Regional Universities Network (RUN) is a network of six universities with headquarters
Demographic Profile 2013 census
 Demographic Profile 2013 census This profile provides basic population and demographic information on the residents of the Hauraki District. Population and demographic information is important for targeting
Page 1. Economic Impact Assessment of the Palm Island Community Company
 Page 1 Economic Impact Assessment of the Palm Island Community Company INCORPORATING: Empower North is a group of expert consultants providing select clients with an integrated service across the specialist
Chapter 1: The Population of NHS Greater Glasgow and Clyde
 Population Estimate (thousands) Chapter 1: The Population of NHS Greater Glasgow and Clyde Population Trends and Projections National Records of Scotland estimated (NRS SAPE) 1 the 2013 NHS Greater Glasgow
Contents Manningham at a Glance... 6 Location and Area... 6 Manningham Activity Centres... 6 Manningham Suburbs... 6 Population... 8 Forecast... 9 For
 Contents Manningham at a Glance... 6 Location and Area... 6 Manningham Activity Centres... 6 Manningham Suburbs... 6 Population... 8 Forecast... 9 Forecast 2011 2036... 9 Population Forecast... 9 Gross
North Lanarkshire. Skills Assessment January SDS-1163-Jan16
 North Lanarkshire Skills Assessment January 2016 SDS-1163-Jan16 Acknowledgement The Regional Skills Assessment Steering Group (Skills Development Scotland, Scottish Enterprise, the Scottish Funding Council
Tourism Industry Council Tasmania Community Survey 2018 Research Report. May 2018
 Tourism Industry Council Tasmania Community Survey 2018 Research Report May 2018 This report has been prepared by Enterprise Marketing and Research Services 60 Main Road, Moonah TAS 7009 All enquiries
East Lothian. Skills Assessment January SDS-1154-Jan16
 East Lothian Skills Assessment January 2016 SDS-1154-Jan16 Acknowledgement The Regional Skills Assessment Steering Group (Skills Development Scotland, Scottish Enterprise, the Scottish Funding Council
Gold Coast: Modelled Future PIA Queensland Awards for Planning Excellence 2014 Nomination under Cutting Edge Research category
 Gold Coast: Modelled Future PIA Queensland Awards for Planning Excellence 2014 Nomination under Cutting Edge Research category Jointly nominated by SGS Economics and Planning and City of Gold Coast August
QCOSS Regional Homelessness Profile Mackay Statistical Division
 QCOSS Regional Homelessness Profile Mackay Statistical Division March 2011 Council of Social Service Inc (QCOSS) March 2011 QCOSS would like to thank the Department of Communities for providing data from
Devonport-Takapuna Local Board Profile
 Devonport-Takapuna Local Board Profile - Initial results from the Census February 2014 Social and Economic Research Team Research, Investigations and Monitoring Unit Auckland Council Map of Devonport-Takapuna
The Yorke & Mid North (State Govt) Region. Workforce Wizard Region Report
 Region. Workforce Wizard Region Report") The Yorke & Mid North (State Govt) Region Workforce Wizard Region Report Table of Contents Executive Summary 3 Population and Social Characteristics 4 Current Population 4 Age Groups 4 Key Populations
The Yorke & Mid North (State Govt) Region Workforce Wizard Region Report Table of Contents Executive Summary 3 Population and Social Characteristics 4 Current Population 4 Age Groups 4 Key Populations
Agritourism in Missouri: A Profile of Farms by Visitor Numbers
 Agritourism in Missouri: A Profile of Farms by Visitor Numbers Presented to: Sarah Gehring Missouri Department of Agriculture Prepared by: Carla Barbieri, Ph.D. Christine Tew, MS candidate April 2010 University
Puerto Ricans in Rhode Island, the United States, and Puerto Rico, 2013
 Issued September 2016 Centro DS2015US-07 Puerto Ricans in Rhode Island, the United States, and Puerto Rico, 2013 In 2013 an estimated 36,217 Puerto Ricans lived in Rhode Island and accounted for at least
Perth & Kinross Council. Community Planning Partnership Report June 2016
 Perth & Kinross Council Community Planning Partnership Report June 2016 Contents Foreword... 3 Section 1: Spring 2016 destination follow up of 2014/15 school leavers... 4 Background... 4 Section A: Initial
TRANSPORT AFFORDABILITY INDEX
 TRANSPORT AFFORDABILITY INDEX Report - December 2016 AAA 1 AAA 2 Table of contents Foreword 4 Section One Overview 6 Section Two Summary of Results 7 Section Three Detailed Results 9 Section Four City
Projected demand for independent schools in New South Wales over the next 40 years: Summary report
 Projected demand for independent schools in New South Wales over the next 40 years: Summary report Association of Independent Schools of New South Wales 22 October 2014 Glossary ABS ACT AIS ASGS DAE FTE
COUNTRY CASE STUDIES: OVERVIEW
 APPENDIX C: COUNTRY CASE STUDIES: OVERVIEW The countries selected as cases for this evaluation include some of the Bank Group s oldest (Brazil and India) and largest clients in terms of both territory
MINING IN TASMANIA: DINOSAUR OR DELIVERER?
 MINING IN TASMANIA: DINOSAUR OR DELIVERER? PRESENTATION TO A FORUM HOSTED BY THE ACADEMY OF TECHNOLOGICAL SCIENCES AND ENGINEERING (ATSE) FOR NATIONAL SCIENCE WEEK RACV APARTMENT HOTEL, HOBART 3 RD AUGUST
LITERACY IN NOVA SCOTIA Implications of Findings from IALSS 2003
 LITERACY IN NOVA SCOTIA Implications of Findings from IALSS 03 Presented by Satya Brink, Ph.D. Director, National Learning Policy Research Learning Policy Directorate, HRSDC January 06 1 Key Questions
The Economic Benefits of Agritourism in Missouri Farms
 The Economic Benefits of Agritourism in Missouri Farms Presented to: Missouri Department of Agriculture Prepared by: Carla Barbieri, Ph.D. Christine Tew, M.S. September 2010 University of Missouri Department
Submission to NSW Koala Strategy Consultation Process. March 2017
 Submission to NSW Koala Strategy Consultation Process March 2017 Table of contents Opening 3 Response 3 Whole-of-government NSW koala strategy 3 State Environment Planning Policy (SEPP) 44 3 The draft
APPENDIX 8. Leeds Socio-Economic Baseline Report. Report. July Metro and Leeds City Council
 APPENDIX 8 Leeds Socio-Economic Baseline Report Report July 2009 Prepared for: Prepared by: Metro and Leeds City Council Steer Davies Gleave West Riding House 67 Albion Street Leeds LS1 5AA +44 (0)113
Conservation Partners for the National Reserve System Program: a Western NSW focus
 Conservation Partners for the National Reserve System Program: a Western NSW focus Cooper, N. 1, Webber, L. 2, Nicolson, K. 3 1 Department of Environment, Climate Change and Water NSW, PO Box 788 Broken
East Dunbartonshire Area Profile
 East Dunbartonshire Area Profile May 2014 Contents Executive Summary.. page 3 Introduction.. page 6 Population page 7 Age Structure. page 9 Population Projections page 11 Life Expectancy page 12 Ethnicity.
Inverness, Culloden and Suburbs Settlement Economic Overview
 Strategic planning and research Economic information December 2007 Inverness, Culloden and Suburbs Settlement Economic Overview Summary Between 2001 and 2006, the population of Inverness, Culloden and
Figure 1.1 St. John s Location. 2.0 Overview/Structure
 St. John s Region 1.0 Introduction Newfoundland and Labrador s most dominant service centre, St. John s (population = 100,645) is also the province s capital and largest community (Government of Newfoundland
SOCIAL ENTERPRISE IN EDINBURGH: PEOPLE, PROFIT AND PLACE
 SOCIAL ENTERPRISE IN EDINBURGH: PEOPLE, PROFIT AND PLACE Introduction Edinburgh is a leading centre for social enterprise and home to some high profile organisations in the sector. With over 70 members,
Activity Concept Note:
 Activity Concept Note: Summary Provide a short summary of the proposed Activity including indicative New Zealand funding level and note whether this is a New Zealandled or partner-led process. Why: Rationale
Puerto Ricans in Connecticut, the United States, and Puerto Rico, 2014
 Issued April 2016 Centro DS2016US-8 Puerto Ricans in Connecticut, the United States, and Puerto Rico, 2014 In 2014, Connecticut was the 6th state with most Puerto Ricans (301,182) in the United States.
URBAN DYNAMICS WESTERN CAPE 67
 URBAN DYNAMICS WESTERN CAPE 67 5. SOCIO-ECONOMIC CONTEXT 5.1 Demographic Profile 5.1.1 Introduction The demographic information contained in the synopsis is derived from the supposedly inaccurate 2001
TOWN PLANNING SUBMISSION TO THE GREATER SYDNEY COMMISSION LANDS AT ARTARMON
 TOWN PLANNING SUBMISSION TO THE GREATER SYDNEY COMMISSION LANDS AT ARTARMON March 2017 TABLE OF CONTENTS 1.0 INTRODUCTION 3 2.0 THE SUBJECT SITE 4 3.0 STRATEGIC PLANNING CONTEXT 6 4.0 SUMMARY AND CONCLUSIONS
UK household giving new results on regional trends
 CGAP Briefing Note 6 UK household giving new results on regional trends 01 08 July 10 Tom McKenzie and Cathy Pharoah In a climate of growing political emphasis on charitable activity at local levels, this
East Dunbartonshire Area Profile
 East Dunbartonshire Area Profile May 2015 Contents Executive Summary.. page 3 Introduction.. page 6 Population page 7 Age Structure. page 9 Population Estimates..page 11 Population Projections page 13
La Trobe University s Regional Economic Contribution
 La Trobe University s Regional Economic Contribution REPORT FOR LA TROBE UNIVERSITY JULY 2017 Table of contents Executive Summary... 3 1. Introduction... 6 2. La Trobe University and graduate outcomes...7
TRANSPORT AFFORDABILITY INDEX
 TRANSPORT AFFORDABILITY INDEX Report - March 2018 AAA 1 AAA 2 Table of contents Foreword 4 Section One Overview 6 Section Two Summary of Results 8 Section Three Detailed Results 14 Section Four State by
11 January Dear Public Consultations Team of the White Paper Task Force,
 Public Consultations Team White Paper Task Force Department of Foreign Affairs and Trade RG Casey Building John McEwan Crescent Barton ACT 0221 Australia 11 January 2017 Dear Public Consultations Team
Preparatory Course in Business (RMIT) SIM Global Education. Bachelor of Applied Science (Aviation) (Top-Up) RMIT University, Australia
 SIM Global Education. Bachelor of Applied Science (Aviation) (Top-Up) RMIT University, Australia") Preparatory Course in Business (RMIT) SIM Global Education Bachelor of Applied Science (Aviation) (Top-Up) RMIT University, Australia Brief Outline of Modules (Updated 18 September 2018) BUS005 MANAGING
Preparatory Course in Business (RMIT) SIM Global Education Bachelor of Applied Science (Aviation) (Top-Up) RMIT University, Australia Brief Outline of Modules (Updated 18 September 2018) BUS005 MANAGING
COMMUNITY BASED TOURISM DEVELOPMENT (A Case Study of Sikkim)
") COMMUNITY BASED TOURISM DEVELOPMENT (A Case Study of Sikkim) SUMMARY BY RINZING LAMA UNDER THE SUPERVISION OF PROFESSOR MANJULA CHAUDHARY DEPARTMENT OF TOURISM AND HOTEL MANAGEMENT KURUKSHETRA UNIVERSITY,
COMMUNITY BASED TOURISM DEVELOPMENT (A Case Study of Sikkim) SUMMARY BY RINZING LAMA UNDER THE SUPERVISION OF PROFESSOR MANJULA CHAUDHARY DEPARTMENT OF TOURISM AND HOTEL MANAGEMENT KURUKSHETRA UNIVERSITY,
Visual and Sensory Aspect
 Updated All Wales LANDMAP Statistics 2017 Visual and Sensory Aspect Final Report for Natural Resources Wales February 2018 Tel: 029 2043 7841 Email: sw@whiteconsultants.co.uk Web: www.whiteconsultants.co.uk
Life expectancy and potentially avoidable deaths in
 Life expectancy and potentially avoidable deaths in Published 30th November 2017 This report presents information on life expectancy at birth and potentially avoidable deaths in nationally and across Primary
The Conservation Contributions of Ecotourism Cassandra Wardle
 The Conservation Contributions of Ecotourism Cassandra Wardle PhD Candidate, Gold Coast, Australia Supervisors: Ralf Buckley, Aishath Shakeela and Guy Castley State of the Environment State of the Environment
Community-based tourism at Gunung Halimun National Park
 Asia-Pacific Environmental Innovation Strategies (APEIS) Research on Innovative and Strategic Policy Options (RISPO) Good Practices Inventory Community-based tourism at Gunung Halimun National Park Summary
KANGAROO ISLAND WATERGAP PROJECT
 KANGAROO ISLAND WATERGAP PROJECT 1. BACKGROUND Although Kangaroo Island is only 112km from Adelaide, it is economically and socially disadvantaged by its 16km watergap separation from the mainland. There
New Tourism Strategic Plan Northern Territory
 New Tourism Strategic Plan Northern Territory Submission of Accommodation Association of Australia, 2012 EXECUTIVE SUMMARY Without it being overly detrimental to existing tourism accommodation businesses,
Housing in Hobart: an overview of the data. Richard Eccleston, Lisa Denny, Julia Verdouw & Kathleen Flanagan University of Tasmania May 2018
 Housing in Hobart: an overview of the data Richard Eccleston, Lisa Denny, Julia Verdouw & Kathleen Flanagan University of Tasmania May 2018 Informing the Housing Debate Tasmania is facing significant housing
Baku, Azerbaijan November th, 2011
 Baku, Azerbaijan November 22-25 th, 2011 Overview of the presentation: Structure of the IRTS 2008 Main concepts IRTS 2008: brief presentation of contents of chapters 1-9 Summarizing 2 1 Chapter 1 and Chapter
PERTH AND KINROSS COUNCIL. Enterprise and Infrastructure Committee 4 November 2009
 PERTH AND KINROSS COUNCIL 4 09/494 Enterprise and Infrastructure Committee 4 November 2009 STRATEGIC PRIORITIES FOR TOURISM AND AREA TOURISM PARTNERSHIP ARRANGEMENTS Report by Depute Director (Environment)
QUÉBEC DECLARATION ON ECOTOURISM World Ecotourism Summit Québec City, Canada, 2002
 QUÉBEC DECLARATION ON ECOTOURISM World Ecotourism Summit Québec City, Canada, 2002 The participants at the Summit acknowledge the World Summit on Sustainable Development (WSSD) in Johannesburg, August/September
Economic Impact Analysis. Tourism on Tasmania s King Island
 Economic Impact Analysis Tourism on Tasmania s King Island i Economic Impact Analysis Tourism on Tasmania s King Island This project has been conducted by REMPLAN Project Team Matthew Nichol Principal
Brand Health Survey. Conducted by the Brand Tasmania Council December 2015 and January brandtasmania.com
 Brand Health Survey Conducted by the Brand Tasmania Council December 2015 and January 2016 brandtasmania.com Executive Summary A survey of 731 respondents conducted by Brand Tasmania in December January
Sweden. Tourism in the economy. Tourism governance and funding
 Sweden Tourism in the economy In 2014 Sweden s GDP was SEK 3 907 billion. Tourism s share of GDP is 2.8%, and has been growing steadily for the last ten years and is an important contributor to the economy
The Economic Impact of Tourism in Buncombe County, North Carolina
 The Economic Impact of Tourism in Buncombe County, North Carolina 2017 Analysis September 2018 Introduction and definitions This study measures the economic impact of tourism in Buncombe County, North
What will Mackay be like in 5 years time?
 What will Mackay be like in 5 years time? Information booklet Presentation to Mackay Region Chamber of Commerce by Dr Kim Houghton Director Strategic Economic Solutions 4 September 2013 Strategic Economic
Gwynedd and Anglesey Housing and the Welsh Language Survey
 Gwynedd and Anglesey Housing and the Welsh Language Survey Executive summary and main conclusions July 2014 Produced by the Research and Analytics Service, Gwynedd Council research@gwynedd.gov.uk Research
Labrador - Island Transmission Link Target Rare Plant Survey Locations
 27-28- Figure: 36 of 55 29-28- Figure: 37 of 55 29- Figure: 38 of 55 #* Figure: 39 of 55 30- - east side Figure: 40 of 55 31- Figure: 41 of 55 31- Figure: 42 of 55 32- - secondary Figure: 43 of 55 32-
Dr. Dimitris P. Drakoulis THE REGIONAL ORGANIZATION OF THE EASTERN ROMAN EMPIRE IN THE EARLY BYZANTINE PERIOD (4TH-6TH CENTURY A.D.
 Dr. Dimitris P. Drakoulis THE REGIONAL ORGANIZATION OF THE EASTERN ROMAN EMPIRE IN THE EARLY BYZANTINE PERIOD (4TH-6TH CENTURY A.D.) ENGLISH SUMMARY The purpose of this doctoral dissertation is to contribute
Estonia. Tourism in the economy. Tourism governance and funding
 Estonia Tourism in the economy Tourism contributes directly around 4.6% of Estonia s GDP, rising to 6.6% if indirect impacts are also included. Export revenues from tourism amount to approximately EUR
Queensland State Election Priorities 2017
 Queensland State Election Priorities 2017 Protecting, conserving and celebrating Queensland s environmental, built and cultural heritage. QUEENSLAND S HERITAGE MAKES A DIFFERENCE Environmental, built and
Monitoring the Environmental Status of the Heart of Borneo
 Monitoring the Environmental Status of the Heart of Borneo By: Stephan Wulffraat The Heart of Borneo conservation initiative has been going on now for several years and has gained increasing support from
West London Economic Assessment
 West London Economic Assessment A baseline analysis of the West London economy An Executive Summary PBA were commissioned in October 2015 to complete an economic assessment of West London to refresh the
Korea. Tourism in the economy. Tourism governance and funding
 Korea Tourism in the economy In 2014 the number of international visitors to Korea stood at a record 14.2 million, an increase of 16.6% compared with 12.2 million in 2013. As inbound tourism has increased,
ENVIRONMENT ACTION PLAN
 ENVIRONMENT ACTION PLAN 2015 16 Airservices Australia 2015 This work is copyright. Apart from any use as permitted under the Copyright Act 1968, no part may be reproduced by any process without prior written
HOUSEHOLD TRAVEL SURVEY
 HOUSEHOLD TRAVEL SURVEY Household Travel Survey i TABLE OF CONTENTS Page 1.0 INTRODUCTION... 1 2.0 SUMMARY OF TRAVEL... 2 2.1 All-Day Travel Patterns... 2 2.1.1 Automobile Availability... 2 2.1.2 Trip
Department of Agricultural and Resource Economics, Fort Collins, CO
 June 2007 EDR 07-15 Department of Agricultural and Resource Economics, Fort Collins, CO 80523-1172 http://dare.colostate.edu/pubs OF WINE AND WILDLIFE: ASSESSING MARKET POTENTIAL FOR COLORADO AGRITOURISM
Netherlands. Tourism in the economy. Tourism governance and funding
 Netherlands Tourism in the economy The importance of domestic and inbound tourism for the Dutch economy is increasing, with tourism growth exceeding the growth of the total economy in the last five years.
The Sunshine Coast is part of the global community and generates wealth through export, high-value industries and new investment.
 3.2 Strategic intent 3.2.1 Shaping growth an overview In 2031, the Sunshine Coast is renowned for its vibrant economy, ecological values, unique character and strong sense of community. It is Australia
TOURISM: SUPERCHARGING AUSTRALIA S FUTURE
 TOURISM: SUPERCHARGING AUSTRALIA S FUTURE In partnership with ABOUT TTF The Tourism & Transport Forum (TTF) is the peak industry group for the Australian tourism, transport, aviation and investment sectors.
HEALTH SECTOR ECONOMIC INDICATORS REPORT
 HEALTH SECTOR ECONOMIC INDICATORS REPORT For: Mid North Coast Local Health District Report prepared by: April 2013 Table of Contents Introduction 3 Executive Summary 4 Output 5 Value-Added 7 Workforce
SHIP MANAGEMENT SURVEY* July December 2015
 SHIP MANAGEMENT SURVEY* July December 2015 1. SHIP MANAGEMENT REVENUES FROM NON- RESIDENTS Ship management revenues dropped marginally to 462 million, following a decline in global shipping markets. Germany
The Economic Impact of Tourism on Scarborough District 2014
 The Economic Impact of Tourism on Scarborough District 2014 Prepared by: Tourism South East Research Unit 40 Chamberlayne Road Eastleigh Hampshire SO50 5JH CONTENTS 1. Summary of Results 1 2. Table of
Iceland. Tourism in the economy. Tourism governance and funding
 Iceland Tourism in the economy Tourism has been among the fastest-growing industries in Iceland in recent years and has established itself as the third pillar of the Icelandic economy. Domestic demand
Mäori Economy in the Waikato Region Summary
 Mäori Economy in the Waikato Region Summary 1 KEY OBSERVATIONS OF THE WAIKATO MÄORI ECONOMY Mäori make a significant contribution to the economy in the Waikato region. This executive summary highlights
Byron Shire Visitor Profile and Satisfaction Report: Summary and Discussion of Results
 Byron Shire Visitor Profile and Satisfaction Report: Summary and Discussion of Results Introduction The Byron Shire Visitor Profile and Satisfaction (VPS) project was completed as part of the Destination
SHETLAND AREA PROFILE
 www.hie.co.uk SHETLAND AREA PROFILE May 2014 SHETLAND AREA PROFILE INTRODUCTION The Shetland area profile uses 2011 Census data and other available data sources to present an up-to-date analysis of its
ASCOT SUBURB PROFILE
 ASCOT SUBURB PROFILE CONTENTS SUBURB HIGHLIGHTS 2 3 4 4 5 5 ASCOT & SURROUNDS LOCATION & LIFESTYLE DEMOGRAPHICS EMPLOYMENT FUTURE INFRASTRUCTURE WA MARKET TRENDS ACCESSIBILITY ENTERTAINMENT & RECREATION
PRIMA Open Online Public Consultation
 PRIMA Open Online Public Consultation Short Summary Report Published on 1 June 2016 Research and Introduction Objective of the consultation: to collect views and opinions on the scope, objectives, and
Population, Territory and Sustainable Development The Case of the Caribbean Sub Region
 Population, Territory and Sustainable Development The Case of the Caribbean Sub Region Author: Godfrey St. Bernard Sir Arthur Lewis Institute of Social and Economic Studies The University of the West Indies
Population and social conditions
 * * STTSTCS N OCUS Population and social conditions eurostat U SSN 0 PRTTM WORK N TH UROPN UNON When asked whether they are working parttime, % of all employed persons in the uropean Union answer yes.
The Economic Impact of Tourism on Calderdale Prepared by: Tourism South East Research Unit 40 Chamberlayne Road Eastleigh Hampshire SO50 5JH
 The Economic Impact of Tourism on Calderdale 2015 Prepared by: Tourism South East Research Unit 40 Chamberlayne Road Eastleigh Hampshire SO50 5JH CONTENTS 1. Summary of Results 1 2. Table of Results Table
Sizing up Australia s eastern Grey Nurse Shark population
 Image: David Harasti A new estimate of adult population size for Australia s eastern Grey Nurse Shark drew on widespread genetic sampling and forensic exploration of family trees. Grey Nurse Sharks are
A TYPOLOGY OF CULTURAL HERITAGE ATTRACTION VISITORS
 University of Massachusetts Amherst ScholarWorks@UMass Amherst Tourism Travel and Research Association: Advancing Tourism Research Globally 2007 ttra International Conference A TYPOLOGY OF CULTURAL HERITAGE
Performance Criteria for Assessing Airport Expansion Alternatives for the London Region
 Performance Criteria for Assessing Airport Expansion Alternatives for the London Region Jagoda Egeland International Transport Forum at the OECD TRB Annual Meeting 836 - Measuring Aviation System Performance:
CHAPTER 2 COUNTY PROFILE
 COUNTY PROFILE CHAPTER 2: COUNTY PROFILE This chapter provides a profile of Amador County, California, in the planning context of parks and recreation services. This profile includes a description of the
Rebuilding NSW. Joint Community Consultation Submission
 Rebuilding NSW Joint Community Consultation Submission Content Introduction... 3 Background Information... 4 Consultation Major Themes... 4 Making Space for Larger & Growing Businesses... 4 Connectivity...
Who does what? Tourism operations at local and regional levels. In many regional centres there can be confusion about who does what in tourism.
 Who does what? Tourism operations at local and regional levels In many regional centres there can be confusion about who does what in tourism. Some perceive tourism as just being about product or visitor
visitor insights 2016
 visitor insights 2016 table of contents Purpose of Report 3 Surf Coast Data Regions 3 Maps 3 Executive Summary 4 Summary of Total Visitation to Surf Coast 5 Total Visitation and Visitor Nights 5 Total
Ireland. Tourism in the economy. Tourism governance and funding
 Ireland Tourism in the economy Tourism is one of Ireland s most important economic sectors and has significant potential to play a further role in Ireland s economic renewal. In 2014, spending by visitors
From: OECD Tourism Trends and Policies Access the complete publication at: Ireland
 From: OECD Tourism Trends and Policies 2014 Access the complete publication at: http://dx.doi.org/10.1787/tour-2014-en Ireland Please cite this chapter as: OECD (2014), Ireland, in OECD Tourism Trends
Communication and consultation protocol
 Communication and consultation protocol Airservices Australia 2011 This work is copyright. Apart from any use as permitted under the Copyright Act 1968, no part may be reproduced by any process without
Escape to the cities for best quality of life
 MEDIA RELEASE Embargoed until 12:01am Wednesday August 20 2008 Escape to the cities for best quality of life Kingborough in southern Hobart has the best quality of life in Tasmania The lowest quality of
REAUTHORISATION OF THE ALLIANCE BETWEEN AIR NEW ZEALAND AND CATHAY PACIFIC
 Chair Cabinet Economic Growth and Infrastructure Committee Office of the Minister of Transport REAUTHORISATION OF THE ALLIANCE BETWEEN AIR NEW ZEALAND AND CATHAY PACIFIC Proposal 1. I propose that the
T A S M A N I A N G A M B L I N G S E I S I S S U E S P A P E R. Background on the Social and Economic Impact Study of Gambling
 T A S M A N I A N G A M B L I N G S E I S I S S U E S P A P E R Overview of this issues paper This document is an issues paper and public submission invitation as part of the 2017 Social and Economic Impact
Tayside. Skills Assessment January SDS-1186-Feb16
 Tayside Skills Assessment January 2016 SDS-1186-Feb16 Acknowledgement The Regional Skills Assessment Steering Group (Skills Development Scotland, Scottish Enterprise, the Scottish Funding Council and the
East West Rail Consortium
 East West Rail Consortium EWR Wider Economic Case: Refresh 18 th November 2015 Rupert Dyer Rail Expertise Ltd Rail Expertise Ltd. Tel: 01543 493533 Email: info@railexpertise.co.uk 1 Introduction 1.1 The