Preparatory Survey on the Project for Nadzab (Lae) Airport Rehabilitation in. Final Report
|
|
|
- Douglas Sparks
- 5 years ago
- Views:
Transcription
1 National Airports Corporation () Preparatory Survey on the Project for Nadzab (Lae) Airport Rehabilitation in Final Report March 2015 Japan International Cooperation Agency () Japan Airport Consultants, Inc. (JAC) Azusa Sekkei Co., Ltd. (AZS) Oriental Consultants Global Co., Ltd. (OCG) PN CR
2 1USD=108.1Yen 1USD=2.245PGK 1PGK = 48.2 Yen December 2014
3 SUMMARY 1. General, with its population of 7.17 million in 2012, consists of more than 600 islands including eastern half of New Guinea Island (main island) as well as Islands of Bismarck, New Britain, Louisilade, etc. In addition, the main island has a complex chain of mountain ranges consisting of Bismarck and Owen Stanley Ranges (highest elevation 3000m to 4000m), which divide the main island to the north and south. Surface of the country other than mountain is covered by deep rain forest. Due to the harsh topographic conditions, there are still several missing links in the trunk line road network in Papua New Guinea. Therefore, the air transport plays its vital role in transportation of people in Papua New Guinea. The city of Lae (population in 2011 Census was about 149 thousand), the second largest city after the capital city of Port Moresby (population in 2011 Census was about 364 thousand), has the port of Lae which handles the largest volume of cargo in Papua New Guinea. Lae is connected by the Highland Highway with Highland area where abundant agricultural products are grown and several natural resource developments are ongoing. Lae is recognized as one of the industrial and logistic centers in Papua New Guinea, but it is connected with Port Moresby only by the air and sea. Figure 1-1 Map of Papua New Guinea Nadzab Airport, located approximately 35km to the west-north-west of Lae, is the second largest airport in Papua New Guinea, having 2438-m long runway. Nadzab Airport handled approximately 300 thousand domestic passengers in 2012, and its average annual growth rate from 2008 to 2012 reached 13%. However, Nadzab Airport has several deficiencies as listed below: 1
4 Existing runway width of 30m is not sufficient to accommodate B737 type aircraft; Pavement strength of the runway, taxiway and apron is not sufficient to accommodate B737 type aircraft; The passenger terminal building is outdated and short of capacity. Therefore, it is not capable of accommodating the increasing air traffic demand properly and efficiently. Highland Highway Eastern Highland City of Lae Nadzab Airport Figure 1-2 Location of Nadzab Airport, City of Lae and Highland Area Under such circumstance, the Government of Papua New Guinea has been considering a possibility to borrow Yen Loan for rehabilitation of Nadzab Airport, and decided to implement the Preparatory Survey on the Project for Nadzab (Lae) Airport Rehabilitation in Papua New Guinea (hereinafter referred to as the Preparatory Survey ). It should be clearly understood that, although results of the Preparatory Survey will be used as the basis for subsequent project appraisal by, the scope of the Project covered by Yen Loan is to be finally decided during the course of the appraisal and shall not necessarily be the same as the results of the Preparatory Survey. It should also be so understood that the decision to implement the Project under Yen Loan will be made by way of bilateral agreement between the Government of Japan and the Government of Papua New Guinea. 2
5 2. Background and Need of the Project 2.1 General Information of Papua New Guinea 1) Regions and Provinces Papua New Guinea consists of four regions and the regions are further divided into one capital district and 22 provinces as shown in Figure and Table Nadzab/Lae Airport is located in Morobe Province (numbered 11 below). Figure Provinces of Papua New Guinea Table Regions and Provinces of Papua New Guinea No. Province Capital Region No. Province Capital Region 1 Central Port Moresby Southern 12 New Ireland Kavieng Islands 2 Chimbu Kundiawa Highlands 13 Northern Popondetta Southern 3 Eastern Highlands Goroka Highlands 14 AR *1 of Bougainville Arawa Islands 4 East New Britain Kokopo Islands 15 Southern Highlands Mendi Highlands 5 East Sepik Wewak Momase 16 Western Daru Southern 6 Enga Wabag Highlands 17 Western Highlands Mount Hagen Highlands 7 Gulf Kerema Southern 18 West New Britain Kimbe Islands 8 Madang Madang Momase 19 West Sepik Vanimo Momase 9 Manus Lorengau Islands 20 NCD *2 Port Moresby Southern 10 Milne Bay Alotau Southern 21 Hela Tari Highlands 11 Morobe Lae Momase 22 Jiwaka Minj Highlands Note. AR *1 : Autonomous Region, NCD *2 : National Capital District 3
6 2) Major Socio-economic Indices Tables and show major socio-economic indices of Papua New Guinea. GDP at 1998 constant price stagnated from 1996 to 2007 (growth rate 1.6%), followed by a sharp increase thereafter (7.8%). The population increased almost constantly from 1996 to 2012 at around 2.4 to 2.5%. As a result, GDP per Capita decreased or stagnated from 1996 to 2007, followed by annual 5.3% increase. Table Major Socio-economic Indices of Papua New Guinea GDP GDP per Capita Population Year Kina Change Kina USD Person (billion) (%) (million) ,715 1, ,566 1, , , , , , , , , , ,561 1, ,627 1, ,688 1, ,773 1, ,914 1, ,019 2, Constant Price Current Price Source: IMF, World Economic Outlook Database, April 2014 Table Average Annual Growth Rates of Real GDP Period Total GDP GDP per Capita Population % -0.9% 2.5% % 5.3% 2.4% Table shows GDP growth rates of industrial sectors and their share in total GDP. Since 2006, the construction sector was the driving force of economic growth. The construction sector GDP increased at annual growth rates of 15.1% from 2003 to 2012 and 21.7% from 2008 to 2012 respectively, expanding its share in total GDP from 11.7% in 2006 to 16.7% in
7 Table Sectoral GDP Growth Rates and Share Item Year Total Agriculture Mining Manufac. Electricity Gas & Water Construction Trade Transport & Communication Finance Public Administration Others % -0.2% -1.8% 2.3% 1.7% 3.2% 3.2% 2.6% -3.4% -2.4% 1.0% % 5.6% 1.2% 8.3% 5.1% 4.8% 3.5% 3.0% 10.2% 2.0% 21.7% % 1.0% -8.5% 4.0% 1.3% 12.0% 8.4% 5.0% 9.7% 3.0% 12.4% % 4.2% -0.1% 6.0% 4.0% 16.0% 10.0% 41.3% 5.0% 4.0% 30.2% Growth Rates % 4.3% -1.4% 6.0% 6.8% 15.0% 7.0% 39.9% 6.0% 3.0% 6.5% % 0.7% -1.7% 0.2% 7.5% 19.8% 9.5% 29.0% 15.0% 3.0% 7.3% % 2.9% -2.0% 14.0% 9.4% 17.1% 12.6% 20.1% 9.5% 3.3% 4.9% % 8.6% -11.8% 13.0% 9.5% 26.0% 18.0% 16.0% 20.1% 5.0% 3.9% % 0.2% 0.6% 10.0% 12.0% 24.0% 15.0% 16.0% 10.0% 6.0% 4.7% % 3.0% -2.9% 7.0% 6.3% 15.1% 9.6% 18.4% 8.9% 3.0% 9.9% % 3.0% -3.8% 9.2% 9.6% 21.7% 13.7% 20.2% 13.6% 4.3% 5.2% % 37.6% 11.7% 7.7% 1.5% 11.7% 7.1% 2.6% 4.1% 13.2% 2.7% Share % 32.5% 8.5% 7.5% 1.5% 16.7% 7.9% 6.2% 4.5% 11.5% 3.3% Data source: Key Indicators for Asia and Pacific 2013, ADB 5
8 2.2 Current Conditions and Issues of Aviation Sector in Papua New Guinea 1) General Air Transport Structure Figure illustrates the general structure of the institutions in the transport sector at national level. The Department of Transport (DOT) has the primary responsibility for the transport sector, headed by the Secretary for Transport under the Minister. P a S M M i i n ( ( T S r S B e B o B c o a D E e E x E p x e S t G S o t T v a ( N ( ( D C C O A N i r P o l C L e g P P u b Figure Institutional Structure of the Transport Sector Source: National Transport Strategy Volume 3: Detailed Strategy 6
9 2) Air Transport Sector Structure Figure shows the present structure of the government agencies in civil aviation. The governing legislation is the Civil Aviation Act 2000, which is shortly to be amended to reflect all of the institutional changes, for which the minister of civil aviation is the responsible minister. The recently formed Civil Aviation Safety Authority (CASA) is the principal regulatory agency in the sector and is responsible for safety certification of air operators, aircraft, air crew, air traffic controllers and airports. PNG Air Services Ltd. (PNGASL) is the State Owned Enterprise (SOE) responsible for providing, maintaining and developing air navigation and airways services infrastructure. PNGASL also coordinates aviation search and rescue. National Airports Corporation () is the SOE responsible for the operation, maintenance and development of 21 national government owned airports. The Accident Investigation Commission (AIC) is a recently formed body responsible for investigation of the circumstances of air accidents on a no fault basis with a view to future prevention. Minister for Transport Minister for Civil Aviation Secretary for Transport Civil Aviation Safety Authority (CASA) Board PNG Air Services Ltd. (PNGASL) Board National Airports Corporation () Board Accident Investigation Commission (AIC) DOT Policy & Planning Wing DOT Air Transportation Division DOT Transport Secretary Unit CASA Executive PNGASL Executive Executive AIC Executive - Ministerial advice - Policy and Planning - Sector Monitoring - Budget Coordination - Air transport regulation - International air agreement negotiation - Air service licensing - Policy and regulatory enforcement for aviation security - Civil aviation safety regulatory enforcement and monitoring - Airport and aerodrome operation certification - Air crew certification - Airlines certification - Air traffic controller training and certification - Provision of air navigation and airways services - Maintenance, development and asset management of national government owned airports - Investigation of the circumstances and causes of air accidents and incidents with a view to future prevention Figure Institutional Structure of Air Transport Sector Source: National Transport Strategy Volume 3: Detailed Strategy 7
10 3) National Airports Corporation National Airports Corporation () is a state-owned enterprise established under the Civil Aviation Act as amended. evolved from airport division function of the former Civil Aviation Authority (CAA) through NEC approved Civil Aviation Authority Reform Program that separated the regulatory functions from the commercial functions of former CAA. operates and maintains 22 national airports including Port Moresby International Airport and Nadzab Airport. was registered in October 2009 and started its operation on 1 st April There are 417 staff force in as of October Under the Board, is headed by the Managing Director and CEO, and there are six major functional organizations consisting of: i) Corporate services; ii) Finance; iii) Operations; iv) CADIP Project; v) Commercial; and vi) Strategic Planning and Development. Board Managing Director & CEO Company Secretary & Executive Officer Executive Secretary Internal Audit Unit General Manager Corporate Services Finance Manager Group General Manager Operations Director CADIP Projects General Manager Commercial Strategic Planning & Development Unit General Manager Regional Airports General Manager PMIA AVSEC Policy & Compliance Consultant Chief Fire Officer Engineering Services Figure General Organizational Structure of as of (Source: ) The revenues from operation, which accounted for more than 95% of the total revenues, have almost doubled in 3 years from PGK 46.3 million in 2010 to 91.1 million in The total expenses increased by approximately 70% from PGK 52.7 million in 2010 to PGK 89.8 million in As a result, operated at loss from trading in 2010 and 2012 but turned to positive in The accumulated operating loss from trading decreased from maximum PGK 8.9 million 8
11 (negative) in 2012 to PGK 4.5 million (negative) in Meanwhile, received grants from the Government of Papua New Guinea, Australian Aid, Esso Highlands and Air Niugini, especially in an amount of PGK 45.3 million in 2013 and the operating profit before income tax in 2013 was PGK 49.8 million. These grants are for capital investment program for. Table Profit and Loss of (Summary: Million PGK) Item Total Revenues Revenue from Operations Other Incomes Total Expenses Expenses for Finance & Administration Expenses for Operations Operating Profit (Loss) from Trading (5.2) 1.9 (5.6) 4.5 Accumulated Profit/Loss from Trading (5.2) (3.3) (8.9) (4.4) Nonoperational Income (Grants) Operating Profit (Loss) before Income Tax (0.4) 49.8 Source: National Airports Corporation 9
12 4) Air Transportation Services and Operations [International] The main international carrier is the government-owned airline Air Niugini (ANG) which operates bulk of international services and routes. ANG currently operates B AER, B /800, Fokker F100 and Bombardier Q400 aircraft on its international services. International scheduled services currently available at Port Moresby are: Air Niugini; Singapore, Brisbane, Cairns, Nandi, Honiara, Hong Kong, Manila, Narita and Sydney. Qantas Link; Cairns. Virgin Australia; Brisbane. [Domestic] There are following four airlines, among other very small airlines, operating domestic scheduled services at Port Moresby and Nadzab Airports: Air Niugini; Airlines PNG; Travel Air; and North Coast. The domestic air networks at Port Moresby and Nadzab by each of the above-listed airlines are shown in Figure Figure International Air Network to/from Port Moresby 10
13 Network to/from Port Moresby Airport Network to/from Lae Airport Air Niugini Air Niugini Airlines PNG Airlines PNG Travel Air Travel Air North Coast Aviation North Coast Aviation Source: Flight Schedule of each airline Figure Domestic Air Networks at Port Moresby and Nadzab 11
14 5) Nadzab Airport Nadzab Airport is the second busiest airport in Papua New Guinea after Port Moresby. Nadzab Airport is being operated and maintained by National Airports Corporation except for the CNS/ATM which is under responsibility of PNGASL. Majority of the airport facilities were developed during 1970 and now are aged and deteriorated. Currently there are four airlines operating at Nadzab Airport, however historical passenger movements data are only available for Air Niugini and Airlines PNG because Travel Air and North Coast started their operations at Nadzab recently. Table and Figure show passenger movements record of Air Niugini and Airlines PNG at Nadzab Airport. Table Historical Domestic Passengers at Nadzab Year Passengers Lae Change % % % % % % % % % Source: Air Niugini, Airlines PNG Figure Historical Domestic Passengers at Nadzab Airport Source: Air Niugini, Airlines PNG The existing condition of airport facilities at Nadzab Airport is summarized in Table Majority of the airport facilities were developed about 40 years ago to accommodate F28 class aircraft. Therefore, the old and outdated facilities and equipment are already deteriorated and require rehabilitation and/or reconstruction even to accommodate the aircraft currently operating at Nadzab such as F100, Q400, etc. 12
15 Table Summary Description of Existing Facilities at Nadzab Airport Items Description ICAO Aerodrome Reference Code 4C Aerodrome Reference Point 06 o S 146 o E Elevation 71.0 m Reference Temperature 34.0 degree Celsius Operational Hours 24 hours Runway 09/27 Dimension 2,438 m x 30 m (3m asphalt shoulder on both sides) Surface Asphalt concrete Strength PCN 30/F/B/X/U Longitudinal Slope 0.3 % Stopway (RWY 09) Dimension W = 30 m, L=60 m Surface Asphalt concrete Stopway (RWY 27) Dimension W = 30 m, L=60 m Surface Asphalt concrete Clearway (RWY 09) Dimension - Clearway (RWY 27) Dimension - Runway Strip Dimension 2,560 m x 150 m Parallel Taxiway Width 15 m (3m asphalt shoulder on both sides) (by Drawing) Surface Asphalt concrete Stub Taxiway Width 15 m (3m asphalt shoulder on both sides) (by Drawing) Surface Asphalt concrete Main Loading Apron Number of aircraft stands 6 stands (5 for small aircraft and 1 for B737) Dimension/Area 430m X 90m =38,700 m 2 (by CAD) Surface Asphalt concrete CNS/ATM ATC services Being provided by PNGASL at Control Tower Navigation VOR/DME installed in 2011 Aeronautical Ground Approach Lights Not provided. Lights PAPI Provided for both approach runways in good condition. RWY lights, TWY lights, apron flood lights, etc. Majority of the existing lights procured/ installed about 40 years ago, requiring replacement. Passenger Building (PTB) Terminal Summary Single level terminal with floor space of approx. 2,600 m 2 built in around 1976, old and deteriorated. Cargo Handling Currently undertaken inside PTB Control Tower Summary Although serious deterioration or damage to the basic structure is not recognized, deterioration appears at some part and elements of the tower. Rescue & Fire-fighting Summary Visibility to the airside is very much limited. Building is Station old and deteriorated, and inappropriately located facing parallel to the runway. Fire alarm, monitoring, communication system and fire-fighting water supply not properly working. Administration Building Summary Space is enough but communication, monitoring and control system does not work anymore. Potable Water/Sewage Water/Engine Generators Generally very old/outdated and require improvement. Access Road Summary 3.4-m wide single lane on each side. Pavement surface is now in good condition but will require resurfacing in short to medium-term. Drainage facilities need to be provided. Circulation Road and Car Park New circulation road and car park should be provided based on the terminal area improvement plan. 13
16 2.3 Airport Traffic Forecast 1) Domestic Passengers and Aircraft Movements Domestic passenger and aircraft movement forecast has been carried out based on the following: i) Real GDP record by industrial sector published by ADB has been used as the base economic data. Total GDP and non-mineral GDP have been tested for appropriateness as the explanatory variable. ii) Passenger movement record of Air Niugini and Airlines PNG from 2003 to 2012 has been used as the base traffic data. Conversion from the base data to total including Travel Air and North Coast has been made using the 2012 record. iii) Based on the base economic and traffic data, regression analyses have been carried out to obtain the future domestic air passenger demand forecasting model. As a result, the linear type model with total GDP as the explanatory parameter has been employed. iv) Future growth of the total GDP has been assumed based on the future projections by the IMF and ADB as well as the Government of Papua New Guinea (GPNG) as shown below: Year GDP Growth Rate References % Projected in IMF World Economic % Outlook % IMF/ADB (rounded) 2016 and after 3.3% Average of IMF and GPNG Estimates v) Based on the linear type forecasting model as well as the assumed future growth rates of the total GDP, future domestic air passenger demand at Nadzab Airport has been estimated: vi) Peak-day and peak-hour factors have been assumed to be 1/326 (peak-day) and 0.13 (peak-hour) respectively. vii) Domestic aircraft movements have been estimated based on the assumed passenger share by airlines, share of routes of each airline, average seat capacity and average load factors of the aircraft. 14
17 viii) Estimated annual, peak-day and peak-hour domestic passenger movements are as shown below: Year Annual Domestic Peak-day Domestic Peak-hour Domestic Passengers Passengers Passengers (Two-way) ,000 1, ,000 2, ,000 2, ix) Estimated peak-day domestic aircraft movements are as shown below: Aircraft Typical Seat Capacity B seater/ATR72 75/ F Britain Norman (BN) Total x) Estimated peak-hour domestic aircraft movements are as shown below: Aircraft Type B seater, ATR F Britain Norman (BN) Total
18 2) International Passenger and Aircraft Movements International passenger and aircraft movement forecast has been carried out based on the following: i) As any scheduled international passenger flight is currently not operated at Nadzab Airport, potential international passenger demand has been estimated based on the following two data; a) Daily number of Nadzab-departed domestic passengers for seven days a week who transferred to international flights at Port Moresby (based on data provided by Air Niugini). b) Daily number of international departing passengers for seven days a week at Port Moresby who originated their trips at Nadzab (based on the interview survey at Port Moresby for a week). ii) Based on the data item a) of i) above as well as the result of domestic passenger forecast (Air Niugini passengers), daily potential international passenger demand for seven days a week (Case 1) has been estimated. iii) Based on the international passenger movement record as well as the assumed future total GDP, the future international passenger traffic demand at Port Moresby has been estimated, and then based on the interview survey data potential daily international passenger demand at Nadzab Airport for seven days a week (Case 2) has been estimated. iv) The figures obtained as Cases 1 and 2 have been averaged to obtain the future daily international passenger demand at Nadzab Airport for seven days a week by destinations. v) Departing flights on specific days of a week when load factor of not less than 60% may be expected has been assumed to be viable for international scheduled operations. Scheduled operations to Brisbane by B737 from 2021 and to Cairns by 70-seater aircraft from 2026 on Thursday and/or Friday are expected to be viable. vi) The return flights have been assumed to be from Brisbane/Cairns to Port Moresby via Nadzab on Monday or Tuesday. vii) Result of the international passenger movement forecast is summarized as shown in the table below: 16
19 Year Route Dep./Arr. Aircraft Weekly Passengers (Aircraft Movements) Mon. or Tue. Thurs. Fri. Total Annual Passengers Brisbane Cairns Total Brisbane Cairns Total Brisbane Cairns Total Dep (1) 120 (1) 6,200 B737 Arr. 120 (1) (1) 6,200 Dep seater Arr Dep (1) 120 (1) 6,200 - Arr. 120 (1) (1) 6,200 Dep (1) 140 (1) 7,300 B737 Arr. 140 (1) (1) 7,300 Dep (1) 50 (1) 2, seater Arr. 50 (1) (1) 2,600 Dep (2) 190 (2) 9,900 - Arr. 190 (2) (2) 9,900 Dep (1) 140 (1) 240 (2) 12,500 B737 Arr. 240 (2) (2) 12,500 Dep (1) 60 (1) 3, seater Arr. 60(1) (1) 3,100 Dep (1) 200 (2) 300 (3) 15,600 - Arr. 300 (3) (3) 15,600 3) Air Cargo Movements The future air cargo movements at Nadzab Airport have been estimated based on the average volumes of air cargo per passenger on the flights between Nadzab and Port Moresby (0.01 t/pax.) as well as between Nadzab and other than Port Moresby (0.005 t/pax.). 4) Airport Access Traffic Airport access traffic forecast has been carried out based on the following assumptions: Number of well-wishers per passenger (base on the interview survey); Number of airport staff per passenger (based on the current number); Assumed modal split ratios of the passengers and well-wishers as well as the airport staff are as shown below (base on the interview survey); [Passengers and Well-wishers] Private Car PMV Coach 66% 24% 10% 17
20 [Airport Staff] Private Car PMV 48% 52% Note. PMV: Public Motor Vehicle Assumed average number of passengers per vehicle as shown below; Private Car PMV Coach It has been estimated that daily number of the airport access vehicles would reach approximately 1380 in 2026 and 1620 in 2031 respectively which can be accommodated by the two-lane airport access road. 18
21 2.4 Status and Role of Nadzab Airport in National Development Plan There are two major national development plans of Papua New Guinea as follows: i) National Development Strategy Plan published by Department of National Planning and Monitoring in March 2010 as the guide to success. ii) Medium-term Development Plan; the first 5-year medium-term development plan for realization of the targets stipulated in the National Development Strategy Plan National Development Strategy Plan stipulated that International airport may also be required near cities such as Lae that are important hubs for international business. According to the Medium-term Development Plan, Regional airports will be upgraded to allow higher seating capacity jets to cater for the anticipated increase in the number of passengers as a result of increased economic activities. According to the National Transport Strategy Volume 3 Detailed Strategy dated July 2013, the latest transport development strategy prepared by the Department of Transport, Nadzab was expected to be: i) One of two long range international airports as an alternate diversion airport for PMIA; and ii) Upgraded to medium range regional standard by In summary, it is considered reasonable to assume future role of Nadzab Airport as one of the regional airports: a) Capable of accommodating short to medium range international and domestic operations by B class aircraft; b) Alternative to Port Moresby International Airport in case of its temporary closure due to bad weather, etc. 19
22 2.5 Related Projects funded by ADB and Others 1) Civil Aviation Development Investment Program (CADIP) In order to address development challenges of 21 national airports in Papua New Guinea, the Civil Aviation Development Invest Program (CADIP) has been adopted by the Government of Papua New Guinea. CADIP will involve (i) devoting four or more tranches of the Multitranche Financing Facility (MFF) to improving compliance with the safety and security standards of the International Civil Aviation Organization; (ii) designing and supervising airport improvements, and preparing and administering long-term maintenance contracts for all the national airports; and (iii) monitoring the socioeconomic benefits from the operating and maintenance improvements in the national airports. According to ADB document and National Transport Strategy, CADIP will be implemented in four phases, while Phase I being implemented involves improvement of following five airports: i) Port Moresby (domestic apron, CNS/ATM, fire tenders); ii) Mount Hagen Stage 1 (runway repair, new terminal); iii) Hoskins Stage 1 (runway repair, security fence); iv) Wewak Stage 1 (runway repair, security fence); and v) Gurney Stage 1 (runway repair, security fence). 2) CNS/ATM Modernization Project by PNG Air Services Limited (PNGASL) PNGASL has been implementing component projects based on its Communications, Navigations, Surveillance and Air Traffic Management (CNS/ATM) Modernization Project, which is based on PNGASL s Strategic Development Plan The modernization is being undertaken in system component projects based on donor funding allocations. The three main agencies providing funds to support PNGASL CNS/ATM Modernization Program are the Government of Papua New Guinea through annual Public Investment Program (PIP) Budget, Australian Aid and ADB MFF through the Civil Aviation Development Improvement Program (CADIP). For Nadzab Airport, the engine generator has already been replaced under this project. Installation of new duplicated HF farms at two identified sites within the airport boundary at Nadzab is to be implemented under the project. PNGASL is planning to refurbish the control tower at Nadzab Airport and seeking for funding. 20
23 2.6 Need and Target of Nadzab Airport Rehabilitation Project Majority of the existing facilities, equipment and services at Nadzab Airport are obsolete and deteriorated and they need to be rehabilitated as soon as possible in order to maintain the current level of services. In addition to the rehabilitation of the existing facilities, etc., Nadzab Airport needs to be upgraded to accommodate the increasing domestic passenger/cargo demand as well as the potential international passenger demand in future. The National Development Plans as well as the National Transport Strategy expected that Nadzab Airport would accommodate short to medium range international and domestic operations by B class aircraft and to be developed as an alternate international airport for Port Moresby. These roles and functions expected for Nadzab Airport can be supported by the forecast domestic and international air passenger demand. In conclusion, the target of Nadzab Airport Rehabilitation Project (the Project) may be defined based on its future roles mentioned above as upgrading: To the second international airport offering short to medium-haul scheduled flights by up to B737; As the second busiest domestic airport capable of accommodating up to B737 (to be upgraded from current F100); and To an alternate airport for Port Moresby International Airport. 21
24 3. Summary Description of the Project 3.1 Objective of the Project To rehabilitate and improve the facilities, equipment and utilities of Nadzab Airport, thus achieving following project targets: To the second international airport offering short to medium-haul scheduled flights by up to B737; To expand transport capacity as the second busiest domestic airport capable of accommodating up to B737 (to be upgraded from current F100); and To an alternate airport for Port Moresby International Airport. 3.2 Project Site Nadzab Airport located approximately 35km to the west-north-west of Lae in Morobe Province, the. 3.3 Description of the Project 1) Construction Works Construction works consist of the following items: [Eligible Portion for Financing] i) Widening to 45m and pavement reinforcement of the existing runway; ii) Widening to 23m and pavement reinforcement of the existing taxiway B (partial) and the taxiway C as well as the parallel taxiway C (partial); iii) Construction of a new 23-m wide stub taxiway; iv) Construction of a new cement concrete apron; v) Pavement rehabilitation of other existing taxiways and existing apron; vi) Rehabilitation of the existing airport access road; vii) Installation of Simple Approach Lights (both approach runways); viii) Replacement of the runway lights, taxiway lights and apron flood lights; ix) Replacement of the control and monitoring system for aeronautical ground lights; x) Construction of a new passenger terminal building; xi) Refurbishment of the existing terminal building for cargo handling; xii) Construction of a new administration building; xiii) Construction of a new rescue and fire-fighting station and provision of a fire fighting vehicle; xiv) Refurbishment of the existing control tower; xv) Improvement of utilities. 22
25 [Eligible Portion for Financing] i) Improvement and Extension of Erap River Embankment 2) Consulting Services In order to achieve the efficient and proper preparation and implementation of the Project, following services should be provided by an international consulting firm: Part 1: Detailed Design and Preparation of Bid Documents; Part 2: Assistance in Bidding; Part 3: Construction Supervision; Part 4: Maintenance Supervision; Part 5: Assistance in Environmental Management; Part 6: Assistance in Reporting to ; and Part 7: Technology Transfer. 23
26 3.4 Project Cost and Source of Fund 1) Total Project Cost The estimated total project cost including the physical and price contingencies as well as the Project Management Unit cost, taxes and duties is JPY 36,349 million (equivalent to PGK 754 million), while the project cost eligible for financing is JPY 27,734 million (equivalent to PGK 575 million) as tabulated below: Item FC LC Converted Total Million JPY Million PGK Million JPY Million PGK A. Eligible Portion Construction Works 9, , Consulting Services 1, , Subtotal A 10, , B. Non-eligible Portion Construction Works Land Acquisition Administration Cost GST & Corporate Tax , Import Tax Subtotal B , Total (A+B) 10, , C. Interest during Construction D. Front End Fee Grand Total (A+B+C+D) 11, , Finance Portion (A+C+D) 11, , ) Expected Source of Fund All of the finance portion including the interest during construction will be covered by Japanese ODA Loan (STEP Loan) while the non-eligible portion should be covered by the Government of Papua New Guinea. 24
27 3.5 Project Implementation Schedule Assuming that STEP Loan is the source of fund for the Project and given the required lead time period for the financial arrangement and procurement processes, following project implementation schedule may be envisaged: i) Project appraisal by ; early 2015 followed by prior notification by Japanese Government to Papua New Guinean Government on extension of Japanese ODA Loan. ii) Exchange of Notes (E/N) and Loan Agreement; first half of iii) Selection of design and supervision consultant by including concurrence by ; from middle of 2015 to early iv) Commencement of the consulting services; early v) Design and tender documentation from early 2016 to early vi) Selection of the contractor from first half of 2017 to early vii) Construction works for 30 months from early 2018 to the second half of 2020 followed by 12-month defect notification period. 3.6 STEP Loan and Procurement 1) STEP Loan It has been proposed that the Project should be implemented in close cooperation between the Government of Papua New Guinea and the Government of Japan through extension of Japanese ODA Loan; more specifically Special Terms for Economic Partnership (STEP) through Japan International Cooperation Agency. STEP covers 100% of the eligible portion of the project cost mainly consisting of the consultant service cost and construction cost including the physical and price contingencies. The costs for the rehabilitation and extension of Erap River embankment and Project Management Unit (PMU) as well as taxes and duties should be borne by the Government of Papua New Guinea and/or National Airports Corporation (). Condition for procurement of the consulting services as well as the goods and services (construction works) is Japan tide, and not less than thirty percent (30%) of the total price of contracts (excluding consulting services) financed by a STEP loan shall be accounted for by goods from Japan and services provided by a Japanese company(ies). 2) Rules for Procurement of Consulting Services as well as Goods and Services The employment of consultants and procurement of goods and services (construction works) under the Project financed by Japanese ODA Loan from Japan International Cooperation Agency () is to be carried out in accordance with the general principles and procedures laid down in the Guidelines for the Employment of Consultants under Japanese ODA Loan and the Guidelines for Procurement under Japanese ODA Loans. 25
28 3) Expected Ratio of Goods and Services from Japan Cement, asphalt (bitumen), major construction equipment, majority of building construction materials, some of the underground cables and ducts as well as fire tender and the overhead are expected to be procured from Japan. Expected ration of the goods and services from Japan is about 47%. 3.7 Method of Construction In order to carry out the pavement widening and reinforcement/rehabilitation works on the existing runway, taxiways and apron while keeping them operational, the asphalt overlay will be employed. The new apron will be of cement concrete pavement. The pavement works and aeronautical ground lighting works on the runway will be carried out phase by phase, involving partial closure of the runway while maintaining aircraft operations; for example the western part of the runway is to be kept operational when the works are conducted on the eastern part during daytime. The works on the central part of the runway need to be conducted during the nighttime. The works on the taxiways and apron will be conducted during the daytime as much as possible. As the soil underneath the new passenger terminal building has adequate bearing capacity to support the design load, the new passenger terminal building will be of a spread foundation. As for the building structure, steel construction is deemed appropriate at this point of planning because of the following: Low risk of saline corrosion due to its inland location; Long span structure may be employed; Local contractors are familiar with this type of structure; and Shorter construction period than RC structure. After the new passenger terminal building is completed and passenger handling transferred, the existing passenger terminal building is to be refurbished for cargo handling. The other works are to be scheduled accordingly to complete the entire works within 30 months. 26
29 3.8 Project Implementation Organization National Airport Corporation () is the project executing agency. currently has 417 staff force in total. has been implementing the Civil Aviation Development Investment Program (CADIP), financed by ADB, for which organized a Project Management Unit, supported by an engineering consultant. For implementation of Nadzab Airport Rehabilitation Project, will organize a Project Management Unit (PMU) similarly to CADIP, consisting of a project director, technical and administrative staff. PMU will be assisted by an international consultant. 3.9 Operation and Maintenance after Project Implementation Currently Nadzab has four major functions and 38 staff members; the logistic support and administration, technical services response team, ground services and emergency services, headed by the Operations Manager. Nadzab has been experiencing several difficulties related to the operation and maintenance budget, gaps in the technical experiences between senior and junior staff and less opportunity for training and familiarization to the modern technology. For operation and maintenance of Nadzab Airport after implementation of the Project, adequate number of staff should be stationed to operate the airport as an international alternate airport and the staff should be given necessary training and familiarization to operate and maintain the new facilities, equipment and services. At the same time, adequate amounts of budget should be made available for preventive maintenance, immediate repair as well as for staff training. 27
30 3.10 Environmental Impact and Social Consideration 1) Baseline of the Environmental and Social Condition a) Natural Environment Nadzab airport is located 45km northwest from Lae central city area along the Highlands highway. Surrounding area is generally flat with savannah grassland and Erap River to the west of the airport. In recent years, the flood of Erap River has become a problem in surrounding areas including Nadzab airport. The mitigation measures for the airport are studied in the survey. The climate of Nadzab is categorized in the tropical monsoon and classified into rainy season (from November to April) and dry season (from May to October). Annual average temperature is 35 degrees C in day-time and 24 in night-time at coasts, and 28 in day-time and 14 at highlands. Regardless of the classification between rainy season and dry season, rainy season differs according to the region. The annual rainfall differs from 1,200 to 9,000 mm excessively according to the region. There is neither designated natural conservation area nor identified rare species in the airport land and the vicinity. b) Social Environment According to the national census on population and housing in 2011, the population of Morobe province, in which Nadzab airport is located, is 675 thousand which is equivalent to 9.3% of national population of PNG. Morobe province is classified into 9 districts, 33 LLG (Local Level Government) and 547 wards. The population of Huon Gulf district, in which Nadzab ward is located, is 78 thousand (16 thousand households), Wampar Rural LLG is 52 thousand (11 thousand households). According to the National Gazette No.28 issued by Department of Lands and Physical Planning (DLPP), existing Nadzab airport land with large estate of 1,030 hectares is registered as a declared aerodrome land belongs to the State (Portion No.397) in There are no designated areas as cultural and historical heritage in the vicinity of the airport but there is a large scale chicken farm to the south of the airport. 2) Legislation and Institution for Environmental and Social Considerations a) Laws and Regulations There are no effluent standards such as Air quality, Water quality, Noise and Vibration in PNG. Therefore, refers WHO standards for their implementation. b) Classification of Environmental Permit and Procedure for Permit On the Environment (Prescribed Activities) Regulation 2002 in accordance with Environment Act 2000 of PNG, the prescribed activities are classified as Level 1, Level 2 (Category A or Category B) and Level 3 activities according to the content, the scale and the 28
31 location. The fees for environmental permit are designated by the activity level in the Environment (Fees and Charges) Regulation The contractor shall pay the prescribed fees during their construction period and the operator/administrator shall pay the fees during their operation period in accordance with the regulation. The upgrading and rehabilitation of existing airport is not listed as Level 2 and Level 3 of the Prescribed Activities. However certain associated project activities commonly associated with upgrading and improvement works such as earthworks, surfacing, discharge of waste water, establishment of borrow pits, sourcing and extraction of aggregate materials from surface water courses are Level 2 activities that may require an environmental permit depending on the duration and scale of those activities. For Nadzab Airport, impacts that will arise from the Airport upgrading works will be minimal and generally insignificant as construction works are within the confines of the declared aerodrome land area. The project can be classified as Level 2A because the potential adverse environmental impacts are site-specific, few if any of them are irreversible, and mitigation measures can be designed readily. Adherence to best engineering practices during rehabilitation/ reconstruction and implementation of the environmental management plan (EMP) will avoid or adequately mitigate all of the rehabilitation/ reconstruction-related impacts. c) Gap from Environmental Guideline To compare the above mentioned category of the prescribed activities with Japan International Cooperation Agency, Guidelines for Environmental and Social Considerations (effective from April 2010, hereinafter referred to as Guideline), the level 3 activities in PNG are corresponds to category A activities of guideline, which is required EIA. The level 2 activities in PNG are corresponds to category B activities of guideline, which is required IEE. The level 1 activities in PNG are corresponds to category C activities of guideline, which is not required any environmental procedures. This project can be classified as level 2A and category B as mentioned above. Therefore, study team conducts environmental and social surveys at the IEE level in accordance with TOR. 3) Analysis of Alternatives Two (2) alternatives of Option 1 and Option 2 were studied on upgrading and rehabilitation of the passenger terminal building. These impacts that will arise from the airport upgrading works will be minimal and generally insignificant as construction works are within the confines of the declared aerodrome land area. The potential adverse environmental impacts are site-specific, few if any of them are irreversible, and mitigation measures can be designed readily. These impacts on the alternatives are expected at almost the same level even though it differs according to the terminal layout and construction duration. Zero option in case the project will not be carried out brings negative impacts which prevent not only air travelling passenger and cargo traffic 29
32 development but also commercial distribution and sales channels development due to insufficient passenger terminal capacity against increasing air traffic movement in near feature even though negative impacts on natural and social environment are not expected. It is the most reasonable option with the lowest environmental and social negative impacts to utilize the existing airport for further airport development in this region. 4) Scoping Significant negative impacts by the project are not expected from the scoping result of the project evaluated from the point of view of environmental and social consideration. The negative impacts are mainly pollution during construction phase. The pollution during operation phase (e.g. air pollution, water pollution, aircraft noise and waste) is also expected by increasing airport user from upgrading and rehabilitation of existing airport. On the other hand, the positive impacts are expected to bring local employment creation during construction phase and local economic revitalization during operation phase. Furthermore, upgrading and rehabilitation of terminal building brings positive impacts on landscape around Nadzab airport. 5) Environmental Impact Assessment a) Initial Environmental Examination (IEE) IEE was carried out based on the result of survey on existing documents, interview to stakeholders and site surveys etc. According to the result, significant negative impacts by the project are not expected. The negative impacts are mainly pollution during construction phase. The pollutions during operation phase (e.g. air pollution, water pollution, aircraft noise and waste) are also expected by increasing airport user from upgrading and rehabilitation of existing airport. But the impacts that will arise from the airport upgrading works will be minimal and generally insignificant as construction works are within the confines of the declared aerodrome land area. The potential adverse environmental impacts are site-specific, few if any of them are irreversible, and mitigation measures can be designed readily. Adherence to best engineering practices during rehabilitation/ reconstruction and implementation of the Environmental Management Plan (EMP) will avoid or adequately mitigate all of the rehabilitation/ reconstruction-related impacts. b) Aircraft Noise Prediction The noise contour is stretched from the both ends of runway beyond airport boundary. In comparing the contour in 2014, 2026 and 2031, the area over Lden 62 contour is spread out from the extended line of the both ends of runway. It is, however, the severe negative impact on the local residents is not predicted since the area is mostly inside of the airport property land. 30
33 6) Environmental Management Plan As the specific construction and operational activities are not yet fully defined for the project at this stage, the Environmental Management Plan (EMP) given here provides only a general outline of the mitigation measures and monitoring that will be undertaken for the project. It will be necessary to prepare a more detailed EMP during the detailed engineering design phase of the project which needs to be incorporated into the conditions of construction contract so that the Contractor shall properly implement EMP to mitigate negative impacts associated with airport development works. 7) Environmental Monitoring Plan A general Environmental Monitoring Plan focuses only on impacts of the project that are likely to need attention and which will be incorporated into the final EMP after detailed design. A baseline survey will be conducted by the Contractor prior to commencement of construction works. The Environmental Monitoring Plan includes the main elements, including the Construction and Operations Phase of the project. 8) Frameworks Effective implementation of the Environmental Management Plan (EMP) requires an institutional setting, framework and information flows. The National Airport Corporation () as the implementing agency will be responsible for the construction phase and operation phase of the project. The responsibility for implementing the environmental management and monitoring plan will be a joint cooperation between the Contactor and. A Project Implementation Unit (PIU) will be established within the and an International Environmental Specialist (IES) and Environmental Officer (EO) will form part of the PIU. The PIU will be responsible for the daily implementation of the project. The estimated costs for the EMP that covers environmental mitigation and environmental monitoring plan during the project term (30 months) for construction period and 1 year for assistance period in the start-up of facilities and operation) are estimated at $281,500 covering environmental mitigation at $219,000 and environmental monitoring at $62,500. The EMP amount is equivalent to approx. 0.2% of the total project cost. The annual costs for the EMP on the operation phase are estimated at $23,000. The costs will be part of the budgets after completion of the project. 9) Stakeholder Meetings As described previously, this project which is assumed as low potential activities on environmental impact (Level 2A) is exempted some environmental procedures with DEC (e.g. advance notice, public hearing, and public consultation). However, official and unofficial meetings were held separately with some relevant stakeholders (e.g. government organizations, 31
34 airport operation companies, airlines, and chamber of commerce and industry) to proceed this survey appropriately. But there was no opposing view through the meetings Coordination with Other Donors Construction of the embankment for protection of flood from Erap River will be implemented as a part of the Project but as non-eligible portion for finance. The embankment works will be supervised by. The embankment site will not be overlapped with the site for the works eligible for finance. However, coordination will be required in terms of the layout of contractors facilities and storage yards, temporary construction roads, working hours and height limitation of the construction equipment and stock yards Effects of the Project 1) Quantitative Effects i) Operation and Effect Indicator Indicator Air Traffic Demand in Base Year ( CY 2014 ) (*1) Air Traffic Demand in Target Year After 2 years of commencement of service ( CY 2023 ) (*2) After 5 years of commencement of service ( CY 2026 ) (*3) Annual Air Passengers ( 000) Domestic Passengers ( 000) International Passengers ( 000) Annual Air Cargoes (MT) 2,900 5,142 5,280 Domestic Cargoes (MT) 2,900 4,980 5,100 International Cargoes (MT) Annual Aircraft Movements 10,600 18,646 20,028 Domestic Aircraft Movements 10,600 18,396 19,710 International Aircraft Movements Divert Flight from Jacksons (POM) International Airport (*1) Estimated by Study Team based on actual flight schedule and air traffic forecast (*2) Target Year (CY 2023): Implementation year for post evaluation of The Project (*3) Target Year (CY 2026): Target year for airport facility master plan ii) Economic and Financial Internal Rate of Returns a) Economic Internal Rate of Returns (EIRR) Economic Internal Rate of Return (EIRR) has been estimated as 15.7 % by calculating following terms of benefits: Saved loss of business opportunities for PNG nationals due to travel cancellation; 32
35 Saved loss of consumption by foreign tourists due to visit cancellation; Saved loss of aeronautical charges from foreign air passengers; Saved loss of domestic/international cargo trade opportunities; and Saved loss of diverted flights operating cost by local airlines. Result of Economic Analysis Indicators Calculation Economic Internal Rate of Return (EIRR) 15.7 % Economic Net Present Value (ENPV) PGK 235,776,000 Benefit Cost Ratio (BCR) 1.59 b) Financial Internal Rate of Return (FIRR) Financial Internal Rate of Return (FIRR) has been estimated as -16.8%. However, in case of excluding investment cost from financial cost, will be able to cover the operating costs by operating revenues after opening new facilities. Result of Financial Analysis (Base Case) Indicators Calculation Financial Internal Rate of Return (FIRR) -16.8% Financial Net Present Value (FNPV) PGK -419,763,000 Benefit Cost Ratio (BCR) ) Qualitative Effects Follows effects are expected through implementation of the Project: Improvement of airport safety and airport security; Making airport operations more efficient; Reducing airport congestion; Increase of CS (Customer Satisfaction); Development of economic, social and cultural activities in Morobe area and Papua New Guinea; and Increase international/global competitiveness of Papua New Guinea. 33
36 3.13 Erap River Flood Protection This report is a summary of on-site study on the effects of flood from Erap River. As official record of floods that affected the airport in the past were unavailable, it was found through interviews with stakeholders that the most memorable flood happened in early In this flood, western edge of the airport was inundated by 30cm of water, however, runway and key facilities remained above water. The banks of Erap River have since overflown every 2~3 years, however, only areas close to the banks were inundated by water 30~50cm in depth, and for a short period of the time before subsiding at the end of the rain. Record from the past 5 years, the average annual rainfall was 1,832mm, with minimum annual rainfall of 1,589mm in 2012, and maximum annual rainfall of 2,046mm in The maximum rainfall was 90mm/day, recorded in July 2009 and The catchment area of Erap River system is km2. Although rainfall and catchment area are of common scale, however the river which runs down 3,600m of elevation in approximately 62km (average gradient of 5.8%) can be found in steep stream. Improvement of disaster prevention capacity of this scale far exceeds the scope of the Airport Development Project. It is favorable that a master plan covering both erosion control further upstream of the river and the flood control downstream of the Erap Bridge is developed and implemented as necessary, should improvement of flood control is determined necessary as the Erap River basin develop in the future. However, to enhance the disaster prevention capacity of Nazab Airport facilities, improvement and extension of the existing embankment is proposed as following three phase construction. Phase Improve/ New ;Length Rough Construction Cost 1 st Phase Improvement ;1,300m PGK 4,427,000 2 nd Phase-a Newly Constructed;1,140m PGK 5,859,000 2 nd Phase-b Newly Constructed; 260m PGK 1,336,000 3 rd Phase-a Newly Constructed; 2,000m PGK 10,278,000 (3 rd Phase-b) (Newly Constructed;1,400m) (PGK 7,503,000) Remarks;3 rd phase-b is an alternative of 3 rd phase-a, which proposed from economic point of view. Probability of a 100 year flood peak (Q 100 ) in the vicinity of the airport is not mentioned in the KOICA s report which studied in 1993, however, in consideration of Q 50 and Q 100 at the Erap Bridge, which estimated in the same report as 1,200 m3/sec and 1,350 m3/sec respectively, it can be assumed that Q 100 in the vicinity of the airport is approx. 1,500 m3/sec or less. 34
37 The Cabinet Order issued by The Minister of Land, Infrastructure, Transport and Tourism (MLIT) in Japan, specify minimum requirement for the dimension of the embankment. Under this order, in case the designed flood peak volume is 500 m3/sec ~ 2,000 m3/sec, the minimum required width of the top embankment is 4m, free-board is 1m or more above estimated flood elevation, and the embankment slope is less than 50% gradient. The embankment which is planned by the has a top width of 6m, a free-board of 2m or higher, and a slope is less than 33% gradient, fulfilling the minimum requirement stated in the above mentioned order, and therefore can be considered to be safe. 35
38 Table of Contents SUMMARY SECTION 1: INTRODUCTION 1.1 General Preparatory Survey Team Organization Scope of Work Work Schedule 1-9 SECTION 2: BACKGROUND OF THE PROJECT 2.1 Papua New Guinea Socio-Economic Conditions Road Networks and Sea Ports Air Transport Sector Air Transportation Infrastructure Funding Air Transport Sector Projects Morobe Province and City of Lae Morobe Province City of Lae Existing Conditions of Nadzab/Lae Airport General Role of Nadzab Airport in Domestic Air Network Existing Airport Facilities Opinion of Business Leaders on Nadzab Airport Status and Role of Nadzab Airport in National Development Plans 2-61 SECTION 3: TOPOGRAPHIC SURVEY AND GEOTECHNICAL SURVEY 3.1 Topographic Survey General Scope of Survey Methodology Subcontractor Result of Survey Soil Investigation General Scope of Investigation Methodology Subcontractor KOICA Report 3-10 i
39 3.2.6 Results of Soil Investigation Consideration 3-17 SECTION 4: AIR TRAFFIC DEMAND FORECAST 4.1 General Methodology for Demand Forecast Projection of Socio-economic Indices Socio-Economic Indices as Forecasting Parameters Projection of Socio-economic Framework Annual Domestic Passenger Forecast Study Flow Forecasting Models and Result Domestic Peak Demand Forecast Study Flow Design Day and Peak-hour Ratio Peak Demand Domestic Aircraft Movements Forecast Study Flow Planning Factors Daily Domestic Aircraft Movements Peak-hour Domestic Aircraft Movements International Passenger Demand Forecast Current Situation of International Passengers Originated from Lae Number of International Passengers Airport Access Traffic Study Flow Planning Factors Traffic Volume Annual Air Cargo Relation between Passengers and Air Cargo Annual Air Cargo Demand Summary Result of Passenger, Cargo and Aircraft Movements Forecast 4-33 SECTION 5: VERIFICATION OF EXISTING FACILITIES AND EXAMINATION OF FACILITY REQUIREMENTS 5.1 Target of Nadzab Airport Rehabilitation Project Requirements to Enable Future Role of Nadzab/Lae Airport Planning Considerations and Parameters 5-4 ii
40 5.2.1 Planning Considerations Planning Parameters Evaluation of Existing Facilities Runway, Taxiway, Apron, Airside Storm Water Drainage and Other Facilities Terminal Facilities CNS/ATM and AGL Erap River Flooding Optional Rehabilitation Measures of Major Project Components Runway Taxiways Aircraft Parking Apron Aeronautical Ground Lights (AGL) Passenger Terminal Building Cargo Terminal Building Control Tower Rescue and Fire-fighting Station and Fire Fighting Vehicle Administration Building Utilities Aircraft Fuel Facilities Erap River Flood Protection Examination of Optional Project Scope Runway, Taxiways and Aprons and Related Facilities Terminal and Related Facilities Erap River Embankment Proposed Project Components and Preliminary Construction Cost 5-83 SECTION 6: FORMULATION OF AIRPORT MASTER REHABILITATION PLAN 6.1 Confirmation on Airside Separation Requirements Location of New Passenger Terminal Building and New Apron Runway Extension Layout of Other Major Facilities Airport Master Rehabilitation/Development Plan 6-6 SECTION 7: PRELIMINARY DESIGN 7.1 Existing Topography Runway, Taxiways, Apron and Other Civil Works Longitudinal Profile Planning Cross Sectional Planning 7-3 iii
41 7.2.3 Other Facilities Pavement Structural Planning Cost Reduction Construction Program and Schedule Availability of Basic Materials for Pavement Works Aeronautical Ground Lights (AGL) Scope of AGL Rehabilitation Aeronautical Ground Lights Works Building Works Passenger Terminal Building Cargo Terminal Building Administration Building Rescue and Fire-fighting Station Control Tower Sub Station Utility Works Eco-Airport Measures Cost Reductin Construction Logistics 7-99 SECTION 8: PORJECT IMPLEMENTATION PROGRAM 8.1 General Project Implementation Scheme General Project Implementation Scheme Summary Description of STEP Categorization of Project Scope into Eligible and Non-eligible for -financing Expected Ratio of Goods and Services from Japan Project Implementation Schedule Project Cost Estimate Preconditions Construction Cost and Consulting Service Cost 8-13 SECTION 9: PROJECT IMPLEMENTATION ORGANIZATION 9.1 Need of Project Implementation Unit (PIU) Proposed Project Implementation Unit for Nadzab Airport Rehabilitation 9-3 SECTION 10: OPERATION AND MAINTEE AFTER IMPLEMENTATION 10.1 Existing Organization of Staff Force 10-3 iv
42 10.3 Profit and Loss of Balance Sheet of Operation and Maintenance of Nadzab Airport 10-8 SECTION 11: ECONOMIC AND FINANCIAL ANALYSIS 11.1 General Assumptions Objective of Analyses With Project Case and Without Project Case Annual Air Traffic Demand for Economic and Financial Analysis Other Assumptions Economic Analysis Estimate of Economic Costs Estimate of Economic Benefits Result of Economic Analysis Sensitivity Analysis Financial Analysis Estimate of Financial Costs Estimate of Financial Revenues Result of Financial Analysis Sensitivity Analysis Repayment of Yen Loan Statement of Profit and Loss Free Cash Flow Operation and Effect Indicator Quantitative Effect Qualitative Effect SECTION 12: ENVIRONMENTAL IMPACT AND SOCIAL CONSIDERATION 12.1 Baseline of the Environmental and Social Condition Natural Environment Social Environment Legislation and Institution for Environmental and Social Considerations Laws and Regulations Classification of Environmental Permits and Procedure for Permit Gap from Environmental guideline Environmental Government Organization Scope of Environmental Permit Controlled by DEC 12-8 v
43 Land Ownership in PNG The Organization of Land Ownership Analysis of Alternatives Scoping Environmental Impact Assessment Initial Environmental Examination (IEE) Aircraft Noise Prediction Environmental Management Plan Environmental Monitoring Plan Framework Responsibilities and Authorities for Implementation of Mitigation Measures Coordination and Dialogue with stakeholders Cost for Environmental Management Plan Method of Payment Stakeholder Meetings SECTION 13: EFFECT OF FLOOD FROM ERAP RIVER 13.1 Surrounding Terrain and Previous Floods Erap River Catchment Area and Rainfall Current State of Embankment and its Effect Proposed Embankment Construction (example) 13-7 Attachments Attachment A-1 Attachment A-2 Attachment A-3 Attachment A-4 Attachment A-5 Attachment A-6 Pavement Thickness STEP Rule Draft Terms of Reference Environmental Checklist Monitoring Form Conditions of Aircraft Noise Prediction vi
44 List of Illustrations SECTION 1: INTRODUCTION Figure Map of Papua New Guinea 1-1 Figure Location of Nadzab Airport, City of Lae and Highland Area 1-2 Figure Study Procedure Flow 1 of Figure Study Procedure Flow 2 of Figure Study Procedure Flow 3 of Figure Study Procedure Flow 4 of SECTION 2: BACKGROUND OF THE PROJECT Figure Provinces of Papua New Guinea 2-1 Figure Historical Growth of GDP in PAPUA NEW GUINEA 2-3 Figure Location of Oil an LNG Projects in Papua New Guinea 2-13 Figure Schematic Diagram of PNG LNG Project 2-14 Figure Location of MMJV Project Sites 2-16 Figure Schematic Road Network in Papua New Guinea 2-21 Figure Institutional Structure of Transport Sector 2-26 Figure Institutional Structure of Air Transport Sector 2-27 Figure Networks to/from Port Moresby 2-32 Figure Shares of International Flights to/from Jacksons/Port Moresby Airport 2-32 Figure Domestic Air Network 2-34 Figure Historical International Passenger Movements 2-36 Figure Historical Domestic Passengers 2-36 Figure Historical Domestic Passengers at Nadzab/Lae Airport 2-37 Figure Location of Five Airports Improved under CADIP Project Figure Map of Morobe Province 2-46 Figure Provincial Fiscal Capacity 2-47 Figure Schematic Air Network of Nadzab/Lae Airport 2-49 SECTION 3: TOPOGRAPHIC SURVEY AND SOIL INVESTIGATION Figure Survey Area 3-1 Figure Topographic Map 3-6 Figure Boring Location 3-8 Figure Location of the tests by KOICA report 3-11 vii
45 Figure Geological Map of the Investigation Area 3-12 Figure A Cross-Sectional Profile 3-14 Figure Bearing Layer Line of Raft Foundation 3-17 Figure Bearing Layer Line of Raft Foundation with Soil Improvement 3-18 Figure Bearing Layer Line of Pile Foundation 3-19 SECTION 4: AIR TRAFFIC DEMAND FORECAST Figure Study Flow of Demand Forecast Items 4-2 Figure 4.3-1(a) Correlation between Nadzab Domestic Passengers and Total GDP 4-4 Figure 4.3-1(b) Correlation between Nadzab Domestic Passengers and Nonmineral GDP 4-4 Figure 4.3-1(c) Correlation between Nadzab Domestic Passengers and Population 4-4 Figure Comparison of GDP per Capita among Pacific Island Countries 4-5 Figure Historical Trend of Actual and Assumed Total GDP 4-7 Figure Historical Trend of Actual and Estimated Nonmineral GDP 4-8 Figure Study Flow of Forecast for Domestic Passengers 4-9 Figure Forecast ANG & APNG Passengers at Nadzab Airport (Total GDP) 4-10 Figure Forecast ANG & APNG Passengers at Nadzab Airport (Nonmineral GDP) 4-10 Figure Domestic Air Passenger Forecast in National Development Strategy Plan Figure Study Flow of Peak Demand 4-15 Figure Number of Flights by Time 4-15 Figure Study Flow of Aircraft Demand 4-17 Figure International Destination of Passenger Originated from Lae 4-21 Figure Fluctuation of Potential International Passenger Originated from Lae 4-21 Figure Study Flow of International Passengers (1) 4-22 Figure Study Flow of International Passengers (2) 4-23 Figure Forecast of Annual International Passengers at POM 4-23 Figure Study Flow of Airport Access Traffic Forecast 4-28 SECTION 5: VERIFICATION OF EXISTING FACILITIES AND EXAMINATION OF FACILITY REQUIREMENTS Figure General Dimension of B Figure General Dimension of B Figure General Dimension of B Figure Layout of Nadzab Airport Facilities 5-26 viii
46 Figure Typical Section of Existing Runway Pavement 5-27 Figure Typical Section of Existing Main Apron Pavement 5-28 Figure Obstacle Limitation Surfaces 5-31 Figure Layout of Existing Utilities 5-41 Figure Dimension of Turn Pad for B Figure Landing Field Length for B Figure Locations of TW-B and TW-C from Runway Thresholds 5-55 Figure Image of Aircraft Landing from Runway Figure Image of Aircraft Taking-off from Runway Figure Examination of Taxiways B and C Fillet for Boeing based on Existing Fillet Dimension 5-60 Figure Locations of Taxiways 5-61 Figure Aircraft Parking/Taxiing Configuration on New Apron 5-65 Figure Sight line check 5-70 Figure Sight check for Circle Approaching Aircraft 5-71 Figure Example Phasing of Embankment Improvement 5-75 Figure Runway, Taxiways, Apron and AGL Rehabilitation: Option Figure Runway, Taxiways, Apron and AGL Rehabilitation: Option SECTION 6: FORMULATION OF AIRPORT MASTER REHABILITATION PLAN Figure Existing Separations between Facilities 6-1 Figure Confirmation on Airside Separations for Simultaneous Operation by B Figure Alternative Location of New PTB Options 6-3 Figure Short-term Nadzab Airport Master Rehabilitation Plan 6-7 Figure Nadzab Airport Short-term Terminal Facilities Master Rehabilitation Plan 6-8 SECTION 7: PRELIMINARY DESIGN Figure Longitudinal Section for Runway 7-2 Figure Cross Section for Single Cant and Center Crown of Runway 7-3 Figure Typical Cross Section for Runway 7-4 Figure TW-A Typical Cross Section Sta Figure TW-C Typical Cross Section Sta Figure Layout for Circulation Road and Carpark 7-6 Figure Typical Cross Section for Perimeter Road and Fence 7-7 Figure Perimeter Road and Fence Layout 7-7 ix
47 Figure Relationship between CBR Value and k Value 7-9 Figure Typical Section of Existing Runway, Taxiway and Apron Pavement 7-10 Figure Typical Section of Runway, Taxiway and Apron Pavement 7-10 Figure Degrees Turn 7-12 Figure Typical Cross Section of Runway 7-14 Figure Typical Cross Section of Taxiway without Widening 7-14 Figure Typical Cross Section of Taxiway with Widening 7-14 Figure Day Work and Night Work Area for Runway and Taxiway 7-22 Figure Location of Possible Aggregate Source 7-28 Figure Layout Plan of Aeronautical Ground Lights 7-32 Figure Location Plan 7-33 Figure New PTB Ground Floor Plan 7-39 Figure New PTB First Floor Plan 7-40 Figure Passenger Access Flow _ Ground Floor 7-43 Figure Passenger Access Flow _ Ground Floor 7-44 Figure Scheme-A Exterior Image _ Landside 7-45 Figure Scheme-A Exterior Image _ Airside 7-46 Figure Scheme-A Exterior Image _ General 7-46 Figure Scheme-A Elevations 7-47 Figure Scheme-A Sections 7-48 Figure Scheme-B Exterior Image _ Landside 7-49 Figure Scheme-B Exterior Image _Airside 7-49 Figure Scheme-B Exterior Image _General 7-50 Figure Scheme-B Elevations 7-51 Figure Scheme-B Sections 7-52 Figure Scheme-C Exterior Image _ Landside 7-53 Figure Scheme-C Exterior Image _ Airside 7-53 Figure Scheme-C Exterior Image _ General 7-54 Figure Scheme-C Elevations 7-55 Figure Scheme-C Sections 7-56 Figure PTB Power Feed-in Diagram 7-62 Figure V Main Feeder System Flow Diagram 7-63 Figure Telephone System Flow Diagram 7-64 Figure Fire Alarm System Flow Diagram 7-65 Figure CCTV System Flow Diagram 7-66 Figure LAN System Flow Diagram 7-67 Figure Public Address System Flow Diagram 7-68 x
48 Figure TV System Flow Diagram 7-68 Figure PTB HVAC system 7-69 Figure Renovation Area 7-71 Figure Renovated Cargo Terminal 7-72 Figure Air Conditioning and Ventilation Flow 7-73 Figure Administration Building Plan 7-74 Figure Administration Building Elevations Sections 7-75 Figure Air Conditioning System Flow Diagram 7-76 Figure Rescue and Fire-fighting Station Plans (Above:1 st floor, Below: Ground floor) 7-78 Figure Rescue and Fire-fighting Station Elevations 7-79 Figure Rescue and Fire-fighting Station Sections 7-79 Figure Air Conditioning System Flow Diagram 7-80 Figure Control Tower Power Feed-in Diagram 7-82 Figure Substation Plan (For the PTB) 7-84 Figure Substation Plan (For the Control Tower) 7-84 Figure Substation Elevation/Sections (For the PTB) 7-85 Figure Air Conditioning and Ventilation Flow 7-86 Figure Water Supply System 7-88 Figure Fire Protection Pump System 7-89 Figure Waste Water Treatment System 7-90 Figure Layout Plan for Electrical Works 7-91 Figure Layout Plan for Water 7-92 Figure External Cabling System Flow Diagram 7-93 Figure Low-E Glass Diagram 7-94 Figure Rain Water Piping System 7-96 SECTION 8: PROJECT IMPLEMENTATION PROGRAM Figure Proposed General Project Implementation Scheme for the Project 8-1 Figure Project Implementation Schedule 8-11 SECTION 9: PROJECT IMPLEMENTATION ORGANIZATION Figure CADIP Implementation Organization of as of Figure Proposed PIU for Nadzab Airport Rehabilitation Project 9-3 SECTION 10: OPERATION AND MAINTENANCE AFTER IMPLEMENTATION Figure General Organizational Structure of as of xi
49 Figure Revenues of 10-5 Figure s Expenses by Item 10-5 Figure Nadzab Airport Operations Structure SECTION 11: ECONOMIC AND FINANCIAL ANALYSIS Figure With/Without Domestic Air Passenger Traffic Demand for Benefits Estimate 11-3 SECTION 12: ENVIRONMENT AND SOCIAL CONSIDERATION Figure 12.1 Annual Average Temperature 12-2 Figure 12.2 Annual Average Rainfall 12-2 Figure 12.3 Land use in the vicinity of Nadzab airport 12-3 Figure 12.4 Flowchart of Environmental Permits (Level 1 to Level 3) 12-6 Figure 12.5 Flowchart of Environmental Permits (Level 2) 12-7 Figure 12.6 Flowchart of Environmental Permits (Level 3) 12-7 Figure 12.7 Organization Chart of DEC 12-8 Figure 12.8 Contour on Aircraft Noise in 2014, 2026 and Figure 12.9 Stakeholder Meetings SECTION 13: FLOOD FROM ERAP RIVER Figure The State of the River Channel and the Airport 13-2 Figure Changes in Rainfall since Figure Watershed of the Erap River system 13-4 Figure Typical Cross Section of the Current Embankment 13-5 Figure Example Phasing of Embankment Improvement 13-7 Figure Typical Cross-Section in the 1 st Phase (Improvement;1,300m) 13-9 Figure Typical Cross-Section in the 2 nd Phase-a, b and 3 rd Phase-a, b (Alternative of 3 rd Phase-a) 13-9 xii
50 SECTION 1: INTRODUCTION List of Tabulations Table Work Schedule 1-10 SECTION 2: BACKGROUND OF THE PROJECT Table Regions and Provinces of Papua New Guinea 2-1 Table Population of Provinces in Papua New Guinea 2-2 Table Historical Growth of Typical GDP, GDP per Capita and Population 2-3 Table Sectoral GDP Growth Rates and Share 2-5 Table IMF Prospect on Annual Growth Rates of Real GDP of Papua New Guinea 2-8 Table Expected Average Annual Growth Rates of Papua New Guinea Vision Table a 2015 to 2018 Economic Outlook presented by Minister of Finance 2-11 Table 2.1-7b Central Government Debts (2015 National Budget Volume 1) 2-12 Table 2.1-7c Debt Sustainability Measures (2015 National Budget Volume 1) 2-12 Table Contribution of Mineral Sector to Balance of Payment 2-13 Table Average Expenditure by Purpose of Visit 2-18 Table Traffic through PNGPCL Declared Ports 2-22 Table Breakdown of Main Commodity Groups in Export/Import of PAPUA NEW GUINEA 2-23 Table Cargo Revenue Tonnages at Major Ports of Lae, Port Moresby and Others (2007 to 2009) 2-25 Table Summary of ICAO Recognized Airports 2-30 Table Air Traffic at Main Airports 2-31 Table Historical International Passengers 2-36 Table Historical Domestic Passenger Movements 2-36 Table Historical Domestic Passengers at Nadzab 2-37 Table Investment Program and Investment Plan for Project Table Projected Funding Requirements for National Airports (up to CADIP Project 2) 2-42 Table Summary of CNS/ATM Modernization Projects and Activities at Nadzab Airport as of May SECTION 3: TOPOGRAPHIC SURVEY AND SOIL INVESTIGATION Table3.1-1 Location of Reference Points 3-5 Table3.1-2 Location of Bench Marks 3-5 Table3.2-1 Content of Soil Investigation 3-7 xiii
51 Table3.2-2 Coordinates and Elevation of boreholes 3-8 Table Applied Standards for Boring Tests 3-9 Table Applied Standards for Laboratory Tests 3-10 Table3.2-5 Quantities of the work by KOICA 3-11 Table Subsoil Configurations 3-13 Table Summary of laboratory test 3-16 Table Soil Parameter 3-17 Table Applicable machines for CDM 3-18 Table Height of excavation and its gradient as applied to the open cut method 3-19 SECTION 4: AIR TRAFFIC DEMAND FORECAST Table Socio-economic Indices and Nadzab Domestic Passenger Movement Record 4-3 Table Correllation Matrix between Nadzab Domestic Passengers and GDP/Population 4-5 Table Anticipated Future GDP Growth Rates by International Organizations and GPNG 4-6 Table Assumed Future Total GDP Growth Rates 4-6 Table IMF/GPNG Estimates and Adopted Nonmineral GDP Growth Rates 4-8 Table Forecasting Models Tested for Nadzab Airport Case (Total GDP) 4-9 Table Forecasting Models Tested for Nadzab Airport Case (Nonmineral GDP) 4-10 Table Share of Each Airline at Nadzab Airport 4-11 Table Comparison of Nadzab Airport Domestic Passengers Forecast Results 4-11 Table Summary of Forecasting Model, Parameter and Result 4-13 Table Design Day Ratio 4-15 Table Peak Demand 4-16 Table Airline Share 4-17 Table Estimated Domestic Passengers by Airline 4-17 Table Route Share 4-18 Table Future Aircraft and Load Factor 4-18 Table Summary Forecasts of Daily Domestic Aircraft Movements 4-18 Table Calculation of Daily Domestic Aircraft Movements 4-19 Table Forecast Peak-hour Domestic Aircraft Movements 4-20 Table Estimate of Potential Daily Int l Passengers (Case 1: Data provided by Air Niugini) 4-22 Table Estimate of Potential Daily Int l Passengers (Case 2: Interview Survey at Port Moresby) 4-24 xiv
52 Table Daily International Departing Passengers and Aircraft Movements (Nadzab-Brisbane) 4-25 Table Daily International Departing Passengers and Aircraft Movements (Nadzab-Cairns) 4-25 Table Departure Flights in a Week 4-26 Table Estimated Design Day/Annual International Passengers 4-27 Table Well-wisher Ratio 4-28 Table Airport Staff Ratio 4-28 Table Modal Split for Air Passengers and Well-wisher 4-29 Table Modal Split for Airport Staff 4-29 Table Number of Users per Vehicle 4-29 Table Estimated Traffic Volume 4-30 Table Relation between Air Passenger and Air Cargo 4-31 Table Annual Air Cargo Demand 4-32 Table Summary for Future Demand 4-33 SECTION 5: VERIFICATION OF EXISTING FACILITIES AND EXAMINATION OF FACILITY REQUIREMENTS Table Aerodrome Reference Code defined in ICAO Annexn Table Aerodrome Reference Code applicable to Nadzab/Lae Airport 5-8 Table Occurrences of Visibility Conditions (September 2013 to August 2014) 5-9 Table Passenger Terminal Levels of Service 5-10 Table Level of Service Guidelines for Airport Terminal Facilities 5-11 Table Assumed Domestic and International Peak-hour Passenger Movements 5-12 Table Domestic and International Peak-hour Aircraft Arrivals 5-13 Table Annual Cargo Volume 5-13 Table Summary Requirements of Aircraft Parking Stands 5-14 Table Summary Facility Requirements for New PTB (Target year 2026) 5-16 Table Summary Facility Requirements for New PTB (Target year 2031) 5-17 Table Reference on the floor area requirements for PTB international flight facilities 2026 and 2031 (IATA ADRM) 5-18 Table Reference on the floor area requirements for PTB domestic flight facilities 2026 (IATA ADRM) 5-19 Table Reference on the floor area requirements for PTB domestic flight facilities 2031 (IATA ADRM) 5-20 Table Computation of Facility Requirement of Cargo Terminal 5-22 xv
53 Table AeroDrome Category for Rescue and Fire Fighting 5-24 Table Basic Information of Airside facilities 5-25 Table Dimension and Slopes of Obstacle Limitation Surfaces 5-30 Table Existing Conditions of AGL at Nadzab Airport 5-44 Table Correction of Runway Length 5-48 Table Assumed Operating Empty Weight plus Payload 5-49 Table Result of Range-Payload Examination 5-49 Table Runway Width Requirement 5-52 Table Runway Rehabilitation Measures 5-58 Table Taxiway Width Requirement 5-59 Table Minimum Clearance Distance of Outer Main Wheel to Taxiway Edge 5-59 Table Taxiway Rehabilitation Measures 5-62 Table Apron Development/Rehabilitation Measures 5-66 Table Estimated Aircraft Fuel Consumption and Storage Capacity (2026) 5-74 Table Estimated Aircraft Fuel Consumption and Storage Capacity (2031) 5-74 Table Matrix showing Options of Runway/Taxiways/Aprons/AGL/Related Facilities 5-77 Table Summary Result of Preliminary Construction Cost Estimate (Runway/Taxiway/Apron/AGL/Related Facilities) 5-80 Table Proposed Project Components and Preliminary Construction Cost 5-83 SECTION 6: FORMULATION OF AIRPORT MASTER REHABILITATION PLAN Table Comparison of Two New PTB Location Options 6-4 SECTION 7: PRELIMINARY DESIGN Table Comparison of Single Cant and Center Crown Slope 7-3 Table Design Criteria for a Taxiway 7-5 Table Forecasted Daily Aircraft Movements 7-7 Table Estimated Aircraft Movements during Design Period 7-8 Table Subgrade CBR Value 7-8 Table Summary of Cost Reduction 7-11 Table Characteristics of Expected Aircraft to be used during Construction 7-12 Table Required Take-Off Runway Length 7-12 Table Minimum Pavement Width for 180 Degree Turn 7-13 Table Size of Fokker and DC Table Comparison of Runway Construction Options 7-13 Table Typical Night Work Procedure of Asphalt Overlay Work 7-17 xvi
54 Table List of Expected Construction Equipment for Asphalt Pavement Work 7-18 Table Assumed Machinery for Cement Concrete Pavement Work 7-19 Table Typical Daily Work Procedure of Cement Concrete Pavement 7-20 Table Construction Capacity 7-23 Table Summary of Construction Quantities 7-23 Table Historical Monthly Precipitation and Number of Days more than 10mm per day 7-25 Table Calendar Day / Workable Day 7-25 Table Preliminary Construction Schedule for Civil Works 7-26 Table Possible Aggregate Suppliers 7-27 Table Summary of Findings 7-28 Table Summary Scope of AGL Rehabilitation for Nadzab Airport 7-29 Table General Requirements of Aeronautical Ground Lights 7-30 Table Control Tower Renovation Scope Summary 7-81 Table Result of the Cost Reduction 7-97 Table Construction Cost Estimate in Kina 7-98 Table Construction Schedule SECTION 8: PROJECT IMPLEMENTATION PROGRAM Table Expected Foreign Currency Ratio in Civil Works Component 8-5 Table Goods and Service in Architectural Works expected to be Japanese origin 8-7 Table Assumed Japan Origin of AGL Works 8-8 Table Total Amount and Share of Japan Origin 8-9 Table Estimated Total Construction Cost 8-13 Table Assumed Billing Rates and Estimated Staff-months for Consulting Services 8-13 Table Estimated Total Project Cost for Rehabilitation of Nadzab Airport 8-15 SECTION 10: OPERATION AND MAINTENANCE AFTER IMPLEMENTATION Table Staff Force 10-3 Table Profit and Loss of 10-4 Table Estimated Cash Flow of ( 1000 PGK) 10-6 Table Balance Sheet of as of 31 December Table Proposed Staff Force Strengthening for Nadzab as International Alternate Airport xvii
55 SECTION 11: ECONOMIC AND FINANCIAL ANALYSIS Table Forecast Future Air Traffic Demand 11-3 Table Comparison of Annual Air Traffic Demand between Without Project Case and With Project Case 11-4 Table Comparison of Annual Aircraft Movements by Aircraft Type between Without Project Case and With Project Case 11-5 Table Comparison of Annual Air Passengers by Nationality between Without Project Case and With Project Case 11-6 Table Actual Lending Rate in Papua New Guinea 11-7 Table Project Implementation Costs for Economic Analysis 11-8 Table Actual Standard Conversion Factor (SCF) 11-8 Table Staff Listing by Division/Airport as of October Table Budget for The Year Table Comparison of Area between Existing Facilities and New Facilities Table Maintenance Cost of Existing Facilities Table Maintenance Cost of New Facilities Table Population Ratio of Lae District to Morobe Region (2011) Table Average Domestic Air Fare Table Purpose of Visitors to Lae Area Table Average Consumption by Foreign Visitor Table Airport Charges () Table Average Domestic Air Cargo Fee Table Average International Air Cargo Fee Table Assumption of Divert Flights from Port Moresby Table Result of Economic Analysis Table EIRR Calculation Sheet Table Sensitivity Analysis of EIRR Table Project Implementation Costs for Financial Analysis Table MTOW and ALC by Aircraft Type Table Result of Financial Analysis Table FIRR Calculation Sheet Table Precondition of JPY Loan ( STEP Loan) Table Indicative Rates used in Prime Cost Method Table Statement of Profit and Loss of Nadzab/Lae Airport xviii
56 Table Statement on The Receipt and Disbursement of Fund and Free Cash Flow in Nadzab/Lae Airport Table Statement on The Receipt and Disbursement of Fund and Free Cash Flow in Nadzab/Lae Airport ( Reference : Excluding Investment Cost from Expenditure) SECTION 12: ENVIRONMENT AND SOCIAL CONSIDERATION Table 12.1 Laws and Regulations 12-4 Table 12.2 Scoping Result Table 12.3 TOR of Environmental Survey (draft) Table 12.4 IEE Result Table 12.5 Ambient noise standard coming from airplanes in Japan Table 12.6 Environmental Management Plan (Construction Phase) Table 12.7 Environmental Management Plan (Operation Phase) Table 12.8 Environmental Monitoring Plan (Construction Phase) Table 12.9 Environmental Monitoring Plan (Operation Phase) Table Environmental Monitoring Cost (Unit Price) Table Summary of Environmental Management Costs Table Outline of Stakeholder Meetings SECTION 13: FLOOD FROM ERAP RIVER Table The Rough Construction Cost for Each Phase 13-9 xix
57 List of Abbreviations A AAGR ACC ACN ADB ADRM ADS-B AFTN A/G AGL AHU AIS AIC AIP AMHS ANG ANS APEC APNG AR ASTM ATC ATD ATM ATS AUSAID AWOS Average Annual Growth Rate Area Control Center Aircraft Classification Number Asian Development Bank Airport Development Reference Manual Automatic Dependent Surveillance-Broadcast Aeronautical Fixed Telecommunication Network Air to Ground Aeronautical Ground Light Air-Handling Units Aeronautical Information Service Accident Investigation Commission Aeronautical Information Publication ATS Message Handling System Air Niugini Air Navigation Service Asia-Pacific Economic Cooperation Airline PNG Autonomous Region American Society for Testing and Materials Air Traffic Control Air Transport Division Air Traffic Management Air Traffic Service Australian Agency for International Development Automated Weather Observing System I
58 B BCR or B/C BHS BMS BNE BOD C CAA CAD CADIP CASA CAT CBR CCR CCTV CIQ CNS CNS/ATM COD CSO CTB D D/E DEC DFAT DLPP DME DPI Benefit Cost Ratio Baggage Handling System Building Management System Brisbane Biochemical Oxygen Demand Civil Aviation Authority Computer Aided Design Civil Aviation Development Investment Program Civil Aviation Safety Authority Category California Bearing Ratio Constant Current Regulator Closed Circuit Television Customs, Immigration, Quarantine Cairns Communication, Navigation, Surveillance and Air Traffic Management Chemical Oxygen Demand Community Service Obligation Cargo Terminal Building Debt/Equity Department of Environment and Conservation Department of Foreign Affairs and Trade Department of Lands and Physical Planning (DLPP) Distance Measuring Equipment Department of Primary Industry II
59 DSCR DOT DOW DVOR E e.g. EIA EIRR EIS EMP EMoP E/N ENPV F FAA FAARFIELD FCU FIDS FIR FIRR FNPV FS or F/S G GDP GIS GJPY GPNG GRDP Debt Service Coverage Ratio Department of Transport Department of Works Doppler Type VHF Omni-directional Radio Range For example Environmental Impact Assessment Economic Internal Rate of Return Environmental Impact Statement Environmental Management Plan Environmental Monitoring Program Exchange of Note Economic Net Present Value Federal Aviation Administration FAA Rigid and Flexible Iterative Elastic Layered Design Fan Coil Unit Flight Information Display System Flight Information Region Financial Internal Rate of Return Financial Net Present Value Feasibility Study Gross Domestic Product Geographic Information System Government of Japan Government of Papua New Guinea Gross Regional Domestic Product III
60 GS GST H HF HQ HVJV I IAS IATA ICAO ICB ICCC IEEC IEER IFR ILS IMF ITB J JCAB JPY K KOICA L LAN LCC LCCI Glide Slope Goods and Services Tax High Frequency Headquarter Hidden Valley Mine Joint Venture Indicated Air Speed International Air Transportation Association International Civil Aviation Organization International Competitive Bidding Independent Consumer and Competition Commission Initial Environmental Examination Checklist Initial Environmental Examination Report Instrument Flight Rule Instrument Landing System International Monetary Fund Invitation to Bid Japan Civil Aviation Bureau Japan International Cooperation Agency Japanese Yen Korea International Cooperation Agency Local Area Network Low Cost Carriers Lae Chamber of Commerce Inc. IV
61 Lden LED LLCR LLZ LNG Level day-evening-night Light Emitting Diode Loan Life Coverage Ratio Localizer Liquefied Natural Gas LTIP CAA Infrastructure Investment Plan, Long Term ( ) LV M MDA MEJV MET METAR MLAT MMJV MSL M/P MT Low Voltage Minimum Descent Altitude Morobe Exploration Joint Venture Meteorological Equipment Regular Airport Weather Report Multilateration Morobe Mining Joint Venture Mean Sea Level Master Plan Metric Ton MTDP Medium-term Development Plan MTTP N NASMP NAVAID(s) NCA NCD NDB NEC NGO Medium Term Transport Plan National Airports Corporation National Airports Strategic Management Plan Navigation Aid (s) North Coast Aviation National Capital District Non-Directional Beacon National Executive Council Non-Governmental Organization V
62 NM NMSA NOTAM NPC NPV NRA NRSC NSO NTS Nautical Mile (1852m) National Maritime Safety Authority Notice to Airmen National Planning Committee Net Present Value National Roads Authority National Road Safety Council National Statistics Office National Transport Strategy O ODA OEW OJT OLS O/M Official Development Assistance Operating Empty Weight On-the-job training Obstacle Limitation Surface Operation and Maintenance P PABX PALS PAMAS PANS PANS/OPS PAPI PAU PAX PBB PBN Private Automatic Branch Exchange Precision Approach Lighting System PNG ADS-B, MLAT and ATM System Procedures for Air Navigation Services PANS-Aircraft Operations Precision Approach Path Indicator Primary Air-Handling Units Passenger Passenger Boarding Bridge Performance Based Navigation VI
63 PC PCCP PCN PGK PIRR PIU PMIA PMO PMV PNG PNGASL Personnel Computer Portland Cement Concrete Pavement Pavement Classification Number Papua New Guinean Kina Project Internal Rate of Return Project Implementation Unit Port Moresby International Airport Project Management Office Public Motor Vehicle Papua New Guinea PNG Air Services Limited PNGDSP National Development Strategy Plan PNG Vision 2050 Papua New Guinea Vision 2050 POM PPP PSFC PTB Q QNH QFE R RIV REDL RENL RESA RIV RNAV ROW Port Moresby Public Private Partnership Passenger Service Facility Charge Passenger Terminal Building Altimeter sub-scale setting to obtain elevation when on the ground Atmospheric pressure at aerodrome elevation Rapid Intervention Vehicle Runway Edge Light Runway End Light Runway End Safety Area Rapid Intervention Vehicle Area Navigation Right Of Way VII
64 RTHL RVR R/W or RWY RX S SALS SCF SOE SPT STAR STEP STP T TA T-DME TEDL TFC TIEZA TMA TOR TPA TRCV TSSP T/W or TWY TX TXGL U UPS Runway Threshold Light Runway Visual Range Runway Receiver Simplified Approach Lighting System Standard Conversion Factor State Owned Enterprises Standard Penetration Test Standard Terminal Approach Route Special Terms for Economic Partnership Sewage Treatment Plant Travel Air Terminal DME Taxiway Edge Light Terminal Facility Charge Tourism Infrastructure and Enterprise Zone Authority Terminal Control Area Terms of Reference Tourism Promotion Authority Transceiver Transport Sector Support Program Taxiway Transmitter Taxiway Guidance Light Uninterruptible Power Supply VIII
65 UTC V VCS VFR VHF VIP VOR VSAT W WB WBRL WC WD WDPS WDIL WECPNL WGJV WGS84 Universal Time Coordinated Voice Communication System Visual Flight Rules Very High Frequency Range Very Important Person VHF Omni-directional Radio Range Very Small Aperture Terminal World Bank Wing Bar Light Working Capital Wind Direction Weather Data Processing System Wing Direction Indicator Light Weighted Equivalent Continuous Perceived Noise Level Wafi-Golpu Joint Venture World Geodetic System-84 IX
66 SECTION 1 INTRODUCTION
67 SECTION 1: INTRODUCTION 1.1 General (hereinafter referred to as Papua New Guinea ), with its population of 7.17 million in 2012, consists of more than 600 islands including eastern half of New Guinea Island (main island) as well as Islands of Bismarck, New Britain, Louisilade, etc. In addition, the main island has a complex chain of mountain ranges consisting of Bismarck and Owen Stanley Ranges (highest elevation 3000m to 4000m), which divide the main island to the north and south. Surface of the country other than mountain is covered by deep rain forest. Due to the harsh topographic conditions, there are still several missing links in the trunk line road network in Papua New Guinea. Therefore, the air transport plays its vital role in transportation of people in Papua New Guinea. The city of Lae (population in 2011 Census was about 149 thousand), the second largest city after the capital city of Port Moresby (population in 2011 Census was about 364 thousand), has the port of Lae which handles the largest volume of cargo in Papua New Guinea. Lae is connected by the Highland Highway with Highland area where abundant agricultural products are grown and several natural resource developments are ongoing. Lae is recognized as one of the industrial and logistic centers in Papua New Guinea, but it is connected with Port Moresby only by the air and sea. Figure Map of Papua New Guinea Nadzab Airport, located approximately 35km to the west-north-west of Lae, is the second largest airport in PNG, having 2438-m long runway. Nadzab Airport handled approximately 300 thousand domestic passengers in 2012, and its average annual growth rate from 2008 to 2012 reached 13%. However, Nadzab Airport has several deficiencies as listed below: 1-1

68 Existing runway width of 30m is not sufficient to accommodate B737 type aircraft; Pavement strength of the runway, taxiway and apron is not sufficient to accommodate B737 type aircraft; The passenger terminal building is outdated and short of capacity. Therefore, it is not capable of accommodating the increasing air traffic demand properly and efficiently. Highland Highway Eastern Highland City of Lae Nadzab Airport Figure Location of Nadzab Airport, City of Lae and Highland Area Under such circumstance, the Government of Papua New Guinea has been considering a possibility to borrow Yen Loan for rehabilitation of Nadzab Airport, and decided to implement the Preparatory Survey on the Project for Nadzab (Lae) Airport Rehabilitation in Papua New Guinea (hereinafter referred to as the Preparatory Survey ). JAC/AZS/OC Joint Venture, consisting of following three consulting firms, has been entrusted by to carry out the Preparatory Study as the Survey Team: Japan Airport Consultants, Inc. (JAC) as the lead firm of JV; Azusa Sekkei Co., Ltd. (AZS) as a member firm of JV; and Oriental Consultants Co., Ltd. (OC) as a member firm of JV. It should be clearly understood that, although results of the Preparatory Survey will be used as the basis for subsequent project appraisal by, the scope of the Project covered by Yen Loan is to be finally decided during the course of the appraisal and shall not necessarily be the same as the results of the Preparatory Survey. It should also be so understood that the decision to implement the Project under Yen Loan will be made by way of bilateral agreement between the Government of Japan and the Government of Papua New Guinea. 1-2
69 1.2 Preparatory Survey Organization Preparatory Survey Team dispatched by consists of following members: 1) Team Leader/Airport Planner: Mr. Teruo HANADA, JAC 2) Deputy Team Leader/Civil Engineer 1: Mr. Nobuyoshi ONO, JAC 3) Architect 1: Mr. Shinichiro KADOYA, AZS 4) Architect 2:, Mr. Masahide KUNIYOSHI, AZS 5) Civil Engineer 2: Jun YAMAUCHI, OC 6) Mechanical & Electrical Engineer: Asao TAGUCHI, AZS 7) CNS/ATM & AGL Engineer: Mr. Norihito FUKUHARA, JAC 8) Air Traffic Forecaster: Mr. Hidetoshi SUGIURA, OC 9) Construction Planning/Cost Estimate: Hideki AKIEDA, AZS 10) Economic and Financial Analysis: Mr. Azuma FURUSE, JAC 11) Environmental and Social Considerations: Mr. Yuki MORINAGA, OC 12) Topographic, Geotechnical and Pavement Surveys: Takafumi KAMEDA, OC. Organizational structure of the Preparatory Survey Team is as shown below. Traffic Demand Forecast & Economic and Financial Analysis Mr. Hidetoshi SUGIURA Mr. Azuma FURUSE Management Group Teruo HANADA Nobuyoshi ONO Surveys: Takafumi KAMEDA Civil Engineering Group Civil Engineer 1: Nobuyoshi OONO Building Planning Group Architect 1: Shinichiro KADOYA CNS/ATM & AGL: Norihito FUKUHARA Civil Engineer 2: Jun YAMAUCHI Architect 2: Masahide KUNIYOSHI Mechanical/Electrical: Asao TAGUCHI Construction Plan/Cost Estimate: Hideki AKIEDA Environmental & Social Consideration: Yuki MORINAGA 1-3
70 1.3 Scope of Work The scope of the Preparatory Survey consists of the following 23 items: (1) Data Collection and Analysis (2) Preparation of Questionnaire (3) Examination of Methodology, Schedule and Processes (4) Preparation of Inception Report (5) Discussion on Inception Report (6) Examination of Present Condition (7) Surveys (8) Air Traffic Demand Forecast (9) Verification of Existing Facilities and Examination of Facility Requirements (10) Formulation of Airport Master Development Plan (11) Preparation of Interim Report (12) Discussion on Interim Report (13) Preliminary Design (14) Preliminary Examination of Work Execution Plan and Project Implementation Plan (15) Preliminary Project Cost Estimate (16) Project Implementation Organization (17) Operation and Maintenance after Project Implementation (18) Economic and Financial Analysis and Examination of Operation/Effect Indicators (19) Examination on Environmental and Social Consideration (20) Examination on Consulting Services (21) Preparation and Discussion of Draft Final Report (22) Preparation of Final Report Figure shows the procedures to complete the work. 1-4
71 (1) Data Collection and Analysis (2) Preparation of Questionnaire (3) Examination of Methodology, Schedule and Process (4) Preparation of Inception Report (5) Discussion on Inception Report Overall - Socio-economic Indices - Structure of Economy - Natural Resources Development - Tourism Development - Japanese Companies in PNG (6) Examination of Present Condition Aviation Sector - Organization, Policy & Finance - Operating Airlines - International & Domestic Air Network - Air Transport Statistics - Air Transport Development Projects Nadzab Airport - Passenger, Cargo Aircraft Movements - Airport Facilities - Land Use of Surrounding Area - Flooding of Erap River - Related Development under CADIP - Weather Conditions (Low Visibility) Topographic & Geological Survey - Plane Table Survey (40ha) - Boring and Laboratory Testing (7) Surveys Pavement Survey - Thickness of Existing Pavements - Marshall Stability of Existing Asphalt Pavement Layers - Subgrade CBR (RWY Extension Area) Interview Survey - International Passengers (Port Moresby) - Domestic Passengers (Nadzab and Port Moresby) (including airport access transportation) - Airlines - LNG Project Developers (8) Air Traffic Demand Forecast (2021 to 2031) Actual Data Examination - Air Traffic at Nadzab Airport (to be collected at Nadzab) - Air Traffic at Port Moresby - Estimate of Passenger and Cargo Traffic Data in PNG - Share of Lae Oriented/Destined International Passengers (based on the passenger interview survey) - Share of Lae-Cairns Passengers (ditto) - Actual and Future-estimated GDP - Aircraft Fleet Plan (based on the airlines interview survey) - Potential Passenger Movements Generated by LNG Project (based on the interview survey of Developers) Assumption of Natural Resource Development Scenarios - Base Case (PNG LNG) - High Case (New Project) Future GDP Growth Estimate by IMF Regression Analysis (International & Domestic Passengers at PNG or Port Moresby GDP) Passenger Traffic Forecasting Model with GDP Future GDP Growth (Base and High Cases) PNG Annual Passenger Traffic Demand Forecast Annual Passenger Traffic Demand at Nadzab (Base and High Cases) Discussion Share of Nadzab Airport Passengers in Entire PNG Intention of Local Business Leaders and Airlines on International Operations at Nadzab Assumption of Weekly International Flight Frequency/Aircraft Type/Passengers Annual Passenger Demand Forecast at Nadzab Annual Aircraft Movement Forecast Assumptions - Future Airlines Fleet Plan - Average Load Factor Annual Air Cargo Demand Forecast at Nadzab Peak-day and Peak-hour Passenger/Aircraft Movements and Number of Access Vehicles at Nadzab Airport - Monthly/Daily/Hourly Peak Factors - Share of Access Transportation, Average Number of Passengers (Hotel & Public Buses, Other Cars) Note. 1 Work in Japan Note 2 Work in PNG Figure Study Procedure Flow 1 of 4 1-5
72 Planning Policy Setting - Target of Nadzab Airport Development - Target Year for Development - Future Air Network of Nadzab (9) Verification of Existing Facilities and Examination of Facility Requirements Listing of Major Project Components A) Passenger Terminal: Choice of Single/One and Half Storey, List of Terminal Equipment B) Road and Car Park: No. of Lanes, Parking Spaces, Associated Facilities including Drainage C) Utilities: Capacity of Potable Water, Sewage Treatment, Electrical Power Supply D) Cargo Terminal: Utilization of Existing Passenger Terminal, List of Security Equipment E) Runway: Length, Width, Pavement Strength (Design Aircraft) F) Taxiways: Width, Fillet, Pavement Strength G) Aircraft Parking Apron: Dimension, Pavement Strength, Pavement Type of New Apron H) CNS/ATM, AGL: Required Category of ILS (including LLZ only) Note 1, Renewal of Communications I) ATC Tower, RFF Note 2 : Utilization of Existing Buildings, Improvement of Utilities Note 1. ILS: Instrument Landing System, LLZ: Localizer Planning Considerations - Design Aircraft - Aerodrome Category (Annex14) - Approach Category of Runway - Base Standards and Manuals Note 2. RFF: Rescue and Fire Fighting Planning Parameters - Dimensions/Strength of Runway, Taxiways and Aprons - Performance Requirements of CNS/ATM and AGL Note - Number of Aircraft Parking Stands - Required Floor Spaces of Terminals - Required Capacity of Utilities Note. CNS/ATM: Communication, Navigation, Surveillance and Air Traffic Management AGL: Aeronautical Ground Lights Evaluation of Existing Facilities - Dimensions, Floor Spaces, etc. - Structural Soundness - Mechanical/Electrical Installations - Level of Deterioration Prioritization Evaluation Criteria - Cost Saving - Realization of Development Target - Airport Functional Relevance - Minimum Interruption to Airport Operation Verification of Project Scope Image of Prioritization and Verification of Project Scope (subject to further examination) Present Short-term Proposal Remarks Design Aircraft: F100 B737 and smaller Runway extension and taxiway widening not required Taxing of B737: Restricted Stub taxiways only Widening of parallel taxiway not required Fire Station Layout: Inconvenient Improvement of access to RWY Improvement of layout and reconstruction in medium-term Fire Engines: Old/Incomplete Addition o RIV Minimum to meet ICAO requirement ILS: Not provided Localizer/DME only Upgrading to Semi ILS from VOR/DME approach Cargo Terminal: Inside PTB Utilize existing PTB Volume is not significant yet. Exclusive CTB in future. Note. PTB: Passenger Terminal Building, CTB: Cargo Terminal Building (10) Formulation of Airport Master Development Plan Project Scope (Base Case) Design Aircraft for Simultaneous Operation Short-term: B737 and B737 or smaller Medium-term: B787 and B737 Long-term: B787 and B787 Separation Distances between Airside Facilities for Simultaneous Operation of Long-term Design Aircraft Fixed Gates for B737 (Nose-in) Utilization of Existing Apron Examination of Runway Widening, Pavement Reinforcement Examination of RWY Extension Alternatives Examination of New PTB Location, Expansion Plan Alternative Locations of New PTB Criteria - Flexibility to cater for fluctuation of demand - Expansibility to meet increasing demand - Minimizing aircraft noise impact on surrounding area - Protection from Erap River Flooding - Others Evaluation Draft Nadzab Airport Master Development Plan (Airport and Terminal Area) Preparation and Discussion of Technical Note No. 1 Note. 1 Work in Japan Note 2 Work in PNG Figure Study Procedure Flow 2 of 4 1-6
73 Discussion on Technical Note No. 1 (11) Preparation of Interim Report (12) Discussion on Interim Report (13) Preliminary Design Design Standards and Conditions - Manuals of - ICAO Standards and Recommendations - Standards/Specifications of PNG - Other Internationally Accepted Standards - Design Aircraft and Movements - Design Loads - Temperature, Humidity, etc. - Others Design Requirements - Simultaneous operation of international and domestic - Universal Design - Eco-airport - Protection against Earthquake, Flooding, Fire - Culture of PNG - Low cost for operation and maintenance Available Suppliers and Services for Maintenance - Cement, asphalt, steel bars, etc. - General building materials - Building Management System, Elevators, IT - Solar Generation Panels, Solar Water Heater Panels - Baggage Handling System, Passenger Boarding Bridges - Sanitary Products - Building Vibration Control and Mitigation System - CNS/ATM equipment - Aeronautical Ground Lights, Power Supply Listing of Applicable Technologies and Materials - Eco-airport - Hazard protection - High quality cement - Others Examination of Applicability of Japanese Technology & Products - Eco-airport related technology - Hazard-protection related technology - Examples in airport development - Needs in development of Nadzab Airport - Availability of technology in PNG - Availability of long-term maintenance and spare parts Preliminary Design Drawings &Specifications - Runway, Taxiways, Apron, Access Road, etc. - Utilities - Passenger and Cargo Terminal Buildings - CNS/ATM - Aeronautical Ground Lights Work Execution from Airport Operational Viewpoints - Layout of Temporary Facilities and Stock Yards - Method of Runway Reinforcement and Widening - Method of Taxiway Reinforcement - Method of Existing Apron Expansion/Reinforcement - Method of New Apron Construction for B737/B787 - Method of Construction of New Passenger Terminal - Method of ILS Installation, Renewal of ATC equipment - Method of installation of Aeronautical Ground Lights (14) Preliminary Examination of Work Execution Plan and Project Implementation Plan Construction Work Scheduling - Number of workable days - Standard progress rates of construction work - Approximate period of construction work - Identification of critical path - Preparation of construction schedule Procurement. - E/N & Yen Loan Agreement - Selection of Consultant - Design - Selection of Contractor Project Implementation Schedule (15) Preliminary Project Cost Estimate Collection of Base Data - Unit rates of equipment, materials and labor in PNG - Actual prices of similar works in PNG (CADIP) Construction Cost Estimate - Unit rates of construction - Quantity calculation - Construction cost estimate Examination for Further Cost Reduction Related Project Costs - Contingency for Price Escalation - Physical Contingency - Interest of Yen Loan during Construction - Front End Fee Estimate of Other Cost - Taxes and duties - Project management cost of - Land acquisition if applicable Overall Project Cost Estimate Confirmation on Percentage of Japanese Origin Note 1 Work in Japan Note 2: Work in PNG Figure Study Procedure Flow 3 of 4 1-7
74 (16) Project Implementation Organization 1) Examination of CADIP Project Implementation Organization - Legal Basis - Organizational Structure and Allocated Responsibility - Number and Qualification of Staff Members 2) Budget Allocation by 3) Capacity Building - Training Courses for Staff Members - Qualification and Promotion System - Experience of Similar Project Implementation 4) Recommendations for Improvement of Project Implementation Organization (18) Economic and Financial Analysis and Examination of Operation/Effect Indicators 1) Financial Analysis - Financial cash flow analysis based on current tariff system - Recommendations for revision of tariff system 2) Examination of Repayment of Yen Loan - Terms and conditions of Yen Loan - Financial arrangement for other fund - Financial Cash Flow Analysis 3) Economic Analysis 4) Examination Operation and/effect Indicators - Quantifiable indicators - Qualitative indicators (17) Operation and Maintenance after Project Implementation 1) Confirmation/Examination of Problems of Existing Operation and Maintenance Organization of Nadzab Airport - Organizational Structure, Responsibility and Budget - Hunan Resources, Qualification and Capacity Building - Availability of Spare Parts 2) Confirmation of Improvement Plan of Operation and Maintenance Organization of Airports under CADIP 3) Financial Status of - Breakdown of Income and Expenditure - Financial Statements (Balance Sheet/Income Statement/Cash Flow Statement) - Budget Allocation 4) Recommendations for Improvement of Operation and Maintenance Organization (19) Environmental and Social Consideration 1) Base Line Survey - Natural environment - Land use of surrounding area - Residents - Socio-economic situation 2) Environmental/Social Requirements in PNG - Laws and regulations, standard procedures - Deviation from Guideline (April 2010) - Relevant organizations and their role demarcation 3) Scoping 4) Preparation of aircraft noise contours 5) Environmental Impact Assessment/Examination of Alternatives 6) Examination of Mitigation Measures 7) Examination of Environmental Management and Monitoring Plan 8) Examination of Budget, Source of Fund and Organization 9) Assistance for holding stakeholder meeting if required Preparation and Discussion of Technical Note No. 2 (20) Examination on Consulting Services: TOR and Staff-month Requirement (21) Preparation and Discussion of Draft Final Report (22) Preparation of Final Report Note 1: Work in Japan Note 2: Work in PNG Figure Study Procedure Flow 4 of 4 1-8
75 1.4 Work Schedule First Site Survey Work from April to July 2014 During the first site survey work period, formulation of Nadzab Airport Master Development Plan was substantially completed. Base line survey for the environmental and social considerations was also carried out during this period. Works in Japan from July to August 2014 Preparation of Interim Report Second Site Survey Work from September and October 2014 Finalization of Nadzab Airport Master Development Plan; Preliminary design; Preliminary construction work execution planning; Preliminary project implementation cost estimate; Examination of project implementation organization; Examination of operation and maintenance after implementation of the Project; Economic, Financial Analysis and Examination of Operation/Effect Indicators Examination on environmental and social considerations; and Examination on Scope and Input of Consulting Services. Works in Japan in November 2014 Preparation of Draft Final Report Third Site Survey Work in December 2014 Discussion on Draft Final Report Works in Japan in March 2015 Preparation of Final Report. 1-9
76 Table Work Schedule Time Work Items Apr. May Jun. Jul. Aug. Sep. Oct. Nov. Dec. Jan. Feb. Mar. (1) Data Collection and Analysis (2) Preparation of Questionnaire (3) Examination of Methodology, Schedule and Processes (4) Preparation of Inception Report (5) Discussiion on Interim Report (6) Examination of Present Conditions (7) Surveys (8) Air Traffic Demand Forecast (9) Verification of Existing Facilities and Examination of Facility Requirements (10) Formulation of Airport Master Development Plan (11) Preparation of Interim Report (12) Discussion on Interim Report (13) Finalizatiion of Airport Master Development Plan (14) Preliminary Design (15) Preliminary Examination of Work Execution Plan and Project Implementation Plan (16) Preliminary Project Cost Estimate (17) Project Implementation Organization (18) Operation and Maintenance Organization (19) Economic and Financial Analysis and Examination of Operation/Effect Indicators (20) Examination of Environmental and Social Consideration (21) Examination of Consulting Services (22) Preparation of Draft Final Report (23) Discussion on Draft Final Report (24) Preparation of Final Report Inception Report Submittals Interim Report Draft Final Report Final Report Work in PNG Work in Japan 1-10
77 SECTION 2 BACKGROUND OF THE PROJECT

78 SECTION 2: BACKGROUND OF THE PROJECT 2.1 Papua New Guinea Socio-Economic Conditions 1) Regions and Provinces Papua New Guinea consists of four regions and the regions are further divided into one capital district and 22 provinces as shown in Figure and Table Nadzab/Lae Airport is located in Morobe Province (numbered 11 below). Figure Provinces of Papua New Guinea Table Regions and Provinces of Papua New Guinea No. Province Capital Region No. Province Capital Region 1 Central Port Moresby Southern 12 New Ireland Kavieng Islands 2 Chimbu Kundiawa Highlands 13 Northern Popondetta Southern 3 Eastern Highlands Goroka Highlands 14 AR *1 of Bougainville Arawa Islands 4 East New Britain Kokopo Islands 15 Southern Highlands Mendi Highlands 5 East Sepik Wewak Momase 16 Western Daru Southern 6 Enga Wabag Highlands 17 Western Highlands Mount Hagen Highlands 7 Gulf Kerema Southern 18 West New Britain Kimbe Islands 8 Madang Madang Momase 19 West Sepik Vanimo Momase 9 Manus Lorengau Islands 20 NCD *2 Port Moresby Southern 10 Milne Bay Alotau Southern 21 Hela Tari Highlands 11 Morobe Lae Momase 22 Jiwaka Minj Highlands Note. AR *1 : Autonomous Region, NCD *2 : National Capital District 2-1
79 2) Population Population in Papua New Guinea increased from million in 1980 to million in 2011 at an annual growth rate of 2.9 %. Population of the provinces is shown in Table Table Population of Provinces in Papua New Guinea PROVINCE (Share %) Growth Rate (%) PAPUA NEW GUINEA 3,010,727 3,761,954 5,190,786 7,275,324 (100) 2.9 SOUTHERN REGION 588, ,193 1,041,820 1,456,250 (20.1) 2.9 Western 78, , , ,351 (2.8) 3.0 Gulf 64,120 68, , ,197 (2.2) 2.9 Central 116, , , ,756 (3.7) 2.7 National Capital District 123, , , ,125 (5.0) 3.5 Milne Bay 127, , , ,512 (3.8) 2.5 Northern 77,442 96, , ,309 (2.6) 2.8 HIGHLAND REGION 1,121,258 1,373,673 1,973,996 2,854,874 (39.2) 3.0 Southern Highlands 236, , , ,245 (7.0) 2.5 Hela N/A N/A 185, ,449 (3.4) 3.1 Enga 164, , , ,045 (5.9) 1.0 Western Highlands 265, , , ,850 (5.0) 2.4 Jiwaka N/A N/A 185, ,987 (4.7) 2.4 Chimbu 178, , , ,473 (5.2) N/A Eastern Highlands 276, , , ,825 (8.0) N/A MOMOSA REGION 857,773 1,027,600 1,433,432 1,867,657 (25.7) 2.5 Morobe 310, , , ,810 (9.3) 2.5 Madang 211, , , ,906 (6.8) 2.8 East Sepik 221, , , ,530 (6.2) 2.3 West Sepik 114, , , ,411 (3.4) 2.5 ISLANDS REGION 442, , ,538 1,096,543 (15.0) 2.9 Manus 26,036 32,840 43,387 60,485 (0.8) 2.7 New Ireland 66,028 86, , ,067 (2.7) 3.5 East New Britain 133, , , ,369 (4.5) 2.9 West New Britain 88, , , ,264 (3.6) 3.5 AR Bougainville 127, , , ,358 (3.4) 2.1 Data: National Population & Housing Census 2011, National Statistical Office, Papua New Guinea 2-2
80 3) National Economy a) Past Trend of GDP Gross Domestic Product (GDP) is typical socio-economic index which represents the situation of economy in PAPUA NEW GUINEA. International Monetary Fund (IMF) releases the historical GDP to their web site. Table and Figure show typical historical trend of GDP, GDP per capita and population. GDP was stagnant until around 2006 but thereafter it has been growing at annual growth rate of 6-10%. Table Historical Growth of Typical GDP, GDP per Capita and Population GDP GDP per Capita Population Year Kina Change Kina USD Person (billion) (%) (million) ,715 1, ,566 1, , , , , , , , , , ,561 1, ,627 1, ,688 1, ,773 1, ,914 1, ,019 2, Constant Price Current Price Source: IMF, World Economic Outlook Database, April 2014 Source: IMF, World Economic Outlook Database, April 2014 Figure Historical Growth of GDP in PAPUA NEW GUINEA Papua New Guinea s Development Performance dated September 2010 prepared by National Research Institute, briefly explains the economic situations during the 2-3
81 periods of , and as follows: The period of was payback time ; government expenditure had to be trimmed drastically. During the El Nino drought of 1997, people in the Highlands went hungry. The tough times saw a retraction in access to basic public services due to cost cutting by the government. It was also a period of high political instability. The period of was one of reconsolidation, during which benefits from earlier legislative changes bore fruit in terms of political stability (emanating from the Organic Law and Integrity of Political Party Act of 2001), policy stability (emanating from the Central Bank Act of 2000), and financial sector revival (following privatization of the Papua New Guinea Banking Corporation and passage of the Banks and Financial Institutions Act of 2000). The period of 2006 to 2008 was one in which the economy was back on full stream, riding the commodity price boom propelled by growth of income in India and China and benefiting from continued political and policy stability. Table shows GDP growth rates of industrial sectors and their share in total GDP. Since 2006 or 2007, the construction sector was the driving force of economic growth. The construction sector GDP increased at annual growth rates of 15.1% from 2003 to 2012 and 21.7% from 2008 to 2012 respectively, expanding its share in total GDP from 11.7% in 2006 to 16.7% in Other sectors that demonstrated robust growths are the transport and communication as well as the trade and finance. 2-4
82 Table Sectoral GDP Growth Rates and Share Item Year Total Agriculture Mining Manufac. Electricity Gas & Water Construction Trade Transport & Communication Finance Public Administration Others % -0.2% -1.8% 2.3% 1.7% 3.2% 3.2% 2.6% -3.4% -2.4% 1.0% % 5.6% 1.2% 8.3% 5.1% 4.8% 3.5% 3.0% 10.2% 2.0% 21.7% % 1.0% -8.5% 4.0% 1.3% 12.0% 8.4% 5.0% 9.7% 3.0% 12.4% % 4.2% -0.1% 6.0% 4.0% 16.0% 10.0% 41.3% 5.0% 4.0% 30.2% Growth Rates % 4.3% -1.4% 6.0% 6.8% 15.0% 7.0% 39.9% 6.0% 3.0% 6.5% % 0.7% -1.7% 0.2% 7.5% 19.8% 9.5% 29.0% 15.0% 3.0% 7.3% % 2.9% -2.0% 14.0% 9.4% 17.1% 12.6% 20.1% 9.5% 3.3% 4.9% % 8.6% -11.8% 13.0% 9.5% 26.0% 18.0% 16.0% 20.1% 5.0% 3.9% % 0.2% 0.6% 10.0% 12.0% 24.0% 15.0% 16.0% 10.0% 6.0% 4.7% % 3.0% -2.9% 7.0% 6.3% 15.1% 9.6% 18.4% 8.9% 3.0% 9.9% % 3.0% -3.8% 9.2% 9.6% 21.7% 13.7% 20.2% 13.6% 4.3% 5.2% % 37.6% 11.7% 7.7% 1.5% 11.7% 7.1% 2.6% 4.1% 13.2% 2.7% Share % 32.5% 8.5% 7.5% 1.5% 16.7% 7.9% 6.2% 4.5% 11.5% 3.3% Data source: Key Indicators for Asia and Pacific 2013, ADB 2-5

83 b) ADB s View Some of the important descriptions related to the national economy of Papua New Guinea were extracted from Asian Development Outlook 2014-Papua New Guinea, ADB dated April 2014, as presented below. Economic performance Economic growth in Papua New Guinea slowed to 5.1% in 2013 as construction on a $20 billion liquefied natural gas (LNG) project wound down toward completion in mid Growth in construction halved from 24% in 2012 to 12% in 2013, and this deceleration spilled over into the broader economy, slowing growth in wholesale and retail trade from 20% in 2012 to 5% in Long-term declines continued at a number of older mining and oil operations, but they were more than offset by increased output from a new nickel project, such that mining and quarrying as a whole expanded by 15% in Agriculture, forestry, and fisheries grew at a modest 0.5% in Although this improved on the 1.6% contraction in 2012, conditions in the sector continue to be hampered by falling commodity prices, declining yields from aging plantations, inadequate pest control, and poor transport infrastructure. Further, an elevated exchange rate for much of the year discouraged farm output, especially of labor-intensive cash crops like copra, cocoa and coffee. Economic prospects GDP growth is forecast at 6.0% in 2014, picking up to a record 21.0% in the following year although ongoing challenges with the quality of macroeconomic data continue to limit the accuracy of these forecasts. Leading this growth is oil and gas, as LNG production is expected to commence in late 2014, making 2015 the first full year of production. The rebound in mining and quarrying is expected to continue as new operations further expand production, boosting real growth in that sector to 14.0% in 2014 before it fall back to 3.1% in

84 In contrast with mining and petroleum extraction, activity in the rest of the economy is expected to continue to slow, with growth forecast at just 1.6% in Construction is forecast to contract by 6.4% in 2014, following the completion of the LNG production facilities and pipeline by the middle of the year. Growth in transport and logistics, wholesale and retail trade, and financial services will ease from the highs recorded over the previous 3 years. The agriculture, forestry, and fisheries sector is expected to recover, with growth of 4.0% in both 2014 and Agricultural output is expected to be boosted by the kina s decline at the end of 2013, which has improved the export competitiveness of cash crops. Although GDP growth is expected to hit record highs in 2015, this will have only limited immediate impact on the broader economy and job creation. As international investors own some 80% of the LNG project, it is likely most earnings will remain offshore. And, as the project comes onstream, employment in the project will drop dramatically, from a peak of about 16,000 workers during construction to a few hundred once the project is fully operational. As a result, the project will have much less impact on gross national income than on GDP. The project s key transmission mechanism to the domestic economy will be dividend and tax payments to the national government, which are expected to peak in the early 2020s. During the initial yeas of production, some of these revenues will likely be required to service loans that fund the state s equity holding in the project. They may also be used for investment in further resource development c) IMF s View Papua New Guinea Staff Report for the 2013 Article IV Consultation in December 2013 (IMF Country Report No. 13/339) stipulates the key issues related to the national economy of Papua New Guinea as follows: Key Issues Context: After a decade of strong growth, Papua New Guinea now faces a sharp slowdown in the nonmineral sector as construction winds down on a large Liquefied Natural Gas (LNG) project. LNG revenue increases are expected to be modest and one-off over the near to medium term, posing challenges to meet the country s huge development needs while trying to maintain debt sustainability. PAPUA NEW GUINEA needs to create an enabling environment for sustained, inclusive growth in the post boom era. 2-7
85 Outlook and risk: Overall growth prospects remain generally positive, but the slowdown of the nonmineral sector increased headwinds for job-creating growth. Inflation is expected to stabilize at lower levels than in the recent past. Risks to economic growth in are broadly balanced, but they are increasing tilted toward the downside over the longer term, reflecting uncertainty over mineral prices and investment and global shale gas development. Policy assessment: Policy discussion focused on resource revenue management, macroeconomic and financial stability, and structural reforms to engender sustained, inclusive growth. Key recommendations include: Target a moderate fiscal deficit in 2014 in line with absorptive capacity and focus on improvement in spending quality. Over the medium term, constrain and smooth spending to stay below the government s debt ceiling of 30 percent of GSP. Strengthen the interest rate channel of monetary policy transmission by reducing excess liquidity. Closely monitor financial sector risks arising from possible price corrections in certain segments of the property market. Improve transparency in the management of resource revenue; safeguard resources for the sovereign wealth fund; continue to reform public enterprises; improve the business environment; and strengthen the agricultural sector. Take early action to address long-standing issues on economic statistics and anti-money laundering and combating the financing of terrorism. Papua New Guinea Staff Report for the 2013 Article IV Consultation in its Table of Papua New Guinea Medium-term Scenario presented future GDP growth scenario as shown Table Table IMF Prospect on Annual Growth Rates of Real GDP of Papua New Guinea Year Actual Estimated Projected Real GDP Mineral Nonmineral Source: Papua New Guinea Staff Report for the 2013 Article IV Consultation in December 2013 d) Papua New Guinea Vision 2050 In December 2007, the National Executive Council (NEC) of Papua New Guinea, on advice from the National Planning Committee (NPC), made an decision to develop a framework for a long-term strategy- The Papua New Guinea Vision that should map out the future direction for the country and reflect the aspiration of the people of Papua New Guinea. With regard to the future economic growth, following four scenarios were presented in PAPUA 2-8
86 NEW GUINEA Vision 2050: i) Base Case (Scenario One); The Base Case Scenario (Scenario One) in the economic growth projections involving renewable resources is the minimum possible under improved service delivery, the promotion of human capital development, increased downstream processing, development and adoption of new technologies and improved productivity. The economy will grow in real terms at an average of 4.5 percent per year up to With an estimated population growth of 2.5 percent over the next 40 years until 2050, an increase in per capita income is expected. ii) Scenario Two; When Land Reform (Scenario Two) is undertaken starting in 2010, the Base Case Scenario will be enhanced. When around three percent more of customary land is brought into production in the normal sector, the economy is projected grow at additional 1.2 percent each year on average. This scenario will empower the people to participate in income-generating activities through cultivation of their land. This will lead to broad-based economic growth and ensure balanced development in rural and urban areas. iii) Scenario Three; With the inclusion of the Liquefied Natural Gas (LNG) project (Scenario 3), excluding land reform, the economic growth will be even better. iv) Scenario Four; When the combined three scenarios are realized (Scenario Four), real GDP growth will more than double. The expected real GDP under differenct scenarios are as as shown hereunder and summarized in Table Table Expected Average Annual Growth Rates of PAPUA NEW GUINEA Vision 2050 Period Base Case (BC) Land Reform with BC LNG with BC Cumulative with BC/LNG Scenario One Scenario Two Scenario Three Scenario Four Note. The growth rates were computed based on Table 2.1 Four Pronged Projected Economic Scenario


87 Source: Papua New Guinea Vision
88 e) 2014 Budget Strategy Paper of Papua New Guinea With regard to economic outlook , 2014 Budget Strategy Paper presented by the Minister for Treasury stipulates as follows: Economic activity over the medium term ( ) is underpinned by the winding down of the PNG LNG project construction phase in 2013 and the commencement of the PNG LNG project production towards the end of 2014 leading to a ramp up to full production in Growth is projected to ease to 6.0 per cent in 2014 with the winding down of the PNG LNG project construction phase in 2014 before increasing to 21.5 per cent in 2015 reflective of the commencement of PNG LNG project production towards the end of 2014 before returning to a growth of around 3.0 per cent thereafter. Other sectors of the economy are also expected to grow over the medium term in line with the major drivers of the economy. Inflation is projected to pick up slightly to 6.5 per cent in 2014 and ease slightly to 5.0 per cent thereafter, assuming credible monetary policy and restrained fiscal policy. Table 2.1-7a 2015 to 2018 Economic Outlook presented by Minister of Finance Actual Estimated Projected Economic Growth (%) Total GDP (Estimated) Non-Mining GDP (Estimated) Inflation (%) Year average Data source: Extracted from 2014 Budget Strategy Paper According to 2015 National Budget, Volume 1 available at the time of Draft Final Report preparation, Papua New Guinea economy in 2014 is expected to grow at 8.4% and is projected to grow at 15.5% in The expected total growth in 2014 and 2015 in 2014 Budget Strategy Paper was 28.8% while the latest expected growth in the same period is 25.2%. 2-11
89 f) Debt Strategy According to 2015 National Budget Volume 1, the estimated budget deficit is projected to be PGK 2,272.2 million in 2015, which is slightly lower than the estimated deficit of PGK 2,429.0 million in In 2014, the State s financing methods comprised of: i) Issuance of Kina denominated Inscribed Stock and Treasury Bills via tender for general funding. These were done at monthly and weekly intervals respectively; and ii) Foreign currency denominated loans from development partners for specific projects. Inscribed Stocks are bond securities of varying maturities (3 to 17 years) issued domestically via competitive tender. Treasury Bills are a discount security issued for 182 days or 364 days via competitive tender. Foreign currencies denominated loans are primarily concessional loans from bilateral or multilateral development partners and are generally repayable over years. Refer to Table 2.1-7b. Table 2.1-7b Central Government Debts (2015 National Budget Volume 1) Estimated Financing Source Balance Repayment Borrowing Balance Change 2014 end end 2015 Domestic Debt 10, , , , ,038.8 Treasury Bills 4, , , , ,747.8 Inscribed Stock 6, , , External Debt 3, , Int l Agencies 3, , Commercial Loans Total 14, , , , % of Nominal GDP 35.5% % - Fiscal Responsibility Act 2006 imposes a normal debt to GDP limit on central Government borrowings of 35% of GDP for 2013, 2014 and 2015, with the level falling to 30% thereafter. Whilst it is expected that the ratio will slightly exceed the 35%-threshold in 2014, it is projected to fall to 27.8% in the following year. It is further expected to fall over the remaining years, reaching a low of 23.6% in Table 2.1-7c shows the debt sustainability measures (debt to GDP). Table 2.1-7c Debt Sustainability Measures (2015 National Budget Volume 1) Debt to GDP 34.6% 35.5% 27.8% 28.0% 26.6% 25.2% 23.6% 2-12

90 4) Mineral Resources a) Generally Contribution of the mineral sector to GDP growth was negative until 2012 but has become positive in 2013 and will be significant in 2014 and 2015 as shown in Table The exports of mineral have been accounting for approximately 75% of the total as shown in Table Table Contribution of Mineral Sector to Balance of Payment (Billion US$) Description Actual Estimated Projected Exports, FOB Of which Mineral (Share in Exports, %) 3.4 (75.5) 4.4 (74.6) 4.9 (71.0) 4.5 ( (75.1) 5.5 (76.4) Imports, CIF Source: IMF Papua New Guinea Staff Report for the 2013 Article IV Consultation in December 2013 b) Location of Oil and LNG Projects Figure shows location of the oil and LNG projects in Papua New Guinea compiled by Papua New Guinea Chamber of Mines and Petroleum, The majority of current and possible project sites are located in the Regions of Western, Southern Highlands and Gulf. Figure Location of Oil and LNG Projects in Papua New Guinea 2-13

91 c) PNG LNG Project The PNG LNG Project is an integrated development that includes gas production and processing facilities in the Southern Highlands, Hela, Western, Gulf and Central Provinces. There are over 700km of pipelines connecting the facilities, which includes a gas conditioning plant in Hides and liquefaction and storage facilities with capacity of 6.9 million tons per year. The investment for the initial phase of the Project, excluding shipping costs, is estimated at US$19billion. Over the life of the Project, it is expected that over nine trillion cubic feet of gas will be produced and sold. PNG LNG will provide a long-term supply of liquefied natural gas (LNG) to four major customers in the Asian region including: iii) China Petroleum and Chemical Corporation. iv) Osaka Gas Company Limited. v) The Tokyo Electric Power Company Inc. vi) CPC Corporation. The Project will progress in a series of development phases with the first LNG deliveries scheduled to begin in (About PNG LNG from Official Website of PNG LNG Project Figure Schematic Diagram of PNG LNG Project (Source: PNG LNG Project Overview by Oil Search) d) Morobe Mining Joint Venture (MMJV) Based on the information shown on MMJV website, summary descriptions of MMJV and location map are presented below. 2-14
92 Morobe Mining Joint Venture (MMJV) is a joint venture between Harmony Gold Mining Company of South Africa and Newcrest Mining Limited of Australia. MMJV was formally established in August 2008 for the purpose of exploring, developing and operating mines in the Morobe Province of Papua New Guinea. The MMJV covers all current and future mining project and exploration activities by the two parent companies in the Morobe Province, including the Hidden Valley Gold Mine and significant resource discovery at Wafi/Golpu. Morobe Mining Joint Venture is the collective name for three Joint Venture entities entered into between Harmony and Newcrest: Hidden Valley Mine Joint Venture (HVJV), open pit gold and silver mine, located 90km southwest of Lae Seaport. Wafi-Golpu Joint Venture (WGJV), with estimated mineral resources of 28.5 million ounces of gold and 9.1 million tons copper and 50.6 million ounces of silver, located 65km southwest of Lae Seaport; and Morobe Exploration Joint Venture (MEJV), with known mineral endowment of over 25 million ounces of gold, 102 million ounces of silver and 55 thousand kg of molybdenum. MMJV is based in Morobe Province and its scope of operations and properties includes, the operating Hidden Valley Gold mine, the significant copper gold porphyry Wafi Golpu project-(in pre-feasibility study phase), an exploration base in Wafu and a PNG Central Services Office in Lae. MMJV also has an extensive Brown and Greenfield s exploration program with 13 exploration leases (6 new applications) covering more than 4046km 2 in the province. (Abstracted from Morobe Mining Joint Venture Website) 2-15

93 Figure Location of MMJV Project Sites (Source: Morobe Mining Joint Venture Website) 2-16
94 5) Tourism Master Plan In September 2006, Papua New Guinea Tourism Sector Review and Master Plan ( ) Growing PNG Tourism as a Sustainable Industry (hereinafter referred to as the Tourism M/P ) was formulated by the Independent Consumer and Competition Commission (ICCC) PNG and the Tourism Promotion Authority (PNGTPA). The Tourism M/P defined its Vision as by 2017 PNG tourism is a growing and sustainable industry which: Is recognized globally as a destination which offers a range of unique niche adventure tourism experiences; Generates significant investment and employment through profitable business opportunities and subsequently the development of economy; Celebrates, protects and enhances our unique cultural heritage and natural environment by showcasing these attributes; Provide visitors with an enjoyable, distinct and memorable experience; Demonstrates partnership and collaboration across all stakeholders; and Provide a broad distribution of benefits across PNG thereby improving the lifestyles of rural and urban communities. The overall goal that should be adopted and targeted for the next 10 years is to increase the overall economic value of tourism to the nation by doubling the number of tourists on holiday in PNG every five years and maximizing sustainable tourism growth for the social and environmental benefit for all Papua New Guineans. The key recommendations to achieve the Vision for tourism in PNG are: Marketing the destination; Product development and investment; Transport and infrastructure; Human resource development; and Institutions and industry partnerships. One of the recommendations related to the air transport sector is upgrading and undertaking of maintenance of existing airport infrastructure to a fit for purpose basis backed by a commercial justification for the investment in terms of its future demand prospects and access to concessional loans and funding to be subject to full cost/benefit assessment. According to the Review of Progress as of September 2012, at the level of the overarching goals of holiday arrivals, expenditure and employment, the implementation of the Tourism M/O has been successful; holiday arrivals have doubled since 2005 (at year end 2011) and all arrivals by 120 percent. The expenditure goal for 2010 was exceeded two year ahead of target. It is 2-17
95 estimated that around 20,000 jobs have been created in the tourism sector since 2005 due to the growing number of visitors which is ahead of the M/P target. An assessment of the level of implementation within the five focal areas identified indicates a varying level of success in terms of implementation from high (Marketing) to moderate to high (Transport and Infrastructure) to moderate (Institutions and Industry Partnerships) to low to moderate (Human Resource Development and Investment Incentives and Product Development). 6) Visitor Survey 2011 Visitor Survey Report-2011 was compiled by PNG Tourism Promotion Authority. The report covers the result of the eight round of visitor survey conducted in Papua New Guinea from April to September The survey was conducted continuously throughout the period so as to get a better representative data that will determine near accurate findings after its analysis. Major findings are shown below. a) Purpose of Visit Holiday travelers; 28%. Business; 32%. Short-term employment; 22% Visiting families and relatives, others; 18%. b) Average Length of Stay: 20.4 days. c) Average Expenditure: US$ /visitor/day (See below.) Table Average Expenditure by Purpose of Visit Description Business Holiday Work VFR Education M&C Sports Church Others Total A.E.P.H PGK 9,247 12,706 10,620 9,445 10,689 8,775 12,250 8,550 9,273 9,679 US$ 4,041 5,552 4,641 4,127 4,671 3,834 5,353 3,737 4,052 4,230 L.O.S (days) Daily Exp. PGK , US$ Total (Persons) ,000 A.E.P.H: Average Expenditure per Head, L.O.S/: Length of Stay, Daily Exp.: Daily Expenditure, VFR: Visiting families and Relatives, M&C: Meeting & Conference, PGK: Papua New Guinean Kina 2-18
96 d) Visitor Arrivals by Region Province Business Holiday VFR Education M & C Work Others Total Daru % Kerema % Central % NCD , % Kokoda % Alotau % Oro % Lae % Madang % Wewak % Vanimo % Tari % Mendi/Moro % Wabag % Hagen % Simbu % Goroka % Rabaul % Kimbe % Kavieng % Lorengau % Buka % 1,476 2, , , % Total 26.2% 36.4% 5.5% 3.5% 2.1% 19.5% 6.8% 100.0% - Data Visitor Survey 2011 Report, PNG Tourism Promotion Authority Road Networks and Sea Ports 1) Road Networks The roads in Papua New Guinea have developed around the provincial centers of population, many of which are on the coast and lined nationally by coastal shipping. Local road networks have been developed from these coastal centers, along the coastal plains and up river valleys and over mountain passes to penetrate inland. The Highlands Region is landlocked, with the main centers connected by air, and this spurred the development of the Highlands Highway, connecting the five inland provinces with the coast and PAPUA NEW GUINEA s main port of Lae. This pattern of development has resulted in separated road networks. There has been a long held aspiration to link the networks on the main island of New Guinea together, although making these linkages often involves long lengths of high cost road through less populated parts of the country and over difficult mountainous or swampy terrain. The travel time and cost for some of these missing links, if constructed, will not always compare favorably with coastal shipping, and the economic rationale for making the connections needs to 2-19
97 be weighed against other priorities, so that only those links that can be shown to have good economic and social benefit in relation to cost are constructed. The public road network in PAPUA NEW GUINEA comprises declared national roads, the responsibility of national government and other sub-national roads, the responsibility of provincial and local level governments. National roads are currently classified into national routes (NR), the main inter-provincial connecting roads, national main roads (NM), national district roads (ND) and national institutional roads (NI-access roads serving state institutions). Among the national road networks, those related to Morobe Province are briefly described hereunder. a) Highlands Highway Network: Backbone connector between the main port of Lae in Morobe Province and five Highland Provinces. NR0004: branching off southwest outside of Lae, passing through Morobe Province to the old goldfields area of Bulolo and Wau. NR0007: crossing the braided floodplain of the Markham River and, at Waterais Junction, turn southwest to Goroka and Mt. Hagen. NR0005 and NR0006: west of Hagen, the road divides at Togoba into the Enga Highway to the northwest to Wabag (NR0006) while the Highlands Highway continues west to Mendi in Southern Highlands Province (NR0005). b) Madang Network Ramu Highway (NR0008): the Highlands Highway connects to Madang Province via the Ramu Highway (NR0008) from Waterais Junction, following Ramu River Valley to Usino, and then turning northeast to Madang. Coastal Highway (NR0009) runs northwest from Madang along the coastal margin. Figure shows an old map of road network of Papua New Guinea. The map was prepared in February 1986, but no significant difference is observed from the current description. 2-20

98 Figure Schematic Road Network in Papua New Guinea 2-21
99 2) Sea Ports a) Generally PNG Ports Corporation Limited (PNGPCL) is the agency delegated with the responsibility for maintenance and development of the government-owned port facilities and for the general management of activities within the defined port limits of the declared ports under the Harbors Act. There are 22 declared ports, of which 16 are operated by PNG Ports Corporation, either directly or through agents. Port Moresby, Lae, Kimbe, Rabaul, Oro Bay and Madang have port facilities capable of accommodating vessels exceeding 150m length and draft up to 10m. Table shows the traffic through declared ports under PNG Ports. important port in terms of cargo volume. Lae is the most Table Traffic through PNGPCL Declared Ports Port Province Operator Total % Int l Containers Ship Calls /Status Cargo ( 1000 TEU) ( 1000s) Lae Morobe PNG Ports Port Moresby Central/NCD PNG Ports Kimbe WNB PNG Ports Rabaul ENB PNG Ports Wewak East Sepik PNG Ports Oro Bay Oro PNG Ports Madang Madang PNG Ports Alotau Milne Bay PNG Ports Buka Bougainville PNG Ports 0.09 N/A Kavieng New Ireland PNG Ports Kieta Bougainville PNG Ports Vanimo Sandaun PNG Ports Lorengau Manus PNG Ports Aitape West Sepik Agent N/A N/A N/A N/A Samarai Milne Bay Agent N/A N/A N/A N/A Daru Western Not in use Kerema Gulf Not in use Kinim (Karkar) Madang Not in use Siassi Morobe Not in use Kupiano Central Not in use Lihir New Ireland Mining Co. N/A N/A N/A N/A Misima Milne Bay Mining Co. N/A N/A N/A N/A 2-22
100 Port Province Operator Total % Int l Containers /Status Cargo ( 1000 TEU) Total PNG Ports Ship Calls ( 1000s) Notes TEU=Twenty-foot Equivalent Units, includes container movements; Total Cargo is million revenue tons; figures projected to 2010 and are approximate. Source: TIPS base data set. Abstract from National Transport Strategy Volume 3: Detailed Strategy b) Lae Port Major commodity groups exported from Papua New Guinea are agricultural products and fuel/mining products, and dominating commodity group imported is manufactures as presented in Table below. Table Breakdown of Main Commodity Groups in Export/Import of PAPUA NEW GUINEA Breakdown in economy s total exports By main commodity group Breakdown in economy s total imports By main commodity group Agricultural products 23.6% Agricultural products 16.2% Fuels and mining products 43.8% Fuels and mining products 16.2% Manufactures 4.1% Manufactures 60.5% Source: Trade Profiles prepared by World Trade Organization Table shows cargo revenue tonnages at major ports of Lae and Port Moresby and others in 2007, 2008 and 2009 (only data extractable from PNGPCL website). Lae accounted for almost half the tonnages of all types of the cargo except for the Palm Oil, followed by Port Moresby. In the hinterland of Lae Port there exist Highland Provinces where abundant fruit and vegetable products are grown and MMJV exploiting gold, cooper, etc. As the industrial center of Papua New Guinea, several large-scale manufacturers are located in and adjacent areas to Lae. According to a magazine published by PNGPCL, profile of Lae Port is described The location of Lae city makes Lae Port the most strategic marine gateway to PAPUA NEW GUINEA. The Port is connected to the Highlands by road and the Island can easily be accessed by coastal vessels at low cost. These are two resource rich regions of the country that are also home to a thriving agricultural sector. Coffee, tea, cocoa and copra from the two regions have been exported out of Lae Port for many decades and this will continue into the future. Furthermore, the city is the industrial hub of the country, with the manufacturers using the port to move their products to markets in the Asia/Pacific region as well as in PAPUA NEW GUINEA, thus Lae will continue to provide that point of contact in the logistical supply chain between land transportation and the 2-23
101 shipping industry. Currently Lae Port is handling over million tons of cargo monthly and berthing facilities are being expanded and wharf structures redeveloped to improve efficiency and productivity at the country s premier port. The work is in line with PNGPCL s 20 Year Corporate Strategic Plan and also the National Government s Vision 2050 and Medium Term Development Plans. The company will continue to invest in its infrastructure to meet demands and regulatory requirements. It is important that Lae Port operates in an efficient, safe and secure environment for the benefit of all port users. In recent years, business for the port has grown significantly, driven by the economy and it is important that Lae is maintained as a well-functioning and efficient port to effectively manage the movement of freight within the port area between sea and land transportation. (Extract from Ahoy October-December 2013) 2-24
102 Year Description Overseas Coastal Total Container Break Bulk Palm Oil Bulk Fuel Data: PNGPCL s Website Table Cargo Revenue Tonnages at Major Ports of Lae, Port Moresby and Others (2007 to 2009) Lae Port Moresby Others Total Lae Port Moresby Others Total Lae Port Moresby Import 926, , ,279 1,513, , , ,244 1,595, , , ,840 1,623,871 Export 244,922 64, , , ,282 81, , , ,728 66, , ,047 Import 375, ,320 83, , , ,386 77, , , ,634 77, ,433 Export 85,158 33,571 50, ,841 80,433 38,247 59, ,596 62,121 37,709 56, ,446 Import Export , , , , , ,207 Import 51,506 10,288 4,245 66,039 81,872 8,272 19, , , , ,508 Export 109 1,499 22,587 24,195 3,872 4,584 17,885 26,341 11,293 1,079 12,477 24,849 Off & On 50,280 50,745 16, ,565 44,352 33,827 19,981 98,160 43,574 44,733 3,294 91,601 Total 1,733, , ,897 3,369,990 2,028, , ,344 3,789,904 1,929, , ,638 3,677,962 Container Break Bulk Palm Oil Bulk Fuel Import 142, , , , , , , , , , , ,708 Export 500, , , , , , , , , , , ,945 Import 100,054 31, , ,742 84,257 47, , ,132 79,025 25, , ,455 Export 135,838 58,625 80, , ,805 54,267 97, , ,010 50,589 88, ,571 Import Export Import 144,974 9, , , ,364 7, , , ,365 1, , ,821 Export 14,522 36,945 5,363 56,830 12,091 32,128 11,575 55,794 32,785 92,401 13, ,995 Off & On 21,728 7,987 16,470 46,185 1,262 5,588 13,344 20,194 1,244 3,377 7,745 12,366 Total 1,060, , ,602 2,393,072 1,089, ,339 1,048,264 2,714,965 1,054, , ,525 2,545,029 2,794,093 1,296,470 1,672,499 5,763,062 3,117,639 1,393,622 1,993,608 6,504,869 2,984,025 1,434,803 1,804,163 6,222,991 Share of Lae and Port Moresby 48.5% 22.5% 29.0% 100.0% 47.9% 21.4% 30.6% 100.0% 48.0% 23.1% 29.0% 100.0% Others Total 2-25
103 2.1.3 Air Transport Sector 1) Overall Transport Sector Structure Figure illustrates the general structure of the institutions in the transport sector at national level. Parliament Shareholders/Owners Minister (Transport, Works. Civil Aviation) Minister (SOEs. Civil Aviation) Secretary Board/Authority/Council Board/Directors Board/Directors/Owners Departmental Officers Executive Management Executive Management Executive Management Government Departments (DOT, DOW) Statutory Authorities (CASA, AIC, etc.) State-Owned Corporations (, PNGASL, Air Niugini, etc.) Transport and Construction Companies Policy, Planning and Legislation Matters Public Commercial Operations Private Figure Institutional Structure of the Transport Sector Source: National Transport Strategy Volume 3: Detailed Strategy The Department of Transport (DOT) has the primary responsibility for the transport sector, headed by the Secretary for Transport under the Minister. Within the DOT, there are divisions for policy development, planning and monitoring of sector expenditure, liaison with and assistance to the provinces, and modal divisions for land transport, maritime, air traffic regulation and air services licensing, aviation security and maritime security. The Department of Works (DOW) has responsibility within the Government for managing the national road assets, in particular contract management for road construction and maintenance. It also has responsibility for engineering standards, for some engineering technical services and maintains a capacity for direct engineering works for emergency reinstatements and in remote areas. 2-26
104 There are five authorities in the sector; the National Roads Authority (NRA), National Road Safety Council (NRSC), National Maritime Safety Authority (NMSA), Civil Aviation Safety Authority (CASA) and Accident Investigation Commission (AIC). There are five State Owned Enterprises (SOEs) including. The SOEs are expected to operate on commercial basis, deriving their revenue from charges made for the services that they provide. In practice there is a degree of reliance on Government financial support for capital works and operations for most of the SOEs, as full cost recovery is not currently achieved. In part this is due to the expectation by Government that the SOEs responsible for port, airport and air services will support non-commercial parts of their operations by internal cross-subsidy, as an informal community service obligation. (Source: National Transport Strategy Volume 3: Detailed Strategy) 2) Air Transport Sector Institutions Figure shows the present structure of the government agencies in civil aviation. There has been recent reform of the agencies, separating the safety regulation from delivery of air traffic and airport services. Minister for Transport Minister for Civil Aviation Secretary for Transport Civil Aviation Safety Authority (CASA) Board PNG Air Services Ltd. (PNGASL) Board National Airports Corporation () Board Accident Investigation Commission (AIC) DOT Policy & Planning Wing DOT Air Transportation Division DOT Transport Secretary Unit CASA Executive PNGASL Executive Executive AIC Executive - Ministerial advice - Policy and Planning - Sector Monitoring - Budget Coordination - Air transport regulation - International air agreement negotiation - Air service licensing - Policy and regulatory enforcement for aviation security - Civil aviation safety regulatory enforcement and monitoring - Airport and aerodrome operation certification - Air crew certification - Airlines certification - Air traffic controller training and certification - Provision of air navigation and airways services - Maintenance, development and asset management of national government owned airports - Investigation of the circumstances and causes of air accidents and incidents with a view to future prevention Figure Institutional Structure of Air Transport Sector Source: National Transport Strategy Volume 3: Detailed Strategy The governing legislation is the Civil Aviation Act 2000, which is shortly to be amended to reflect all of the institutional changes, for which the minister of civil aviation is the responsible minister. 2-27
105 The DOT provides ministerial advisory services and policy and planning input to the air transport sector. The Air Transport Division (ATD) of DOT is responsible for the negotiation and administration of international air service licensing agreements for overseas carriers to provide services into and through Papua New Guinea. ATD is also responsible for issuing air services licenses to carriers. The Transport Security Unit within DOT is responsible for developing security policy and for ensuring that PAPUA NEW GUINEA complies with international conventions and agreements relating to aircraft, air service, air passenger and air cargo security both externally and internally. The recently formed Civil Aviation Safety Authority (CASA) is the principal regulatory agency in the sector and is responsible for safety certification of air operators, aircraft, air crew, air traffic controllers and airports. It ensures that PAPUA NEW GUINEA complies with international air safety conventions under ICAO. PNG Air Services Ltd. (PNGASL) is the SOE responsible for providing, maintaining and developing air navigation and airways services infrastructure, comprising ground and satellite based navigation systems and management of the upper, middle and lower airspace, including overflying. PNGASL also coordinates aviation search and rescue. National Airports Corporation () is the SOE responsible for the provision, maintenance and development of 21 national government owned airports, including aviation security, airport fire crash and rescue services and control of ground movements of aircraft and other airport vehicles and equipment. The Accident Investigation Commission (AIC) is a recently formed body responsible for investigation of the circumstances of air accidents on a no fault basis with a view to future prevention. (Source: National Transport Strategy Volume 3: Detailed Strategy) 3) National Airports Corporation Ltd () was incorporated under the Companies Act 1997 and established under the Civil Aviation Amendment Act 2010 as a state owned commercial enterprise for the purposes of owning, operating, managing and maintaining airports and providing all related services in Papua New Guinea. undertakes airport master planning and feasibility studies for airport development in coordination with DOT and consistent with the National Transport Strategy (NTS) and Medium Term Transport Plan (MTTP), and is responsible for the implementation of the agreed works, with capital funding provided from sources agreed with the Government. 2-28
106 is also the primary agency for setting airport operational and engineering standards and practices and, on a fee-for-service basis, provides airport engineering, asset management and technical advisory services to the provinces for the upkeep of provincial airports and rural airstrips under provincial, local level government and local community ownership, in accordance with Government s Community Service Obligation (CSO) policy. No substantive change is envisaged to s institutional structure over the period of NTS. (Source: National Transport Strategy Volume 3: Detailed Strategy) Budget, financial situation and organization of is presented in Section

")
107 4) National Airports Port Moresby International Airport (PMIA or Jacksons) is currently the only airport in Papua New Guinea supporting international regular scheduled passenger services, although both Daru and Wewak are denoted as international airport and, outside of PMIA, Mount Hagen receives the most international passengers associated with international direct charters for the mining ventures. PMIA and a further 20 national airports are operated by the National Airports Corporation (). A further six airports are certified in accordance with ICAO Annex 14 and PAPUA NEW GUINEA Civil Aviation Rules; these include three airports associated with mining (OK Tedi Tabubil and Lihir Kunaye) and oil & gas (Kutubu Moro) and three ex-national airports now operated by provincial governments (Milne Bay PG Kiriwina and Misima, and Gulf PG Kikori). Table shows summary of ICAO recognized airports and Table shows air traffic at main airports. Table Summary of ICAO Recognized Airports (Source: National Transport Strategy Volume 3: Detailed Strategy) 2-30


108 Table Air Traffic at Main Airports (Source: National Transport Strategy Volume 3: Detailed Strategy) 2-31

109 5) Air Transport Operators and Services a) International The main international carrier is the government-owned airline Air Niugini (ANG) which operates bulk of international services and routes. ANG currently operates B AER, Fokker F100 and Bombardier Q400 aircraft on its international services. International scheduled services currently operating at Port Moresby are: Air Niugini; Singapore, Brisbane, Cairns, Nandi, Honiara, Hong Kong, Manila, Narita and Sydney. Figure Networks to/from Port Moresby Qantas Link; Cairns. Virgin Australia; Brisbane. (Source: National Transport Strategy Volume 3: Detailed Strategy) Figure shows the share of the international destinations to/from Jacksons/Port Moresby International Airport based on the Air Niugini passenger seats available. Source: Flight Schedule of Air Niugini Figure Shares of International Flights to/from Jacksons/Port Moresby Airport 2-32
110 b) Domestic Air Niugini and Airlines PNG operate domestic services primarily from their hub of Port Moresby. Air Niugini flies point-to-point services to 11 main domestic airports, two loop services to the Islands and Momase Regions covering a further nine airports and some interconnecting services from the regional airports of Lae, Hoskins and Madang. Airlines PNG operates first and second level services using mainly Dash-8, competing against Air Niugini but also serving smaller airports from hubs at Daru and Port Moresby covering Western and Central Provinces using DHC-6. Airlines PNG also flies on-demand and charter services to a number of smaller airports. A new entrant, privately owned Travel Air, based in Madang, was certified to commence operations in November 2011 using four Fokker F50 turboprop aircraft. Initially operating daily scheduled flights between Madang and Port Moresby, Hoskins and Rabaul it has signaled its intention to operate to a number of other main centers and secondary airports. The Government, through Department of National Planning and Monitoring (DNPM), provided startup financial assistance to Travel Air in the 2011 budget allocation described as an air freight subsidy. The Airline fills a gap left by the closure of Airline in 2007, also Madang-based. The largest third level operator is Mission Aviation Fellowship (MAF), a church-sponsored airline, based in Mount Hagen, with a fleet of 16 mainly DHC-6, Cessna 206 and GA8 with which it serves remote rural airstrips throughout Papua New Guinea, but concentrated in the Highlands, for community support, mission, and emergency relief purposes, as well as commercial passengers and freight. Other small fixed wing and helicopter charter operators include Central Aviation (Mt. Hagen), Hevilift, Islands Nationair, Niugini Helicopters, North Coast Aviation (Lae), Pacific Helicopters and Tropicair (Port Moresby). Much of their work is in support of the resource sector but also general charter flying into small airfields and remote worksites. (Source: National Transport Strategy Volume 3: Detailed Strategy) Figure presents domestic air networks at Jacksons/Port Moresby and Nadzab/Lae Airports. 2-33


111 Network to/from Port Moresby Airport Network to/from Lae Airport Air Niugini Air Niugini Airlines PNG Airlines PNG Travel Air Travel Air North Coast Aviation Source: Flight Schedule of each airline Figure Domestic Air Network North Coast Aviation 2-34
112 c) Aircraft Fleet of Air Niugini, Airlines PNG, Travel Air and North Coast Aviation [Air Niugini] Aircraft Current Ordered Typical Seats B767-33AER B B B Fokker F Q400 NextGen 5-74 Q Dash 8-Q DHC Fokker F70 - Being considered. 75 Data: Air Niugini [Airlines PNG] Aircraft Current Ordered Typical Seats Dash (These will be exited as the ATR s are entered into service.) 36 ATR Data: Air Lines PNG [Travel Air] Aircraft Current Ordered Typical Seats Fokker F [North Coast Aviation] Aircraft Current Ordered Typical Seats BN-2A islander
113 6) Passenger Movements Record at Jacksons/Port Moresby and Nadzab/Lae Airports a) Jacksons/Port Moresby Airport The historical international passengers at Jacksons/Port Moresby Airport for the last decade are shown in Table and Figure The international passengers were stagnant until 2005, but increased drastically thereafter by an annual average growth rate of 9%. Table Historical International Passengers Year Port Moresby Passengers Change % % % % % % % % % Source: report in 2013 Source: report in 2013 Figure Historical International Passenger Movements The historical domestic passengers at Port Moresby Airport for the last decade are shown in Table and Figure The domestic passengers increased drastically after 2006 by an annual average growth rate of 14%. Table Historical Domestic Passenger Movements Year Passengers Port Moresby Change % % % % % , % , % , % , % Source: Air Niugini, Airlines PNG Source: Air Niugini, Airlines PNG Figure Historical Domestic Passengers 2-36
114 b) Nadzab/Lae Airport The historical domestic passengers at Nadzab/Lae Airport for the last decade are shown in Table and Figure The domestic passengers increased by an annual average growth rate of 8% in the last 10 years. Table Historical Domestic Passengers at Nadzab Year Passengers Lae Change % % % % % % % % % Source: Air Niugini, Airlines PNG Source: Air Figure Niugini, 2.7 Airlines Historical PNG Domestic Passengers Source: Air Niugini, Airlines PNG Figure Historical Domestic Passengers at Nadzab/Lae Airport 2-37
115 2.1.4 Air Transport Infrastructure Funding 1) Generally Transport infrastructure is funded from a mix of following sources: Parliamentary appropriations through the national budget process to the Government transport agencies including ; Multinational (ADB, World Bank) and bilateral (Australia, Japan, China, etc.) donor funds; Charges made by PNG Ports Corporation, National Airports Corporation, PNG Air Services Ltd and the National Maritime Safety Authority which go towards the maintenance and upkeep of ports, airport, maritime and air navigation infrastructure. (Abstract from National Transport Strategy Volume 3: Detailed Strategy) 2) Airports and Air Navigation Services and Expenditure According to the National Transport Strategy Volume 3: Detailed Strategy, following observation was made on the expenditures for the airports: i) The Civil Aviation Authority was funded by an average of K10 million per annum over the five year period to 2009 from the Development Budget to undertake airport and airstrip upgrading. From 2011 responsibility for national airport maintenance and development was transferred to the National Airports Corporation () with an annual appropriation of K30 million increasing to over K70 million annually on average in future years against the loan funded Civil Aviation Development Investment Program (CADIP); ii) National airport maintenance is funded from revenue. Ongoing maintenance requirements for the 21 national airports certified to existing usage (F100/Q400 and Dash-8) are estimated at around K20 million annually to cover periodic resealing, airfield, terminal and fencing maintenance. However, maintenance costs will rise substantially in future in real terms as some airports are upgraded to larger jet aircraft (B ) or if an alternate B747 capable airport for Port Moresby is developed at Lae or elsewhere. Even at present, s ability to adequately fund maintenance of all 21 national airports is in some doubt. derives revenues from landing, terminal navigation and service charges, subject to payment of part of the terminal fees to CASA. The level of charges is set out in the Civil Aviation (Aircraft Charges) Regulation. In 2009, a National Airports Strategic Management Plan (NASMP) was prepared on behalf of the then CAA. One of the findings from the NASMP was a shortfall in funding for airport maintenance and critical upgrading requirements. While split into, CASA and PNGASL had the effect of removing some previously second level national airports from s responsibility, and the CADIP has effectively shifted the critical rehabilitation and development 2-38
116 expenditure to the Government, there is still ongoing uncertainty as to whether s revenue stream will be sufficient to fund airport operations and ongoing maintenance commitments. NASMP recommended that a detailed review of airport services charges, and air services charges generally, be made against forward operating and maintenance costs, so that either any shortfall can be identified and recognized as an ongoing subsidy obligation on the Government, or the charges are raised to cover the costs. It was also recommended that explore other non-aeronautical revenue streams, such as airport concessions, airport land leases, airport terminal car parking fees and commercial development on land to lessen the reliance on aircraft landing fees and terminal charges. NTS endorses this course of action and it is assumed that this combination of measures will enable to significantly increase its revenue stream and operate profitably, assuming that capital development costs are born by the Government. Following NASMP recommendations, has been working to raise the total revenue and the amount of revenues from the airport operations increased PGK 42 million in 2010 to PGK 77 million in 2013 while the revenues from the commercial lease increased from PGK 4 million in 2010 to PGK 14 million in 2013 (refer to Sub Section 10.3). According to the result of the financial analysis, the expected revenue increase attributable to the implementation of the Project could cover the operation and maintenance costs relative to the Project, although the revenues are not enough to payback the expected ODA loan. Therefore, would be able to provide necessary fund for operation and maintenance of Nadzab Airport. 2-39
117 2.1.5 Air Transport Sector Projects 1) Civil Aviation Development Investment Program (CADIP) Considering the crucial importance of the aviation industry in Papua New Guinea, the Government in March 2009 formally requested the Asian Development Bank (ADB) to support it with financial assistance to enable to address its development challenges in the civil aviation sector. After technical examination, coordination and negotiation, the Civil Aviation Development Investment Program (CADIP) was developed and adopted by the Government to revitalize and maintain the country s civil aviation network. According to a document prepared by ADB, The investment program (Civil Aviation Development Invest Program) will deal mainly with 21 national airports,-buka, Chimbu, Daru, Goroka, Gurney, Hoskins, Kavieng, Kerema, Kiunga, Lae (Nadzab), Madang, Mendi, Momote, Mount Hagen, Popendetta, Port Moresby, Tari, Tokua, Vanimo, Wapenamanda and Wewak-which sustain the bulk of the country s international and domestic passengers and freight traffic. It will involve (i) devoting four or more tranches of the Multitranche Financing Facility (MFF) to improving compliance with the safety and security standards of the International Civil Aviation Organization; (ii) designing and supervising airport improvements, and preparing and administering long-term maintenance contracts for all the national airports; and (iii) monitoring the socioeconomic benefits from the operating and maintenance improvements in the national airports. The investment program will also work closely with the capacity building program under the Transport Sector Support Program financed by the Australian Agency for International Development. (ADB Proposed Multitranche Financing Facility: Papua New Guinea: Civil Aviation Development Investment Program October 2009) According to ADB document and National Transport Strategy, CADIP will be implemented in four phases, while Phase I being implemented involves improvement of following five airports: i) Port Moresby (domestic apron, CNS/ATM, fire tenders); ii) Mount Hagen Stage 1 (runway repair, new terminal); iii) Hoskins Stage 1 (runway repair, security fence); iv) Wewak Stage 1 (runway repair, security fence); and v) Gurney Stage 1 (runway repair, security fence). Table shows investment program for the entire CADIP and Project 1 investment plan, while Figure shows location of five airports improved under CADIP Project
")
118 Table Investment Program and Investment Plan for Project 1 Figure Location of Five Airports improved under CADIP Project 1 (Source: ADB) 2-41
119 In principle, any projects those ranked high priority in Transport Infrastructure Priority Study (TIPS) and those rated with Benefit Cost Ratio (BC) of more than 1 were listed. Upgrading of Lae to alternate for PMIA (rated as TIPS BCR of 1.1) was included in CADIP Project 2 as shown below (estimated cost of Kina 139 million). Table Projected Funding Requirements for National Airports (up to CADIP Project 2) Airport and Upgrade TIPS *1 TIPS Cost Annual Distribution of Cost Priority BCR *2 MK * CADIP-PPP and other funding Upgrading PMIA (Master Plan) CADIP Project 1-85% ADB, 15% Government Funding Security fencing (5 airports) high high PMIA domestic apron, ILS Fire high high Upgrading to F100 operations Wewak Mt. Hagen Hoskins (Kimbe) Gurney CADIP Project 2-85% ADB, 15% Government Funding Security fencing (2 airports) high high Upgrading to Alternate for PMIA Lae Upgrading to F100 operations Madang Kavieng Goroka Tokua Note. *1TIPS: Transport Infrastructure Priority Study, *2BCR: Benefit Cost Ratio, *3MK: Million Kina Source: National Transport Strategy Volume 3, July
120 2) CNS/ATM Modernization Project by PNGASL In response to a request from Survey Team, in May 2014 PNG Air Services Ltd (PNGASL) provided following paper describing CNS/ATM Modernization Project undertaken by PNGASL for possible coordination for the rehabilitation of Nadzab Airport. DEVELOPMENT PROJECTS-NADZAB PURPOSE This information paper outlining PNGASL s development projects and plans at the Nadzab Airport is put together for the purpose of. As intends to fund the new Terminal Building and other supporting infrastructure at Nadzab Airport, this paper could also be used for the purpose of the Nadzab Airport supporting infrastructure development. EXECUTIVE SUMMARY Since early planning documentation going back to 2010, PNGASL is now implementing component projects based on its Communications, Navigations, Surveillance and Air Traffic Management (CNS/ATM) Modernization Project, which is based on PNGASL s Strategic Development Plan PNGASL s preferred option of a holistic modernization project is not practical due to a lack of a single source of funding. The modernization is therefore undertaken in system component projects based on donor funding allocations. The three main agencies providing funds to support PNGASL CNS/ATM Modernization Program are the Government of PAPUA NEW GUINEA through annual Public Investment Program (PIP) Budget, Australian Aid and ADB MFF through the Civil Aviation Development Improvement Program (CADIP). This information paper outlines PNGASL s ongoing development projects and plans at the Nadzab Airport. The underpinning modernization project PNGASL is undertaking in delivering safe, efficient and seamless air navigation services across PAPUA NEW GUINEA Flight Information Region (FIR) with our neighboring air navigation service providers (ANSP s) is the modernization of the air traffic management (ATM) system and its associated communication, navigation and surveillance (CNS) infrastructure. The submission for the funding of ATM Modernization Project has been annually made to the Government of PAPUA NEW GUINEA. PROJECTS SUMMARY REPORT Tabulated below (Table ) is a summary of all the development projects, highlighting scope of works at Nadzab Airport. 2-43
121 Table Summary of CNS/ATM Modernization Projects and Activities at Nadzab Airport as of May 2014 No. Project Name Funding Agency Project Scope Status Activity Plan at Nadzab 1 PNG ADS-B, MLAT and ATM System (PAMAS) GoPNG *1 & DFAT *2 Automatic Dependent Surveillance-Broadcast (ADS-B) for surveillance for upper airspace over whole of PNG airspace. Multilateration (MLAT) surveillance for Jacksons Airport terminal airspace. ATM automation. Voice Communication System (VCS) upgrade. Supply contract signed March Ready for implementation. Install Voice Communication System (VCS) in Tower & Tower Equipment Room. Scope to include ADS-B ground station. Scope to replace Controller Console in Tower. Air Traffic Control (ATC) simulator and disaster recovery. Tower simulator. 2 World Geodetic Survey TSSP *3 & DFAT Aeronautical survey of all airports and radio Survey in progress. Survey of Nadzab Airport. to 1984 datum (WGS-84) survey navigational aids to WGS-84 datum. 3 Very High Frequency (VHF) Coverage Improvements 1 TSSP & DFAT Upgrade existing remote Mt. Konokalang VHF communication facility. Install 4 new remote VHF facilities; Mt. Mission, Mt. Otto, Mt. Dimondimo & Mt. On tender. Replace Very Small Aperture Terminal (VSAT) Node. Interface VCS to VSAT and tertiary lines (Telikom). Fala. Implement VSAT Network as a redundant communication network for all PNGASL remote sites and ATC stations. 4 High Frequency (HF) GoPNG (ADB) Construct new duplicate HF facility at Nadzab Drafting Install new duplicated HF farm at tow 2-44
122 No. Project Name Funding Agency Project Scope Status Activity Plan at Nadzab Refurbishments Airport specifications. identified sites within the aerodrome boundary. Install standby power system at HF farm. 5 Control Tower Refurbishment GoPNG Refurbish control towers; Port Moresby, Nadzab & Madang. Seeking funding. Building refurbishment of Control Tower Cabin. 6 Power Systems Upgrade PNGASL Upgrade standby power supply system at Port Moresby, Nadzab & Madang. Upgrade standby power system; diesel generator and UPS. Nadzab generator has been replaced. Standby power reticulation to VOR/DME. HF Transmitter and HF Receiver. 7 Radar GoPNG Replace existing Secondary Surveillance Drafting Nil Radar. 8 VHF Improvements 2 GoPNG (ADB) Upgrade existing remote VHF communication facilities. Drafting specifications. Nil Notes: GoPNG *1 : Government of Papua New Guinea, DFAT *2 : Department of Foreign Affairs and Trade, TSSP *3 : Transport Sector Support Program 2-45
 to the east, Madang Province to the north, East Highlands Province and Gulf Province to the west, Central and Northern Provinces to the south. Its capital is the City of Lae.")
123 2.2 Morobe Province and Lae Morobe Province Morobe Province, where Nadzab/Lae Airport is located, is one of the Papua New Guinean Provinces in Momase Region surrounded by the Solomon Sea (Huon Gulf) to the east, Madang Province to the north, East Highlands Province and Gulf Province to the west, Central and Northern Provinces to the south. Its capital is the City of Lae. According to the Census 2011, the population of Morobe Province was the biggest among 23 provinces accounting for 9.3 % of the total population (see Table 2.1-1). Provincial Administration of Morobe describes its economy as follows: Figure Map of Morobe Province The economy of Morobe Province is robust, growing at an average of 2.7 percent per annum. The economy in Morobe is better than it has been for many years related to the development of new gold mines, new fisheries projects, new agricultural projects like oil palm and new government initiatives such as district treasuries. The rural Morobe is endowed with rich natural resources and diverse flora and fauna. Traditional economic activities are coffee, cocoa, cattle, logging, while the emerging activities are; gold, copper, tuna fishing, oil. Lae being the second biggest city is the industrial center of Papua New Guinea and is where the largest export port in PAPUA NEW GUINEA is located. Business investments in Lae are mostly controlled by members of the Lae Chamber of Commerce and Industries. The business activities they engaged in are; mechanizing, wholesale, cartage, hotel industries, real estate, food and beverages, pharmaceuticals, banking, legal, accountings and business consultancy, electrical works, building, shipping, airlines industries, motor vehicle and fuels. The economic prospects for Lae in the next couple of years will be boasted by the mining activities in the two potential mines in Bulolo district; the Hamata and Hidden Valley and Wafi Golpu Gold and Copper mines. These mines will be mined by Morobe Mining Joint Ventures Ltd and the tuna industries by Frabelle (PNG) Ltd. Palm Oil is another potential investment now emerging. Tourism development is untapped and has great potential for prospects. Lae and Morobe Province contributes 2-46
 Morobe Province Government published its Five Year Strategic Development Plan 2008-2012.")
124 immensely to the economy of Papua New Guinea and will continue in many years ahead. Increase economic activity and population growth makes Lae the most ideal place in Papua New Guinea to invest. (Source: Morobe Province Government Website) Morobe Province Government published its Five Year Strategic Development Plan Following six policy areas were identified: i) Infrastructure development; ii) Sustainable economic growth and development; iii) Integral human development; iv) Rural growth and development centers; v) Good governance; and vi) National functions, emergency and other support services. Regarding the infrastructure development, goal was set to achieve facilitation of effective transport, communication, power generation and water supply systems for effective and efficient production and delivery of goods and services by improvement of access through air, land and sea transport system, among others. Figure shows provincial fiscal capacity in The fiscal capacity means provincial ability to raise own-source revenue relative to what the governments National Economic and Fiscal Commission estimates it should cost the province to deliver 11 minimum priority activities such as provision of school materials, supervision of education staff, district education office operations, rural health facility operation, etc. Morobe Province had its fiscal capacity to cover more than 100% of 11 minimum priority activities at its own source revenue probably due to high amount of royalty, and was ranked third following Western Province and New Ireland Province. Figure Provincial Fiscal Capacity (Source: Asian Development Outlook 2014-Papua New Guinea) 2-47
125 2.2.2 City of Lae The City of Lae is the capital of Morobe Province where PAPUA NEW GUINEA s largest sea port of Lae and the second busiest Nadzab Airport are located. Its population in 2011 Census was 148,934. Explanation of Lae in Made in PNG 2014 published by Business Advantage International Pty Ltd., Australia, is presented hereunder: Although it plays second fiddle to the national capital, Port Moresby, Lae is PNG s industrial hub, with considerable activity in the sectors of manufacturing, trading, agribusiness, and, more recently, fishery. Many of PNG largest producers have their head offices in Lae, including K K Kingston, Laga Industries, Mainland Holdings and (100km away) Ramu Agri-Industries, as well as the local subsidiaries of international firms such as Nestle SA, Coca-Cola Amatil, DuluxGroup and PNG Taiheiyo Cement. Unsurprisingly, PNG s recent resources boom, spearheaded by the Exxon Mobile-led PNG LNG Project, has had a considerable impact on Lae. The city has not only sent thousands of tons of goods and equipment up the Highlands Highway to PNG s gas field, but is also 90km from the Hidden Valley gold mine and 65km from the Wafi-Golpu project, a gold silver and copper project of significant potential. A major local fisheries sector has sprung up over the past decade with major processing facilities constructed by Frabelle (Philippines), International Food Corporation (Malaysia) and Majestic Foods (Thailand). The good times have also encouraged PNG s larger manufacturers to make sizable new investment in Lae, including S P Brewery, K K Kingston and Lae Biscuit Company. With its central location, access to the Highlands Highway, and port facilities, it is a natural industrial hub. Nowadays, between 60% and 70% of all PNG s trade passes through Lae, including 90% of coffee export. 2-48
126 2.3 Existing Conditions of Nadzab/Lae Airport General Role of Nadzab Airport in Domestic Air Network Nadzab Airport is the second busiest airport in Papua New Guinea, being operated by National Airports Corporation (hereinafter referred to as ), except for the radio navigational aids and telecommunications which are under responsibility of Papua New Guinea Air Services Ltd. (PNGASL). As of May 2014, four airlines of Air Niugini, Airline PNG and Travel Air as well as North Coast Aviation are operating at Nadzab Airport, carrying approximately 300 thousand passengers in It seems that there are two patterns of route structure; shuttle flights between Nadzab and Port Moresby/Jacksons as well as flights connecting Jacksons and local airports via Nadzab as shown below. Admiralty Island Momote (MAS) New Britain Islands Rabaul (RAB) Hoskins (HKN) New Guinea Island Wewak (WWK) Kiunga (UNG) Madang (MAG) Mount Hagen (HGU) Lae (LAE) Finschhafen (FIN) Tabubik (TBG) Bulolo (BUL) Port Moresby (POM) Popondetta (PNP) Figure Schematic Air Network of Nadzab/Lae Airport Currently, Nadzab Airport accommodates the domestic passenger flights only; however National Development Strategy Plan states International airports may also be required near cities such as Lae that are an important hub for international business. 2-49
 Generally The")


127 2.3.2 Existing Airport Facilities 1) Generally The existing conditions and major issues to be sorted out of Nadzab/Lae Airport are briefly discussed hereunder for understanding of the project background. Photos below show general layout of Nadzab Airport. Control Tower Office Fire Station Terminal Taxiway A Taxiway B Taxiway C Taxiway D Photo1-1 Entire Airport Photo:Google Third Apron Second Apron Office Car Park Fire Station Terminal Main Apron Control Tower Photo:Google Photo 1-2 Terminal Area 2-50
; 15-m wide, of asphalt concrete. Apron; 420m 85m wide for 6 aircraft parking stands, of asphalt concrete.")
, which already retired and was replaced by F100 and Q400, etc. in Papua New Guinea.")
128 2) Runway, Taxiway and Apron There exist a runway, a parallel taxiway and four stub (connection) taxiways as well as a main apron at Nadzab Airport as summarized below: Runway; 2438-m long 30-m wide, elevation approximately 73m, PCN30/F/B/X/U with groove. Taxiway (parallel and stub); 15-m wide, of asphalt concrete. Apron; 420m 85m wide for 6 aircraft parking stands, of asphalt concrete. There are several issues to be resolved as discussed hereunder. [Pavement Strength] The runway, taxiways and apron were constructed to accommodate F28 (65 to 89-seater aircraft), which already retired and was replaced by F100 and Q400, etc. in Papua New Guinea. In near future when the airport traffic further increases, operation of B737 will become necessary. Currently, some deficiencies such as surface cracks are observed on the runway surface as shown below. The existing airfield pavement needs to be strengthened and/or rehabilitated. (RWY 27 threshold from western side) (Cracks on the runway surface with groove) [Length and Width (Dimension)] The present runway length of 2438m is adequate to accommodate domestic and short-haul international operations by B737; however the runway should be widened from present 30m to 45m. The present taxiway width of 15m is adequate to accommodate up to B737 type aircraft, but it might need to be widened to accommodate sporadic operation of B767/B787 in case of diversion from Port Moresby. Expansion of the apron will also be required. 2-51
129 3) Passenger and Cargo Terminal Building The existing passenger terminal building, constructed in around 1976, houses Air Niugini, Airline PNG and Travel Air as well as North Coast Aviation. Air cargo is also handled in the same building. The existing terminal building is of a steel structure like a gymnasium, and walls inside the terminal are made of blocks and light-weight steel. As the walls do not reach the ceiling, rain comes into the building through openings outside the building for ventilation, resulting in deterioration of the ceiling. Existing baggage claim area is provided after the arrival lounge and the checked bags are manually delivered to the passengers (see photos 2-1 and 2-2). The existing arrival and departure lobbies are provided in the same place (see photo 2-3). Check-in counters of Air Niugini are located right after the entrance to the restricted area (see photo 2-4). Access by the general public to the shop near the entrance to the terminal is allowed but the air passengers only are allowed to enter into the restricted area after the security check counter. A canopy is provided to the terminal curb where a dropping-off area for hotel buses, the major airport access, is provided (see photos 3-1). Cargo handling areas for Air Niugini and Airline PNG are located on both sides of the terminal building (see photo 3-2). A security check point is provided at the entrance to the terminal restricted area but no security check equipment is provided and screening is being carried out manually (see photo 3-4). Currently, no CIQ facility is provided at Nadzab Airport. In case international flights are to be operated, necessary facilities are to be provided and personnel to be stationed through coordination with authorities concerned. Many of the existing services are in very poor condition as almost 40 years have passed since they were constructed and adequate fund for repair and maintenance is not available. 2-52


130 Landside Photo 2-1: Arrival Lounge Photo 2-2: Baggage Claim Photo 2-3: Arrival and Departure Lobbies Photo 2-4: Check-in Counters of Air Niugini 2-53


131 Landside Photo 3-1: Curb Side and Dropping-off Area Photo 3-2: Cargo Handling Area Photo 3-3: Passenger Entrance to Terminal Photo 3-4: Security Check 2-54
 (DVOR/DME commissioned in 2011) Weather minima of VOR/DME approach procedures for category C aircraft are as follows: RWY09:Minimum Descent Altitude (MDA) 650FT, Visibility 2300m")
. This issue is further discussed in Section 5.")
132 4) CNS/ATM Doppler VOR/DME is provided as the radio navigation aid at Nadzab on the extended runway center line to the western side of the Airport, but ILS is not installed. (Control Tower) (DVOR/DME commissioned in 2011) Weather minima of VOR/DME approach procedures for category C aircraft are as follows: RWY09:Minimum Descent Altitude (MDA) 650FT, Visibility 2300m RWY27:Minimum Descent Altitude (MDA) 650FT, Visibility 2400m According to the PNGASL staff of Nadzab Airport, weather conditions at Nadzab are generally favorable and flight cancellation/delay due to downgraded weather conditions below the minima rarely occurs (except for delays due to problems of airlines side). This issue is further discussed in Section 5.ATC communications and automatic weather observation system are provided in the control tower. The existing control tower was built in around It is located almost equidistant from the runway ends and good visibility to the runway ends and apron is achievable. However, the building is old and outdated, and the ceiling is partially exfoliated (see photo on the right side) and trace of water leakage is observed on the wall. 5) Aeronautical Ground Lights Aeronautical Ground Lights (AGLs) are to provide visual guidance to aircraft pilots especially during nighttime and low visibility conditions. In addition to the apron flood lights, there are following aeronautical ground lighting at Nadzab Airport under responsibility of : Two sets of Precision Approach Path Indicator (PAPI); Runway lights; Taxiway centerline light (partially); and Aerodrome beacon. 2-55
 Rescue and Fire-fighting Station The existing rescue and fire-fighting station is faced perpendicular to the runway center line, preventing immediate access to the runway in case of emergency.")

133 List of the lighting facilities is provided in Section 5. 6) Rescue and Fire-fighting Station The existing rescue and fire-fighting station is faced perpendicular to the runway center line, preventing immediate access to the runway in case of emergency. The building is old and outdated. The fire alert/monitoring/communication as well as water pump systems for fire trucks are not properly working. In order to meet relevant ICAO requirements, the existing rescue and fire-fighting station should be reconstructed. There are two second hand fire engines transferred from Jacksons and Australia. They are old but still reliable, however constant maintenance is needed to keep them operational. The current category of rescue and fire-fighting services is 6, which will need to be upgraded to 7. Rescue and Fire-fighting Station Fire Engines 7) Access Road The existing airport access road connecting the Highland Highway (between the City of Lae and Highland Area) and the airport is under the authority of. The access road has two lanes each and is in generally good condition, but no storm water drainage facility was observed. 8) Operation and Maintenance Organization There are 38 personnel of for operation and maintenance of Nadzab Airport. 9) Risk of Flooding of Erap River As official record of floods that affected the airport in the past were unavailable, it was found through interviews with stakeholders that the most memorable flood occurred in early 2000 s. In this flood, western edge of the airport was inundated by 30cm of water, however, runway and key facilities remained above water. The banks of Erap River have since overflown every 2~3 years, however, only areas close to the banks were inundated by water 30~50cm in depth, and for a short period of the time before subsiding at the end of the rain. 2-56


134 Erap River Erap River Nadzab Airport Opinion of Business Leaders on Nadzab Airport In order to gather opinion of the local business leaders on the existing and future Nadzab Airport, a briefing was held from 14:00 to 15:30 on Wednesday 21 May 2014 at Lae International Hotel. About 30 people attended the meeting, who are members of Lae Chamber of Commerce Inc. (LCCI) and the briefing was chaired by President of LCCI. A representative of Headquarter and Nadzab Airport Manager as well as a representative of Survey Team also attended the briefing meeting. Organizations to which the attendants belong are as follows: LCCI ATTIC HOLDINGS NIUGINI SOLICOTORS & BARRISTER AIR NIUGINI ATLAS STEEL BRAIN BELL CHINA HARBOUR ENGINEERING CHEMCARE GROUP HBS HASTING DEERING ISLANDS PETROLEUM INLAND COMMUNICATION MOROBE PROVINCIAL GOVERNMENT MOROBE MINIMG JOINT VENTURE NORTHBUIL CONSTRUCTION NO.1 HIRE CAR NATIONALS NEWS POST PNG SOROPTIMIST INTERNATIONAL REGIONAL ENGINEERING TRUKAI INDUSTRIES 2-57
135 Following opening remarks by the President of LCCI, brief description of Nadzab Airport Rehabilitation Project was made by the representative of and purpose of the meeting and questionnaire was briefly explained by the representative of Survey Team, followed by free discussion session. Almost all of the comments made during the free discussion were complaints against poor conditions of the existing facilities and services as well as requests for immediate rehabilitation/improvement thereof and commencement of international services between Nadzab/Lae and Australian destinations such as Cairns and Brisbane. s response to the complaints was that recognizes an investment for non-fundamental rehabilitation of the existing facilities and services inefficient and such fund is not available; if local government/business community offers such fund for rehabilitation, would welcome; has been seeking fund for fundamental rehabilitation/improvement of Nadzab Airport and Japanese ODA through is one of the most expected. With regard to the questionnaire on the rehabilitation of Nadzab Airport, ten attendants responded as follows (figures shown in ( ) are the numbers of respondents): [Answers to the Questionnaire] 1. Future Operations/Role of Nadzab/Lae Airport One of the topics to be highlighted firstly is the future role of Nadzab/Lae Airport for local business/social sector in Morobe/Lae and also in the entire air transport network of the country. Currently, we understand that Nadzab/Lae Airport is a domestic trunk line airport (the second largest next to Port Moresby) connecting Port Moresby and several local cities (approximately 300,000 annual passenger movements recorded in 2013) mainly for business travelers with sporadic international pure cargo flights. Suppose about 10 years after from now, what kind of role do you anticipate that Nadzab Airport needs to play: [Domestic Passenger Operations] a) Second largest domestic trunk line airport after Port Moresby with domestic annual passenger movements around 600 thousand (basically continuation of the current role); (2) b) Second domestic hub airport after Port Moresby with broader domestic air network with domestic annual passenger movements around 900 thousand; (7) c) Others (please specify here: Manila, Hong Kong, Singapore and Bali). (1) [International Passenger Operations] d) Sporadic charter flights with Australian destinations such as Cairns and Brisbane; (0) e) Limited number of weekly scheduled international flights with Australian destinations by propeller aircraft such as Q-400; (1) f) Limited number of weekly scheduled international flights with Australian destinations by 2-58
136 B737/Q-400; (4) g) Daily international flights with Australian destinations by B737/Q-400; (4) h) Others (please specify here). (2) [International Alternate Airport] Nadzab Airport is recognized as one of the candidate international alternate airports for Port Moresby. For Nadzab Airport to fulfill this role, more investment will be required than to accommodate domestic and international operations by up to B737 class aircraft. Do you think such additional investment would be: i) Acceptable because an alternate international airport is required for Papua New Guinea; (8) j) Acceptable if such additional investment is within the availability of financial resources for implementation of the Project; (2) k) Not acceptable unless such additional investment is financially viable; (0) l) Others (please specify here) (0). 2. Prospective Customers/Users of Nadzab/Lae Airport In the item 1 above, we discussed anticipated or expected future operations or role of Nadzab/Lae Airport. For Nadzab/Lae Airport to play such anticipated/expected role, it has to be supported by users/customers such as international/local business people, tourists, family visitors as well as the airlines, among others. Which do you think is the best source of future air traffic demand at Nadzab/Lae Airport? [Domestic] m) Business people/family visitors between Nadzab and Port Moresby; (4) n) Business people/tourists visiting other places from Port Moresby via Nadzab and vice versa; (6) o) Others (please specify here) (2). [International] p) Business people/family visitors; (4) q) Foreigners working at mining sites or manufacturing factories near Lae; (3) r) Foreign tourists (please name some prospective tourist destinations near Nadzab) (1) Pacific Island, Asia; s) Others (please specify here). 3. General Comments for Future of Nadzab Airport We welcome any comments from you on future of Nadzab Airport, strength to be enhanced and/or weakness to be improved, possible cooperation with Lae Sea Port, etc. The terminal needs a complete renovation, someone needs to responsible for its upkeep and maintenance. The terminal needs to have better facilities including food and toilets. The highway between Lae and Nadzab needs to be considered as its lack of maintenance affects 2-59
137 travel time and personal security when travelling to the airport. We definitely need a second international airport. Internal and external security is very poor. Physical presence as well as electrical equipment required. Procedures/Standard Operation Procedures to be identified. Nadzab Airport if developed into International Airport, I expect both domestic and international passengers despite for provisions as alternative to Jacksons Airport. Nadzab is ideal commercially to become both international and domestic airport. Need links with Singapore or Dubai as waypoint to Europe. Air freight terminal and other business facilities required. May wish to consider taxi services or security shuttle transfer. 2-60

138 2.3.4 Status and Role of Nadzab/Lae Airport in National Development Plans 1) National Development Strategy Plan The National Development Strategy Plan (PNGDSP) was formulated and published by Department of National Planning and Monitoring in March 2010 as the Guide to Success. It deals with important development strategy which will guide continued progress of Papua New Guinea in the next 20 years. Specifically regarding the air transport sector, compliance of regional airports with international certification requirements, upgrading of airports for higher seating capacity as well as rehabilitation of unused airstrips are presented as key indicators as shown below. Source: National Development Strategy Plan The number of domestic air travelers in the Southern Region (including Port Moresby) is estimated to be more than quadruple from 1 million passengers in 2010 to over 4 million passengers in 2030 as shown below. Source: National Development Strategy Plan It is also mentioned in PNGDSP that: 2-61
139 Alternatives to Jacksons airport are also required in the region with the capacity to handle large jets and international flights; The growth of international tourism will require new international routes and appropriate airport infrastructure at key tourist destinations including Alotau, Rabaul, Madang and Manus; International airports may also be required near cities such as Lae that are important hubs for international business; Regional airlines amongst Pacific island countries should be encouraged as they promote closer regional integration; and The liberalization of PAPUA NEW GUINEA s air space and the promotion of a competitive airline market is vital for reducing the cost of travel and for improving service on domestic flights. 2) Medium-term Development Plan The Medium-term Development Plan (MTDP) is the first 5-year medium-term development plan for realization of the targets stipulated in PNGDSP. It is stated in the Medium-term Development Plan that: Maintenance and rehabilitation of all national airports will be central for the MTDP This will include navigational aids and communication and surveillance systems to ensure compliance with international operating standards. In addition, rehabilitation of rural airstrips will be undertaken to allow access to populated rural areas that are inaccessible by road or sea. Regional airports will be upgraded to allow higher seating capacity jets to cater for the anticipated increase in the number of passengers as a result of increased economic activities. With the timely support of the Asian Development Bank (ADB), the Government is investing close to K2.0 billion to rehabilitate and upgrade 22 national airports to comply with international safety and security standards and serve future needs. This will help to realize the majority of the deliverables. This program is implemented in three phases with the first phase in the MTDP ) Expected Future Roles of Nadzab Airport There is a clear reference to the role of Nadzab/Lae Airport in PNGDSP that International airports may also be required near cities such as Lae that are important hubs for international business. According to the National Transport Strategy Volume 3 Detailed Strategy dated July 2013, the CAA Infrastructure Investment Plan, Long Term ( ) (LTIP), (CAA, 2009), endorsed by the National Executive Committee (NEC), is the most recent definition of a long term strategy for upgrading the national airports, now under the management of. 2-62
140 With reference to Nadzab/Lae Airport in LTIP, Nadzab was expected to be: i) One of two long range international airports as an alternate diversion airport for PMIA; and ii) Upgraded to medium range regional standard by Definition of Nadzab Airport as the alternate airport for PMIA does not automatically mean becoming a long range international airport, but necessitates a minimum upgrading of airport facilities such as the strengthening of the aircraft pavement, widening of the taxiways, among others, to accommodate the largest aircraft (B767/B787) with an operational take-off weight necessary to fly to Port Moresby. With regard to the item ii) above, it can be construed that Nadzab should be upgraded as a regional airport capable of accommodating medium range aircraft such as B in compliance with relevant international standards and recommendations. In summary, it is considered reasonable to assume future role of Nadzab/Lae Airport as one of the regional airports: Capable of accommodating short to medium range international and domestic operations by B class aircraft; Alternative to Jacksons/Port Moresby International Airport in case of its temporary closure due to bad weather, etc. 2-63
141 SECTION 3 TOPOGRAPHIC SURVEY AND GEOTECHNICAL SURVEY
142 SECTION 3: TOPOGRAPHIC SURVEY AND SOIL INVESTIGATION 3.1 Topographic Survey General Topographic Survey was conducted at the designated areas of Nadzab Airport to prepare topographical maps and drawings showing the existing ground details and location of existing structures above the ground features as required carrying out the preliminary design for the Project. This work consisted of the following works: Baseline and Benchmarks surveys to establish the basic control points for the survey area Topographical survey of the designated areas Scope of Survey The survey and mapping was to be conducted in the planned areas; existing runway and runway extension area (24.4ha) existing taxiways area (15.7ha) existing apron and apron extension area (9.2ha) new passenger terminal building area (4.4ha) circulation road and carpark area (2.4ha) access road area (3.4ha) The survey and mapping areas are as shown in attached map. Figure Survey Area 3-1
143 3.1.3 Methodology 1) Baseline and Benchmark Survey This work established horizontal and vertical control points within each airport area, using the existing reference control points (Local Airport Coordinate) already established and utilized with the airport. These control points served as reference for all detailed surveys works to follow. a) Control Points Setting up of control points was carried out using Total Station method and GPS method. The control points were established by triangulation and/or closed traverse survey. The metric system was used in measurement. The length and angle of each traverse were measured twice and the averages of the two readings were regarded as corrected the length and angle of the traverse line. And error of closure & ratio of closure were provided for each the length and angle to adjust each value. The loop formed in the closed traverse was geometrically and algebraically closed. Deflection angles, interior angles and azimuths were measured twice and the average of two (2) measurements were adopted. The horizontal and elevation difference of the measurements were not greater than the value computed by the following formula: D = 25 x N ^1/2 x ΣS where: D = allowance horizontal difference ( mm ) N = Number of side S = Total length of traverse in kilometers D = 150 xσs / N ^1/2 where: D = allowance elevation difference ( mm ) N = Number of side S = Total length of traverse in kilometers 3-2
144 b) Levels The elevations of the control points were determined with reference to two (2) existing benchmarks in the airport. The leveling started from one of the national benchmarks to the other benchmark, and returned to the first one via a different route to form a closed loop. The maximum allowable error in level was not greater than the value computed by the following formula: E = 10 x S^1/2 where : E = allowable error ( mm ) S = one way length of traverse leveling in kilometers 2) Topographical Survey Topographical survey was carried out using Total Station method. The survey recorded all natural and manmade features including existing marking such as centerline, edge line etc. of runway, taxiway and apron in the area to prepare topographical map Control line was established parallel to the existing airport imaginary grid i.e. generally along the extended runway centerline. Sub stations were marked along the control line by stakes/pegs. The coordinates of each substation points were related to the primary control points previously established 3) Mapping and Drawings a) Skeleton Maps The skeleton map was drawn based on baseline survey including the followings: Traverse network diagrams Elevations and coordinates of the primary control points in airport local coordinate system and national grid coordinate system. b) Topography Maps All existing ground features manmade structures and utilities were clearly shown in the maps. 3-3
145 3.1.4 Subcontractor 1) Subcontractor The contract agreement between team and POLUME SURVEYORS Ltd was made on 19th day of May Selection of the subcontractor was conducted by the nomination tender. In the company that submitted the quotation, the one showed the lowest price had the right to enter into our contract after examination of the submitted documents. 2) Survey Instruments Following survey instruments were used for the work; 1 x Wild TC 1010 Total Station (EDM) 1 x Topcon Total Station (EDM) 1 x Topcon (GPS) Hyper Ga 3) Work Schedule Following work schedule was required for the work; 5days for Preparation (22 nd May 27 th May) 30days for Field Work (28 th May 26 th June) 25days for drawings and reporting(27 th June 21 st July) Result of Survey 1) Reference Points and Bench Marks Reference points and bench marks are to refer to the existing survey result. Information of reference points and bench marks are shown in Table3.1-1 and Table


146 Photo Table3.1-1 Location of Reference Points DESCRIPTION OF REFERENCE POINT Photo GPS NZB PSM PSM 5831 Loc ation Inside National Weather Service Instrument Station Fence Loc ation About 50m south of Access Road and near the existing apron fence. Coordinate EAST: NORTH: ELEVATION: Coordinate EAST: NORTH: ELEVATION: Table3.1-2 Location of Bench Marks Photo DESCRIPTION OF BENCH MARK Photo PSM 5810 PSM Loc ation Centerline of Runway Western End Loc ation Centerline of Runway Eastern End Ele vation Ele vation

147 2) Topographic Map Figure Topographic Map 3-6
148 3.2 Soil Investigation General Soil Investigation was carried out to obtain sub-surface data, provide test results and information necessary for execution of preliminary design for the Project. The Works was conducted by Subcontractor under supervision of the Consultants. Korea International Cooperation Agency (hereinafter KOICA) had conducted similar tests as Geotechnical Investigations in After careful verification, the tests data was considered to apply to our study in terms of technical specification. According to the KOICA s report, detailed soil data of (i) existing runway, (ii) runway extension area and (iii) existing taxiways were covered. Therefore the original scope was revised, and the tests were conducted only terminal area in our study Scope of Investigation The work items conducted are shown in below. Table3.2-1 Content of Soil Investigation Items Description 1 Boring Test Terminal extension area:2 boreholes 1.1 Mechanical Boring Control center and Fire Station area: 1 borehole 30m in total length 1.2 Standard Penetration Test (SPT) Every 1m interval (30 times) 1.3 Undisturbed cohesive soil sampling Not conducted. (Cohesive layer enable to take undisturbed samples did not exist) 1.4 Laboratory test Specific Gravity Particle Size Analysis Test Moisture Density Test 15 samples taken from SPT samples Particle Size Analysis Test Liquid Limit and Plasticity Limit Test Unit Weight Test These items were not conducted because 3-7
149 1.4.7 Unconfined Compressive Strength Test cohesive layer did not exist Consolidation Test 1) Boring Location Location of each of the boring tests is shown in Fig The coordinates and levels referenced to Nadzab airport survey system were provided for each boring location. Table3.2-2 Coordinates and Elevation of boreholes No of Bore Holes Coordinate Elevation T-1 470, E 9,274, N 72.65m T-2 470, E 9,274, N 71.46m CF-1 469, E 9,274, N 74.74m Figure Boring Location 2) Drilling core The depth of the core drilling was about 10 meters at the specified point. After core drilling was completed, each drilling hole was filled up completely with bentonite slurry. 3-8
150 The drilling results described the following items; Location of Boring Points Geological (Soil) Section Drawing Geological Column Ground water level (Depth in drill hole) Ultimate depth of drill hole Photographs of core samples 3) Standard Penetration Test (SPT) At each drill hole, Standard Penetration Test was conducted at every 1 m interval. Disturbed samples were sealed in transparent and airtight containers or plastic bags and kept in the core box for use of laboratory tests. Samples for laboratory test were taken every two (2) meter at the each bore hole. 4) Undisturbed Soil Sampling Cohesive soils were not encountered in the study. Therefore undisturbed samples were not taken Methodology Boring and Laboratory testing on physical and mechanical properties of the soil samples have been carried out according with AS standard as alternative of ASTM that is mentioned in TOR. Table Applied Standards for Boring Tests Items Mechanical Boring Standard Penetration Test (SPT) Standard AS (ASTM D ) AS (ASTM D ) 3-9
151 Table Applied Standards for Laboratory Tests Physical tests Items ASTM AS Particle Size Analysis D Moisture Density D Specific Gravity D Liquid Limit and Plasticity Limit D Subcontractor 1) Subcontractor The contract agreement between team and ACEM GEOTECHNIQUES LTD. was made on 27th day of June ) Investigation Machinery Following machinery was used for the work; 1 x GEMCO 210D Drill Rig 1 x Isuzu Tipper Truck Water Cart & Tank 3) Work Schedule Following work schedule was required for the work; 10days for Mobilization and Shipping (27 th May 6 th Jul) 20days for Field Work and Laboratory Test (7 th Jul 26 th Jul) 20days for reporting(27 th July 15 th Aug) KOICA Report According to KOICA report, (1) Boring Test, (2) Trial Pits and (3) Hand Pits were carried out. Location of each items are shown in the attached map. This data is applicable to preliminary design in this study. Therefor soil information of (a) Runway and Runway extension area, (b) Taxiway area, and (c) Apron area were applied to this report. 3-10

152 Table3.2-5 Quantities of the work by KOICA Items 1 Boring Test Description Runway and Runway extension area:4 boreholes Apron area: 1 borehole Runway and Runway extension area:8 Pits 2 Trial Pits Taxiway and Taxiway extension area: 6 Pits Apron area: 1 Pit 3 Hand Pits Runway and Runway extension area:4 Pits 4 CBR Test Runway extension area:7 Points 5 Laboratory Test Soil samples were taken from trial pit and hand pit Soil Classification, In-situ Moisture, Particle size distribution, Consistency and Compaction were measured. :Borehole :Trial Pit Figure Location of the tests by KOICA report Results of Soil Investigation 1) Geological information The site geology has been described in the explanatory notes of the Markham 1:250,000 geological sheet (Fig3.2-3), published by the Australian Department of Mines and Energy and PNG Department of Lands, Surveys and Mines. The airport and surrounding areas encompass alluvial deposits of conglomerate, gravel, sand, silt: piedmont-slope deposits and alluvial fans. According to the map, this 3-11

153 area is considered as Ramu Markham Fault Zone. Figure Geological Map of the Investigation Area 3-12
154 2) Boring Test result Ground conditions are illustrated in Table 3.2-6, which has been drawn up from the borehole Geotechnical log sheets. And a cross sectional profile of the investigation area is shown in Fig Cobble beds appear as main layers until 10m below the surface accompanying thin sandy bed between them. Surface is covered with silty sand. Table Subsoil Configurations Subsoil Type of Soil Thickness of N value Layer(m) Topsoil Silty Sand Cobble Bed 1 Cobble 1.5~5.5 46~50 or above Sand Gravel Sand 3.0~6.5 16~18 Cobble Bed2 Cobble 6.0~ ~50 or above 3-13

155 A Topsoil A A Cobble bed 1 A Cobble bed 2 Sand Figure A Cross-Sectional Profile 3-14
156 3) Ground water level No ground water was encountered to the maximum depths of the investigations. According to KOICA report, the water table has been obtained by examining the water levels in the boreholes which provide potable water within the airport. These boreholes were terminated around 30 m to 40 m from the ground surface. 4) Laboratory Test Result Summary of the laboratory test are shown in Fig The Cobble beds are a mixture of sand, gravel and cobbles and are generally well graded. 3-15
157 BH No. CF-1 CF-1 CF-1 Soil Type Black Sand Cobble Bed Cobble Bed Table Summary of laboratory test Depth Soil % % (m) Classification Fines Sand Moisture Liquid Plasticity % Content Limit Index Gravel % % % Linear Shrinkage % 1.5 SC Cobbles Cobbles CF-1 Sands 6.0 SC/SW CF-1 T-1 Cobble Bed Cobble Bed 7.5 Cobbles Cobbles T-1 Sands 3.0 GW T-1 Sands 4.5 GW T-1 T-1 T-2 Cobble Bed Cobble Bed Cobble Bed 6.0 Cobbles Cobbles Cobbles T-2 Sands 4.5 GW T-2 Sands 9.0 GW T-2 Sands 10.5 CL T-2 Sands 12.0 SC
158 3.2.7 Consideration 1) Designed soil parameter Soil parameters of each layer are determined and shown in Table Table Soil Parameter Subsoil Designed N value Unit Weight γ t (kn/m 3 ) Cohesion c(kn/m 2 ) Angle of Internal Friction φ( ) Topsoil (7) (18) (42) (0) Cobble Bed Sand Cobble Bed Topsoil is indicated as a reference due to data shortage. 2) Foundation Structure There are several foundation types for planned terminal building applicable for the study area. The characteristics and engineering consideration of those foundations are shown as follows: a) Raft Foundation This method is the easiest to execute, and the most economically friendly. However, the allowable bearing capacity may be insufficient since the thickness is less than 2-3 meter at T-1 &T-1. If structural load of the new planned terminal is not so heavy, this method would be applicable. Figure Bearing Layer Line of Raft Foundation 3-17 Bearing Layer Line
 is one of the methods to be applied for soil improvement.")

159 b) Raft Foundation with Soil Improvement This method is to improve sand layer around T-1&T-2, in order to increase its stability of the bearing layer. Cement Deep Mixing (CDM) is one of the methods to be applied for soil improvement. This prescribes strength by mixing cement slurry with the soft soil on site. The machines used for CDM are below. Table Applicable machines for CDM Referred by Cement Deep Mixing Association Bearing layer Line Soil Improvement Figure Bearing Layer Line of Raft Foundation with Soil Improvement 3-18
160 c) Piled Foundation This method is to form pile foundation on the cobble bed 2 as its support. As the layer is thicker than the cobble bed 1, stronger bearing capacity is expected. However, the cost is the highest among the methods. Figure Bearing Layer Line of Pile Foundation Bearing layer Line 3) Gradient of Excavation slope As the excavation area for foundation work is not vicinity of the existing structures, open cut method is applicable. According Industrial Safety and Health Law in Japan, height of excavation and its gradient were provided. In our study, gradient of the excavation slope is required to be 35 or less to keep the slope safe during construction work. Table Height of excavation and its gradient as applied to the open cut method Type of ground Height of excavation Slope of excavation Remarks Bedrock or rigid clay Less than 5m 90 degree or less 5m or more 75 degree or less Other ground Less than 2m 90 degree or less 2m or more, less than 5m 75 degree or less 5m or more 60 degree or less Sand ground Less than 5m or 35 degree or less Brittle ground Less than 2m or 45 degree or less Height Gradient 3-19
161 SECTION 4 AIR TRAFFIC DEMAND FORECAST
162 SECTION 4: AIR TRAFFIC DEMAND FORECAST 4.1 General The subject of this section is to forecast the growth of air traffic demand and the access traffic related to the air traffic. The results of the demand forecast contribute to the planning of airport facilities such as runway, taxiway, and aircraft parking stand, passenger terminal building, cargo terminal building, car park and so forth. The forecast study includes the demands listed below: i) Annual domestic passengers; ii) Domestic peak demand (daily / hourly); iii) Domestic aircraft movements; iv) International passengers and aircraft movements; v) Annual air cargo; and vi) Airport access traffic. 4-1
163 4.2 Methodology for Demand Forecast The relation and study flow of six demands is shown in Figure Annual Domestic passengers Passenger Interview Survey Domestic Peak Demand (Daily / Hourly) International Passengers and Aircraft Movements Annual Air Cargo Aircraft Movements for Domestic Airport Access Traffic Figure Study Flow of Demand Forecast Items i) Annual domestic passengers which are an important demand as the basis of all other demands have been forecast by the regression models based on the correlation between the historical data of air traffic and socio-economic indices. ii) Domestic peak demand has been forecast based on the past monthly records and peak hour characteristics at Nadzab/Lae Airport. iii) Annual air cargo has been forecast based on the past relation between the air passengers carried and the cargo volume. iv) Since Nadzab/Lae Airport does not have enough data for actual international passengers, site survey such as interview with passengers has been conducted in order to collect data about passenger movements from Nadzab/Lae to international destinations. Firstly, daily international passenger traffic during a week is to be estimated based on the result of site survey, then days with adequate number of international passengers are identified and daily aircraft movements estimated. Then the weekly passenger and aircraft movements are converted to monthly and yearly movements. The peak hour movements are to be estimated based on the number of peak day passenger and aircraft movements. v) Aircraft movement is forecast in accordance with design day passengers, future aircraft and appropriate seat factor. vi) Airport access traffic is forecast based on the result of site survey carried out at Nadzab/Lae Airport. 4-2
164 4.3 Projection of Socio-economic Indices Socio-Economic Indices as Forecasting Parameters Generally speaking, the air passenger demand proportionally grows or falls in line with increase/decrease of socio-economic indices such as GDP and population. With regard to GDP, the Government of Papua New Guinea (GPNG) and relevant international organizations publish actual and future prospective GDP attributable to mineral (or mining) and nonmineral (other than mining). In particular, ADB published GDP by industrial origin at 1998 market price from 1995 to 2012 (Key Indicators for Asia and the Pacific 2013, ADB), and subsequent analysis has been carried out based on the said data. Historical trend of GDP (total and nonmineral), population and the passenger movements at Nadzab (Air Niugini: ANG and Airline PNG: APNG) is as shown in Table Figure shows relationships between the socio-economic indices and the domestic passenger movements record (Air Niugini; ANG and Airline PNG: APNG) at Nadzab Airport. Both of GDP with/without Mining, population and the domestic passengers at Nadzab have been increasing in the last 10 years. Table Socio-economic Indices and Nadzab Domestic Passenger Movement Record Year Total GDP *1 (Million PGK) Nonmineral GDP *1 (Million PGK) Population (Million) Nadzab Domestic Pax. (ANG+APNG, '1000) , , , , , , , , , , , , , , , , , , , , AAGR *2 (%) 6.0% 7.0% 3.0% 7.8% Note. *1 GDP in 1998 constant price, AAGR *2 : Average Annual Growth Rate Data source: Key Indicators for Asia and the Pacific 2013, ADB 4-3
165 Nadzab Domestic Passengers ('1000) Total GDP (Million PGK) Figure 4.3-1(a) Correlation between Nadzab Domestic Passengers and Total GDP Nadzab Domestic Passengers ('1000) Nonmineral GDP (Million PGK) Figure 4.3-1(b) Correlation between Nadzab Domestic Passengers and Nonmineral GDP Nadzab Domestic Passengers ('1000) Population (Million) Figure 4.3-1(c) Correlation between Nadzab Domestic Passengers and Population 4-4

166 Table presents correlations between the passenger movements and Total/Nonmineral GDP as well as the population. As can also seen from Figure 4.3-1, the passengers and indices are all increasing, and correllation coeficients obtained seem to be quite high. Table Correllation Matrix between Nadzab Domestic Passengers and GDP/Population Total GDP Nonmineral GDP Population Nadzab Domestic Pax. ('1000) (ANG+APNG) It is generally accepted that economic outputs represented by GDP could generate demand for people to travel. It is also understandable that a travel demand would be generated when the population, potential travelers, increases. However, travel cost by air in Papua New Guinea is quite expensive (APNG return flight between Port Moresby and Lae in September cost about PGK 620, equivalent to JPY 31,000 at PGK=JPY 50, which is slightly cheaper than the shuttle round trip fare of JAL: JPY 33,480 between Tokyo and Osaka) but the per capita GDP is still very low belonging to the lowest income country group of Pacific Islands as shown in Figure 4.3-2, and it is considered unlikely that past population increase directly contributed to the growth of passenger movements at Nadzab Airport. Therefore, the Total GDP and Nonmineral GDP have been selected for further examination. Figure Comparison of GDP per Capita among Pacific Island Countries Data source: IMF Country Report No. 13/339 December
167 4.3.2 Projection of Socio-economic Framework For the sake of the demand forecast for domestic passengers, the future economic growth rates of PNG, the Total GDP and Nonmineral GDP are necessary to be established. 1) Total GDP According to the GDP forecast by international organizations as well as the Government of Papua New Guinea (GPNG), future GDP is forecast as shown in Table In any case GDP in 2015 is expected to significantly grow at around 20% because the construction of PNG LNG project is completed and its export becomes in full stream. In and after 2016, IMF foresees moderate GDP growth of around 3.5% while the Government of Papua New Guinea (GPNG) has slightly negative prospect of around 3% growth (Government of Papua New Guinea 2014 Budget Strategy Paper). Table Anticipated Future GDP Growth Rates by International Organizations and GPNG Year Future GDP Annual Growth IMF World Bank ADB GPNG 2014 Budget Source: IMF, World Economic Outlook Database, April 2014 World Bank, Global Economic Prospects, January 2014 ADB, Asian Development Outlook 2014 GPNG 2014 Budget: Government of Papua New Guinea 2014 Budget Strategy Paper For the purpose of estimating future airport traffic at Nadzab Airport, the future GDP (total) growth rates have been assumed as shown in Table GDP growth rate in and after 2016 has been achieved to be 3.3% by averaging extended IMF estimate of 3.5% and the GPNG estimate of 3%. Table Assumed Future Total GDP Growth Rates Year GDP Growth Rate References % Projected in IMF World Economic % Outlook % IMF/ADB (rounded) 2016 and after 3.3% Average of IMF and GPNG Estimates 4-6
168 Total GDP (Million PGK, 1998 constant price) Actual Total GDP Estimated Total GDP Figure Historical Trend of Actual and Assumed Total GDP 4-7
169 2) Nonmineral GDP IMF and GPNG published future estimate of nonmineral (non-mining) as shown in Table Although the estimate for 2018 made by GPNG is lower than the estimate by IMF, both estimates are very much similar for the other years and averaged growth rates have been adopted from 2013 to For 2019 and thereafter, average of the adopted growth rates excluding the highest in 2013 and the lowest in 2014 has been computed as 4.2% and adopted. Table IMF/GPNG Estimates and Adopted Nonmineral GDP Growth Rates Year IMF Estimate GPNG Estimate Adopted Growth Rates Mineral Nonmineral Nonmineral (Average of IMF and GPNG) % 5.4% 5.5% 5.5% % 1.7% 1.3% 1.5% % 4.2% 4.3% 4.3% % 4.5% 4.3% 4.4% % 4.5% 4.5% 4.5% % 4.5% 2.4% 3.5% 2019 and after % Data source: IMF Estimates: IMF Country Report No. 13/339, December 2013 GPNG Estimate: 2014 Budget Strategy Paper Nonmineral GDP (Million PGK, 1998 constrant price) Nonmineral GDP (Actual) Nonmineral GDP (Estimate) Figure Historical Trend of Actual and Estimated Nonmineral GDP 4-8
170 4.4 Annual Domestic Passenger Forecast Study Flow Study flow of demand forecast for annual domestic passenger is shown in Figure Firstly, regression analysis has been carried out based on the historical data of air passengers provided by Air Niugini and Airlines PNG and historical GDP provided by IMF. Note that the historic traffic data of Air Niugini and Airline PNG only are available as Travel Air and North Coast Aviation are new comers. The future domestic passengers are forecast based on the model established by regression analysis and socio-economic framework. Trend of Domestic Passengers Trend of GDP/ GDP per capita Regression Anylisis Projection of Future GDP Future Domestic Passengers Figure Study Flow of Forecast for Domestic Passengers Forecasting Models and Result 1) Regression Analyses Regression analyses have been made in order to obtain forecasting models of the future domestic air passenger movements at Nadzab Airport. Typically there are three types of models commonly used for air passenger demand forecast; linear type, logarithm type and exponential type. Result of the regression analyses is as shown in Table 4.4-1and Figure (Total GDP) as well as Table and Figure (Nonmineral GDP). Table Forecasting Models Tested for Nadzab Airport Case (Total GDP) Parameter Linear Type Logarithm Type Exponential Type Basic Y=A*X+B Y=A*Ln(X)+B Y=X A * e B Y Domestic passenger movements at Nadzab Airport (ANG & APNG) X Total GDP (Million PGK) in 1998 constant price A B Coefficient of Determination (R 2 )
171 Annual Domestic Passengers (thousand) 1,200 1, Actual Linear Log Exponential Figure Forecast ANG & APNG Passengers at Nadzab Airport (Total GDP) Table Forecasting Models Tested for Nadzab Airport Case (Nonmineral GDP) Parameters Linear Type Logarithm Type Exponential Type Basic Equation Y=A*X+B Y=A*Ln(X)+B Y=X A * e B Y Domestic passenger movements at Nadzab Airport (ANG & APNG) X Nonmineral GDP (Million PGK) in 1998 constant price A B Coefficient of Determination (R 2 ) Annual Domestic Passengers (thousand) Actual Linear Log Exponential Figure Forecast ANG & APNG Passengers at Nadzab Airport (Nonmineral GDP) 4-10
172 2) Conversion to Total Nadzab Airport Domestic Passenger Movements The demand indicated in Figures and is based on the historical traffic data of ANG and APNG only, and the passengers of Travel Air and North Coast Aviation should be added. The share of each airline at Nadzab/Lae Airport is shown in Table The total domestic passenger including Travel Air and North Coast Aviation is calculated by multiplying ANG+APNG demand by 1.1 as shown in Table Table Share of Each Airline at Nadzab Airport Year Description Air Niugini Airline North Coast Travel Air PNG Aviation Total 2012 Passengers ( 1000) Share 68% 22% 8% 2% 100% Table Comparison of Nadzab Airport Domestic Passengers Forecast Results Description Total GDP Nonmineral GDP Linear Logarithm Exponent Linear Logarithm Exponent 2003 (ANG & APNG) 150 Actual 2012 (ANG &APNG) 296 ( 1000) AAGR ( 03-12) 7.8% 2012 (Total) ( 1000) AAGR ( 12-21) 6.9% 4.6% 8.4% 4.4% 3.1% 5.3% 2026 ( 1000) Forecast AAGR ( 21-26) 3.7% 2.1% 4.5% 4.7% 2.8% 5.7% (Total) 2031 ( 1000) , AAGR ( 26-31) 3.6% 1.8% 4.5% 4.6% 2.5% 5.7% AAGR ( 12-31) 5.2% 3.2% 6.4% 4.6% 2.9% 5.5% Note. AAGR: Average Annual Growth Rate (%) 3) Forecast in National Development Strategy Plan According to the National Development Strategy Plan (NDSP ) formulated by the Government of Papua New Guinea, the domestic air passenger demand in Momase Region has been forecast to reach approximately 2 million in As the movements at Nadzab Airport accounts for about 53% of Momase Region, NDSP envisaged that the domestic air passenger movements at Nadzab Airport would increase to approximately 1 million in The average annual growth rate from 2012 to 2030 in this case is approximately 6.4%. 4-11
173 Figure Domestic Air Passenger Forecast in National Development Strategy Plan ) Choice of Forecasting Model Type The exponential type model represents elasticity of traffic against explanatory parameter. For example, value of A of the exponential type model (Total GDP) was 1.371, meaning the traffic would increase at times faster than the growth rate of the Total GDP (average annual growth rates from and obtained were both 4.5%, about times the assumed Total GDP growth rate of 3.3%). In case the elasticity (value of A) is more than 1, the traffic trend is exponentially upward and could result in overestimate. On the other hand, the logarithm type model reflects downward trend of a traffic as is the case of the forecast result of logarithm type (Total GDP), average annual growth rates of the traffic decreasing from 7.8% ( ) to 4.6% ( ), 2.1% ( ) and 1.8% (2026 to 2031). In Papua New Guinea, as the income level of the people is expected to improve progressively in future, more patronage of the air travel can be expected and the downward trend represented by the logarithm model is considered not suitable for forecast of the Nadzab Airport domestic passenger movements. Even though this type of model achieved the highest value of the coefficient of determination (0.98), the differences between the other two model types are about 0.02 and it can be concluded that such small difference should not be a basis to choose the forecasting model which produces a forecasting result not coincide with the anticipated future. The linear type model reflects certain volume of growth of the traffic in proportion to the increase of an explanatory parameter (value A). In terms of the change against previous year, the traffic growth rates become slightly smaller relative to the growth rates of the explanatory parameter as the traffic volume gets bigger. The coefficient of determination of the linear type models was around 0.96 (Total GDP and Nonmineral GDP), slightly lower than the logarithm type (around 0.98) but still high enough, showing high degree of interpretation. The linear type model produces the moderate result of forecast. 4-12
174 For the purpose of formulating Nadzab Airport Master Development/Rehabilitation Plan, a risk of overestimating and underestimating the future demand should be avoided as much as possible and from that viewpoint the linear type forecasting model is considered the most suitable and should be adopted. 5) Choice of Total GDP or Nonmineral GDP The GDP statistics are available for each of the industrial sectors; agriculture, mining, manufacturing, electricity/gas/water, construction, trade, transportation/communication, finance and public administration. The mining sector includes traditional gold, silver, copper nickel and oil mining in addition to the newly developed LNG. It is impracticable to exclude the LNG component only from the GDP statistics. The Survey Team considers choice of the Total GDP is more preferable than the Nonmineral GDP because of the following: There are several existing and applied mining sites operated by Morobe Mining Joint Venture (MMJV) in Morobe Province, exploring gold, silver, copper, molybdenum, etc. MMJV is a joint venture organized by South African and Australian companies. The activities of MMJV should be regarded as one of the air traffic demand generators for Nadzab Airport. In case Nonmineral GDP is used as the forecasting parameter, the activities of MMJV would be disregarded. PNG LNG project site is far from Morobe Province and the City of Lae, and its direct impact on Nadzab Airport traffic demand generation is unlikely, however dividend and tax payments attributable to the PNG LNG project is expected to peak in the early 2020s (ADB statement) and the increase of real income for Papua New Guinea could function as a driving force to generate air travel demand within the planning horizon of the Nadzab Airport Project. 6) Conclusion In conclusion, the domestic passenger demand forecast at Nadzab Airport has been carried out based on the linear type forecasting model and the Total GDP was employed as the explanatory parameter. Result is summarized in Table Table Summary of Forecasting Model, Parameter and Result Type of Equation Linear Type Basic Y=A*X+B Y Domestic passenger movements (ANG & APNG) X Total GDP (Million PGK) in 1998 constant price A B Coefficient of Determination (R 2 )
175 Type of Equation Linear Type Domestic Passenger Movements ( 1000) 2012 (Actual) 328 (AAGR 03-12: 7.8%) 2021 (Opening Day) 600 (AAGR 12-21: 6.9%) 2026 (5 years after Opening Day) 718 (AAGR 21-26: 3.7%) 2031 (10 years after Opening Day) 858 (AAGR 26-31: 3.6%) The domestic passenger movements shown in Table include international passengers who board a Nadzab-Port Moresby flight and transfer to/from international flight at Port Moresby Airport. These passengers who are essentially international passengers are forecasted and the scheduled international flights to/from Nadzab Airport are estimated in Section 4.7. As these international passengers are converted from domestic passenger of Nadzab-Port Moresby flight to international direct flight, the international passenger movements should be subtracted from passenger movements shown in Table However, the number of conversion passengers are minimal, therefore, the reduction has not been considered. 4-14
176 4.5 Domestic Peak Demand Forecast Study Flow Based on the annual demand forecast, peak demand such as daily and hourly demand has been analyzed by following study flow as shown in Figure Peak demand is a basis for the study of facility requirement. In order to calculate the peak demand, design day ratio and peak hour ratio should be established. Annual Passengers Design Day Passengers Design Hour Passengers Peak Hour Ratio Design Day Ratio Figure Study Flow of Peak Demand Design Day and Peak Hour Ratio 1) Design Day Ratio Design day ratio is set as the ratio of passengers of average day of peak month to annual passengers. Average ratio in the last three years is 1/326. Table Design Day Ratio Actual Average / /306 1/ /345 2) Peak Hour Ratio Peak hour ratio is set based on the flight schedule as of May 2014 at Nadzab/Lae Airport which is shown in Figure The total number of flight of the day was 54, and the number of flight at peak hour during 9-10 am was seven. The peak hour ratio at Nadzab/Lae Airport has been set as follows: Peak Hour Ratio = 7 / 54 =0.130 Figure Number of Flights by Time 4-15
177 4.5.3 Peak Demand Based on the annual passengers and the peak ratios, design day and peak hour passengers are calculated as shown in Table Table Peak Demand Year Annual Domestic Peak-day Domestic Peak-hour Domestic Passengers Passengers Passengers (Two-way) ,000 1, ,000 2, ,000 2,
178 4.6 Domestic Aircraft Movements Forecast Study Flow Aircraft movements are estimated based on the annual passengers and airline s future fleet plan. Design day aircraft movements are calculated based on the design day passengers by airline and by route as shown in Figure Annual Passengers Annual Passengers by Airline/Route Design Day Passengers by Airline/Route Airline Share Route Share Design Day Ratio Design Day Aircraft Movements Annual Aircraft Movements Planned Load Factor Aircraft Seat Capacity Figure Study Flow of Aircraft Demand Planning Factors The planning factors which are required for calculation of the design day aircraft movements are set as follows: 1) Airline Share Airline share in terms of the number of passengers is shown in Table The passengers by airline are shown in Table Table Airline Share ANG APNG TA NCA 68% 22% 8% 2% Note: Based on 2012 data Table Estimated Domestic Passengers by Airline Year Annual Passengers ( 1000) ANG (68%) APNG (22%) TA (8%) NCA (2%) Total (100%)
179 2) Route Share Route share in terms of the number of passengers is shown in Table ) Future Aircraft and Load Factor Table Route Share According to the comment of Air Niugini, gradual introduction of a larger type of aircraft such as B737 will be considered when daily flight frequency of F100 exceeds 5 or 6. Besides, Air Niugini will replace Dash 8-Q400 with Fokker F70 or another 70-seater aircraft and Airlines PNG will replace Dash8-100 with ATR72 in the near future. As for the load factor, current load factors for Port Moresby-Nadzab is approx. 80% and the others approx. 30% according to Air Niugini. The load factors in future have been assumed to be 70% for the flight to/from Port Moresby and 60% for the other flights Daily Domestic Aircraft Movements Based on the future demand and future aircraft, aircraft movements on design day are calculated as shown in Table and Table Airline Route Share Airline Route Share ANG POM 90% TA POM 40% HKN 10% MAG APNG POM 75% Others 60% RAB NCA 100% HKN GKA 25% MAG Others Note: Based on data of Table Summary Forecasts of Daily Domestic Aircraft Movements Aircraft B seater/ATR F BN Total Airline Aircraft Seats L/F ANG Note. Detail calculation is shown in Table Table Future Aircraft and Load Factor B % 70-seater 75 Port Moresby 70% Others 60% APNG ATR % TA F % NCA BN 9 60% 4-18
180 Table Calculation of Daily Domestic Aircraft Movements Airline PAX Route Share PAX Aircraft S/C Movements ANG 408 POM 40% 163 B POM 50% seater HKN 10% seater 75 2 APNG 132 POM 75% 99 ATR RAB 2 HKN 2 GKA 25% 33 ATR MAG 2 Others 2 TA 48 POM 40% 19 F MAG 2 60% 29 F50 58 Others 2 NCA BN 9 6 Total 600 B seater 14 ATR72 18 F50 6 BN 6 Total 48 Airline PAX Route Share PAX Aircraft S/C Movements ANG 489 POM 50% 245 B % POM 40% seater HKN 10% seater 75 4 APNG 158 POM 75% 119 ATR % RAB 2 HKN 2 GKA 25% 39 ATR MAG 2 Others 2 TA 57 POM 40% 23 F % MAG 2 60% 34 F50 58 Others 2 NCA BN 9 8 Total 718 B seater 16 ATR72 18 F50 6 BN 8 Total 54 Airline PAX Route Share PAX Aircraft S/C Movements ANG 583 POM 60% 350 B % POM 30% seater HKN 10% seater 75 4 APNG 189 POM 75% 142 ATR % RAB 2 HKN 2 GKA 25% 47 ATR MAG 2 Others 2 TA 69 POM 40% 28 F % MAG 2 60% 41 F50 58 Others 2 NCA BN 9 10 Total 858 B seater 14 ATR72 20 F50 6 BN 10 Total
181 4.6.4 Peak-hour Domestic Aircraft Movements Table shows forecast domestic aircraft movement at Nadzab/Lae Airport. Table Forecast Peak-hour Domestic Aircraft Movements Aircraft Type B767/B777/B787 Occasional diverted flights only. B seater, ATR F BN Total
 The record of domestic passengers")


182 4.7 International Passenger Demand Forecast Current Situation of International Passengers Originated from Lae Survey Team collected two different data with respect to the international passengers who departed Lae and transferred to any international flights at Port Moresby as follows: i) The record of domestic passengers who departed Nadzab by Air Niugini flights and transferred to the international at Port Moresby provided by Air Niugini; and ii) Result of the international passenger interview survey conducted at Port Moresby. According to the analysis of these data, the destinations of the passengers whose trips were originated from Lae Airport and transferred to the international flight at Port Moresby Airport is shown in Figure Brisbane accounted for the largest share of around 40%, followed by Cairns. Destinations of passengers who departed Nadzab by Air Niugini Destinations of International Passengers interviewed at Port Moresby Airport Source: Survey Team Source: Survey Team Figure International Destination of Passenger Originated from Lae Figure shows daily shares of international passengers departing to Brisbane/Cairns in a week. Data provided by Air Niugini Result of interview survey at Port Moresby Figure Fluctuation of Potential International Passenger Originated from Lae 4-21
183 4.7.2 Number of International Passengers 1) Estimate of International Departing Passengers Based on the data at Nadzab provided by Air Niugini as well as Port Moresby interview survey, number of international departing passengers has been estimated as described below. a) Case 1: Daily Passengers based on the data collected at Nadzab/Lae (Data of Air Niugini) The daily international passengers at Nadzab/Lae Airport are estimated based on the number of passengers who enplaned the Air Niugini flights from Lae to Port Moresby (Case 1). Air Niugini accounted for 68% of the total passengers at Nadzab/Lae Airport, and the Air Niugini passengers between Lae and Port Moresby accounted for 90% of Air Niugini passengers to/from Nadzab/Lae Airport. Finally, daily international passengers for Brisbane/Cairns are calculated as shown in Table by using the share of international passengers of each day. 1 Share of ANG 2 Share of LAE-POM route 3 Share of Int'l Passengers (originated Lae) by route and day Domestic Passengers at Lae Airport ANG APNG TA POM HKN-RAB MAS Daily International Passengers to/from Lae Figure Study Flow of International Passengers (1) Table Estimate of Potential Daily Int l Passengers (Case 1: Data provided by Air Niugini) Mon Tue Wed Thu Fri Sat Sun Annual Domestic Passengers Annual ANG Portion Annual POM-LAE (thosand) (thosand) (thosand) Share of Departure Passengers for Brisbane Share of Departure Passengers for Cairns Daily International Departure Passengers for Brisbane Daily International Departure Passengers for Cairns 1 2= 3= 6= 7= % 2 90% 3/365 4/2 3/365 5/ % 1% % 0% % 0% % 3% % 8% % 12% % 4%
184 b) Case 2: Daily Passengers based on the interview survey at Port Moresby For the calculation of the daily international passengers at Nadzab/Lae Airport based on the result of interview survey at Port Moresby Airport (Case 2), the annual international passengers at Port Moresby Airport is the basis of calculation as shown in Figure Future international passengers at Port Moresby Airport are forecast as shown in Figure The daily international passengers for Brisbane/Cairns from Lae are calculated as shown in Table by using the share of international passengers of each day shown in Figure Annual International Passengers at POM Average Day International Passengers at POM Daily International Passengers at LAE Share of Int'l Passengers (originated Lae) by route and day Figure Study Flow of International Passengers (2) Figure Forecast of Annual International Passengers at POM 4-23
185 Table Estimate of Potential Daily Int l Passengers (Case 2: Interview Survey at Port Moresby) Mon Tue Wed Thu Fri Sat Sat Annual International Passengers at POM (thosand) Average Day International Passengers at POM Share of Departure Passengers for Brisbane Share of Departure Passengers for Cairns Daily International Departure Passengers for Brisbane Daily International Departure Passengers for Cairns 1 2=1/ =2 3/2 6=2 4/ , ,666 1% 0% ,158 3, , ,666 5% 1% ,158 3, , ,666 6% 2% ,158 3, , ,666 10% 3% ,158 3, , ,666 14% 4% ,158 3, , ,666 0% 0% ,158 3, , ,666 4% 2% ,158 3, c) Estimate of Realized Daily International Departing Passengers and Aircraft Movements The daily international departure passengers for Brisbane and Cairns, to be regarded as the potential demand, are set as the average of Cases 1 and 2 indicated in Tables and A possibility to inaugurate a direct flight to Brisbane/Cairns from Nadzab/Lae has been assessed based on the criteria whether the aircraft load factor could be 60% or more as shown below. Load Factor = Daily Passengers / (Seat Capacity Number of Flight) 60% In the case that the potential daily departure passengers are more than the seat capacity of one departure and less than 60% of load factor of two departures, it is assumed that one departure might be operated and passengers who overflow the capacity of one departure should travel to Brisbane/Cairns via Port Moresby Airport. The international departure passengers and aircraft departure movements to be realized based on the above-stated criteria are shown in Tables and
186 Table Daily International Departing Passengers and Aircraft Movements (Nadzab-Brisbane) Mon Tue Wed Thu Fri Sat Sun Daily International Passengers for Brisbane ('000) LAE POM Average Number of Daily Departure Flights by B737 (158 seater) Load Factor % % % % % % % % % % % % % % % % % % % % % Note: Yellow color indicates the operation of international departure flight (Load factor is more than 60%). Table Daily International Departing Passengers and Aircraft Movements (Nadzab-Cairns) Mon Tue Wed Thu Fri Sat Sun Daily International Passengers for Cairns ('000) LAE POM Average Number of Daily Flights by F70 (75 seater) Load Factor % % % % % % % % % % % % % % % % % % % % % Note: Yellow color indicates the operation of international departure flight (Load factor is more than 60%). 4-25
187 The number of the departure flights in a week and annual international passengers are set as shown in Tables and Table Departure Flights in a Week Year Route Aircraft Mon. Tue. Wed. Thurs. Fri. Sat. Sun. Total 2021 Brisbane B Cairns 70-seater Brisbane B Cairns 70-seater Brisbane B Cairns 70-seater ) Expected Flight Pattern Considering the weekly distribution of the potential international passengers originated from Lae, most of them departing on Thursday/Friday/Saturday are likely to those visiting families in Australia. Although interview survey for the potential arriving passengers was not conducted, most of the passengers from Australia return to Nadzab on Monday and Tuesday according to an observation by personnel. Therefore the flights between Nadzab and Brisbane/Cairns are likely to be operated connecting Port Moresby and Brisbane/Cairns via Nadzab. It has been assumed that the international flights between Nadzab and Brisbane/Cairns would be operated as follows: On Thursday and Friday, departing Port Moresby and arriving Nadzab in the afternoon, departing Nadzab late afternoon and arriving Brisbane/Cairns in the evening. The aircraft is to be used for a nonstop flight from Brisbane/Cairns to Port Moresby on the following day. On Monday or Tuesday, departing Brisbane/Cairns in the morning, arriving Nadzab at around noon time, departing Nadzab early afternoon and arriving Port Moresby late afternoon. The aircraft is to be used for a nonstop flight from Port Moresby to Brisbane/Cairns or other destinations. It has also been assumed that the international passengers who would depart Nadzab to Brisbane/Cairns on the international flights would return to Nadzab directly from Brisbane/Cairns. 3) Estimated International Passenger Movements Estimated international passenger movements are summarized in Table
188 Table Estimated Design Day/Annual International Passengers Weekly Passengers (Aircraft Movements) Year Route Dep./Arr. Aircraft Mon. or Tue. Thurs. Fri. Total Annual Passengers Brisbane Cairns Total Brisbane Cairns Total Brisbane Cairns Total Dep (1) 120 (1) 6,200 B737 Arr. 120 (1) (1) 6,200 Dep seater Arr Dep (1) 120 (1) 6,200 - Arr. 120 (1) (1) 6,200 Dep (1) 140 (1) 7,300 B737 Arr. 140 (1) (1) 7,300 Dep (1) 50 (1) 2, seater Arr. 50 (1) (1) 2,600 Dep (2) 190 (2) 9,900 - Arr. 190 (2) (2) 9,900 Dep (1) 140 (1) 240 (2) 12,500 B737 Arr. 240 (2) (2) 12,500 Dep (1) 60 (1) 3, seater Arr. 60(1) (1) 3,100 Dep (1) 200 (2) 300 (3) 15,600 - Arr. 300 (3) (3) 15,600 Note 1: Number of aircraft departure/arrival is one each. Note 2: Annual passengers are calculated as 52 times the weekly passenger movements. Note 3: As for passengers for Brisbane on Friday in 2031, though potential daily passengers are 340, it is assumed that passengers are limited by 90% of seat capacity of B
189 4.8 Airport Access Traffic Study Flow Traffic volume generated by an activity of air passengers is calculated based on the design day passenger movements as shown in Figure Several planning factors colored in the study flow are surveyed at Nadzab/Lae Airport. Well-Wisher Ratio Airport Staff Ratio Well-Wisher Design Day Passengers Airport Staff Modal Split for Passenger+Well-wisher Modal Split for Airport Staff Passenger & Well-wisher by Access Mode Airport Staff by Access Mode Private Car PMV Coach Private Car PMV Users by Access Mode Private Car PMV Coach Number of Users per Vehicle Traffic Volume by Access Mode Private Car PMV Coach Figure Study Flow of Airport Access Traffic Forecast PMV: Public Motor Vehicle Planning Factors 1) Well-wisher Ratio The number of well-wisher is surveyed by interview with air passengers. The number of well-wisher per air passenger is set as shown in Table ) Airport Staff Ratio Airport staff ratio is set as 0.25 staff per daily 4-28 Table Well-wisher Ratio Well-wishers per Passenger 0.82 Table Airport Staff Ratio Airport Staff per Daily Passenger 0.25
190 passenger based on the current number of airport staff (around 200) and average daily passengers (around 800). 3) Modal Split The modal split for air passengers and well-wisher is surveyed by interview with air passengers. The modal split is set as shown in Table The modal split for airport staff is set as shown in Table by the assumption that staff and half of airline staff use private car. Table Modal Split for Air Passengers and Well-wisher Private Car PMV Coach 66% 24% 10% Table Modal Split for Airport Staff Private Car PMV 48% 52% 4) Number of Users per Vehicle The number of users per vehicle is surveyed by interview with air passengers, and set as shown in Table Table Number of Users per Vehicle Private Car PMV Coach
191 4.8.3 Traffic Volume Based on the future demand and planning factors, traffic volume on design day are calculated as shown in Table Table Estimated Traffic Volume Design Day Passengers Domesutic (passengers/day) 1,840 2,200 2,630 International (passengers/day) Total (passengers/day) 2,080 2,580 3,030 1 Well-wisher/Welcomer (persons/day) 1,710 2,120 2,480 2 = Airport Staff (persons/day) = Passenger and Well-wisher by Access Mode Airport Staff by Access Mode Users by Access Mode Traffic Volume by Access Mode Private Car (persons/day) 2,500 3,100 3,640 4 =(1+2) 66% PMV (persons/day) 910 1,130 1,320 5 =(1+2) 24% Coach (persons/day) =(1+2) 10% Private Car (persons/day) =3 48% 2 PMV (persons/day) =3 52% 2 Private Car (persons/day) 3,000 3,720 4,370 9 =4+7 PMV (persons/day) 1,450 1,810 2, =5+8 Coach (persons/day) =6 Private Car (vehicles/day) 1,110 1,380 1, =9/2.7 PMV (vehicles/day) =10/6.3 Coach (vehicles/day) =11/2.6 Total (vehicles/day) 1,490 1,850 2, = (vehicles/hour) =
192 4.9 Annual Air Cargo Relation between Air Passenger and Air Cargo According to the data provided by Air Niugini, the relation between the air passenger and air cargo is a as shown in Table The air cargo volume is generated at a ratio of 0.01 tons per annual passenger on the route of Lae - Port Moresby, and tons per annual passenger on the other routes. LAE-POM Other than LAE-POM Table Relation between Air Passenger and Air Cargo Annual Passengers ,000 2, ,000 1, ,000 1, Ave ton/annual PAX Note: 2012 data include Jan-Sep. Source: Air Niugini Annual Passengers Annual Cargo (ton) Annual Cargo (ton) Cargo/ Passengers Cargo/ Passengers , , , Ave ton/annual PAX Note: 2012 data include Jan-Sep. Source: Air Niugini Annual Air Cargo Demand Based on the air cargo volume per annual passenger and future annual passenger demand, annual cargo volume is forecast as shown in Table
193 Domestic Table Annual Air Cargo Demand year Airline Aircraft Annual Passengers (thousand) Cargo/ Passengers (kg/pax) Annual Cargo (ton) 2021 ANG LAE-POM ,670 Others APNG TA NCA Total 600 4, ANG LAE-POM ,410 Others APNG TA NCA Total 718 5, ANG LAE-POM ,250 Others APNG TA NCA Total 858 6,915 International year Route Annual Passengers (thousand) Cargo/ Passengers (kg/pax) Annual Cargo (ton) 2021 Brisbane Cairns Total Brisbane Cairns Total Brisbane Cairns Total
194 4.10 Summary Result of Passenger, Cargo and Aircraft Movements Forecast Table summarizes result of the annual and peak-day passenger, cargo and aircraft movements at Nadzab/Lae Airport for years 2021 through Table Summary for Future Demand Description Domestic Annual (passengers) 600, , ,000 Passengers Peak Day (passengers) 1,840 2,200 2,630 International Annual (passengers) 12,000 20,000 31,000 Passengers Peak Day (passengers) B seater Daily Aircraft Domestic F Movements BN Total B Weekly Aircraft International 70-seater Movements Total Domestic Cargo Annual (ton) 4,800 5,800 6,900 International Cargo Annual (ton)
195 SECTION 5 VERIFICATION OF EXISTING FACILITIES AND EXAMINATION OF FACILITY REQUIREMENTS
196 SECTION 5: VERIFICATION OF EXISTING FACILITIES AND EXAMINATION OF FACILITY REQUIREMENTS 5.1 Target of Nadzab Airport Rehabilitation Project Requirements to Enable Future Role of Nadzab/Lae Airport As discussed in Subsection 2.3.4, future role of Nadzab/Lae Airport is considered as one of the regional airports: Capable of accommodating short to medium range international and domestic operations by B class aircraft; and Alternative to Jacksons/Port Moresby International Airport in case of its temporary closure due to bad weather, etc. In addition to the rehabilitation of obsolete and deteriorated facilities and equipment, the target of Nadzab Airport Rehabilitation Project (the Project) may be defined based on its future role mentioned above as upgrading: To the second international airport offering short to medium-haul scheduled flights by up to B737; As the second busiest domestic airport capable of accommodating up to B737 (to be upgraded from current F100); and To an alternate airport for Jacksons/Port Moresby International Airport. 1) Upgrading to the Second International Airport At present there is only one international airport in Papua New Guinea; Jacksons/Port Moresby International Airport. One of the targets of the Project is to upgrade Nadzab/Lae Airport to the second international airport in Papua New Guinea with scheduled international flights. The air traffic demand forecast has revealed that there would be some international air passenger demand between Lae and Brisbane by B737 and Cairns by 70-seater class aircraft in 2021 and 2026, and therefore Nadzab Airport should be capable of accommodating B /800 with operational take-off weight to Brisbane (distance from Lae to Brisbane is approx. 2382km=1286NM). From facility planning viewpoint, commencement of the international scheduled flights would necessitate: Improvements of the runway, taxiways and apron dimensions and strength; Provision of the international passenger processing/amenity areas and equipment; Provision of the international cargo storage and processing areas and equipment; Upgrading of the rescue and fire-fighting station and equipment; and Improvement to accommodate nighttime operations. 5-1
197 The international passenger processing/amenity areas and equipment may be utilized for the domestic passenger handling when no international passenger needs to be accommodated. 2) Upgrading to the Second Busiest Domestic Airport In addition to the requirements related to the commencement of international scheduled flights, enhancement of the domestic passenger and cargo handling capacity and service grade would be required. 3) Upgrading to an Alternate Airport for Jacksons/Port Moresby International Airport An alternate airport should be capable of accommodating diverted aircraft from Jacksons/Port Moresby International Airport. The diverted aircraft was about to land at Jacksons but was not able to do due to severe bad weather or any other adverse operational conditions. The aircraft would have already consumed most of its fuel. When the adverse operational conditions disappear, the diverted aircraft would fly to Jackson/Port Moresby, approx. 300km away from Nadzab Airport. Therefore, the operational take-off weight is much smaller than those required for the international scheduled departures; and hence the runway length and strength. However, the geometry of the runway, taxiways and apron should be adequate for ground maneuvering of Code E aircraft. Air Niugini will replace current B767 with Code E aircraft. So far B787-8 and B are being considered as the replacement. As B has wider wheel span and longer wheel base than B787-8, the taxiway fillets and dimension of the 180-degree turn pad have been examined based on B data. Detail is to be reviewed based on decision by Air Niugini in the design works during the project implementation stage. 4) Opening Day and Target Year for Formulation of Airport Master Plan Terms of Reference (TOR) issued by to the Survey Team defines the Opening Day and the Target Year for formulation of the Nadzab Airport Master Rehabilitation/Development Plan (hereinafter referred to as the Airport Master Plan ) as follows: Opening Day: Year 2021; and Target Year for the Airport Mater Plan: It means that the Project will be completed by 2021, and on its opening day, Nadzab/Lae Airport will have an adequate capacity to accommodate the forecast airport traffic of 2026; five years after the Opening Day. The airport facility after completion of its development should be capable of accommodating somehow future traffic demand, but not so far distant future as unreasonably large initial investment compared to the anticipated level of the traffic demand cannot be financially and economically justifiable. It is a common practice in airport planning in Japan to prepare a phased development concept typically at 5-year interval. Meanwhile, requested that ten 5-2
198 years after the opening day should be chosen as the target year. During the presentation meeting held on July 1 st, 2014, attended by staff, representatives and Study Team, explained that in Morobe Region there is a strong potential of demand increase at Nadzab Airport such as the international business activities and mineral exploitation, and the airport traffic demand might unexpectedly increase. And is not likely to be able to invest in further development of the airport shortly after the completion of the Project. So Nadzab Airport should have a handling capacity adequate to cater for the forecast traffic demand 10 years after the opening day; This is obviously the case when we see the past experience of Jackson s Airport redevelopment by Japan s Yen Loan. There should be no difference in principle of the facility requirements in 2026 and 2031 of the runway, taxiways, apron and the aeronautical ground lights as well as the administration building, rescue and fire-fighting station and the control tower, etc. There could be very minor difference of the refurbishment of the existing passenger terminal for conversion to the cargo terminal. There would be some difference in the floor space requirement of the new passenger terminal building in 2026 and 2031 (difference is approx. 300m 2 ). It is true that physical expansion of the terminal building a few years after its opening would be an annoyance for efficient and safe terminal operation. It would be much easier for to increase the terminal capacity if adequate floor space equivalent to the 2031 requirement is provided from the beginning and the terminal equipment to be added according to the traffic increase. Thus following phased development concept has been proposed: a) Initial capacity of the new passenger terminal building; year 2026 (5 years after opening). b) Initial capacity of the terminal equipment such as check-in counters, security check equipment, etc.; year 2026 (5 years after opening). c) Initial floor space of the new passenger terminal building; equivalent to year 2031 (10 years after opening). 5-3
199 5.2 Planning Considerations and Parameters Planning Considerations 1) Design Aircraft As discussed in above, the design aircraft for the scheduled operation should be B However, in some cases, selection of Code E aircraft such as B as the design aircraft may be more reasonable and justifiable; the cement concrete pavement, for example, having its general life cycle of 20 years or more, should be designed for Code E as once it is constructed for B737, reinforcement to cope with B would involve several engineering challenges and would be costly and troublesome for airport operation. Therefore due consideration should be paid to any requirements to accommodate B in future. With regard to the requirements as an alternate airport for PMIA, the geometry of the runway, taxiways and apron should allow safe ground maneuvering of B in accordance with ICAO requirements. The existing location of the runway, taxiways and apron as well as the passenger terminal building comply with the separation distance requirements stipulated in ICAO Annex 14 applicable to B At initial stage, the geometry of apron and its taxiway should be such that it allows taxiing of B while B737 is parked on the apron and vice versa. Simultaneous use of the apron and its taxiway by B should be considered as a future requirement. The runway and taxiway pavement strength, when designed to accommodate B737, has been checked to ensure acceptability of occasional overload operation by B In summary, the design aircraft for formulation of the Airport Master Plan should be understood in principle as follows: B generally with due consideration to accommodate B in future. B for geometry of the taxiways and apron, inevitably required for ground maneuvering of diverted aircraft. Figures 5.2-1, and show general dimension of B , B787-8 and B taken from Boeing database. 5-4
200 Figure General Dimension of B (Source: Boeing) 5-5
201 Figure General Dimension of B787-8 (Source: Boeing) 5-6

202 Figure General Dimension of B (Source: Boeing) 5-7
203 2) Aerodrome Reference Code (ANNEX 14) Relevant Aerodrome reference code of ICAO Annex 14 is defined as a combination of the aeroplane reference field length as well as the wing span and outer main gear wheel span of design aircraft as shown in Table Table Aerodrome Reference Code defined in ICAO Annexn14 Code Element 1 Code Element 2 Code Aeroplane Reference Outer main gear wheel Code Letter Wing Span Number Field Length span 1 Up to but not Up to but not including Less than 800 m A including 15 m 4.5 m m up to but not 15 m up to but not 4.5 m up to but not B including 1200 m including 24 m including 6 m m up to but not 24 m up to but not 6 m up to but not C including 1800 m including 36 m including 9 m 4 36 m up to but not 9 m up to but not 1800 m and over D including 52m including 14 m 52 m up to but not 9 m up to but not E including 65m including 14 m 65 m up to but not 14 m up to but not F including 80m including 16 m Aircraft Source: ICAO Annex 14 Fifth Edition, July 2009 Relevant information and categorization of B and B are shown in Table below. Table Aerodrome Reference Code applicable to Nadzab/Lae Airport Aeroplane Reference Field Length Wing Span Outer Main Gear Wheel Span Applicable Reference Code Wheel Base B More than 1800m 35.79m 7.00m 4C 15.60m B More than 1800m 60.93m 12.37m 4E 25.88m It should be noted that the outer main gear wheel span of Dash8-Q400 is more than 9m and is categorized as Code 3D which requires the taxiway width of 23m according to ANNEX 14. However this type of aircraft has been regarded as exceptional case and is currently allowed to operate on 15-m wide taxiways. Dash8-Q400 currently operated by Air Niugini will be replaced by F70 or other type of aircraft in few years because of its low high fuel consumption. Therefore, facility requirement relevant to the categorization of Dash8-Q400 to Code 3D has not been taken into account. 5-8
204 3) Approach Category of Runway The current approach category of the runway is non-precision instrument approach as defined in ICAO Annex 14. This category will remain the same in future as installation of ILS at Nadzab is not included in the scope of PNG ADS-B, MLAT and ATM System (PAMAS: see item 2) of 2.1.5). The wind flows from the east and west throughout the year, frequently changing the direction during a day. Currently, VOR/DME approach procedures are established for both RWY 09 (visibility 2300m) and RWY 29 (visibility 2400m). In case a pilot cannot see the runway from 2300m (RWY 09 approach) or 2400m (RWY 27 approach), the pilot must make missed approach. According to hearing survey at Nadzab, such adverse weather condition necessitating the missed approach has rarely occurred. Table shows occurrences of the visibility conditions provided by the National Weather Services. The worst visibility recorded was 3000m occurred in June, July and August. Low visibility conditions below VOR/DME weather minima (RWY 09: 2300m, RWY 27: 2400m) never occurred. Therefore priority of ILS installation at Nadzab Airport can be concluded low and current category of non-precision instrument approach runway suffices. Table Occurrences of Visibility Conditions (September 2013 to August 2014) 3000m 5000m 8000m 10000m 20000m 30000m 40000m September % % 15.83% 18.33% 60.83% October % 8.06% 80.65% November % 0.83% 5.00% 14.17% 79.17% December % 20.16% 79.03% January % 7.26% 91.13% February % 5.36% 93.75% March % 5.65% 91.13% April % % 9.17% 85.83% May % 12.10% 82.26% June 0.83% % - 7.5% 21.67% 69.17% July 4.84% 5.65% 4.03% % 20.97% 51.61% August 0.81% 0.81% 1.61% % 12.10% 78.23% Note. Observations were made 4 times a day at 07:00, 10:00, 13:00 and 16:00 Data Source: National Weather Services 5-9
205 4) Target Passenger Service Grade International Air Transportation Association (IATA) published Airport Development Reference Manual (hereinafter referred to as ADRM ), in which IATA presented several levels of service as shown in Table Table Passenger Terminal Levels of Service Level of Service Space Time Overdesign Excessive or empty space. Overprovision of resources. Sufficient space to Optimum accommodate the necessary Acceptable processing and functions in a comfortable waiting times. environment. Suboptimum Crowded and uncomfortable Unacceptable processing and waiting times Source: Airport Development Reference Manual 10 th Edition IATA ADRM also describes level of service guidelines for airport terminal facilities from level A and level B as overdesign, level C as optimum, and level D and level E as suboptimum (see Table 5.2-4). For formulation of Nadzab/Lae Airport Master Plan, the level of service of C has been chosen as the target passenger service grade as it represents the optimum level of service. 5-10
206 Table Level of Service Guidelines for Airport Terminal Facilities Passenger Terminal Processor ADRM 9th Edition ADRM 10th Edition SPACE STANDARDS FOR WAITING AREAS( m2 /PAX) WAITING TIME STANDARDS FOR PROCESSING FACILITIES (Minutes) Economy Class WAITING TIME STANDARDS FOR PROCESSING FACILITIES (Minutes) Business Class/First Class PROPORTION OF SEATED OCCUPANTS(%) A B C D E A B C D E A B C D E A B C D E Over design Optimum Suboptimum Over design Optimum Suboptimum Over design Optimum Suboptimum Over design Optimum Suboptimum Public Departure Hall Check-in Self-Service Boarding > <2.3 Pass/Tagging > < > Bag Drop Desk (queue width: m) > < > >3 > <1.3 < >20 <3 3-5 > >3 (queue width:1.2m) > <1 < > >3 > <1 < > >3 Boarding Seating > <1.5 Gate Lounge Standing > <1 >70% 50%-70%*1 <50% Immigration(Passport Control) Wide Body Public Arrival Hall CIP Lounges Check-in Desk (queue width: m) Security Checkpoint Emigration(Passport Control) (queue width:1.2m) (queue width:1.2m) Transfers Baggage Claim Area Narrow Body > <1 <10 10 >10 <5 5 >5 <5 5 > >3 > <1.5 < >15 > <1.5 < > >15 n.b.priority bags to be delivered before > <1.2 Economy >20% 15%-20%*1 <15% 4.0 First passenger to first bag *1 The lower limit is only to be considered if extensive F+B seating is provided in the departure lounge,or,concession zone seating available >3 Business Class Check-in Desk First Class Check-in Desk Fast Track Fast Track Fast Track First passenger to first bag Source:IATA 5-11
207 5.2.2 Planning Parameters 1) Passenger, Cargo and Aircraft Movements The facility requirements of major airport facilities are examined generally based on the forecast passenger, cargo and aircraft movements as shown below: Number of runways, layout of runways and taxiways; peak-hour aircraft movements. Number of aircraft parking stands; peak-hour aircraft arrivals. Passenger terminal building floor spaces as well as number and type of terminal equipment; peak-hour (or shorter time period) passenger movements. Cargo terminal building floor space; annual cargo movements. Level of the rescue and fire-fighting service; size of the largest aircraft and monthly number of landings. Pavement strength; Annual number and weight of aircraft departures. Based on the forecast air traffic demand, these passenger, cargo and aircraft movements are summarized as the planning parameters as shown below. a) Peak-hour Passengers Table summarizes the peak-hour domestic and international passenger movements. The domestic peak-hour passenger movements have been estimated based on the forecast annual passenger movements as well as peak-day/peak-hour rations and a weight for one-way. The international peak-hour passenger movements have been obtained based on an assumption that the B737 flight to/from Brisbane and the 70-seater flight to/from Cairns would not be operated during the same hour (assumed load factor of 80%). Table Assumed Domestic and International Peak-hour Passenger Movements Domestic Passengers Peak-hour International Passengers Year Peak-hour Peak-hour Brisbane (BNE) and Cairns (CNS) Annual Daily (Two-way) (One-way) ,000 2, ,000 2, BNE: B (158 seat) x 80%=126.4 Note. Domestic Peak-day ratio: 1/326, Domestic Peak-hour ratio: 0.13, Weight for one-way: 0.67 b) Peak-hour Aircraft Movements The peak-hour aircraft arrivals have been estimated based on the forecast daily aircraft movements and the peak-hour ratio as shown in Table
208 Table Domestic and International Peak-hour Aircraft Arrivals Domestic International Year B737 F70, ATR 72, etc. F50/BN 158-seater 70-seater 50-seater /9-seater Total Brisbane and Cairns B x c) Annual Cargo Volume Table shows the forecast annual cargo volume. Table Annual Cargo Volume Year Domestic Cargo (t) International Cargo (t) , , , ) Runway System The existing single runway system suffices the requirement for Nadzab Airport, however its width should be widened to 45m and strength should be improved based on the design aircraft. 3) Taxiway System The existing taxiway system consisting of two stub taxiways and a parallel taxiway in principle suffices the requirements for Nadzab Airport. Its current width of 15m is sufficient to accommodate up to B737 type aircraft but needs to be widened to 23m in case it should cater for bigger aircraft than B737. The strength must be improved to cater for B737. The new terminal/apron layout plan might require an addition of a taxiway. 4) Aircraft Parking Stands a) Domestic The aircraft parking stand requirements for embarkation/disembarkation of the passengers have been estimated based on the forecast peak-hour domestic aircraft arrivals as well as assumed stand occupancy time plus allowance. The peak hour arrivals are as shown in Table For domestic operation of B737 class aircraft, a period of 60 minutes has been used as the stand occupancy time with reference to Japanese standard planning parameter as any past domestic operational record of turnaround time of B737 fixed to a passenger boarding bridge was not available. Stand occupancy time of the other types of aircraft has been assumed to 5-13
209 be 50 minutes based on the average stand occupancy time of 47 minutes of Air Niugini and Airline PNG aircraft. As the seating capacity of B737 is larger than the other types of aircraft, the stand occupancy time should also be longer. Allowance factor of 1.2 has also been applied to ensure flexibility in utilization of aircraft parking stands. The required number of aircraft parking stands has been estimated by the equation below. It should be noted that one reserved stand for B737 has been provided to serve for both domestic and international and any overnight aircraft may be accommodated by the stands for embarkation/disembarkation of the passengers. N=ΣAi x Ti x 1.2/60+S Where N: Number of parking stands required Ai: Number of peak-hour arriving aircraft movements (type-i) Ti: Aircraft stand occupancy time; 60minutes for B737/50minutes for the others S: Number of reserve stands b) International The international aircraft parking stand requirements have been estimated based of the following: One flight each to/from Brisbane by B737 and to Cairns by 70-seater aircraft would not overlap in the same hour requiring one stand for B737 only. c) Summary Table summarizes the aircraft parking stand requirements for the domestic and international operations. Table Summary Requirements of Aircraft Parking Stands Item Aircraft Description B737 (Code C) Peak-hour landings Required No. of Parking Stands 1 1 Domestic 70-seater (Code C) Peak-hour landings Required No. of Parking Stands 3 3 Others Peak-hour landings Required No. of Parking Stands
210 International B737 Required No. of Parking Stands seater Required No. of Parking Stands 1 1 Reserve B737 Required No. of Parking Stands 1 1 B Total 70-seater 4 4 Required No. of Parking Stands Others 1 2 Total 8 9 5) Required Floor Space and Major Terminal Equipment of Passenger Terminal Building a) Facility Requirements Based on the number of one-way peak hour passengers shown in Table 5.2-5, the required floor spaces of the passenger terminal building for the target years 2026 and 2031 have been estimated with reference to the planning method of the IATA Airport Development Reference Manual (IATA ADRM: 10th Edition) as well as the airport facility planning references of the Civil Aviation Bureau, Ministry of Land, Infrastructure and Transport of Japan. Tables and present the summary of facility requirements for the new passenger terminal building. IATA ADRM References are shown in Tables through
211 Table Summary Facility Requirements for New PTB (Target year 2026) Facility Passenger Processing Area Floor Space ( m2 ) Domestic International Common Total Check-in Lobby IATA ADRM Departure Lobby (1+0.82) 40/60 2.5=707 Security Inspection IATA ADRM Departure Passport Control IATA ADRM Departure Lounge IATA ADRM Concource Assumed Arrival Passport Control IATA ADRM Baggage Claim Area IATA ADRM Customs Inspection IATA ADRM Arrival Lobby IATA ADRM Departure Baggage Handling Area Assumed Arreival Baggage Handling Area Assumed Subtotal Remarks Passenger Service Area Airline Lounge Assumed VIP Room Assumed Waiting Room/Chargeable/Group Assumed Meeting room Assumed Concession Food and Beverage Assumed Selling Goods Assumed Foreign Currency Exchange Assumed Cell phone Assumed Rental Car Assumed Subtotal Offices Airline Offices Assumed CIQ Offices Assumed Office Assumed Police Office Assumed Other Offices Assumed Subtotal Mechanical/Electrical Service Mechanical Room Electrical Room Subtotal Total Toilets,Passages,Shaft,etc % of total area Overall Total
212 Table Summary Facility Requirements for New PTB (Target year 2031) Facility Passenger Processing Area Floor Space ( m2 ) Domestic International Common Total Check-in Lobby IATA ADRM Departure Lobby (1+0.82) 40/60 2.5=689 Security Inspection IATA ADRM Departure Passport Control IATA ADRM Departure Lounge IATA ADRM Concource Assumed Arrival Passport Control IATA ADRM Baggage Claim Area IATA ADRM Customs Inspection IATA ADRM Arrival Lobby IATA ADRM Departure Baggage Handling Area Assumed Arreival Baggage Handling Area Assumed Subtotal Remarks Passenger Service Area Airline Lounge Assumed VIP Room Assumed Waiting Room/Chargeable/Group Assumed Meeting room Assumed Concession Food and Beverage Assumed Selling Goods Assumed Foreign Currency Exchange Assumed Cell phone Assumed Rental Car Assumed Subtotal Offices Airline Offices Assumed CIQ Offices Assumed Office Assumed Police Office Assumed Other Offices Assumed Subtotal Mechanical/Electrical Service Mechanical Room Electrical Room Subtotal Total Toilets,Passages,Shaft,etc % of total area Overall Total
213 Table Reference on the floor area requirements for PTB international flight facilities 2026 and 2031 (IATA ADRM) IATA Airport Development Reference Manual 10th Edition PNG NADZAB INT 2026_2031 PY PMP PDP PHP PHPo PHPt Passengers per Year 10% Peak Month to Year IATA ADRM 9th Edition Table C2-2,3 0 Peak Month Passengers 4% Peak Day to Peak Month 0 Peak Day Passengers 9% Peak Hour to Peak Day Peak Hour Passengers 2/3 Offset Factor 126 Originating Peak Hour Passengers 2/3 Offset Factor 126 Terminating Peak Hour Passengers PK 65% Peak 30-minute Factor (in % of PHP) Self Service Facilities A Area Required for the Self-Service Kiosks 5 SS Total Number of Self-Service Kiosks 2 Baggage Drop Al Area Required for the Baggage Drop Facility for a lower boundary 0 Au Area Required for the Baggage Drop Facility for an upper boundary 0 BD Total Number of Baggage Drop Positions 0 Traditional Check-In (Not Recommended) A Area Required for the Check-in Desks Facility for a lower boundary 125 CD Total Number of Check-in Desks 6 Departures Requirements: Emigration A Area Required for the Departure Passport Control Facility 58 PD Total Number of Departure Passport Control Desks 3 Passenger Security Screening (Condition A) A Area Required for the Departure Security Checkpoint Facility 72 SEC Total Number of Security Lanes 2 Passenger Security Screening (Condition B) A Area Required for the Departure Security Checkpoint Facility 107 SEC Total Number of Security Lanes 3 Boarding Gates A1 Area of the Gate Lounge under an open-gate configuration, serving 220 A2 Area of the Gate Lounge under an open-gate configuration, serving 0 Arrivals Requirements: Immigration A Area Required for the Arrival Passport Control Facility 82 PC Total Number of Arrival Passport Control Desks 4 Baggage Claim BCNB Number of Narrow Body baggage claim units 1 BCWB Number of Wide Body baggage claim units 0 A Area of the baggage reclaim hall (m2) 399 Customs Processes PI Number of Primary Inspection Booths (single units) 2 XR Number of X-ray units 1 API Area Required for the Primary Inspection Booth 52 AXR Area Required for the X-ray Facility 38 Arrival Hall A Area of the Arrival Hall
214 Table Reference on the floor area requirements for PTB domestic flight facilities 2026 (IATA ADRM) IATA Airport Development Reference Manual 10th Edition PNG NADZAB DOM 2026 PY PMP PDP PHP PHPo PHPt 718,000 Passengers per Year 10% Peak Month to Year IATA ADRM 9th Edition Table C2-2,3 71,800 Peak Month Passengers 4% Peak Day to Peak Month 2,872 Peak Day Passengers 9% Peak Hour to Peak Day 290 Peak Hour Passengers 2/3 Offset Factor 193 Originating Peak Hour Passengers 2/3 Offset Factor 193 Terminating Peak Hour Passengers PK 65% Peak 30-minute Factor (in % of PHP) Self Service Facilities A Area Required for the Self-Service Kiosks 7 SS Total Number of Self-Service Kiosks 2 Baggage Drop Al Area Required for the Baggage Drop Facility for a lower boundary 0 Au Area Required for the Baggage Drop Facility for an upper boundary 0 BD Total Number of Baggage Drop Positions 0 Traditional Check-In (Not Recommended) A Area Required for the Check-in Desks Facility for a lower boundary 176 CD Total Number of Check-in Desks 8 Passenger Security Screening (Condition A) A Area Required for the Departure Security Checkpoint Facility 72 SEC Total Number of Security Lanes 2 Passenger Security Screening (Condition B) A Area Required for the Departure Security Checkpoint Facility 107 SEC Total Number of Security Lanes 3 Boarding Gates A1 Area of the Gate Lounge under an open-gate configuration, serving 297 A2 Area of the Gate Lounge under an open-gate configuration, serving 0 Baggage Claim BCNB Number of Narrow Body baggage claim units 1 BCWB Number of Wide Body baggage claim units 0 A Area of the baggage reclaim hall (m2) 278 Arrival Hall A Area of the Arrival Hall
215 Table Reference on the floor area requirements for PTB domestic flight facilities 2031 (IATA ADRM) IATA Airport Development Reference Manual 10th Edition PNG NADZAB DOM 2031 PY PMP PDP PHP PHPo PHPt 858,000 Passengers per Year 10% Peak Month to Year IATA ADRM 9th Edition Table C2-2,3 85,800 Peak Month Passengers 4% Peak Day to Peak Month 3,432 Peak Day Passengers 9% Peak Hour to Peak Day 340 Peak Hour Passengers 2/3 Offset Factor 227 Originating Peak Hour Passengers 2/3 Offset Factor 227 Terminating Peak Hour Passengers PK 65% Peak 30-minute Factor (in % of PHP) Self Service Facilities A Area Required for the Self-Service Kiosks 7 SS Total Number of Self-Service Kiosks 2 Baggage Drop Al Area Required for the Baggage Drop Facility for a lower boundary 0 Au Area Required for the Baggage Drop Facility for an upper boundary 0 BD Total Number of Baggage Drop Positions 0 Traditional Check-In (Not Recommended) A Area Required for the Check-in Desks Facility for a lower boundary 213 CD Total Number of Check-in Desks 10 Passenger Security Screening (Condition A) A Area Required for the Departure Security Checkpoint Facility 72 SEC Total Number of Security Lanes 2 Passenger Security Screening (Condition B) A Area Required for the Departure Security Checkpoint Facility 107 SEC Total Number of Security Lanes 3 Boarding Gates A1 Area of the Gate Lounge under an open-gate configuration, serving 350 A2 Area of the Gate Lounge under an open-gate configuration, serving 0 Baggage Claim BCNB Number of Narrow Body baggage claim units 1 BCWB Number of Wide Body baggage claim units 0 A Area of the baggage reclaim hall (m2) 278 Arrival Hall A Area of the Arrival Hall
216 b) Provision for Capacity Enhancement from Target Year 2026 to Target Year 2031 The size of the passenger processing area in PTB is determined mainly according to the peak-hour passenger volume. As a prerequisite of required floor area calculation, the difference in the number of peak-hour passengers affects the size of facility. The peak-hour passenger has been estimated to be 290 for domestic flights and for the international in 2026, and 340 for the domestic and for the international in Regarding the sizes of facility targeted in 2026 and 2031, the difference in the required floor area is approximately 300 m 2 in total, and occurs in the following areas; Departure Lounge, Check-in Lobby, Immigration, Arrival Lobby, and Departure Lobby. The number of check-in counters is deemed to be unchanged if its use is exclusive to each airline company. If the common use counters are adopted, eight counters will be needed for the 2026 and ten counters for 2031 respectively. The required capability of special equipment for the airport functions is as follows: <Conveyer> For the baggage handling conveyer, the departure side conveyer would differ in length according to the number of installed check-in counters, however, the length of arrival side conveyer does not need to change because the arriving largest aircraft is still the same and it would not arrive simultaneously. <Security Equipment> For the security equipment, two detectors each will be needed for the international and the domestic area, and no difference would occur due to the target years. Considering above mentioned elements, it is deemed appropriate to design the passenger terminal building itself to accommodate the demand of year 2031, because the difference in the required floor area is minimal and small amount of investment increase would reduce the complexity of future expansion while it s operating. On the other hand, as for the special equipment, it is deemed appropriate to design aiming for the year 2026 as it is relatively easy to expand according to the demand increase in the future, hence the passenger terminal as a whole should be designed to accommodate the year 2026 passenger estimation. In light of future development, provision for the future expansion of special equipment should be made regarding the following items: Extra pit for future departure baggage handling conveyer; Extra pit for future check-in counter wiring; Extra space for future CIQ counter expansion; 5-21
217 Extra space for future CUTE/FIDS system (Server space, Monitor installation preparation, etc.); and Estimation and preparation for future power demand. 6) Required Floor Space of Cargo Terminal Building Based on the forecast air cargo traffic demand as well as assumed cargo throughputs, the floor space requirements of the cargo terminal building has been estimated as shown in Table through following process: i) Based on the forecast cargo volume, cargo terminal throughputs were computed using an equation of C (t/m 2 ) = x X 0.77 ; ii) The equation was developed in experiences in Japan for cargo terminal development up to annual cargo volume 10,000 tons; iii) The computed throughput for 2026 was 7.79 t/m 2 ; iv) The required floor space (Cargo handling area) for 2026 was obtained as 770 m 2 by the cargo volume of 6,000t divided by 7.79 t/m 2. v) The computed throughput for 2031 was 8.97 t/m 2 ; vi) The required floor space (Cargo handling area) for 2031 was obtained as 804 m 2 by the cargo volume of 7,210 t divided by 8.97 t/m 2. vii) Required office area is empirically estimated as two thirds of the cargo handling area according to similar projects in Japan. Table Computation of Facility Requirement of Cargo Terminal Forecast of Cargo Demand Domestic International Annual Cargo Annual Passengers (thousand) (ton) Annual Passengers (thousand) , , , Cargo floor area calculation Formula: Unit rate between cargo quantity per floor area at handling zone. (ton/m2) Calculated unit Annual Cargo (ton) Ccargo handling zone floor area( m2 ) Office Area ( m2 ) Annual Cargo Amount (ton) 2021 C=0.0096x , C= x , C= x ,340 4,920 6,000 7,210 Total ( m2 ) Format of layout for cargo facility Amount of cargo (ton/year) Lay out concept Less than 5,000ton common occupation 5,000~10,000ton Common or separate occupation More than 10,000ton Separate occupation Unit to handle annual cargo amount. Amount to handle ( ton/year) Unit (ton/ m2 ) 1, , , , ,000~50, ~15.0 More than 50,000 More than 15.0 ( Reference data for planning airport facilities, year 2008) by the ministry of land and transportation,japan Formula ( X=ton/year ) C(ton/ m2 )=0.0096X 0.77 C(ton/ m2 )=2.201nX-8.78 by other Formula
218 7) Required Number of Lanes of Forecourt Road and Vehicle Parking Spaces in Car Park It has been proposed that the forecourt road in front of the passenger terminal building consists of three lanes as listed below: One for loading/unloading passengers; One for approach to the loading/unloading lane; and One for through traffic. With regard to the car park, number of parking spaces has been estimated as shown below: Present number of parked vehicles has been counted as 40 observed on Friday and Saturday in May 2014; The number of parking spaces would increase according to the increase of airport access vehicles (3.95% annual growth rate from 2021 to 2031, applied from 2014); Number of vehicle parking spaces in 2026 would reach 70 spaces; Number of vehicle parking spaces in 2031 would reach 80 spaces; and Size of vehicle parking space; 22m 2. 8) Administration Building At present, fifteen (15) staffs are stationed at the existing administration office, which is about 670m 2 in its total floor area, for their daily service for the operation and passenger service at Nadzab Airport. There is practically no function of monitoring the airport operations such as fire alarm, utility operations, etc. in the existing administration office. As such function is of utmost importance for efficient and safe airport operations, it has been assumed five more staff (total 20) would be stationed in a new administration building. Required work space of newly constructed office has been computed based on a generally required unit office space of 6.0m 2 per person, excluding meeting room etc. Hence required general office space is about 120m 2. In addition to the general office space, such floor space for each rooms are to be added as, 150 m 2 for five (5) private offices, 50m 2 for a meeting room, 30m 2 for a guest room, 50m 2 for General Manager s room, and about 200m 2 for utilities room such as machine room, electrical room, etc. In total, required floor area for the new administration office is about 600m 2. 9) Rescue and Fire-fighting Station The aerodrome category for rescue and fire-fighting is to be determined in principle based on the overall length and maximum fuselage width of the design aircraft as shown in Table The overall length and width of fuselage of B are; L=39.47m, W=3.76m, and the Category 7 is applicable. 5-23
219 Table AeroDrome Category for Rescue and Fire Fighting Source: ICAO Annex 14 In accordance with ICAO Annex 14, the minimum number of rescue and fire-fighting vehicles for category 7 is two. Currently, there are two fire engines at Nadzab Airport, but they are generally old and could be outdated on the opening day. It has been assumed that one unit of Fire Fighting Vehicle (FFV) equipped with a water tank of not less than 6,000 liters would be required to meet ICAO requirement. Approximate floor space requirements for the rescue and fire-fighting station have been estimated as listed below: Stand by space for fire- engine; 300m 2. Stand by space for fire- men; 100m 2. Watch room; 40m 2. Machine, utility room space; 100m 2. Total; 540m 2. 10) Required Capacity of Utilities Following utility facilities for the entire airport are required and detail discussion is made in Subsection 5.4 and Section 6. Sub-Station (Engine Generator, Transformer); Water supply (Elevated Water tank, Deep well); Sewer (Septic Tank,); and Fire-Fighting Pump House and Water Tank. 5-24
220 5.3 Evaluation of Existing Facilities Table shows basic information of Nadzab Airport and Figure shows layout of airport facilities. Table Basic Information of Airside facilities Items Description ICAO Aerodrome Reference Code 4C Aerodrome Reference Point 06 o S 146 o E Elevation 71.0 m Reference Temperature 34.0 degree Celsius Operational Hours 24 hours Runway Runway 09/27 Dimension 2,438 m x 30 m (3m asphalt shoulder on both side) Surface Asphalt concrete Strength PCN 30/F/B/X/U Longitudinal Slope 0.3 % Stopway (RWY 09) Dimension W = 30 m, L=60m Surface Asphalt concrete Stopway (RWY 27) Dimension W = 30 m, L=60m Surface Asphalt concrete Clearway (RWY 09) Dimension - Clearway (RWY 27) Dimension - Runway Strip Dimension 2,560 m x 150 m Taxiway Parallel Taxiway Width 15 m (3m asphalt shoulder on both side) (by Drawing) Surface Asphalt concrete Stub Taxiway Width 15 m (3m asphalt shoulder on both side) (by Drawing) Surface Asphalt concrete Apron Number of Aircraft 6 stands (5 for small aircraft and 1 for B737) Main Loading Apron Stands Dimension/Area 430m X 90m =38,700 m 2 (by CAD) Surface Asphalt concrete West Apron Dimension/Area 204m X 65m =13,260m 2 (by CAD) Surface Asphalt concrete North Apron Dimension/Area 300m X 50m =15,000 m 2 (by CAD) Surface Asphalt concrete Source: Aeronautical Information Publication (AIP) April 2008, Aerodrome Directory May 2011, drawing stored at Nadzab Airport, CAD drawing obtained from 5-25
221 Operation Building Fire Station Passenger Terminal Building Control Tower Carpark TWY 'K' Main Apron 420m x 85m TWY 'B' TWY 'C' OUD OUD OUD TWY 'A' TWY 'A' TWY 'A' OUD VOR/DME TWY 'A' TWY 'B' OUD OUD OUD TWY 'C' TWY 'D' EXISTING RUNWAY 2438m x 30m, STRIP WIDTH 150m Gravel Pit (Retention Pond) OUD Figure Layout of Nadzab Airport Facilities 5-26
222 5.3.1 Runway, Taxiway, Apron, Airside Storm Water Drainage and Other Facilities 1) Runway Runway 09/27 at Nadzab airport is 2,438-m long and 30-m wide with 3-m wide shoulders on both sides. The width of runway strip is 75 m on either side of the runway center line. The runway is provided following stopways: RWY 09; 30-m wide stopway (so-called overrun) RWY 27; 30-m wide stopway (so-called overrun) The runway pavement structure is of an asphalt concrete pavement constructed about 40 years ago to accommodate F28 type of aircraft. Structural overlay work (5 cm thick) was conducted in 2001 in order to accommodate larger aircraft such as Fokker 100, Bombardier Q400 etc. The assumed existing runway pavement structure is shown in Figure below. Declared strength of the runway pavement is PCN 30/F/B/X/U. Existing Runway Pavement Asphalt Surface Course t=50mm Asphalt Surface Course t=30mm Base Course t=150mm Sub-Base Course t=300mm Figure Typical Section of Existing Runway Pavement The transverse slope of the existing runway is a single cant to the south with grooving in order to accelerate drain-out of rainfall from the runway surface to prevent hydroplaning phenomenon. The runway needs to be widened and strengthened, among others, to achieve the Project target. 2) Taxiway There are a parallel taxiway and four stub taxiways at Nadzab Airport. Taxiway width is 15m with 3-m wide shoulders on both sides. Current separation distance between the runway centerline and parallel taxiway centerline is approx. 213 m, which is more than required in accordance with the ICAO standard of m for code E and 190 m for Code F. Separation distance between parallel taxiway centerline and apron taxiway centerline is approx. 181 m, which is also more than required distance 80 m for Code E and 97.5 m for Code F. The taxiway pavement is made of an asphalt concrete pavement. In 2001, asphalt overlay of 5 cm thick was conducted as a major maintenance work to accommodate larger aircraft such as Fokker 100, Bombardier Q400 etc. 5-27
223 Some of the taxiways need to be strengthened to accommodate scheduled operation of B737. 3) Apron There are three aircraft parking aprons as listed below: Main apron in front of the existing passenger terminal building; West apron; and North apron. a) Main Apron There are five (5) taxi-in taxi-out angled nose-in parking positions for small aircraft on the existing main apron in front of the passenger terminal building (PTB) and one (1) for B737 nearby the control tower. Apron flood lights are provided on the existing main apron. The size of the main apron is approx. 418 m long and 85 m depth. The existing main apron structure is asphalt concrete pavement, and typical section of the existing main apron pavement is shown in Figure The existing pavement is relatively in good condition. The existing main apron, after rehabilitation, will be able to accommodate up to F70 aircraft in future. Existing Apron Pavement Asphalt Surface Course t=50mm Asphalt Surface Course t=30mm Base Course t=150mm Sub-Base Course t=300mm Figure Typical Section of Exiting Main Apron Pavement b) West Apron The existing west apron, 204-m long and 65-m deep, is made of an asphalt concrete pavement, used by cargo transport aircraft such as C130 (transport aircraft mainly operated by charter airlines to transport construction equipment and materials). c) North Apron The existing north apron, 300-m long and 50-m deep, is located to the north of the existing PTB across the existing car park. Its pavement is made of an asphalt concrete pavement. It is currently utilized as storage yard of containers and construction machinery, etc. 5-28
 located south east side of the runway.")


224 4) Airside Storm Water Drainage Open ditches along the runway and parallel taxiway are provided at Nadzab airport. The collected rainfall flows from the west to the east, and is discharged to gravel pit (retention pond) located south east side of the runway. Pipe culverts with concrete reinforcement are provided at intersections between stub taxiway and those ditches. The surface of these open ditches is covered with weeds; in turn the collected rainfall might not be smoothly flowing downward to the gravel pit. The bed width of open ditches is from 2m to 5m and 1 to 2 slopes. According to the layout drawing given by, the existing open ditches are located within the runway strip. Within the runway strip, transverse slopes including drainage facilities should not exceed 2.5 % where the code number 3 or 4 (Nadzab Airport is 4) in accordance with ICAO annex 14, hence, the existing open ditches might be regarded as infringement of ICAO recommendation. There are two pipe culvert systems located in front of the existing passenger terminal building with several manholes collecting rainwater from the roof of existing passenger terminal and parking lots for registered vehicles. Photo of Open Ditch The collected rainwater flows to the east to existing excavated open ditch, and then the rainwater is discharged to connecting open ditch along to the parallel taxiway. At the existing car park located across the circulation road, there is pipe culvert system with drainage manholes at southern border of the car park. The collected rainwater flows to the east to the excavated existing open ditch. 5) Perimeter Road and Fence Following pictures show that existing perimeter road and fence. The existing perimeter road and fence are not properly maintained, and it should be necessary to improve the facilities. Existing Perimeter Fence 5-29
225 6) Obstacle Limitation Surfaces Runway approach category of existing Nadzab airport is Non-precision instrument approach. 2,560m x 150m of runway strip is set. In accordance with ICAO Annex 14, following obstacle limitation surfaces shall be established for Non-precision instrument approach runway. Dimension and slopes of obstacle limitation surface for aerodrome reference code of 4C is stipulated as follows. Conical surface; Inner horizontal surface; Approach surface; and Transitional surfaces Table Dimension and Slopes of Obstacle Limitation Surfaces Surface and Dimensions Non-Precision Instrument Approach Code Number 4C Conical Slope 5% Height 100m Inner Approach Height 45m Radius 4,000m Approach Length of inner edge 300m Distance from threshold 60m Divergence(each side) 15% First section Length 3,000m Slope 2% Second section Length 3,600m b Slope 2.5% Horizontal section Length 8,400m b Total length 15,000m Transitional Slope 14.3% b: Variable length Source: ICAO 5-30
 Aircraft Fuel Facility The aircraft fuel facility at Nadzab Airport is being operated by Interoil")

226 Following figure shows obstacle limitation surfaces in accordance with ICAO. Figure Obstacle Limitation Surfaces Source: Survey Team 7) Aircraft Fuel Facility The aircraft fuel facility at Nadzab Airport is being operated by Interoil Corporation in accordance with a concession contract with. According to Interoil Co., the fuel is being transported from Lae to Nadzab Airport by trailers. The storage capacity of existing tank is 137kl, although the total potential capacity of the aircraft fuel facility as a whole is 270kl equivalent to the current demand for two weeks. Aircraft Fuel Farm of Interoil Refueling to Aircraft 5-31


227 5.3.2 Terminal Facilities 1) Passenger Terminal Building Main terminal building is very much congested not only by the domestic passengers but also by jointly residing air cargo operations. It has been more than forty (40) years since the airport opening, and as a result of aging, deterioration is conspicuous everywhere in the existing building, therefore, it will not be a practical idea to adopt partial extension, renovation or improvement to the over aged structure to meet the requirement of expanded air passenger demand Photo1 Photo2 With the introduction of large aircraft such as B in the near future, number of passengers per an airline will drastically increase, and it shall result in the extreme shortage of required facilities at peak time, in size and in number etc. if accommodated in the existing passenger terminal building. Congestion causes serious problem to the service for passenger s baggage handling etc. Photo3 Photo4 Currently the passenger s baggage handling is carried out all by manual delivery, simply by hand to hand only. It is an absolute necessity to introduce partly automated baggage handling system, with the space as required for the future expansion of the terminal (Photos 5, 6). 5-32


228 Photo5 Photo6 Current floor space is not adequate to introduce international services as the additional services such as immigration and customs inspection are required. As all of the existing terminal building has defective points in protective measures against fire, the existing building has many problems to solve as a public service facility. For instance, as shown photo 7 below, alarm panel exists, but this panel is out of service due to non-availability of alarm system. Photo7 Photo8 Airline companies are facing space problem, as designated space for each of their office is not enough at all. 5-33


229 Utilities for the passenger service are all over-aged, it is strongly recommended to renovate the toilets introducing up-dated universal design to meet the standards of international airport, such as to provide nursery, handicapped units, etc. Photo9 Photo


230 2) Cargo Terminal (inside PTB) As the current air cargo is not so great in quantity, the facility in the passenger terminal building seems to be enough in capacity to handle. But at present, as seen in the photos below, the cargo working line of flow is congested with the passenger transportation space, due to the location of cargo space. Cargo service is separately and solely carried out by two airliners, Air Niugini and Airlines PNG, at both end sides of passenger terminal building. As either cargo operation has no truck-yard, therefrom using the main front of the passenger terminal causing risk to the passenger transportation. It is recommended to isolate cargo space from the passenger area to protect both services from the confrontation. Similar congestion exists at Airside as well. Departing cargo operation confronts against arriving cargo service. Photo11 Photo12 Photo13 Photo


231 3) Control Tower Deterioration appears at some parts or elements such as flaking ceiling boards in control room, peeling finish material, due to over-age. Meanwhile, serious deterioration or damage to the basic structure is not recognized, hence it is recommended to furbish finish works or parts utilizing the existing structure. Photo15 Photo16 Control tower is located nearby, and at about the central point of alongside of the runway. The positioning meets an ideal of that of air traffic control room, nevertheless, height may not be enough to view entire operation of aircraft. Visibility to the runway and taxiways as well as approaching/departing aircraft should be verified based on the topographic survey data. Wireless communication system among the other facilities is not established at all, and it will be an essence to provide with the system and infrastructure for wireless communication among such facilities as office, main terminal building, firefighting station, etc. Photo17 Photo


232 4) Rescue and Firefighting Station The height of watch room is not enough to ensure line of sight to the entire runway, and western view is entirely blocked by the wall, as a result, visibility is far less as firefighting command center. Photo19 Photo20 Front entrance of the standby area for fire-engines is not facing towards the runway. much time consumption in case of emergency. It takes Photo21 Photo22 Water tank for firefighting unit is not provided, and water pressure at the supply point to fireengine is so weak, that, it takes too much time to fill up fire engine tank. Photo23 Photo
. Due to overage the deterioration is severe and conspicuous at everywhere through the entire building.")
233 5) Administration Building At present, existing facility is sufficient in its floor space, for residing about forty (40) staffs. Yet, local office submitted to the HQ with request to increase the staffs to fifty (50). Due to overage the deterioration is severe and conspicuous at everywhere through the entire building. At many part of hall way floors, sinking spot are being appeared. There are no provisions or systems to monitor and control other facilities including the main terminal building. Photo25 6) Utilities a) Tap Water Supply Artesian water wells are the source of all tap water for Nadzab Airport. Originally there were two (2) deep wells at about 1km away from the passenger terminal. Two pumps for each had been utilized to pump-up water, but due to an accident during the course of normal maintenance, a pump dropped into the deep well, which was only 150mm in diameter, and the pump could not be lifted-up any more. Hence, only one (1) deep well has been utilized until now. At present, due to aging and direct sunbeam, control panel has not been regularly functioning, and therefore manual operation is a must now. The water tank, that has about 23m 3 in its stock capacity, is elevated about 14m in height by steel frames. It is also over-aged and has continuous water leakage. The water tank is located far from the terminal facilities and due to loss of water head, water pressure at the usage point is not enough at all. Adequate capacity of the tap water with supply pressure shall be ensured. 5-38


234 Photo26 Photo27 At present, the water for fire-fighting is being supplied from a water tank (400m 3 -capacity). The water tank receives the source water from the elevated water tank, and the water is pressurized by a pump to supply to fire-fighting facilities or utilities. As it is operated manually without connection with fire alarm system, in case of fire, maintenance crew must come to the pump room to start pressurizing the fire-fighting water. As fire-fighting water supply piping is one way, water pressure at the farthest, fire-fighting station, is very low and it takes more than an hour to store water as required. Photo28 b) Sewage Water Currently each building has own preliminary septic tank for decomposition and sedimentation, but basically relying on natural seepage into underground. c) Diesel-engine Generator House Like the other facilities, this house is also over- aged. It is observed that ventilation is not effective anymore because fresh air supply is not activated as supply grills are filled with dusts. Based on the evaluation of the existing facility as a whole, it is considered necessary that the whole facility should be relocated to immediate vicinity of the other facilities. 5-39

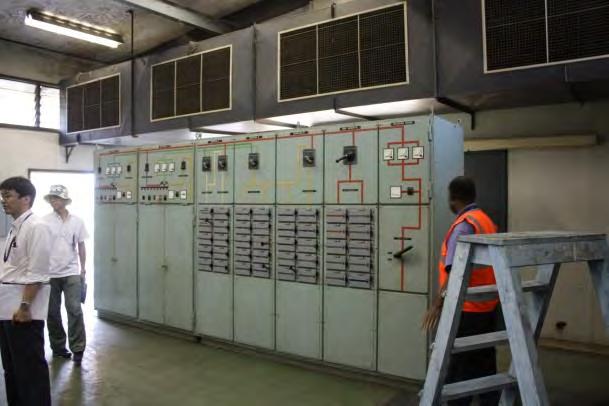
235 Photo29 Photo
236 TWY 'J' TWY 'K' APRON 420m x 85m TWY 'G' Legend Electrical Power Supply (Excavation) Electrical Power Supply (Elevated cabling) Water Supply Figure Layout of Existing Utilities 5-41
 is located across the circulation road with")


237 7) Circulation Road and Car Park There are two (2) existing car parks in front of the passenger terminal building. One, say car park-1, is located between curb side and circulation road with about 35 parking spaces for registered vehicles, and the other (car park-2) is located across the circulation road with approx. 10,000 m 2 (146-m wide and 67-m deep) areas with originally 453 parking spaces. Car park-2 is equipped with three high tall street lights; however, two of them are not functioning at the moment, and there exists no road marking, parking spaces on the pavement surface. Pavement of the car park-1 was of prime and single seal simple asphalt pavement with 25 to 30 cm thickness in total according to relevant drawing, however, the simple asphalt pavement is already lost, and base course originally beneath the asphalt sealed layer has appeared to the surface. There are so many holes and pots anywhere around the curbside road. When passenger vehicle approaches to the curbside, a cloud of sand is get floated in the curbside area. Pavement of the carpark-2 is also made of prime and single sealed simple asphalt concrete pavement with 25 cm thickness in total, however, there provides no maintenance for long time, causing severe damages of existing asphalt pavement. There are a lot of pots and holes at any location and the surface of asphalt pavement has severely damaged or already worn out their life. The circulation road and car park should be redeveloped along with the new passenger terminal building. 8) Access Road Access road consists of one lane each for both directions with approx. 3.4 m width. The typical cross section is center crown shape. The access road connects the highland highway with the Nadzab Airport, and its length is approx. 2.5 km. Most of the access road does not equip drainage facilities, and rainwater goes to the edge of the access road naturally. However, access road near the Nadzab Airport has L shaped gutter with drainage manholes. Asphalt sealing was conducted in 2012 at access road. The surface of the access road is relatively good 5-42
238 condition at this time. Centerline, edge line and street lights are also provided along the access road. The access road pavement will need to be improved and storm water drainage facilities should be provided CNS/ATM and AGL 1) CNS/ATM System Doppler VOR/DME, installed in 2011on the extended runway center line to the west of RWY 09 threshold, is the only available radio navigational aids at Nadzab Airport. In the existing control tower, VHF communication facility and a weather observation and reporting system are provided. These facility and equipment are operated and maintained by PNG Air Services Limited (PNGASL). PNGASL is implementing its Strategic Development Plan , and installation of VCS and refurbishment of HF, etc. are included in the project scope. However, PNGASL is still seeking funding for refurbishment of the control tower at Nadzab Airport. See item 2) of Subsection ) Aeronautical Ground Lighting At Nadzab Airport, basic AGL facilities are installed and operated/maintained by. Table below summarizes the existing conditions of AGL at Nadzab Airport. Although PAPI, the aeronautical beacon and CCR were relatively newly installed, majority of the runway lights procured in 1975 have already outdated and need to be replaced under the Project. Currently no taxiway edge light has been installed but there exists one set of taxiway centerline light on connection taxiway procured in Taxiway edge lights should be properly installed under the Project in order to ensure safe and efficient aircraft operations during the night and under low visibility conditions. Currently no approach light is installed at Nadzab Airport. Although the visibility conditions at Nadzab are quite good, installation of Simple Approach Lighting System (SALS) is considered preferable as one of visual guidance to the pilots just before touch down the runway. In addition to the replacement/addition of the lighting facilities, power supply cables will need to be additionally placed or renewed. 5-43
239 Table Existing Conditions of AGL at Nadzab Airport AGL Equipment No. Locations Manufacturers Years of Procurement Remarks About 300m inside from PAPI (RWY 09 side) 1 set ADB Red/White RWY 09 threshold 2010 About 300m inside from PAPI (RWY 27 side) 1 set ADB Red/White RWY 27 threshold Runway Edge Lights (Elevated Type) 1set RWY shoulders GEC Yellow/White Runway Edge Light (Inset Type) 1 set Turn pads BBT Yellow/White Runway Threshold Lights (Elevated type: RWY 09 side) 4 RWY 09 end GEC Green Runway Threshold Lights (Inset type: RWY 09 side) 6 RWY 09 end BBT Green Runway End Lights (Inset type: 09 side) 6 RWY 09 end BBT Red Runway Threshold Identification Lights 2 RWY 09 end Australia White Runway Threshold Lights RWY 27 end GEC (Elevated type: RWY 27 side) Red Runway Threshold Lights (Inset type: RWY 27 side) 6 RWY 27 end BBT Green Runway End Lights (Inset type: RWY 27 side) 6 RWY 27 end BBT Red Turn Pad Edge Lights 1 set Shoulders for turn pad GEC Blue Taxiway Center Line Lights 1 set Taxiway center line BBT Green Apron Floodlights 4 Aircraft parking apron Australia White Wind Direction Indicator Lights 3 sets Along RWY Australia White Aeronautical Beacon 1 set On top of control tower ADB 2011 Green/Yellow Current Circuit Regulator (CCR) 2 sets Electrical substation ADB Control panel for Runway Edge Lights & Taxiway Center Line 1 set Electrical substation Local Lights AGL Interface Panel 1 set Electrical substation SIEMENS AGL Control Panel 1 set Control Tower VFR room Local

240 5.3.4 Erap River Flooding Erap River, running to the west of Nadzab Airport, flows from the north to the south until merging together with Markham River to the south of the Airport. According to information provided by, Erap River changed its course due to manmade diversion by heavy floods on October 29, 2014, which created several new water channels. Erap River flowed into lower area heading toward the runway 09 (western side) but was scattered and diverted away by the existing old embankment near VOR/DME. Some part of the water flow ran onto the existing perimeter road, threatening the runway and taxiways. Fortunately the runway and taxiways and other major airport facilities did not suffer from the flooding this time but the existing embankment is old and deteriorated and should be improved to avoid risk of flooding at Nadzab Airport. It is considered imperative to improve the embankment system so that Nadzab Airport will be able to play its important role in future. Erap New Water Channel Flow Direction Old Embankment Perimeter Road DVOR/DME Runway 09 Perimeter Road Water Channel Flow Direction Photograph 1: Aerial View of Erap River flowing towards Runway (Taken on the 4 th of November, 2014) 5-45
241 Flooded Water from Erap River Existing Old Embankment Photograph 2: Flooded Water from Erap River and Existing Old Embankment 5-46
242 5.4 Optional Rehabilitation Measures of Major Project Components In order to achieve the project targets, rehabilitation of the airport facilities at Nadzab/Lae Airport should be implemented. The targets discussed in Subsection 5.1 above are: Upgrading to the Second International Airport (design aircraft: B ); Upgrading to the Second Busiest Domestic Airport (design aircraft: B ); and Upgrading to an Alternate Airport for Jacksons/Port Moresby International Airport (design aircraft: B ). Above-mentioned upgrading needs to be completed by the target opening day of 2021 with adequate capacity to accommodate the forecast airport traffic of the target year 2026 (2031 for the passenger terminal building floor space only). In achieving the targets, there could be some optional ways to rehabilitate the facilities. With regard to the ground maneuvering of diverted B for example, a minimum required system could consist of an aircraft turn pads on the runway (or taxiway turnarounds), a connection taxiway and a parking stand on the apron as the expected frequency would be very low and widening of the parallel taxiway from 15m to 23m could be regarded as overinvestment to accommodate a few B diversions a year. In addition, in order to maintain safe and efficient airport operations, appropriate measure should be taken to prevent the Erap River flooding problem. These optional measures in achieving the targets are discussed hereunder Runway 1) Runway Length a) Examination of Range-Payload for B737 and B /B /B787-8 For the purpose of verifying necessity of runway extension at Nadzab/Lae Airport, the range-payloads of candidate design aircraft available on the existing runway length has been examined based on the Boeing Airplane Characteristics for Airport Planning as well as the following assumptions: Aircraft types to be examined; B & 800, B ER, B , B Current runway length; 2438m. Elevation; 70m. Temperature; 35 degree Celsius. Longitudinal slope; 0.3% down eastward. Weight of a passenger including baggage; 100kg. To determine the basic runway length, corrections need to be undertaken using the environmental factors at Nadzab Airport based on the methodology stipulated in ICAO 5-47
243 Aerodrome Design Manual Part 1: Runways. The runway length should firstly be corrected at the rate of 7% per 300 m elevation. The runway length should also be corrected at the rate of 1% for every 1 by which the Nadzab Airport temperature exceeds the temperature in the standard atmosphere for the Nadzab Airport elevation. Standard atmosphere values are shown as follows. Altitude (m) Temperature ( ) The runway length should further be corrected at the rate of 10% for each 1 % of the runway slope. The runway length of 2438m has been corrected in terms of the elevation, temperature and longitudinal slope as shown in Table Table Correction of Runway Length Corrected RWY Factors Parameters Rate of Correction Correction Length (m) Existing ,438 a. Elevation 70m 7% per 300m ,400 b. Temperature 35 1% for every ,992 c. Slope 0.3% 10% for each 1% of the RWY slope ,934 Source: Survey Team According to the Airplane Characteristics published by Boeing, the corrected runway length of 1934m allows approximate operational take-off weights of the aircraft as follows: B ; 64,000kg. B ; 73,000kg. B ER; 155,00kg. B787-8; 191,000kg; B ; 226,000kg. The Operating Empty Weights (OEW) plus payloads of the aircraft are as shown in Table
244 Table Assumed Operating Empty Weight plus Payload OEW plus Payload (kg: Mixed Class) Aircraft Full Pax Half 80% Pax Half Full Pax only Cargo Cargo 80% Pax only B (CFM56-7B20/7B-22/-7B24) 52,553 50,448 49,993 47,888 B (CFM56-7B24/7B-26/-7B27) 59,551 57,413 56,351 54,213 B ER (CF6-80C2-B4, PW4056, etc.) 122, , , ,600 B787-8 (typical engines) 151, , , ,158 B (General Electric) 179, , , ,090 Note. Weight per passenger was assumed to be 100kg including baggage. The combinations of the operational take-off weights and the OEW plus payloads as well as the aircraft performance charts contained in the Airplane Characteristics give us the ranges available as shown in Table below. Table Result of Range-Payload Examination Range (Nautical Miles) Aircraft Full Pax and Full Pax only 80% Pax and 80% Pax only Half Cargo Half Cargo B ,500 2,000 2,100 2,600 B ,800 2,200 2,400 2,800 B ER 2,500 4,000 3,000 4,300 B ,400 4,500 3,900 5,100 B ,700 3,600 3,300 4,200 Source: Survey Team The results described above imply that the existing runway length of Nadzab/Lae Airport is in principle adequate to accommodate short to medium-haul operations of the candidate design aircraft, including between Nadzab/Lae and Cairns (710NM) as well as Brisbane (1128NM), although the runway needs to be widened and reinforced to accommodate such operations. In case of B with a payload of full passengers and half cargo, the range would cover Tokyo, Hong Kong and Singapore. However, the obstacle assessment in case of one-engine 5-49
245 failure should be carried out in close cooperation with Air Niugini in order to assess based on the operating data and specifications of the aircraft. b) Departure Procedure in Case of Engine Failure In addition to the examination of range payload requirement, Air Niugini explained that, for operation of a twin engine aircraft, taking-off with one-engine failure and returning to the airport procedure and allowable take-off weight thereof should be scrutinized. According to Air Niugini, Nadzab Airport is surrounded by high mountain ranges in all directions in nature. In case one engine failure occurs for departing aircraft, the departing aircraft shall clear from the high mountain ranges in one engine operation. For Boeing 737 type of aircraft, the existing runway length is not sufficient to take off at an optimum take-off speed in order to clear the high mountain range; in turn weight limiting operation should be adopted. If the runway is extended to 2650 m, such limitation does not need to be imposed to departing aircraft. Air Niugini concluded that the existing runway length is sufficient for the range of 1200 NM or within four hours by Boeing /800 such as Cairns and Brisbane, and the maximum payload will not be adversely affected (as per message from Air Niugini to dated 1 July 2014). Furthermore, Air Niugini mentioned that diverted aircraft such as Boeing 767 from/to Jackson s international airport can be operated with the existing runway length at Nadzab Airport. c) Conclusion In summary the runway length requirement should be examined from following three viewpoints: i) Allowable range-payload for the design aircraft; ii) Allowable take-off speed for one engine failure departure; and iii) Required runway length for diverted aircraft. The existing runway length of 2438m allows adequate payload for the short to medium haul international operations for B737 (and also B777/B787). The existing runway length also allows the take-off weight and speed of B737 which should enable no payload limitation up to the destinations within flight time of four hours. Therefore, the existing runway length is adequate to meet the target of upgrading Nadzab to the second international airport capable of accommodating B /800 with operational take-off weight to Brisbane. The existing runway length is adequate to accommodate diverted B777 and B787 from Jacksons/Port Moresby International Airport. 5-50
246 In conclusion, the runway at Nadzab/Lae Airport does not need to be extended to meet the targets of the Project. d) Possibility of Future Extension In future when commencement of any long-haul international operations is justified, the runway may need to be extended to ensure adequate range-payload of operating aircraft. The runway length requirement should be examined based on the anticipated destination and the aircraft performance data. The runway extension can be made physically within the existing airport boundary, requiring neither land acquisition nor involuntary resettlement of residents. There is no manmade structure in immediate vicinity of both runway ends. The topography around the runway is generally flat. From flood protection viewpoint, extension to the east is considered desirable. However, Nadzab Airport is surrounded by the mountain ranges. When determining the runway extension, detailed examination on the aircraft operational procedures such as one-engine failure operation should be carried out in close cooperation with operating airlines based on their aircraft performance data. 5-51
247 2) Runway Width The runway width for Code 4C and 4E airport should be 45m in accordance with ICAO Annex 14 as shown in Table , and the runway should be widened from current 30m to 45m. Table Runway Width Requirement Code Letter Code No A B C D E F 1 18 m 18 m 23 m m 23 m 30 m m 30 m 30 m 45 m m 45 m 45 m 60 m Source: ICAO Annex 14 3) Runway Pavement Strength The existing runway pavement was designed and constructed to accommodate F28 class aircraft, and therefore needs to be strengthened. As the runway needs to be kept operational while its pavement is being strengthened, structural overlay of asphalt concrete should be employed. 4) Runway Shoulders ICAO Annex 14 recommends Runway shoulders should be provided for a runway where the code letter is D or E, and the runway width is less than 60m. The runway at Nadzab will be widened from current 30m to 45m which will accommodate Code C aircraft on regular basis and Code D or Code E aircraft on occasional basis. To accommodate Code C aircraft, ICAO ANNEX 14 recommendations do not include provision of the runway shoulder. *1 ( *1 Reference: US FAA design standards for aircraft group III including B737 stipulate runway width 30m with 6-m wide shoulder on both sides.) On the other hand, if the requirement for Code D and Code E aircraft is applicable, 7.5-m shoulder on both sides of the 45-m wide runway should be provided in accordance with ICAO Annex 14 recommendation. As the frequency of Code D/E aircraft operation is very limited, provision of the shoulders to the runway has not been considered as required. With regard to the aircraft ground maneuvering, clearance/separation distance requirements applicable to Code E aircraft has been used in the facility planning as applicable, as safe ground maneuvering of B /787-8 (inclusive of B767) needs to be safeguarded even though such operation is occasional. In addition, Dash8-Q400 operated by Air Niugini is classified on ICAO code 3D, however, Air Niugini has a plan to replace Dash8-Q400 to F70, and is schedule for receiving the first F70 in February Therefore, requirement relevant to code 3D has not been taken into consideration. 5-52
248 5) Runway Turn Pad In case the parallel taxiway is not upgraded due to any reason, provision of a turn pad for B767/B777/B787 as an alternative measure should be considered to facilitate a 180-degree turn of the design aircraft at the runway ends. Figures shows required dimensions of the turn pads on 45-m wide runway for B Figure Dimension of Turn Pad for B (Runway Width of 45m) Source: Survey Team 6) Runway Occupancy Time Runway occupancy time under B operation condition has been examined. Following assumptions are considered for landing. Landing mass is set to 85% of max. design landing weight Occupancy time for B from landing to stoppage is set to 1.2 minute (72 seconds) based on examination for other airport Time for turning is set to15 seconds Taxing speed on the runway after turning is set to 30km/h (8.3m/s) 66,361 kg of maximum design landing weight for B is obtained, and therefore, landing mass is set to 56,410 kg. A landing field length for B has been illustrated following chart made by manufacturer. 5-53
249 Figure Landing Field Length for B (Source: Boeing) Necessary landing field lengths for B are summarized as follows. Dry Runway Condition 1,530m Wet Runway Condition 1,760m Correction coefficient has been obtained based on correction rate by elevation. Correction rate of the elevation should be at 7% per 300 m, and the elevation of Nadzab airport is 70m. Necessary landing field lengths after correction by the elevation are as follows. Dry Runway Condition 1,530m x = 1,560m Wet Runway Condition 1,760m x = 1,790m 5-54
250 Following figure shows that the distance between the runway threshold 09/ 27 to TW-B/ TW-C. When aircraft is landing from 09 runway side, it might be difficult to use the TW-B and TW-C directly for dry and wet runway conditions, because the TW-B and TW-C are located 1,069 m and 1,479m from the end of the runway 09 respectively. It is the same situation for runway 27 side. APRON 420m x 85m GSE park TW-A(1) TW-B TW-A(2) TW-C TW-A(3) New TW TW-A(4) TW-D SALS SALS Figure Locations of TW-B and TW-C from Runway Thresholds After touching down and safely stopped, B heads for the loading apron using stub taxiway. Considering the turning characteristics of B and 45m width of runway, B would be 180 turn somewhere on the runway not using turn pad at the end of runway. Following figure illustrates the image of 180 turn on the runway and head to the loading apron. APRON 420m x 85m GSE park TW-A(1) TW-B TW-A(2) TW-C TW-A(3) New TW TW-A(4) TW-D SALS SALS Figure Image of Aircraft Landing from Runway turn on the runway after landing Assumed runway occupancy times for landing from runway 09/27 are summarized as follows. Landing from Runway 09 DRY Condition Time until safely stop (1,560m from threshold) 72 seconds Time for turn on the runway 15 seconds Time to reach TW-C after turn 10 seconds 5-55
251 Total 97 seconds Landing from Runway 09 WET Condition Time until safely stop (1,790m from threshold) 83 seconds Time for turn on the runway 15 seconds Time to reach TW-C after turn 38 seconds Total 136 seconds Landing from Runway 27 DRY Condition Time until safely stop (1,560m from threshold) 72 seconds Time for turn on the runway 15 seconds Time to reach TW-B after turn 23 seconds Total 110 seconds Landing from Runway 27WET Condition Time until safely stop (1,790m from threshold) 83 seconds Time for turn on the runway 15 seconds Time to reach TW-B after turn 51 seconds Total 149 seconds Runway occupancy time under B operation condition has been examined. Following assumptions are considered for taking-off. Time of departure from the end of runway after turning is set to 1.3 minutes (78 seconds) based on examination for other airport Taxing speed from TW-B/TW-C to the end of runway is set to 30km/h (8.3m/s) Time for turning is set to15 seconds TW-B is used for taking-off of runway 09, and TW-C for runway 27 Taking into consideration of above prerequisites, assumed runway occupancy times for taking-off from runway 09/27 are summarized as follows and the image of taking-off aircraft are shown in below. Taking-off from Runway 09 Time from TW-B to the end of runway seconds Time for turn on Turn Pad 15 seconds Time until departure 78 seconds Total 208 seconds (3 minutes 28 seconds) 5-56
252 Taking-off from Runway 27 Time from TW-C to the end of runway seconds Time for turn on Turn Pad 15 seconds Time until departure 78 seconds Total 194 seconds (3 minutes 14 seconds) To RW 09 from TW-B Departure, after 180 turn APRON 420m x 85m GSE park TW-A(1) TW-B TW-A(3) TW-A(4) TW-A(2) TW-C New TW TW-D SALS SALS Figure Image of Aircraft Taking-off from Runway 09 7) Runway End Safety Area In accordance with ICAO Annex 14, 240-m long 90-m wide runway end safety area will be provided at both ends of the runway. 8) Stopway At both ends of the runway, 60-m long 45-m wide stopways will be provided. 5-57
253 9) Optional Runway Rehabilitation Measures Table lists runway rehabilitation measures. The runway should be widened to 45m and strengthened to accommodate B737. Occasional operations of diverted B767/B777/B787 may be accommodated after pavement strengthening to B737. Two sets of turn pad for B should be provided at both runway ends to allow 180-degree turn as widening of the parallel taxiway to 23m to accommodate occasional operation of B is not justifiable. Table Runway Rehabilitation Measures Items Measures Remarks Runway Length As is. Not required to achieve the targets. Runway Width To be widened from 30m to 45m. To be reinforced for B by Pavement Strength asphalt overlay. Runway Shoulders Not provided. Turn Pad for B To be provided. Runway End Safety To be provided. Areas and Stopways To ensure safety for Code 4C and larger aircraft. Occasional diversion of B767/B777/B787 may be accepted as overload operations. Shoulders are not required for B737. Frequency of B767/B777/B787 operations is very much limited. Widening the parallel taxiway to 23m to cater for B767/B777/B787 is considered not justifiable. 5-58
254 5.4.2 Taxiways 1) Taxiway Width Required widths of the straight portion of taxiways are as follows: For B (Code 4C, wheel base 15.6m); 15m. For B767/B777/B787; 23m. The width of existing taxiways is 15m, and widening thereof is not required to accommodate B Taxiways accommodating B767/B777/B787 should be 23-m wide. Physical Characteristics Min. Width of Taxiway Pavement Taxiway Pavement and Shoulder Table Taxiway Width Requirement Code Letter A B C D E F 7.5 m 10.5 m 18 m a 15 m b 23 m 18 m 23 m 25 m m 38 m 44 m 60 m a: Taxiway intended to be used by aircraft with a wheel base equal to or greater than 18 m. b: Taxiway intended to be used by aircraft with a wheel base less than 18 m. 2) Taxiway Fillet The existing taxiway fillets (curved portions) have been tested as to whether their dimensions are appropriate to accommodate B The minimum clearance distance of outer main wheel to taxiway edge is shown in Table below. Table Minimum Clearance Distance of Outer Main Wheel to Taxiway Edge Code A B C D E F Min. clearance distance of outer main wheel to taxiway edge 1.5m 2.25m 4.5m a a: Taxiway intended to be used by aircraft with a wheel base equal to or greater than 18 m. b: Taxiway intended to be used by aircraft with a wheel base less than 18 m. Source: ICAO Annex 14 3m b 4.5m 4.5m 4.5m It has been confirmed that the existing taxiway fillet is able to accommodate Boeing without further widening for the end stub taxiways A and D, stub taxiways B and C. In case the parallel taxiway needs to accommodate B , the fillets should be widened accordingly. 5-59
255 R41.5 R38.1 0,0,0 Figure Examination of Taxiways B and C Fillet for Boeing based on Existing Fillet Dimension 3) Taxiway Pavement Strengthening and Rehabilitation The existing taxiway pavement was constructed to accommodate F28 class aircraft. The pavement of taxiways which will accommodate B737 needs to be strengthened by structural overlay of asphalt concrete. For taxiways accommodating F100 and lighter aircraft also in future, the pavement does not need to be structurally strengthened. However such taxiway pavement needs to be rehabilitated as the previous overlay was conducted in 2001 while the design life of asphalt pavement is normally 10 to 20 years and the opening day is expected to be 2021 (20 years after the previous overlay). 4) Taxiway Shoulder Provision of the treated surface shoulders (5-m wide) where taxiway width remains 15m is recommended, while shoulders will not be provided to the taxiways to be widened to 23m as the B767/B777/B787 engines remain above the taxiway pavement and veering off the taxiways of diverted B767/B777/B787 is considered unlikely. 5-60
256 5) Optional Taxiway Rehabilitation Measures Figure shows the locations of Taxiways and Table lists optional taxiway rehabilitation measures. Widening to 23m and pavement reinforcement of the stub taxiway B connecting the runway and the parallel taxiway A, a part of the parallel taxiway A (A2) as well as the taxiway C to accommodate B767/B777/B787 is the minimum requirement to achieve the Project targets. It is considered desirable to provide two entry/exit taxiways for B737 parked on the new apron. Therefore construction of a new taxiway next to the existing taxiway C is recommended. A part of the existing parallel taxiway between taxiway C and the new one should also be widened and strengthened. For the other part of the parallel taxiway A and taxiway D (excluding the widened portion), a minimum asphalt overlay is at least required for rehabilitation purpose while reinforcement of the entire parallel taxiway A and D for B is considered preferable for safe and efficient aircraft operations. Widening of the parallel taxiway to 23m to cater for diverted B767/B777/B787 is considered overinvestment. Treated surface shoulders (5-m wide) should be provided to 15-m wide taxiways while no shoulder would be required for 23-m wide taxiways. GSE park TW-A(1) TW-B TW-A(2) TW-C TW-A(3) New TW TW-A(4) TW-D Figure Locations of Taxiways 5-61
257 i) Stub TWY C Table Taxiway Rehabilitation Measures Items Measures Remarks Width To be widened from 15m to 23m. Pavement Strength To be reinforced for B ii) Stub TWY B from RWY to P-TWY A Width To be widened to 23m. Pavement Strength To be reinforced for B iii) Rest of Stub TWY B Width As is. To be rehabilitated by asphalt Pavement Strength overlay. Provision of new taxiway between iv) New Stub TWY for the new apron and the parallel New Apron taxiway. v) Part of P-TWY between TWY B and New Stub TWY Width To be widened to 23m. Minimum required achieving the targets to accommodate scheduled B737 operations and to be an international alternate airport. Ditto. Occasional diversion of B767/B777/B787 may be accepted as overload operations. Minimum required achieving the targets to accommodate scheduled B737 operations and to be an international alternate airport. Ditto. Occasional diversion of B767/B777/B787 may be accepted as overload operations. For smooth taxiing of B767/B777/B787. Minimum required achieving the targets to accommodate scheduled B737 operations and to be an international alternate airport. Pavement Strength To be reinforced for B Ditto. Occasional diversion of B767/B777/B787 may be accepted as overload operations. vi) Rest of P-TWY A & TWY D Width As is. Occasional diversion of B767/B777/B787 may be accommodated by the runway turn pads and 5-62
258 Items Measures Remarks Pavement Strength To be rehabilitated by asphalt overlay (Option 1) or to be reinforced for B (Option 2). widened stub taxiway C. Construction of 5-m wide shoulders (treated surface) along 15-m wide vii) TWY Shoulders taxiways has been proposed. No shoulder has been proposed for 23-m wide taxiway. Note. TWY: Taxiway, P-TWY: Parallel Taxiway, RWY: Runway 5-63
259 5.4.3 Aircraft Parking Apron Future aircraft parking stand requirements are as follows: B737; 3 Propeller; 6 Total; 9 1) Existing Apron Currently there are six aircraft parking stands consisting of one for B737 and the others for up to Dash 8. The size of existing apron is 418 m in width and 85 m in depth. Aircraft to be parked on the existing apron enter and leave the aircraft stands by its own power. Angled nose-in parking configuration has been adopted. Meanwhile Japanese Civil Aviation Bureau s (JCAB) design manual stipulates that space requirement for self-maneuver of propeller aircraft is 55 m in width and 70 m in depth, when parked in angled nose-out parking configuration. As six (6) parking stands for 70-seater and smaller propeller aircraft are required from demand forecast analysis and above required width, the existing apron width required for handling propeller aircraft is 330 m (6 times 55-m width), and the rest of the existing apron space may be utilized by B737 type of aircraft. The existing apron for six 70-seater aircraft parking stands (330-m wide) should be rehabilitated by single layer asphalt overlay. The other part of the existing apron (418m-330m=88m) may be utilized as parking stands for B737. 2) New Apron Space requirement for the new apron has been examined. As partial one-and-half story passenger terminal building was chosen, B and diverted B767/B777/B787 would follow taxi-in/push out parking method. As required width of taxi-in/push out stand for B is 40.5m, a total width of 121.5m (40.5m per each, 3 stands in total) is required, of which 88m is of the existing apron after pavement strengthening and 33.5m is of new cement concrete apron. In order to allow simultaneous operation of B on the apron and B on the taxiway and vice versa, apron depth of m is required. 5-64
260 nose-in push-out mx6 spot GSE park Three B737 parking configuration New TW mx6 spot GSE park New TW R Taxiing-in of B777 while one B737 parked on apron nose-in push-out mx6 spot GSE park Taxiing of B737 while B777 parked on apron 5.00 New TW R Figure Aircraft Parking/Taxiing Configuration on New Apron TW-A(3) TW-A(2)
261 3) Optional Aircraft Parking Apron Rehabilitation/Development Measures Table Apron Development/Rehabilitation Measures Items Measures Remarks i) Existing Apron Dimension Pavement Strength ii) New Apron Dimension Pavement Strength Apron Edge Taxiway Shoulder Existing width (418m) to be divided to those for propeller-driven aircraft (width: 330m, depth: 85m) and for B737 (width: 88m, depth to be increased to 101.5m). For propeller-driven aircraft part: Asphalt overlay for rehabilitation purpose. For B737 part: Strengthening to B by asphalt overlay Number of parking stands (taxi-in/ push-out ): 3 Width; 33.5m. Depth; 101.5m. Optional but recommendable. Design strength to accommodate B recommendable. Not provided. One of three stands is for reserve. As future frequency of B777 operations is not high, the difference between B737/B777 would be not significant. Risk of veering off the apron pavement is low Aeronautical Ground Lights (AGL) 1) Precision Approach Path Indicators (PAPI) The existing two sets of PAPI, renewed in 2010, are in good condition and its replacement is not required under the Project. However, installation of electric power cable has been included in the project scope. 2) Simple Approach Lighting System (SALS) In order to provide visual guidance to aircraft pilots during the approaches to the runway, installation of Simple Approach Lighting System (SALS) is considered recommendable. RWY 09 approaches account for approximately 70% of the total approaches while RWY 27 approaches are carried out during early morning time when foggy conditions are often occur. Installation of SALS to RWY 09 and RWY 27 is considered preferable. 5-66
262 3) Runway Edge Lights/Threshold Lights/End Lights/Identification Lights/Turn Pad Lights/Taxiway Lights and Apron Flood Lights These lighting facilities are outdated and the electric power cables do not meet the minimum insulation resistance of requirement of 2M ohm, requiring complete replacement. However, the runway end identification lights are not required to be replaced as they have not been utilized for more than tens of years since they had broken down and no commercial/housing development exists near Nadzab Airport. 4) Aerodrome Beacon Aerodrome beacon installed on the top of control tower was renewed in 2011 and is still in good condition. Replacement thereof is not required. 5) Current Circuit Regulator (CCR) CCR for PAPI was installed in 2010 and still in good condition. However CCR will be transferred to a new power supply substation and the costs of transfer and additional cabling are required. 6) Monitor and Control System AGL interface panel connecting CCR for PAPI and AGL monitor control panel as well as AGL control panel installed in the VFR room of control tower, installed in 2010, are still in good conditions. On the other hand, monitor and control system panels for the other AGL installed about 40 years ago are operating normally but no more spare parts are available and replacement under the project is required. 5-67
 story building without passenger boarding bridge.")
263 5.4.5 Passenger Terminal Building With regard to the passenger terminal development, there could be a choice of single-story concept without passenger boarding bridge (PBB) or one-and-half concept with PBB. The existing passenger terminal of Nadzab Airport is one (1) story building without passenger boarding bridge. Majority of the airlines at Nadzab are operating relatively small propeller-driven aircraft, and the passengers walk between the aircraft parked on the apron and the terminal gates. This situation will still continue even when the new passenger terminal building is developed and B /800 starts scheduled operations at Nadzab by Air Niugini. Photo 31 Photo 32 Meetings with and Air Niugini were held and Study Team explained that, although one-and-half story concept offers convenient passenger handling for B737, it is more costly for both and operating airlines and requested their opinion on choice of the terminal concept. As a result, it has been confirmed that both and Air Niugini preferred the one-and-half story concept. About 80 % of the aircraft operations and 60 % of the domestic passengers at Nadzab in 2031 will be accommodated by 70-seater and smaller class aircraft. About 40 % of the domestic passengers will be accommodated by B737. In case the one-and-half concept is employed and security check and departure lounge, etc. are only provided on the second level due to economical reason, majority of the passengers will need to climb up to the second level after check-in to wait for their boarding time and come down to the first level to walk to the aircraft, inconvenient procedure for them. From passenger service viewpoint, the single-story passenger terminal concept is likely to suit the anticipated operational environment over the planning horizon up to Therefore, single-story concept has been chosen in principle. Additionally for the sake of B737 passenger convenience, it has been proposed that limited passenger handling facilities such as passport control, departure lounge for both domestic and international passengers, arrival concourse and one unit of passenger boarding bridge are to be provided on the second level. 5-68
264 5.4.6 Cargo Terminal Building Taking advantage of the current cargo facilities being located at side of the passenger terminal and the closest space to apron, it will be the most beneficial plan to renovate the current passenger terminal for the purpose of cargo service, as soon as the new passenger terminal building is in service. At present, amount of belly cargo by airliner at Nadzab Airport more or less 2,000t per year. According to the Air Traffic Demand Forecast, the annual domestic and international air cargo volume will increase to 5,800t in 2026 and 6,900t in 2031 respectively. Extracting from the accumulated performance data in the past, general cargo throughput of a cargo terminal is about 10t/m 2. Thus requirement of the size of new cargo building in the year 2026 and 2031 will be about 600m 2 and 800m 2 in floor space respectively. Should the existing passenger terminal is renovated and switched to be the new cargo terminal building, then the floor space of about 2,500m 2 shall be available for handling of air cargo. As the location is along the existing apron, so that it will make good efficiency in surface transportation of air cargo Control Tower At some part of the existing control tower which is more than forty (40) years old, deterioration of the construction materials is conspicuous. Nevertheless, the concrete structure and structural steel of the tower, in general, do not expose any damage or corrosion in its entirety and the existing tower structure may be utilized in future with renovation and remodeling using new finish material and equipment. However, it is considered necessary to evaluate the structural soundness of the tower during the detail design stage taking into account of the risk of earthquake and provide reinforcement measures if necessary. The location of the existing tower is at about the center of longitudinal position along runway, and being the best position in visibility for the air traffic control. The line of sight from the existing control tower has been examined as described below. The sight lines to the new apron and the edge of runway is assured even with the new PTB and other new buildings as shown in the following check drawing. When aircraft approaches the runway, controller at the control tower needs to monitor and gives an order to the aircraft. Two story of new passenger terminal building would construct in line of the existing control tower and its highest height of the roof point will reach at 94.5 MSL. Meanwhile control tower s view eye level is approx MSL, about 5.3 m lower than the highest roof point of new passenger terminal building. Due to the location of the control tower, it is noted that controller at the control tower could be visible of straight-in approaching aircraft, therefore, sight check, whether controller could be visible of circle approaching aircraft, has been conducted using example of circle approaching route for local airport in Japan and shown in the following drawing (Figure ). As a result, controller at the control tower could be visible of 5-69
265 circle approaching aircraft. Figure Sight line check 5-70
266 Figure Sight check for Circle Approaching Aircraft 5-71
267 5.4.8 Rescue and Fire-fighting Station and Fire Fighting Vehicle Present location of the rescue and fire-fighting station does not provide the visibility of entire runway, taxiway and the main terminal facilities. Furthermore, the emergency communication system is not functioning at all. Therefore it is recommended to newly construct a rescue and fire-fighting station at the east side of the existing location. Procurement of one unit of a Fire Fighting Vehicle will be required. 5-72
268 5.4.9 Administration Building Entire relocation of the administration office is strongly suggested. It is because of age of the existing building, it requires a lot of renovation and remodeling as many, and much area or part, need repair or replacement, resulting un-economical budget. As the existing administration building appears excessively over aged, as deterioration on surface is severely observed, and the structure might be over-due as the floor is, at some part, sinking. The new administration building shall become the core facility of overall control system which covers entire airport facilities in regards to operations as such, as fire prevention, alarm system, public announcement and rescue operation, and in regard to the maintenance for the all airport facilities, systems and the equipment as well. Provision of the new administration facility and function inside the new passenger terminal building could be an option as the required floor spaces are combined and be economical. However, such provision could restrict flexibility for future terminal expansion and not preferable and hence not adopted Utilities Following utilities need to be provided with sufficient capacities, according to the selected scope of the facility rehabilitation and development and therefore not be regarded as optional: Potable water supply system; Sewage treatment system; Power supply system; and Gas supply system Aircraft Fuel Facilities Based on the forecast daily and weekly aircraft movements for 2026 and 2031 at Nadzab Airport as well as Airport Facility Planning Manual prepared by Ministry of Land, Infrastructure, Transport and Tourism of Japan, future consumptions of aircraft fuel and required tank capacity has been estimated. Following assumptions were employed: Route distance from Nadzab Airport for the domestic destinations; 500km. Route distance from Nadzab Airport to Brisbane; 2,500km. Route distance from Nadzab Airport to Cairns; 1,200km. Computation of the fuel consumption for; B737 class aircraft Y=0.0041X+0.75 Propeller driven aircraft Y=0.0010X
269 Where Y is fuel consumption (kl) and X is route distance (km). Required tank capacity to be equivalent to the estimated fuel consumption for two weeks. Table Estimated Aircraft Fuel Consumption and Storage Capacity (2026) Approximate Distance Fuel Consumtion per Departure 2026 Destination Aircraft (km) (kl) Daily Departures Weekly Departures Weekly Fuel Consumption (kl) Required Fuel Tank Capacity for Two Weeks (kl) B Domestic All Prop Total Brisbane B International Cairns Prop Total Total Table Estimated Aircraft Fuel Consumption and Storage Capacity (2031) Approximate Distance Fuel Consumtion per Departure 2031 Destination Aircraft (km) (kl) Daily Departures Weekly Departures Weekly Fuel Consumption (kl) Required Fuel Tank Capacity for Two Weeks (kl) B Domestic All Prop Total Brisbane B International Cairns Prop Total Total

270 Erap River Flood Protection Measures to prevent the airport facilities from flooding of Erap River are considered imperative to maintain Nadzab Airport fully operational and to be included in the scope of the Project. Figure shows proposed phased embankment improvement/extension plan for flood prevention. Improvement of the existing embankment (1 st phase; 1,300m) and extension of new embankment to both sides (2 nd phase-a; 1,140m and 2 nd phase-b; 260m) have been proposed to be included in the scope of the Project. Figure : Example Phasing of Embankment Improvement Mapping by Study Team on satellite photograph obtained from the Google Earth 5-75
Sunshine Coast Airport Master Plan September 2007
 Sunshine Coast Airport Master Plan September 2007 Contents CONTENTS... I ACKNOWLEDGEMENT... II DISCLAIMER... III 1 EXECUTIVE SUMMARY...IV 1 INTRODUCTION... 1 2 AVIATION DEMAND FORECAST... 5 3 AIRCRAFT
Basic Policies on Operation of National Airports Utilizing Skills of the Private Sector
 (TRANSLATION)(for Reference Only) Basic Policies on Operation of National Airports Utilizing Skills of the Private Sector I. The Purpose and Objectives in Operating etc. National Airports etc. by Utilizing
Chapter Seven COST ESTIMATES AND FUNDING A. GENERAL
 Chapter Seven COST ESTIMATES AND FUNDING A. GENERAL This chapter delineates the recommended 2005 2024 Sussex County Airport Capital Improvement Program (CIP). It further identifies probable construction
Presentation to the British Irish Airport s EXPO John Heffernan Chief Development Officer, Dublin Airport
 Presentation to the British Irish Airport s EXPO John Heffernan Chief Development Officer, Dublin Airport 1 DUBLIN-LONDON 28.4 No.1 +2,200 MILLION PASSENGERS BUSIEST ROUTE IN EUROPE &No. 2 IN THE WORLD
Ex-Ante Evaluation Southeast Asia Division 5 Southeast Asia and Pacific Department, JICA 1. Name of the Project
 Ex-Ante Evaluation Southeast Asia Division 5 Southeast Asia and Pacific Department, JICA 1. Name of the Project Country: Republic of the Philippines Project: New Bohol Airport Construction and Sustainable
SECTOR ASSESSMENT (SUMMARY): TRANSPORT
: TRANSPORT") Country Partnership Strategy: Papua New Guinea, 2016 2020 SECTOR ASSESSMENT (SUMMARY): TRANSPORT Sector Road Map 1. Sector Performance, Problems, and Opportunities 1. Inadequate provision of transport
Country Partnership Strategy: Papua New Guinea, 2016 2020 SECTOR ASSESSMENT (SUMMARY): TRANSPORT Sector Road Map 1. Sector Performance, Problems, and Opportunities 1. Inadequate provision of transport
STUDY OVERVIEW MASTER PLAN GOALS AND OBJECTIVES
 INTRODUCTION An Airport Master Plan provides an evalua on of the airport s avia on demand and an overview of the systema c airport development that will best meet those demands. The Master Plan establishes
Terms of Reference: Introduction
 Terms of Reference: Assessment of airport-airline engagement on the appropriate scope, design and cost of new runway capacity; and Support in analysing technical responses to the Government s draft NPS
Ex-Ante Evaluation (for Japanese ODA Loan)
") Ex-Ante Evaluation (for Japanese ODA Loan) 1. Name of the Project Country: The People s Republic of Bangladesh Project: Hazrat Shahjalal International Airport Expansion Project (I) Loan Agreement: June
Ex-Ante Evaluation (for Japanese ODA Loan) 1. Name of the Project Country: The People s Republic of Bangladesh Project: Hazrat Shahjalal International Airport Expansion Project (I) Loan Agreement: June
Finance and Implementation
 5 Finance and Implementation IMPLEMENTATION The previous chapters have presented discussions and plans for development of the airfield, terminal, and building areas at Sonoma County Airport. This chapter
Table of Contents. Overview Objectives Key Issues Process...1-3
 Table of Contents Chapter One Introduction Overview...1-1 Objectives...1-1 Key Issues...1-2 Process...1-3 Chapter Two Inventory of Existing Conditions Airport Setting...2-1 Locale...2-1 Airport Surroundings...2-5
TABLE OF CONTENTS. Washington Aviation System Plan Update July 2017 i
 TABLE OF CONTENTS Chapter 1 Overview... 1-1 1.1 Background... 1-1 1.2 Overview of 2015 WASP... 1-1 1.2.1 Aviation System Performance... 1-2 1.3 Prior WSDOT Aviation Planning Studies... 1-3 1.3.1 2009 Long-Term
Air Operator Certification
 Civil Aviation Rules Part 119, Amendment 15 Docket 8/CAR/1 Contents Rule objective... 4 Extent of consultation Safety Management project... 4 Summary of submissions... 5 Extent of consultation Maintenance
Completion Report. Papua New Guinea: Civil Aviation Development Investment Program (Tranche 1)
") Completion Report Project Number: 43141-023 Loan Numbers: 2588, 2589, and 2590 September 2016 Papua New Guinea: Civil Aviation Development Investment Program (Tranche 1) This document is being disclosed
Completion Report Project Number: 43141-023 Loan Numbers: 2588, 2589, and 2590 September 2016 Papua New Guinea: Civil Aviation Development Investment Program (Tranche 1) This document is being disclosed
Guidance for Complexity and Density Considerations - in the New Zealand Flight Information Region (NZZC FIR)
") Guidance for Complexity and Density Considerations - in the New Zealand Flight Information Region (NZZC FIR) Version 1.0 Director NSS 14 February 2018 Guidance for Complexity and Density Considerations
Guidance for Complexity and Density Considerations - in the New Zealand Flight Information Region (NZZC FIR) Version 1.0 Director NSS 14 February 2018 Guidance for Complexity and Density Considerations
CHAPTER 1 EXECUTIVE SUMMARY
 CHAPTER 1 EXECUTIVE SUMMARY 1 1 EXECUTIVE SUMMARY INTRODUCTION William R. Fairchild International Airport (CLM) is located approximately three miles west of the city of Port Angeles, Washington. The airport
Procedures for Air Navigation Services Aerodromes (PANS-AGA) ICAO Doc. 9981
 ICAO Doc. 9981") Procedures for Air Navigation Services Aerodromes (PANS-AGA) ICAO Doc. 9981 Introduction The First Edition of Doc. 9981 was approved by the President of the Council on 20 October 2014 The document becomes
Procedures for Air Navigation Services Aerodromes (PANS-AGA) ICAO Doc. 9981 Introduction The First Edition of Doc. 9981 was approved by the President of the Council on 20 October 2014 The document becomes
Papua New Guinea International Visitor Survey. January December 2017 Simon Milne
 Papua New Guinea International Visitor Survey January December 2017 Simon Milne Papua New Guinea Tourism Project Project Objectives Introduction 2 Objective 1: Grow tourism arrivals to PNG by working with
ACI EUROPE POSITION. A level playing field for European airports the need for revised guidelines on State Aid
 ACI EUROPE POSITION A level playing field for European airports the need for revised guidelines on State Aid 16 June 2010 1. INTRODUCTION Airports play a vital role in the European economy. They ensure
INTERNATIONAL VISITOR SURVEY PAPUA NEW GUINEA
 INTERNATIONAL VISITOR SURVEY PAPUA NEW GUINEA PAPUA NEW GUINEA TOURISM PROJECT PROJECT OBJECTIVES Objective 1 Objective 2 Objective 3 Grow tourism arrivals to PNG by working with government and private
REPORT 2014/065 INTERNAL AUDIT DIVISION. Audit of air operations in the United. Nations Assistance Mission in Afghanistan
 INTERNAL AUDIT DIVISION REPORT 2014/065 Audit of air operations in the United Nations Assistance Mission in Afghanistan Overall results relating to the effective management of air operations in the United
NATIONAL AIRSPACE POLICY OF NEW ZEALAND
 NATIONAL AIRSPACE POLICY OF NEW ZEALAND APRIL 2012 FOREWORD TO NATIONAL AIRSPACE POLICY STATEMENT When the government issued Connecting New Zealand, its policy direction for transport in August 2011, one
WORKING TOGETHER TO ENHANCE AIRPORT OPERATIONAL SAFETY. Ermenando Silva APEX, in Safety Manager ACI, World
 WORKING TOGETHER TO ENHANCE AIRPORT OPERATIONAL SAFETY Ermenando Silva APEX, in Safety Manager ACI, World Aerodrome Manual The aim and objectives of the aerodrome manual and how it is to be used by operating
Memorandum of Understanding
 Memorandum of Understanding In Accordance with Section V of the U.S./Canada Bilateral Aviation Safety Agreement Implementation Procedures for Design Approval, Production Activities, Export Airworthiness
Executive Summary. MASTER PLAN UPDATE Fort Collins-Loveland Municipal Airport
 Executive Summary MASTER PLAN UPDATE Fort Collins-Loveland Municipal Airport As a general aviation and commercial service airport, Fort Collins- Loveland Municipal Airport serves as an important niche
TABLE OF CONTENTS. General Study Objectives Public Involvement Issues to Be Resolved
 TABLE OF CONTENTS Description Page Number LIST OF ACRONYMS... a CHAPTER ONE INTRODUCTION General... 1-1 Study Objectives... 1-1 Public Involvement... 1-2 Issues to Be Resolved... 1-2 CHAPTER TWO EXISTING
Airport Master Plan Update
 Duttchessss Countty Airrporrtt Masstterr Plan Updatte Airport Master Plan Update Final Report Dutchess County Airport Town of Wappingers, New York C&S Engineers, Inc. 499 Col. Eileen Collins Blvd. Syracuse,
Preparatory Course in Business (RMIT) SIM Global Education. Bachelor of Applied Science (Aviation) (Top-Up) RMIT University, Australia
 SIM Global Education. Bachelor of Applied Science (Aviation) (Top-Up) RMIT University, Australia") Preparatory Course in Business (RMIT) SIM Global Education Bachelor of Applied Science (Aviation) (Top-Up) RMIT University, Australia Brief Outline of Modules (Updated 18 September 2018) BUS005 MANAGING
Preparatory Course in Business (RMIT) SIM Global Education Bachelor of Applied Science (Aviation) (Top-Up) RMIT University, Australia Brief Outline of Modules (Updated 18 September 2018) BUS005 MANAGING
Airport forecasting is used in master planning to guide future development of the Airport.
 Airport Forecasts Airport forecasting is used in master planning to guide future development of the Airport. 4.1 INTRODUCTION Airport forecasting ensures development is appropriate for passengers, ground
A Master Plan is one of the most important documents that can be prepared by an Airport.
 The Master Plan A Master Plan is one of the most important documents that can be prepared by an Airport. A Master Plan is a visionary and a strategic document detailing planning initiatives for the Airport
Papua New Guinea International Visitor Survey. January December 2017 Simon Milne
 Papua New Guinea International Visitor Survey January December 2017 Simon Milne Summary of the Key Findings Total Direct Economic Impact for Jan-Dec 2017 Figures exclude employment and cruise visitors
SECTOR ASSESSMENT (SUMMARY): Transport, and Information and Communication Technology - Air Transport 1
: Transport, and Information and Communication Technology - Air Transport 1") Air Transport Connectivity Enhancement Project (RRP BHU 44239-013) SECTOR ASSESSMENT (SUMMARY): Transport, and Information and Communication Technology - Air Transport 1 Sector Road Map 1. Sector Performance,
Air Transport Connectivity Enhancement Project (RRP BHU 44239-013) SECTOR ASSESSMENT (SUMMARY): Transport, and Information and Communication Technology - Air Transport 1 Sector Road Map 1. Sector Performance,
Agenda: SASP SAC Meeting 3
 Agenda: SASP SAC Meeting 3 Date: 04/12/18 Public Involvement Plan Update Defining the System Recommended Classifications Discussion Break Review current system Outreach what we heard Proposed changes Classification
RUNWAY SAFETY GO-TEAM METHODOLOGY
 RUNWAY SAFETY GO-TEAM METHODOLOGY INTRODUCTION The ICAO Runway Safety Programme (RSP) promotes the establishment of Runway Safety Teams (RSTs) at airports as an effective means to reduce runway related
DRAFT FINAL REPORT AIRPORT MASTER PLAN. Rifle Garfield County Airport Revised May 15, 2014
 DRAFT FINAL REPORT AIRPORT MASTER PLAN Rifle Garfield County Airport Revised May 15, 2014 As required by Paragraph 425.B(4) of FAA Order 5100.38C, Airport Improvement Program (AIP) Handbook: The preparation
KINGSTON HARBOUR IN THE YEAR SEMINAR SPONSORED BY NEPA 2003 November 06
 KINGSTON HARBOUR IN THE YEAR 2025 SEMINAR SPONSORED BY NEPA 2003 November 06 NORMAN MANLEY INTERNATIONAL AIRPORT (NMIA) RUNWAY EXPANSION URGENTLY REQUIRED AT NMIA NMIA Brief History Previously named Palisadoes
The implementation of this Master Plan will be undertaken in logical stages to meet passenger and workforce demands.
 The implementation of this Master Plan will be undertaken in logical stages to meet passenger and workforce demands. Connecting People Building Opportunities 198 Brisbane Airport Corporation CHAPTER 10
CHAPTER 3 ALTERNATIVES CONSIDERED
 CHAPTER 3 ALTERNATIVES CONSIDERED 3.0 ALTERNATIVES The 2010 Stevensville Airport Master Plan contained five (5) airside development options designed to meet projected demands. Each of the options from
1.0 Project Background Mission Statement and Goals Objectives of this Sustainable Master Plan
 TABLE OF CONTENTS CHAPTER 1 INTRODUCTION 10 Project Background 1-1 11 Mission Statement and Goals 1-1 12 Objectives of this Sustainable Master Plan 1-2 CHAPTER 2 INVENTORY 20 Airport Background 2-1 201
MONTEREY REGIONAL AIRPORT MASTER PLAN TOPICAL QUESTIONS FROM THE PLANNING ADVISORY COMMITTEE AND TOPICAL RESPONSES
 MONTEREY REGIONAL AIRPORT MASTER PLAN TOPICAL QUESTIONS FROM THE PLANNING ADVISORY COMMITTEE AND TOPICAL RESPONSES Recurring topics emerged in some of the comments and questions raised by members of the
Andres Lainoja Eesti Lennuakadeemia
 Andres Lainoja Eesti Lennuakadeemia In the beginning was the Word... Convention on International Civil Aviation (Doc 7300) was signed on 7 December 1944 International Civil Aviation Organization began
FINAL REPORT OF THE USOAP CMA AUDIT OF THE CIVIL AVIATION SYSTEM OF THE KINGDOM OF NORWAY
 ICAO UNIVERSAL SAFETY OVERSIGHT AUDIT PROGRAMME (USOAP) Continuous Monitoring Approach (CMA) FINAL REPORT OF THE USOAP CMA AUDIT OF THE CIVIL AVIATION SYSTEM OF THE KINGDOM OF NORWAY (16 to 20 November
EXHIBIT K TERMINAL PROJECT PROCEDURES PHASE I - DEVELOPMENT OF TERMINAL PROGRAM & ALTERNATIVES
 EXHIBIT K TERMINAL PROJECT PROCEDURES PHASE I - DEVELOPMENT OF TERMINAL PROGRAM & ALTERNATIVES Over the term of the Master Amendment to the Airline Use and Lease Agreement, the Kansas City Aviation Department
AFI Plan Aerodromes Certification Project Workshop for ESAF Region (Nairobi, Kenya, August 2016)
") AFI Plan Aerodromes Certification Project Workshop for ESAF Region (Nairobi, Kenya, 23-26 August 2016) Aerodromes Certification- ICAO Requirements Arthemon Ndikumana RO/AGA, Nairobi 08/09/2016 AFI Plan
AFI Plan Aerodromes Certification Project Workshop for ESAF Region (Nairobi, Kenya, 23-26 August 2016) Aerodromes Certification- ICAO Requirements Arthemon Ndikumana RO/AGA, Nairobi 08/09/2016 AFI Plan
AERODROME SAFETY COORDINATION
 AERODROME SAFETY COORDINATION Julio Garriga, RO/TA International Civil Aviation Organization North American, Central American and Caribbean Office ICAO NACC Regional Office Page 1 Coordination of the aerodrome
Frequently Asked Questions
 CAA Funding Review Why has CAA s funding been reviewed? New Zealand has a well-regarded civil aviation system and a good aviation safety record. However, both the government and a range of reviews (including
INTERNAL AUDIT DIVISION REPORT 2017/051. Audit of the aviation safety programme in the African Union-United Nations Hybrid Operation in Darfur
 INTERNAL AUDIT DIVISION REPORT 2017/051 Audit of the aviation safety programme in the African Union-United Nations Hybrid Operation in Darfur There was a need to effectively address issues identified and
Rodrigues Regional Assembly Chief Commissioner s Office
 Ref: CCO/CAV/1/2013 Rodrigues Regional Assembly Invitation for Expressions of Interest Consultancy Services for the Design of Runway Extension & Ancillary Works at Sir Gaetan Duval Airport Plaine Corail,Rodrigues
PUBLIC ACCOUNTABILITY PRINCIPLES FOR CANADIAN AIRPORT AUTHORITIES
 PUBLIC ACCOUNTABILITY PRINCIPLES FOR CANADIAN AIRPORT AUTHORITIES The Canadian Airport Authority ( CAA ) shall be incorporated in a manner consistent with the following principles: 1. Not-for-profit Corporation
2015 VISITOR ARRIVALS SUMMARY
 2015 VISITOR ARRIVALS SUMMARY 1. Arrivals Summary: Despite some challenges, Papua New Guinea received over 198,685 international visitors in 2015, an increase of 4% or additional 7,000 arrivals compared
PULLMAN-MOSCOW REGIONAL AIRPORT Runway Realignment Project
 PULLMAN-MOSCOW REGIONAL AIRPORT Runway Realignment Project GENERAL AIRPORT INFORMATION AIRPORT USERS Airport ownership: Public, owned by the Pullman-Moscow Regional Airport Board Year opened: February
ENVIRONMENT ACTION PLAN
 ENVIRONMENT ACTION PLAN 2015 16 Airservices Australia 2015 This work is copyright. Apart from any use as permitted under the Copyright Act 1968, no part may be reproduced by any process without prior written
CLASS SPECIFICATION 5/12/11 SENIOR AIRPORT ENGINEER, CODE 7257
 Form PDES 8 THE CITY OF LOS ANGELES CIVIL SERVICE COMMISSION CLASS SPECIFICATION 5/12/11 SENIOR AIRPORT ENGINEER, CODE 7257 Summary of Duties: A Senior Airport Engineer performs the more difficult and
Presentation Title: Aerodromes Licensing Requirements
 Presentation Title: Aerodromes Licensing Requirements Presenter s name: Ms Mary-Ann Joubert Manager: Aerodrome Operations Date: 29 March 2017 Content Establishment of ICAO Chicago Convention Members Status
Whangarei Airport. Prepared by Carine Andries 10/20173
 Whangarei Airport Prepared by Carine Andries 10/20173 March 2010 TABLE OF CONTENTS 1 2 3 INTRODUCTION... 3 AIRPORT ROLE AND FUNCTION... 3 AIRPORT FEATURES AND CAPACITY... 3 3.1 3.2 3.3 3.4 3.5 3.5.1 3.5.2
ICAO Technical Cooperation Progress and Future Potential Program on Environmental Sustainable Air Transportation in Indonesia
 ICAO Technical Cooperation Progress and Future Potential Program on Environmental Sustainable Air Transportation in Indonesia 2013-2020 By Aviation and Climate Change Seminar, ICAO Headquarters, Montréal,
CHAPTER 1: INTRODUCTION
 CHAPTER 1: INTRODUCTION Purpose and Scope The information presented in this report represents the study findings for the 2016 Ronan Airport Master Plan prepared for the City of Ronan and Lake County, the
Appendix. Gatwick Airport Ltd - Further information on Gatwick s revised phasing strategy (including Programme) Gatwick Airport Limited
 Gatwick Airport Limited") Gatwick Airport Limited Response to Airports Commission Consultation Appendix 37 Gatwick Airport Ltd - Further information on Gatwick s revised phasing strategy (including Programme) Further information
Gatwick Airport Limited Response to Airports Commission Consultation Appendix 37 Gatwick Airport Ltd - Further information on Gatwick s revised phasing strategy (including Programme) Further information
Part 145. Aircraft Maintenance Organisations Certification. CAA Consolidation. 10 March Published by the Civil Aviation Authority of New Zealand
 Part 145 CAA Consolidation 10 March 2017 Aircraft Maintenance Organisations Certification Published by the Civil Aviation Authority of New Zealand DESCRIPTION Part 145 prescribes rules governing the certification
JOB DESCRIPTION FBO Manager
 JOB DESCRIPTION FBO Manager RESPONSIBLE TO: LOCATION: Managing Director London Biggin Hill Airport Ltd WHAT IS THE JOB LIKE? The role holder will have an oversight of operational issues and teams to ensure
REPORT 2014/111 INTERNAL AUDIT DIVISION. Audit of air operations in the United Nations Operation in Côte d Ivoire
 INTERNAL AUDIT DIVISION REPORT 2014/111 Audit of air operations in the United Nations Operation in Côte d Ivoire Overall results relating to the effective management of air operations in the United Nations
PART D SECTION 2 STAND ALLOCATION
 D-2-1 AIRPORT OPERATIONS MANUAL AIRFIELD OPERATIONS 7 March 2014 PART D SECTION 2 STAND ALLOCATION 1. Overview To optimize the overall utilization of aircraft parking facilities, aircraft stands for passenger
The private financing of airport infrastructure expansions
 The private financing of airport infrastructure expansions Economic and financial challenges Aviation Insight Series, Singapore Aviation Academy 15 July 2015 Greg Houston Partner, HoustonKemp Australia
Construction of Pyongyang International Airport IP6
 Construction of Pyongyang International Airport IP6 (Presented by GACA, DPR Korea) Summary The purpose of this paper is to update members regarding airport construction by outlining the successes and experiences
SUMMARY REPORT ON THE SAFETY OVERSIGHT AUDIT FOLLOW-UP OF THE DIRECTORATE GENERAL OF CIVIL AVIATION OF KUWAIT
 ICAO Universal Safety Oversight Audit Programme SUMMARY REPORT ON THE SAFETY OVERSIGHT AUDIT FOLLOW-UP OF THE DIRECTORATE GENERAL OF CIVIL AVIATION OF KUWAIT (Kuwait, 17 to 20 September 2003) International
The Strategic Commercial and Procurement Manager
 Item 3 To: Procurement Sub Committee On: 8 June 2016 Report by: The Strategic Commercial and Procurement Manager Heading: Renfrewshire Council s Community Benefit Strategy 2016 1. Summary 1.1. The purpose
Services Charter. 2014/15 to 2015/16
 Services Charter 2014/15 to 2015/16 Services Charter Overview Objective Airservices Australia is a governmentowned organisation providing safe and environmentally sound air traffic management, aviation
Final Report AIC PAPUA NEW GUINEA ACCIDENT INVESTIGATION COMMISSION ACCIDENT INVESTIGATION REPORT. Bayswater Road Ltd VH-ATO
 Final Report AIC 17-1003 PAPUA NEW GUINEA ACCIDENT INVESTIGATION COMMISSION ACCIDENT INVESTIGATION REPORT Bayswater Road Ltd VH-ATO Government Aircraft Factory (GAF) Nomad N22C Wheels-up landing Buka Aerodrome,
Safety Regulatory Oversight of Commercial Operations Conducted Offshore
 Page 1 of 15 Safety Regulatory Oversight of Commercial Operations Conducted Offshore 1. Purpose and Scope 2. Authority... 2 3. References... 2 4. Records... 2 5. Policy... 2 5.3 What are the regulatory
LOCATED AT THE GATEWAY OF THE TROPICAL PROVINCE, RIDING ON THE GROWTH MOMENTUM OF THE COUNTRY, WE ARE ON THE RIGHT TRACK OF TAKING OFF.
 LOCATED AT THE GATEWAY OF THE TROPICAL PROVINCE, RIDING ON THE GROWTH MOMENTUM OF THE COUNTRY, WE ARE ON THE RIGHT TRACK OF TAKING OFF. MANAGEMENT DISCUSSION INDUSTRY REVIEW Civil Aviation Industry in
Aerodrome Manual. ICAO/FAA Comprehensive Aerodrome Certification Inspector Workshop. Presented To: Caribbean States By: FAA Office of Airports
 ICAO/FAA Comprehensive Aerodrome Certification Inspector Workshop Presented To: Caribbean States By: FAA Office of Airports OBJECTIVE Development of an Aerodrome Manual (AM). 2 ICAO ANNEX 14 - SECTION
COMMISSION OF THE EUROPEAN COMMUNITIES. Draft. COMMISSION REGULATION (EU) No /2010
 No /2010") COMMISSION OF THE EUROPEAN COMMUNITIES Brussels, XXX Draft COMMISSION REGULATION (EU) No /2010 of [ ] on safety oversight in air traffic management and air navigation services (Text with EEA relevance)
COMMISSION OF THE EUROPEAN COMMUNITIES Brussels, XXX Draft COMMISSION REGULATION (EU) No /2010 of [ ] on safety oversight in air traffic management and air navigation services (Text with EEA relevance)
REAUTHORISATION OF THE ALLIANCE BETWEEN AIR NEW ZEALAND AND CATHAY PACIFIC
 Chair Cabinet Economic Growth and Infrastructure Committee Office of the Minister of Transport REAUTHORISATION OF THE ALLIANCE BETWEEN AIR NEW ZEALAND AND CATHAY PACIFIC Proposal 1. I propose that the
ACTION PLAN FOR THE PERIOD concerning the STRATEGY ON IMPLEMENTATION OF THE FRAMEWORK AGREEMENT ON THE SAVA RIVER BASIN
 Doc. 1S-26-O-11-5/1-2 ACTION PLAN FOR THE PERIOD 2011-2015 concerning the STRATEGY ON IMPLEMENTATION OF THE FRAMEWORK AGREEMENT ON THE SAVA RIVER BASIN April 2011 Table of Contents INTRODUCTION... 5 1.
Ex-Ante Evaluation (for Japanese ODA Loan)
") Japanese ODA Loan 1. Name of the Project Ex-Ante Evaluation (for Japanese ODA Loan) Country: The Republic of Peru Project: Amazonas Rural Development Project Loan Agreement: January 9, 213 Loan Amount:
Japanese ODA Loan 1. Name of the Project Ex-Ante Evaluation (for Japanese ODA Loan) Country: The Republic of Peru Project: Amazonas Rural Development Project Loan Agreement: January 9, 213 Loan Amount:
International Civil Aviation Organization HIGH-LEVEL CONFERENCE ON AVIATION SECURITY (HLCAS) Montréal, 12 to 14 September 2012
 Montréal, 12 to 14 September 2012") International Civil Aviation Organization HLCAS-IP/17 2/9/12 INFORMATION PAPER HIGH-LEVEL CONFERENCE ON AVIATION SECURITY (HLCAS) Montréal, 12 to 14 September 2012 Agenda Item 9: Any other business PACIFIC
International Civil Aviation Organization HLCAS-IP/17 2/9/12 INFORMATION PAPER HIGH-LEVEL CONFERENCE ON AVIATION SECURITY (HLCAS) Montréal, 12 to 14 September 2012 Agenda Item 9: Any other business PACIFIC
JOSLIN FIELD, MAGIC VALLEY REGIONAL AIRPORT DECEMBER 2012
 1. Introduction The Federal Aviation Administration (FAA) recommends that airport master plans be updated every 5 years or as necessary to keep them current. The Master Plan for Joslin Field, Magic Valley
FACILITATION PANEL (FALP)
") International Civil Aviation Organization WORKING PAPER FALP/10-WP/19 Revised 29/8/18 FACILITATION PANEL (FALP) TENTH MEETING Montréal, 10-13 September 2018 Agenda Item 6: Other matters FACILITATION FOR
International Civil Aviation Organization WORKING PAPER FALP/10-WP/19 Revised 29/8/18 FACILITATION PANEL (FALP) TENTH MEETING Montréal, 10-13 September 2018 Agenda Item 6: Other matters FACILITATION FOR
The results of the National Tourism Development Strategy Assessments
 The results of the National Tourism Development Strategy Assessments - 2012 (I) The assessment tool In 2012 the Sustainable Tourism Working Group of the CEEweb for Biodiversity prepared a guidance for
CIVIL AVIATION AUTHORITY
 CIVIL AVIATION AUTHORITY INFRASTUCTRE DEVELOPMENT: BOTTLENECKS AND SOLUTIONS IN AVIATION SECTOR by the Presentation to the ICPAU 5 th Economic Director Finance, Civil Aviation Authority, U 20 July Overview
PROJECT INFORMATION DOCUMENT (PID) CONCEPT STAGE Report No.: AB4960 Project Name. MIDDLE EAST AND NORTH AFRICA Sector Aviation (100%) Project ID
 CONCEPT STAGE Report No.: AB4960 Project Name. MIDDLE EAST AND NORTH AFRICA Sector Aviation (100%) Project ID") Public Disclosure Authorized Public Disclosure Authorized Public Disclosure Authorized Public Disclosure Authorized PROJECT INFORMATION DOCUMENT (PID) CONCEPT STAGE Report No.: AB4960 Project Name EG-Second
Public Disclosure Authorized Public Disclosure Authorized Public Disclosure Authorized Public Disclosure Authorized PROJECT INFORMATION DOCUMENT (PID) CONCEPT STAGE Report No.: AB4960 Project Name EG-Second
Table of Contents. Master Plan March 2014 TOC i Spokane International Airport
 Table of Contents Page Chapter 1 Inventory 1. Introduction... 1 1 1.1 Community Profile... 1 2 1.1.1 Location and Setting... 1 1 1.1.2 Climate... 1 2 1.1.3 Socioeconomic Conditions... 1 5 1.1.4 Area Land
Merritt Island Airport
 TABLE OF CONTENTS CHAPTER 1 INTRODUCTION... 1-1 INTRODUCTION AND PROJECT OVERVIEW... 1-1 General Guidelines... 1-1 Prior Planning Documentation... 1-2 Key Issues... 1-2 Goals and Objectives... 1-2 Regulatory
Port of Friday Harbor
 REQUEST FOR STATEMENTS OF QUALIFICATIONS (RFQ) TO PROVIDE ENGINEERING / CONSULTANT SERVICES AT FRIDAY HARBOR AIRPORT Dated: February 15, 2018 Pursuant to RCW, Chapter 39.80 and FAA AC 150/5100-14E, the
Westover Metropolitan Airport Master Plan Update
 Westover Metropolitan Airport Master Plan Update June 2008 INTRODUCTION Westover Metropolitan Airport (CEF) comprises the civilian portion of a joint-use facility located in Chicopee, Massachusetts. The
P U B L I C N O T I C E. MBS International Airport Freeland, Michigan Passenger Facility Charge (PFC) Application C-00-MBS
 Application C-00-MBS") P U B L I C N O T I C E MBS International Airport Freeland, Michigan Passenger Facility Charge (PFC) Application 10-07-C-00-MBS INTRODUCTION: This Public Notice is issued as part of a Federal Aviation
P U B L I C N O T I C E MBS International Airport Freeland, Michigan Passenger Facility Charge (PFC) Application 10-07-C-00-MBS INTRODUCTION: This Public Notice is issued as part of a Federal Aviation
(i) Adopted or adapted airworthiness and environmental standards;
 Adopted or adapted airworthiness and environmental standards;") TECHNICAL ARRANGEMENT FOR THE ACCEPTANCE OF AIRWORTHINESS AND ENVIRONMENTAL APPROVAL OF CIVIL AERONAUTICAL PRODUCTS BETWEEN THE CIVIL AVIATION BUREAU, MINISTRY OF LAND, INFRASTRUCTURE AND TRANSPORT, JAPAN
TECHNICAL ARRANGEMENT FOR THE ACCEPTANCE OF AIRWORTHINESS AND ENVIRONMENTAL APPROVAL OF CIVIL AERONAUTICAL PRODUCTS BETWEEN THE CIVIL AVIATION BUREAU, MINISTRY OF LAND, INFRASTRUCTURE AND TRANSPORT, JAPAN
ICAO Aerodrome s Manual. AERODROME S INSPECTOR WORKSHOP St. Maarten, MAHO June 2012
 ICAO Aerodrome s Manual AERODROME S INSPECTOR WORKSHOP St. Maarten, MAHO 11-15 June 2012 Objectives - Identify the requirements listed in Annex 14 regarding the development and maintenance of an aerodrome
COMMISSION REGULATION (EU) No 255/2010 of 25 March 2010 laying down common rules on air traffic flow management
 No 255/2010 of 25 March 2010 laying down common rules on air traffic flow management") L 80/10 Official Journal of the European Union 26.3.2010 COMMISSION REGULATION (EU) No 255/2010 of 25 March 2010 laying down common rules on air traffic flow management (Text with EEA relevance) THE EUROPEAN
L 80/10 Official Journal of the European Union 26.3.2010 COMMISSION REGULATION (EU) No 255/2010 of 25 March 2010 laying down common rules on air traffic flow management (Text with EEA relevance) THE EUROPEAN
Runway Length Analysis Prescott Municipal Airport
 APPENDIX 2 Runway Length Analysis Prescott Municipal Airport May 11, 2009 Version 2 (draft) Table of Contents Introduction... 1-1 Section 1 Purpose & Need... 1-2 Section 2 Design Standards...1-3 Section
Route Support Cork Airport Route Support Scheme ( RSS ) Short-Haul Operations Valid from 1st January Introduction
 Short-Haul Operations Valid from 1st January Introduction") Route Support Cork Airport Route Support Scheme ( RSS ) Short-Haul Operations Valid from 1st January 2016 1. Introduction Cork Airport is committed to encouraging airlines to operate new routes to/from
Route Support Cork Airport Route Support Scheme ( RSS ) Short-Haul Operations Valid from 1st January 2016 1. Introduction Cork Airport is committed to encouraging airlines to operate new routes to/from
COMMISSION IMPLEMENTING REGULATION (EU)
") 18.10.2011 Official Journal of the European Union L 271/15 COMMISSION IMPLEMENTING REGULATION (EU) No 1034/2011 of 17 October 2011 on safety oversight in air traffic management and air navigation services
18.10.2011 Official Journal of the European Union L 271/15 COMMISSION IMPLEMENTING REGULATION (EU) No 1034/2011 of 17 October 2011 on safety oversight in air traffic management and air navigation services
ERIE INTERNATIONAL AIRPORT MASTER PLAN TABLE OF CONTENTS
 EXECUTIVE SUMMARY ERIE INTERNATIONAL AIRPORT MASTER PLAN TABLE OF CONTENTS PAGE NO. CHAPTER 1-INTRODUCTION... 1-1 1.01 General...1-1 1.02 Purpose and Scope of Study...1-1 1.03 The Planning Process...1-2
DETAILS AND PRINCIPLES REGARDING PROPOSED REVISED SERVICE CHARGES OCTOBER 1, 2000
 DETAILS AND PRINCIPLES REGARDING PROPOSED REVISED SERVICE CHARGES OCTOBER 1, 2000 GENERAL This document ( Details and Principles ) provides additional detail to expand upon the Notice of Revised Service
East Midlands Airport 2018 Aerodrome Manual
 East Midlands Airport 2018 Aerodrome Manual Version 1.0 Not Valid after 31 st December 2018 Department Operations Document Owner Operations Director (Accountable Manager) Document Administrator Ops Development
Ronan Delaney. DELANEY_RONAN_AVIATION_JUN_2018.DOCX
 Ronan Delaney Profession Structural Engineer Current Position Associate Principal Global Aviation Skills Leader Joined Arup 1988 Years of Experience 25+ Nationality Irish Qualifications Bsc (Eng), Dip
Concrete Visions for a Multi-Level Governance, 7-8 December Paper for the Workshop Local Governance in a Global Era In Search of
 Paper for the Workshop Local Governance in a Global Era In Search of Concrete Visions for a Multi-Level Governance, 7-8 December 2001 None of these papers should be cited without the author s permission.
Cooperative Development of Operational Safety & Continuing Airworthiness Programme. 25th COSCAP SA STEERING COMMITTEE MEETING
 COSCAP South Asia Cooperative Development of Operational Safety & Continuing Airworthiness Programme 25th COSCAP SA STEERING COMMITTEE MEETING Bangladesh Initiative on the Strategic Objectives of ICAO
PROJECT INFORMATION DOCUMENT (PID) CONCEPT STAGE Report No.: AB6195. Tonga Aviation Infrastructure Investment Project Region
 CONCEPT STAGE Report No.: AB6195. Tonga Aviation Infrastructure Investment Project Region") PROJECT INFORMATION DOCUMENT (PID) CONCEPT STAGE Report No.: AB6195 (The report # is automatically generated by IDU and should not be changed) Project Name Tonga Aviation Infrastructure Investment Project
PROJECT INFORMATION DOCUMENT (PID) CONCEPT STAGE Report No.: AB6195 (The report # is automatically generated by IDU and should not be changed) Project Name Tonga Aviation Infrastructure Investment Project
GHANA S ACTION PLAN ON CO 2 EMISSIONS REDUCTION ACTIVITIES
 GHANA S ACTION PLAN ON CO 2 EMISSIONS REDUCTION ACTIVITIES SECTION 1 - CONTACT AND BACKGROUND INFORMATION 1.1 Contact Information Name of the Authority : Ghana Civil Aviation Authority Point of Contact